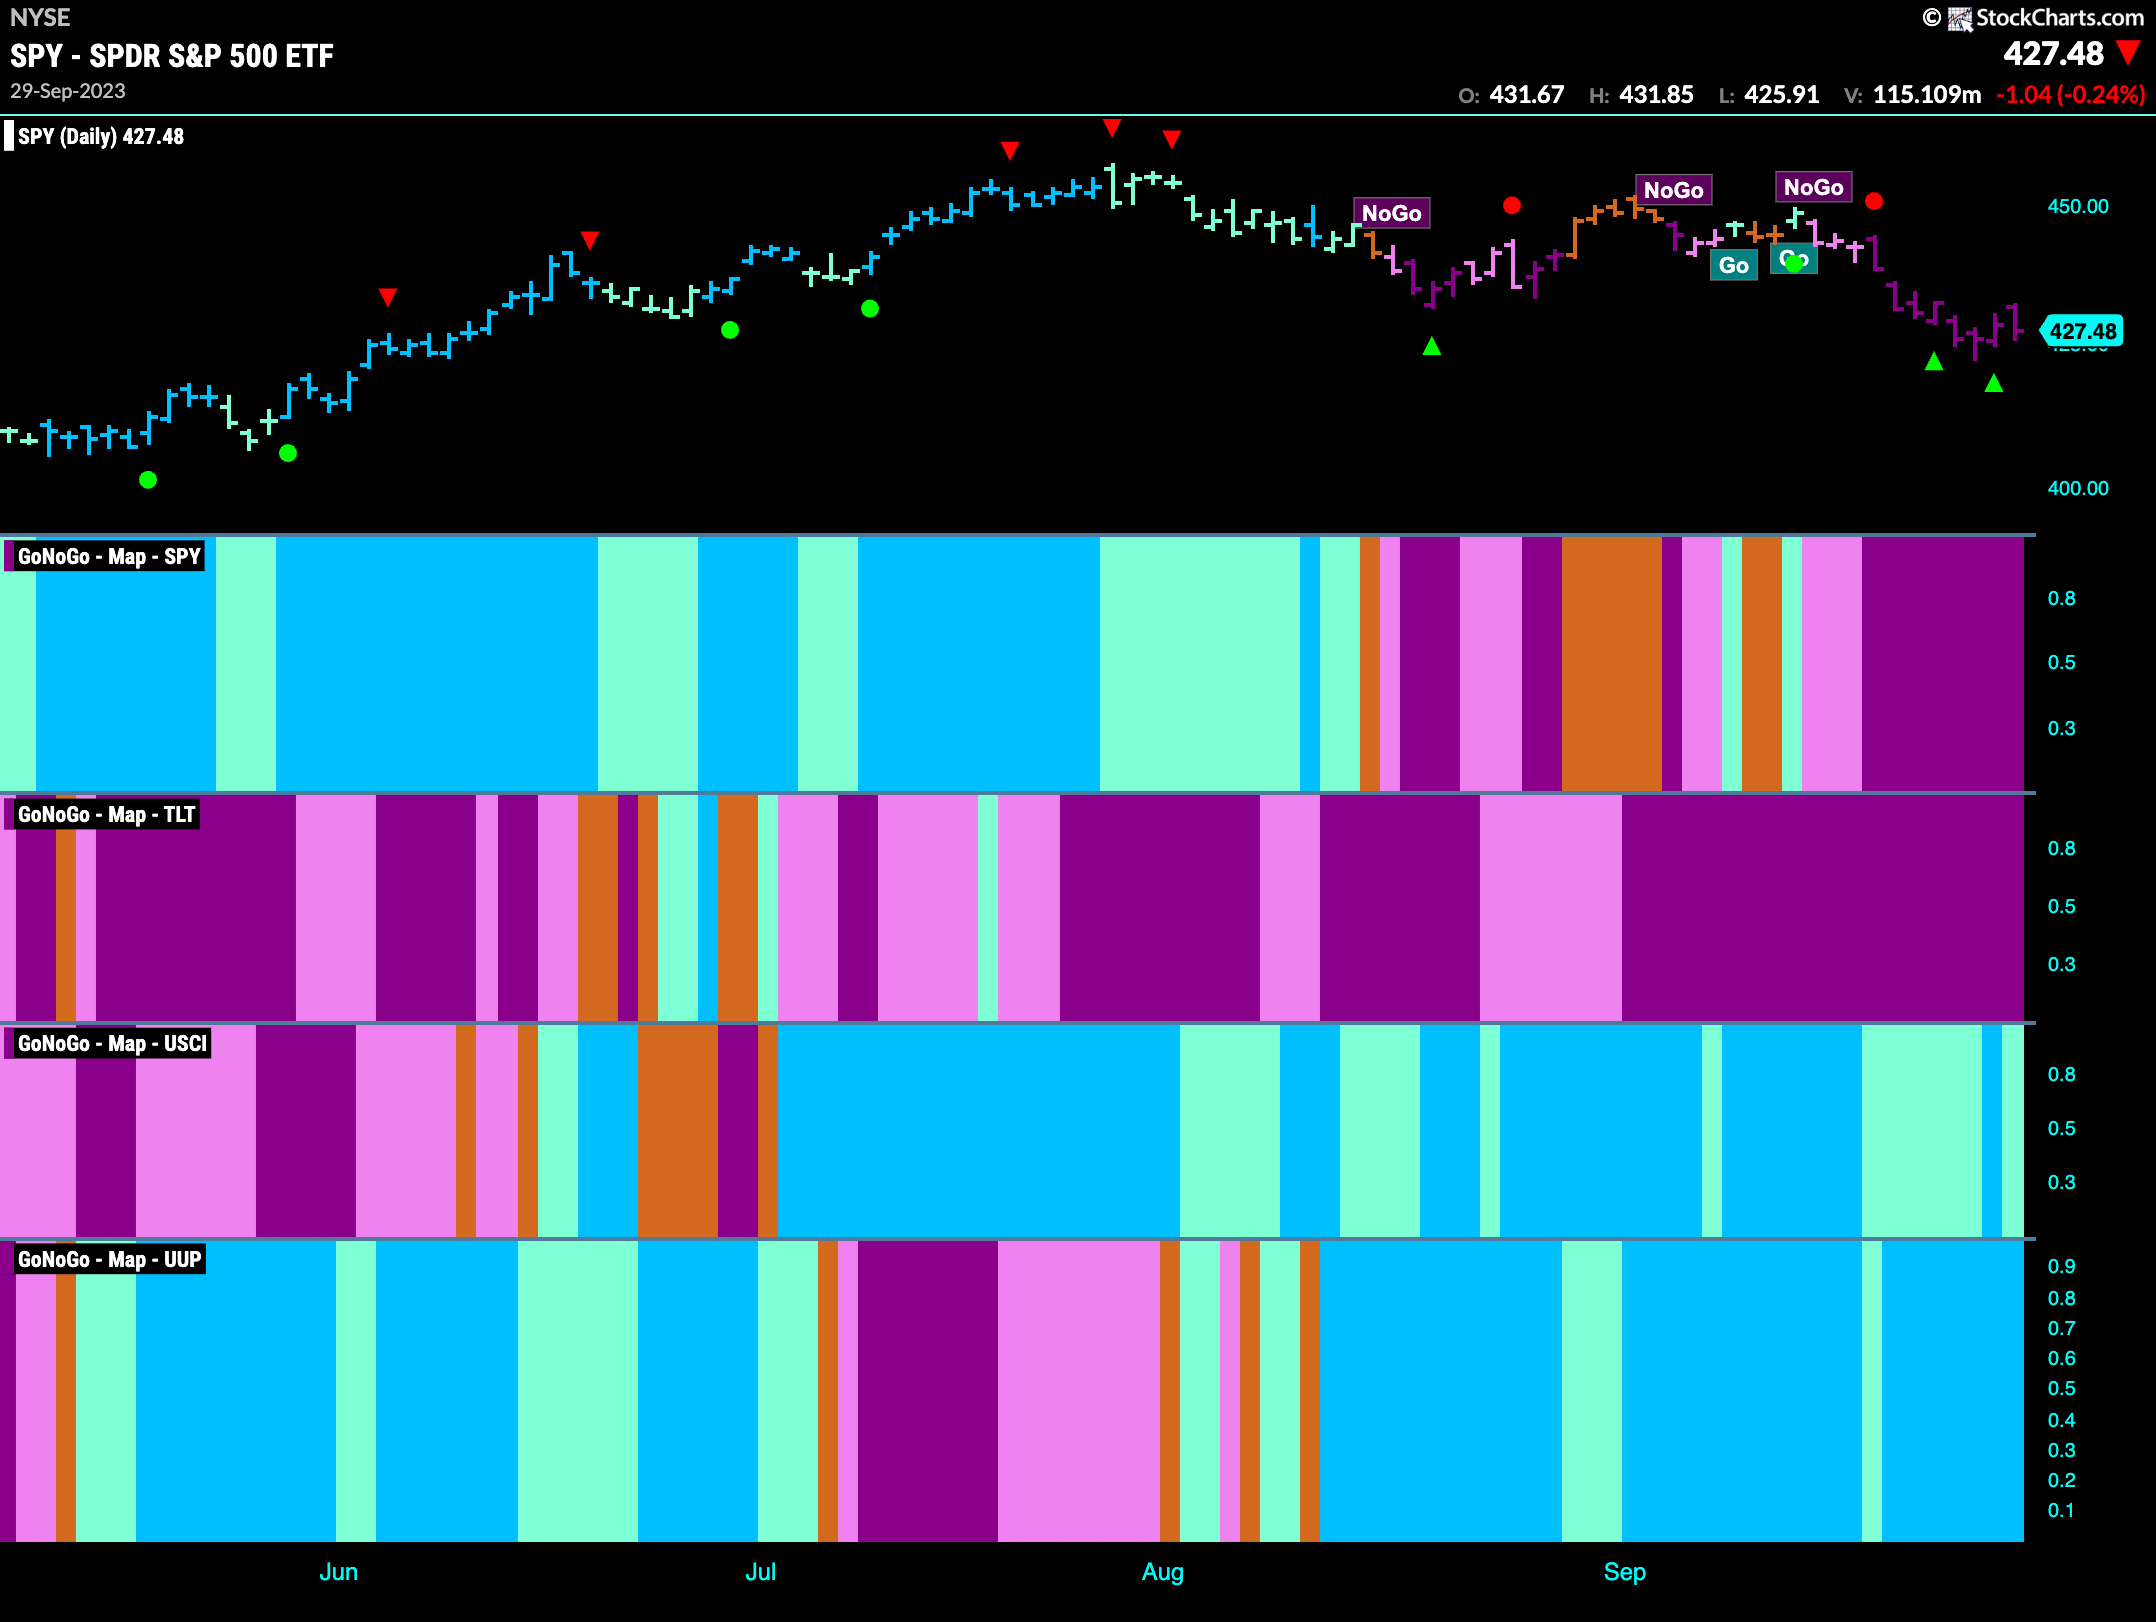
Good morning and welcome to this week’s Flight Path. The “NoGo” continued this past week as we saw a string of uninterrupted strong purple bars in U.S. equities and price fell to a new lower low. The “NoGo” remained strong in treasury bond prices as well. Commodities have experienced a little weakness in the “Go” trend this week as we saw mostly aqua bars while the dollar’s strong “Go” persists.
U.S. Equities Make New Low
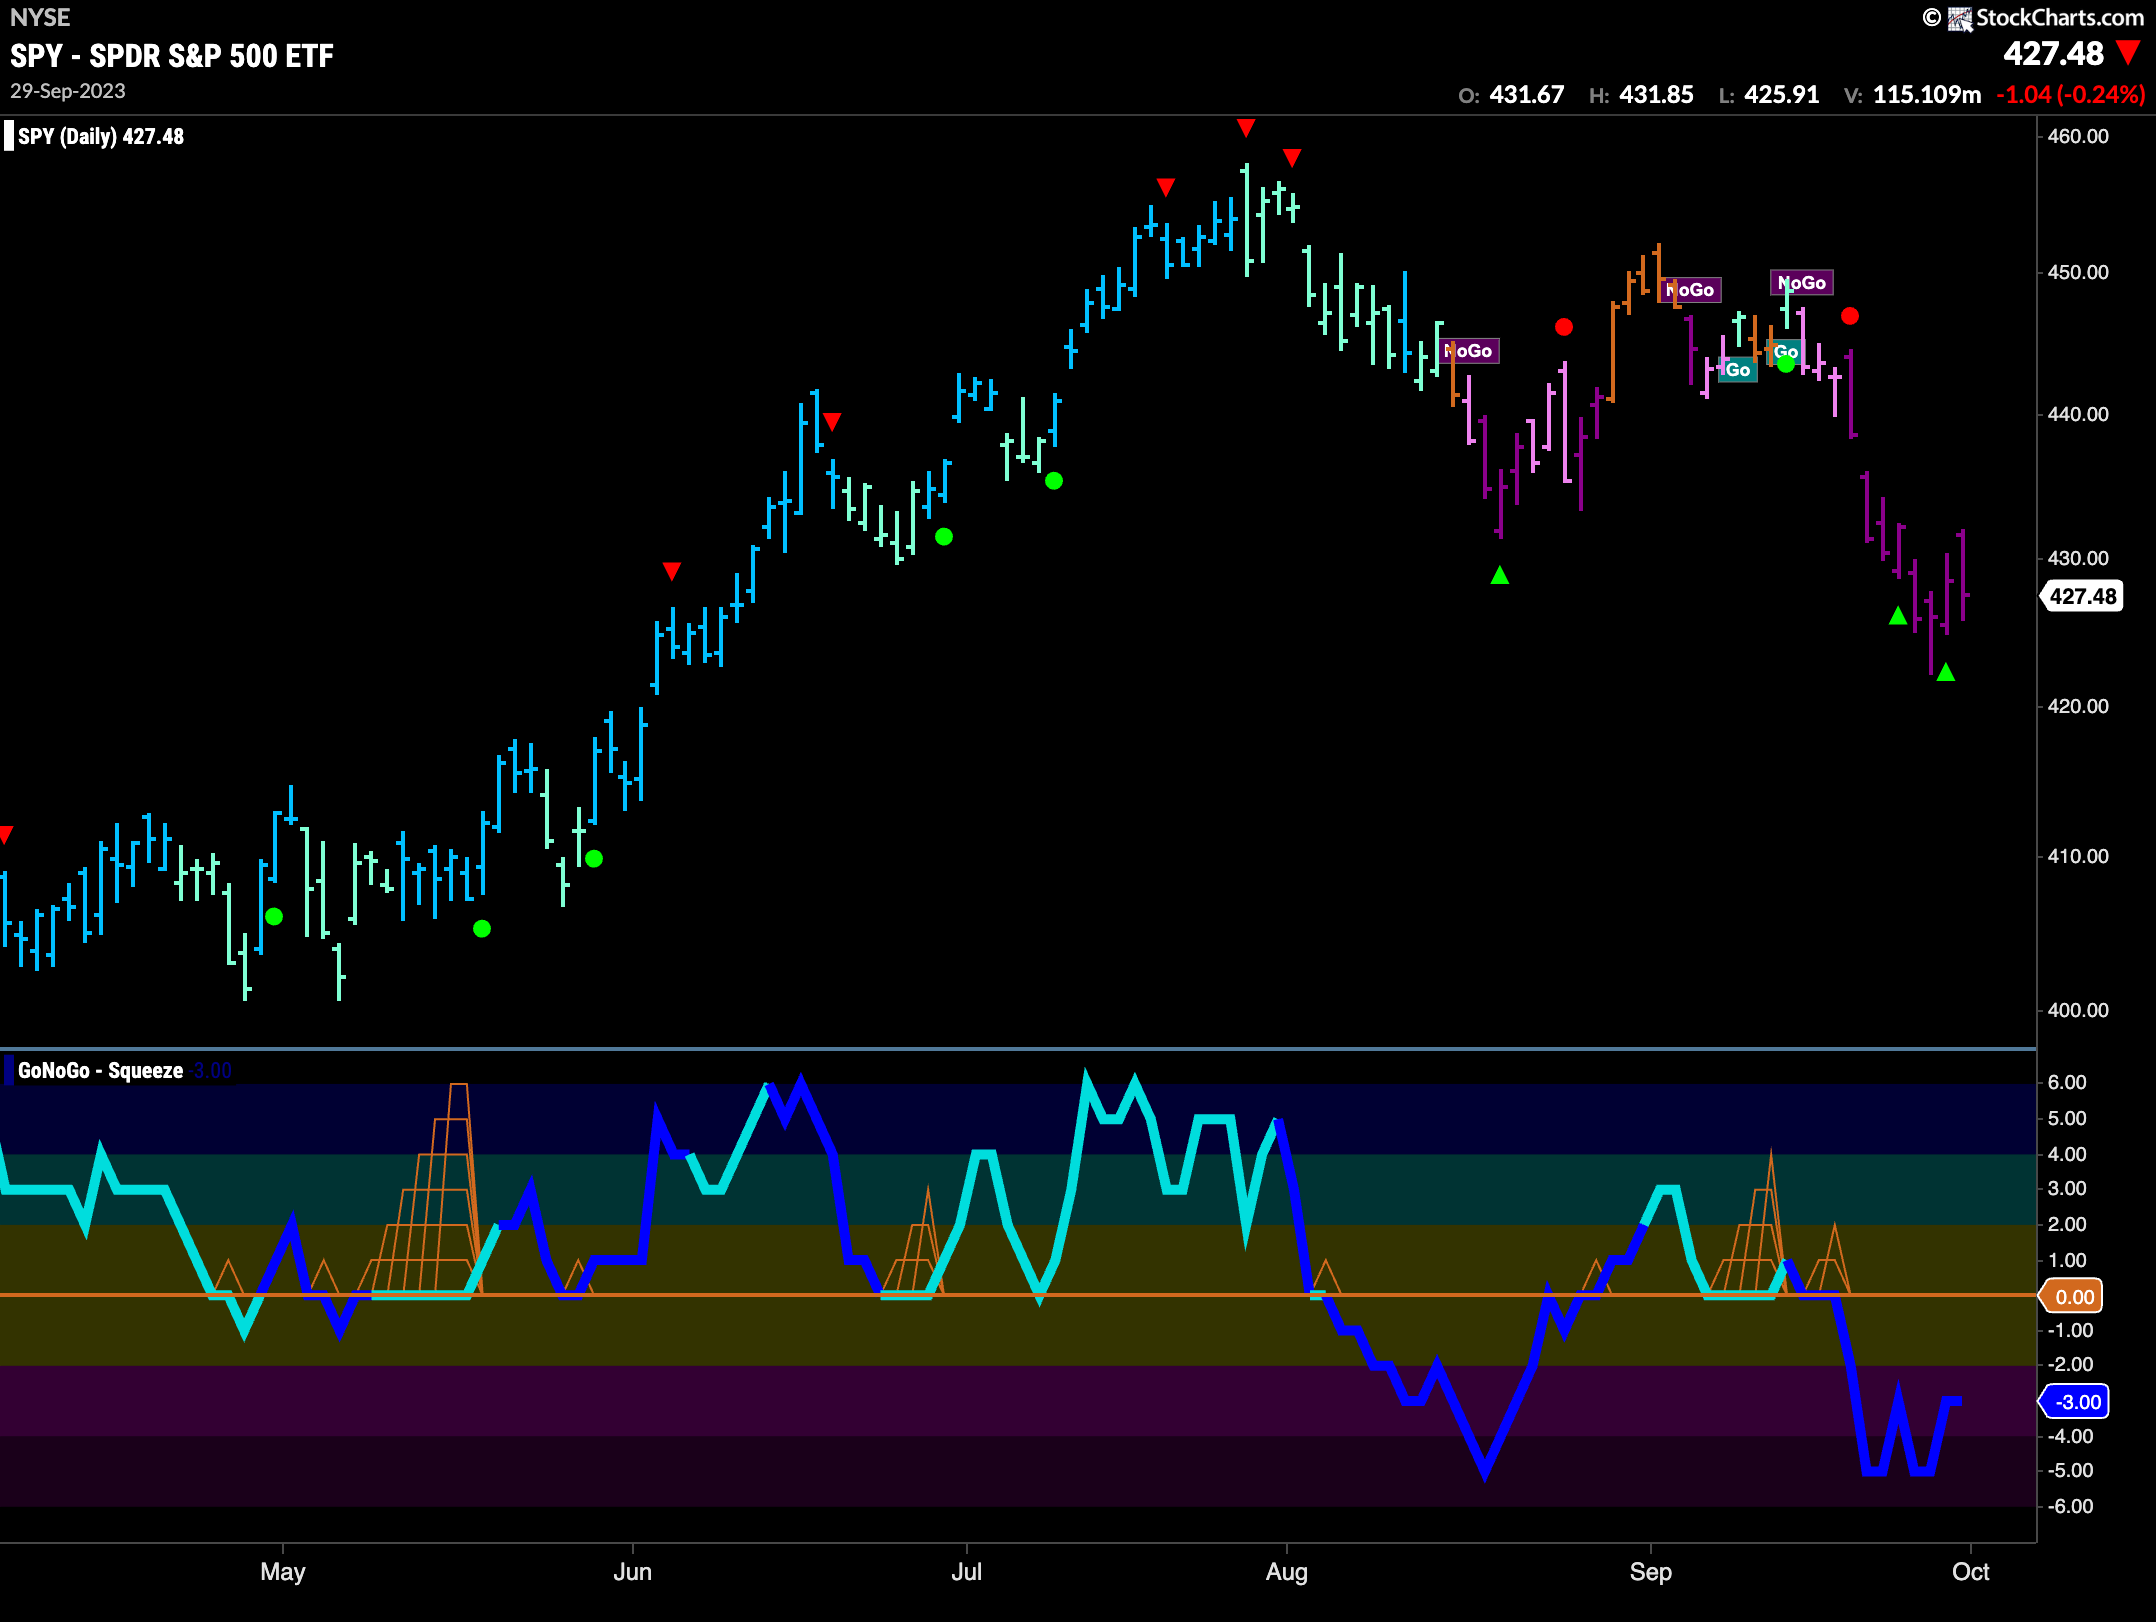
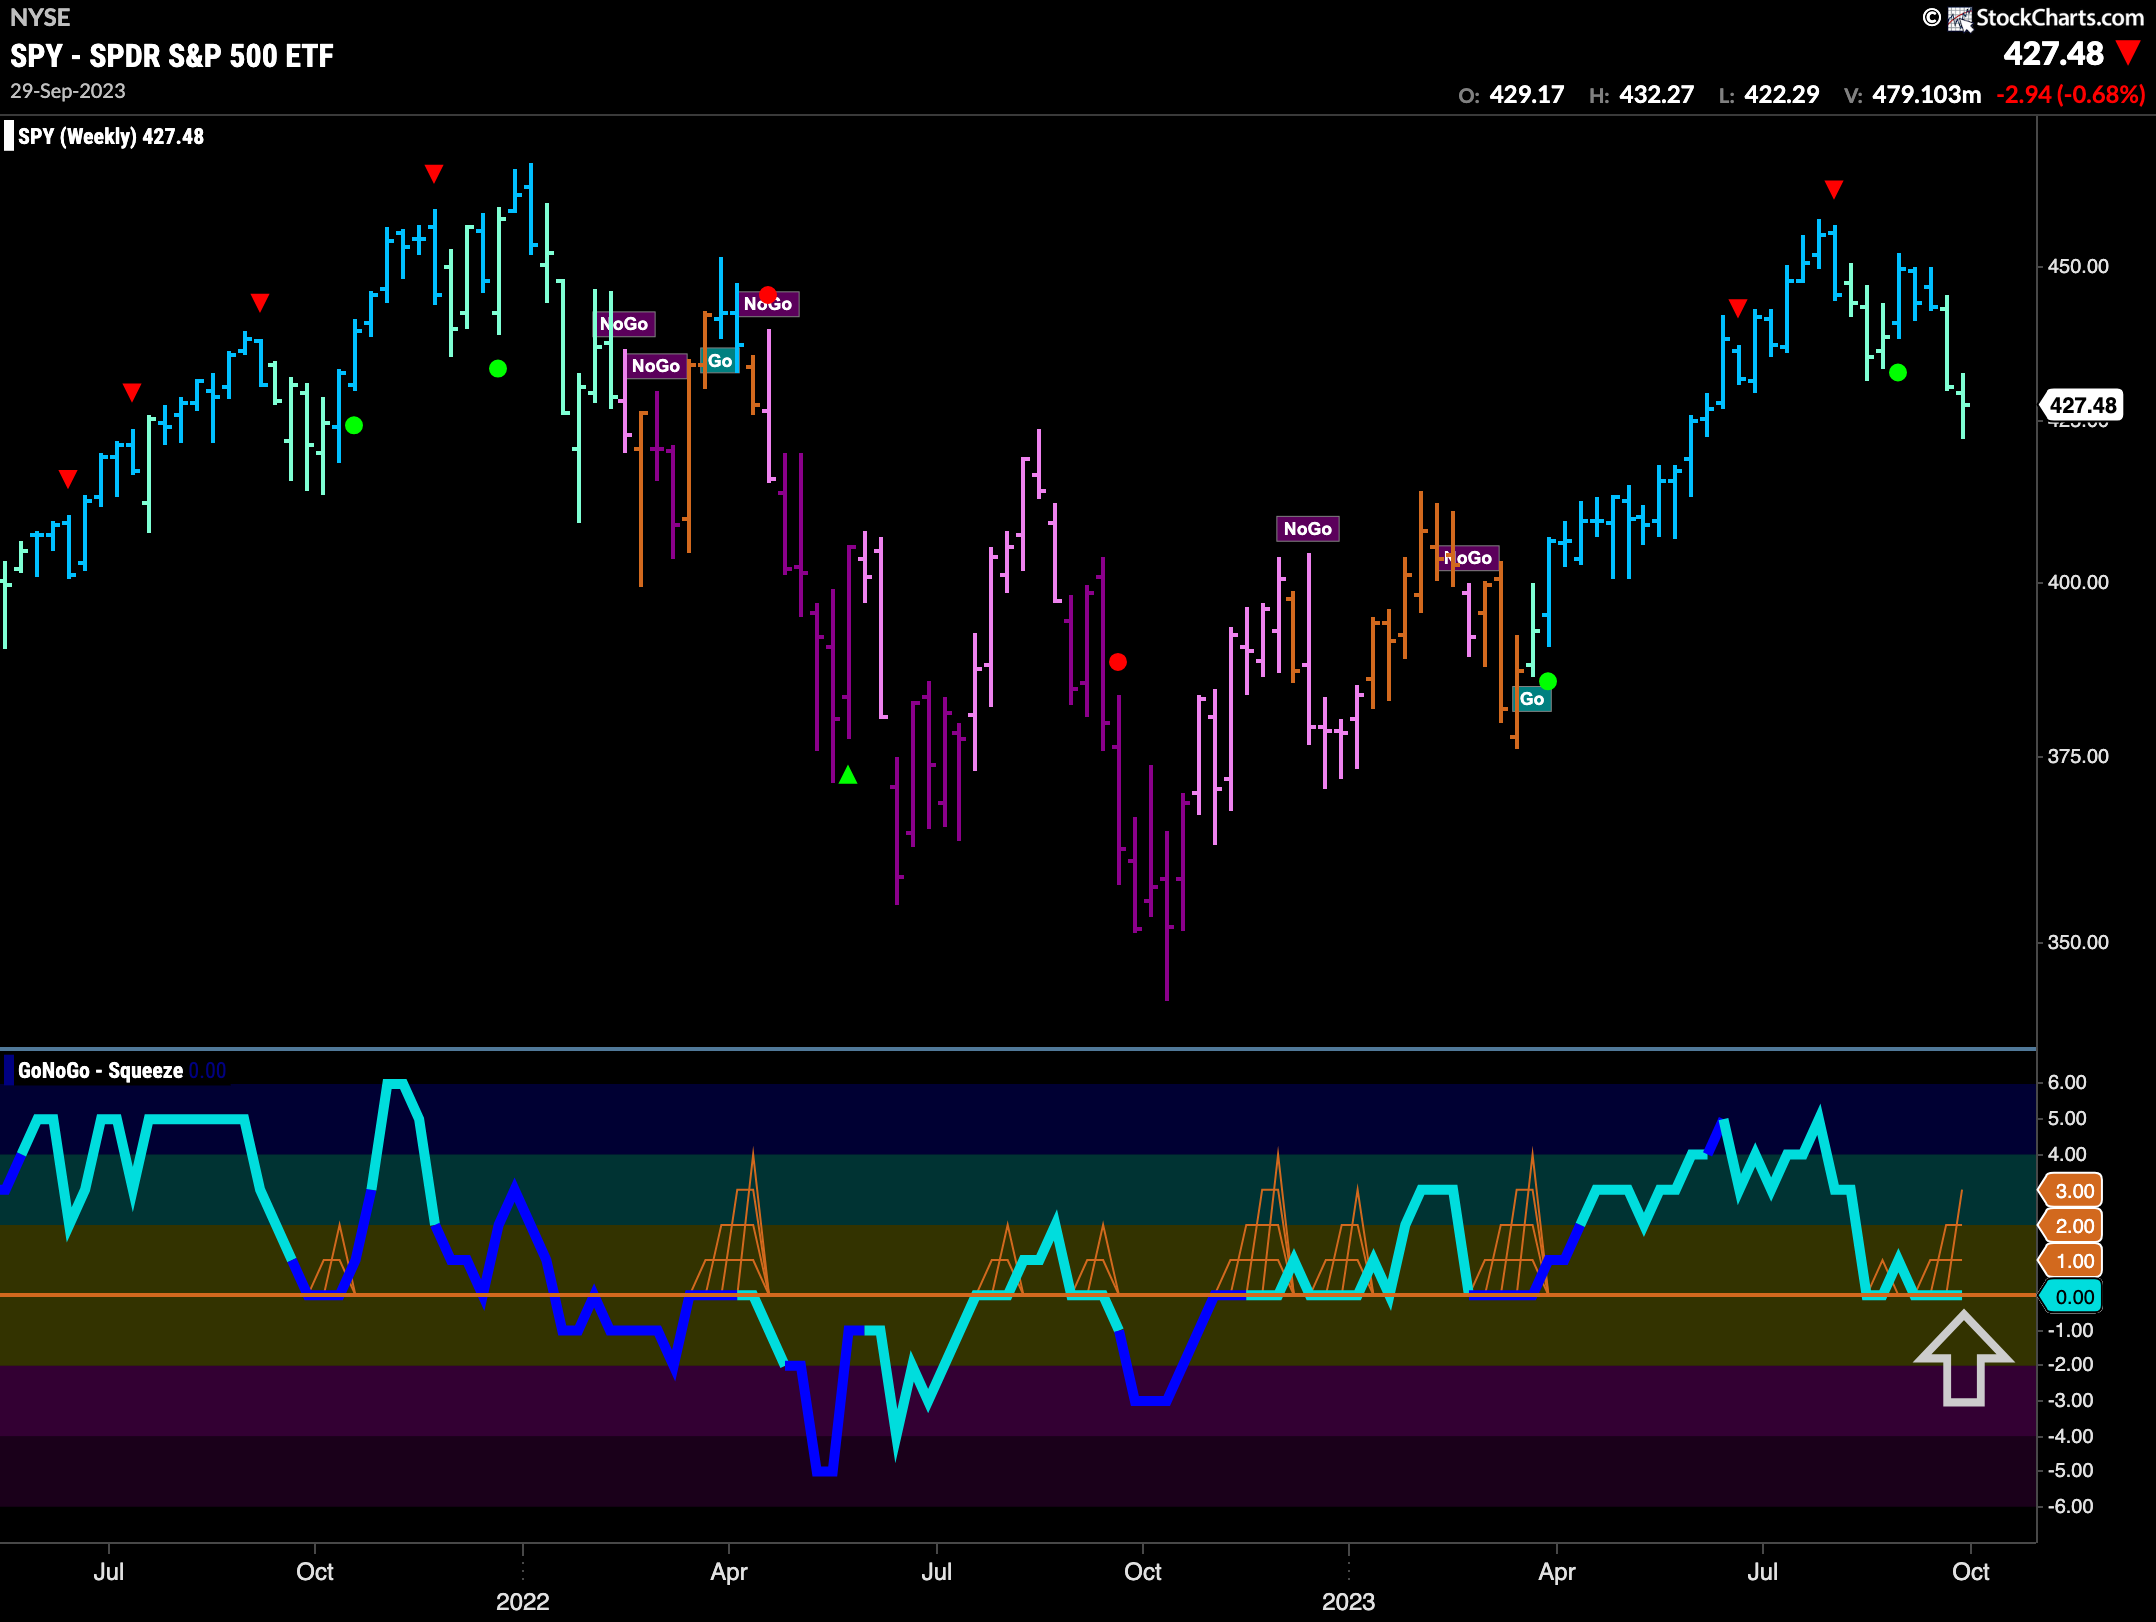
GoNoGo Trend painted nothing but strong purple “NoGo” bars as price fell lower mid week. After trying to rally on Friday price dropped into the close. GoNoGo Oscillator is in negative territory but no longer oversold and volume is heavy, showing strong market participation.
The longer term weekly chart shows that this is an important moment. With a “Go” trend still in place but painting weaker aqua bars, we see that GoNoGo Oscillator is testing the zero line from above where we will watch to see if it can find support. The beginnings of a GoNoGo Squeeze is building as the bulls and bears battle it out. If the oscillator fails to hold the zero line, that could be a sign of more destructive price action to come.
Treasury Rates Continue Higher
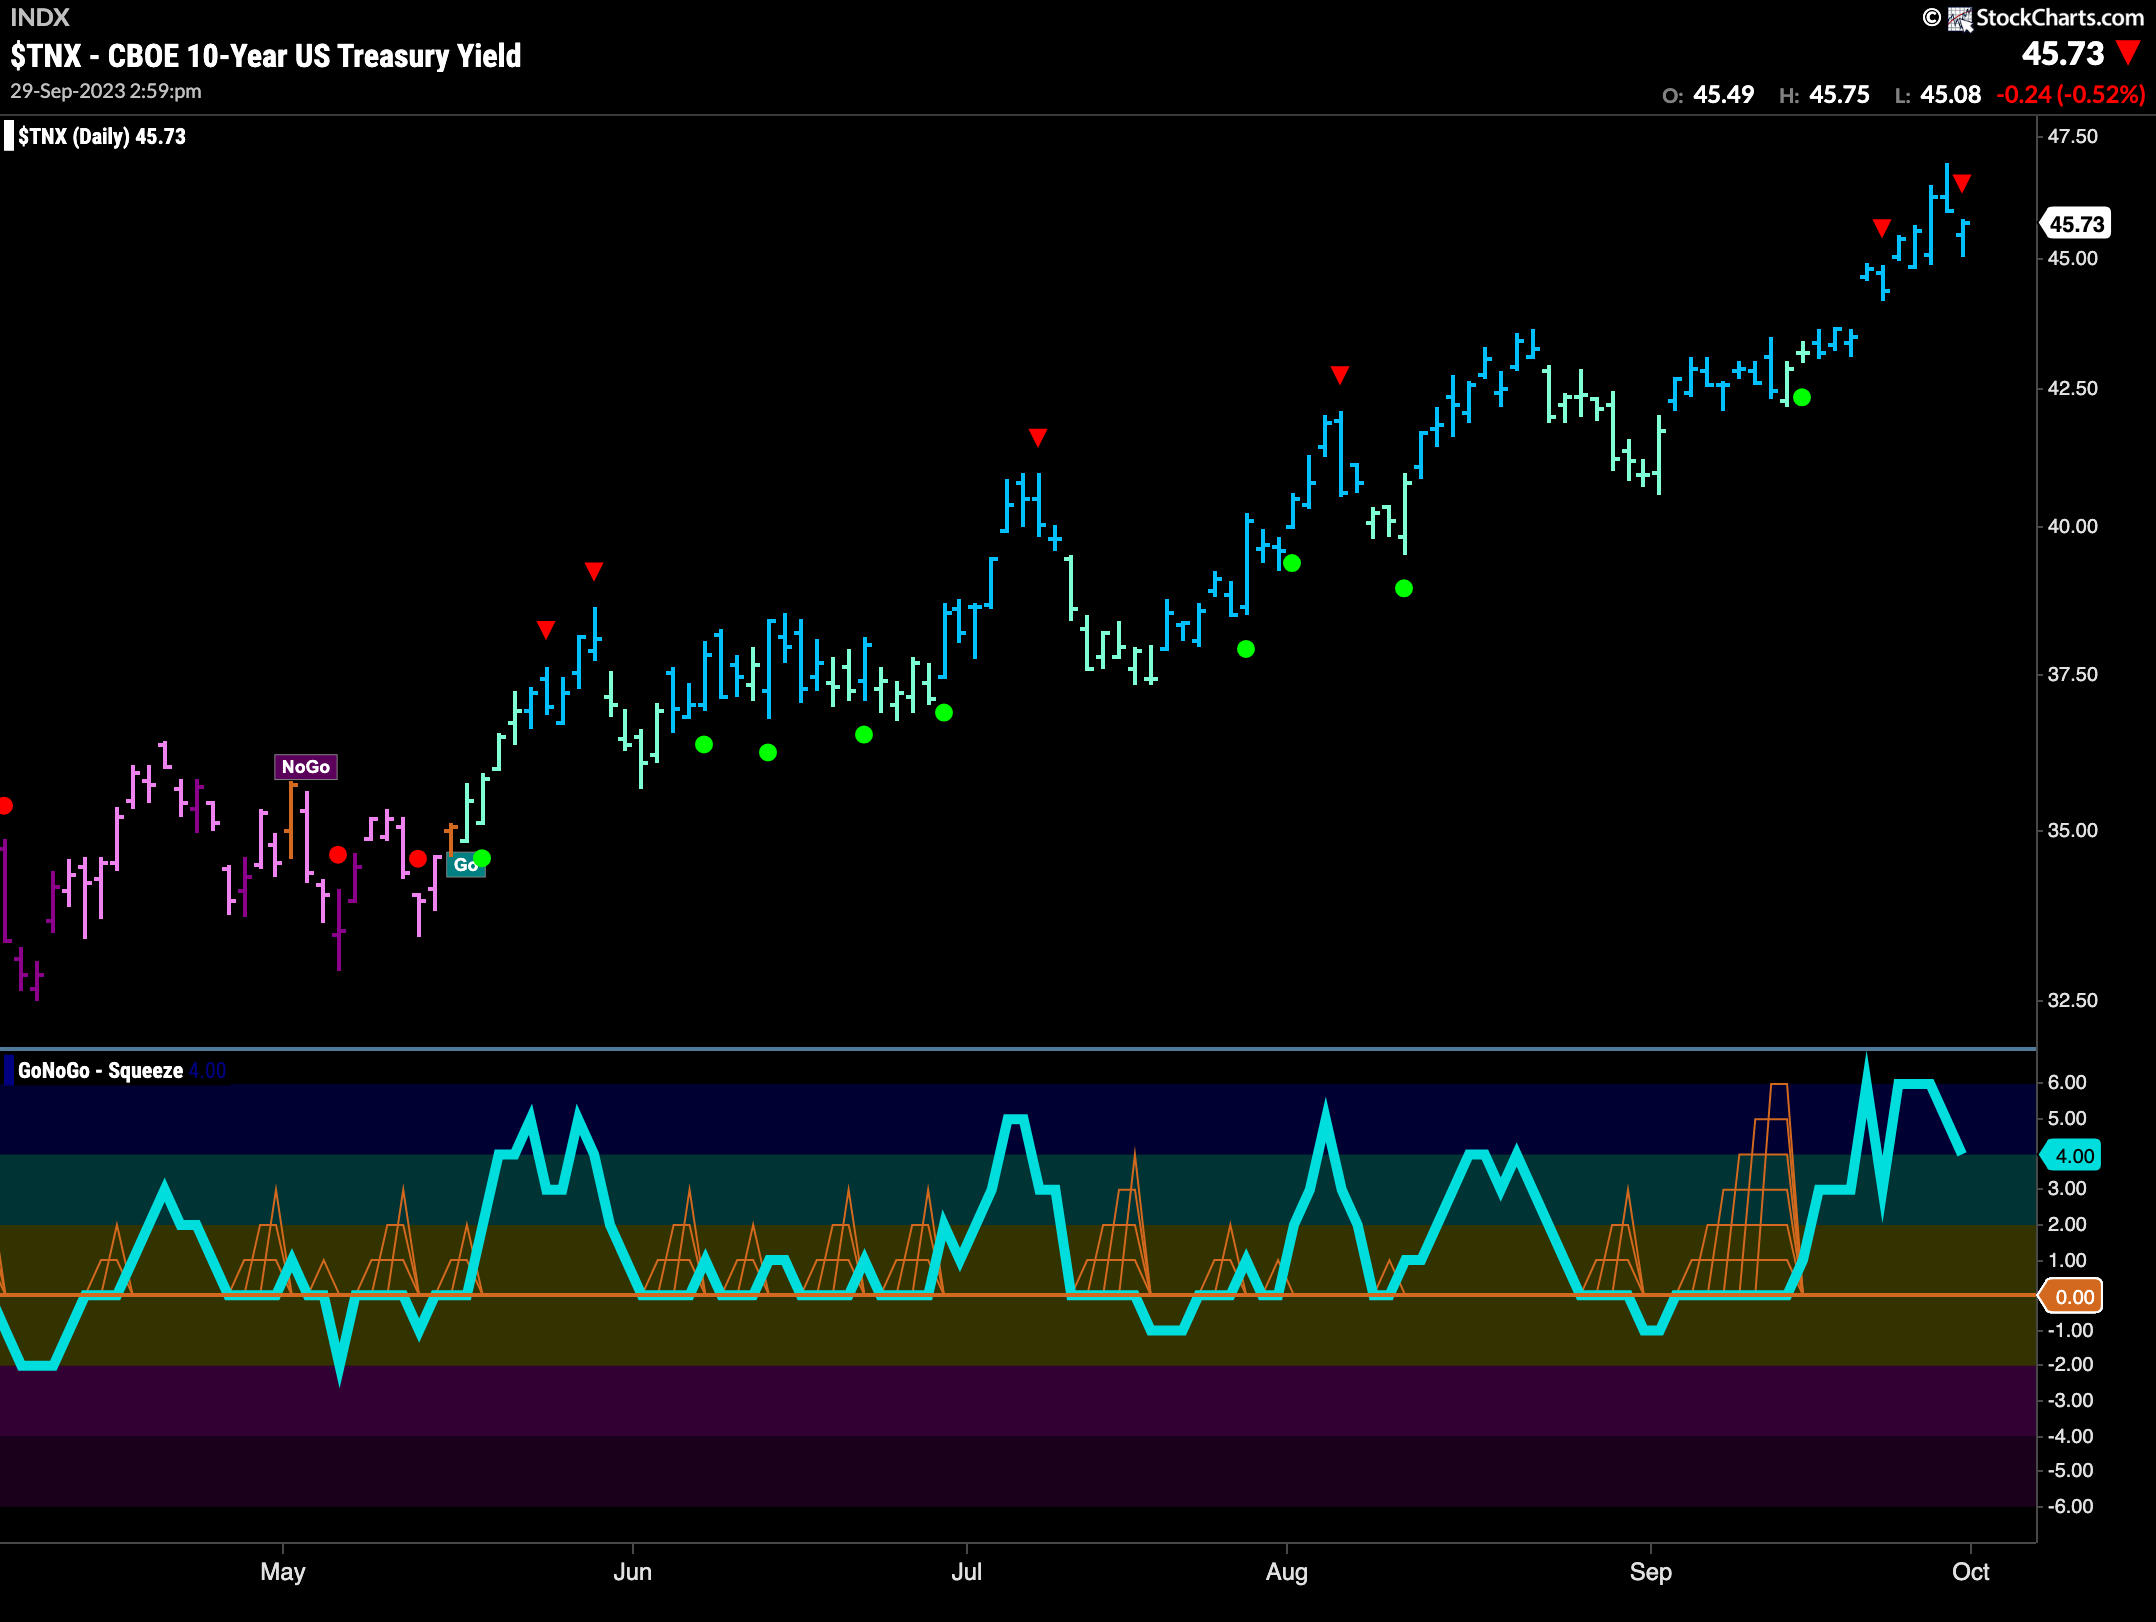
Treasury rates hit another higher high this week as GoNoGo Trend painted a string of strong blue “Go” bars. GoNoGo Oscillator has fallen from overbought territory and that has triggered another Go Countertrend Correction Icon (red arrow) which indicates price may struggle to go higher in the short term. Perhaps a slight pause in the trend for now.
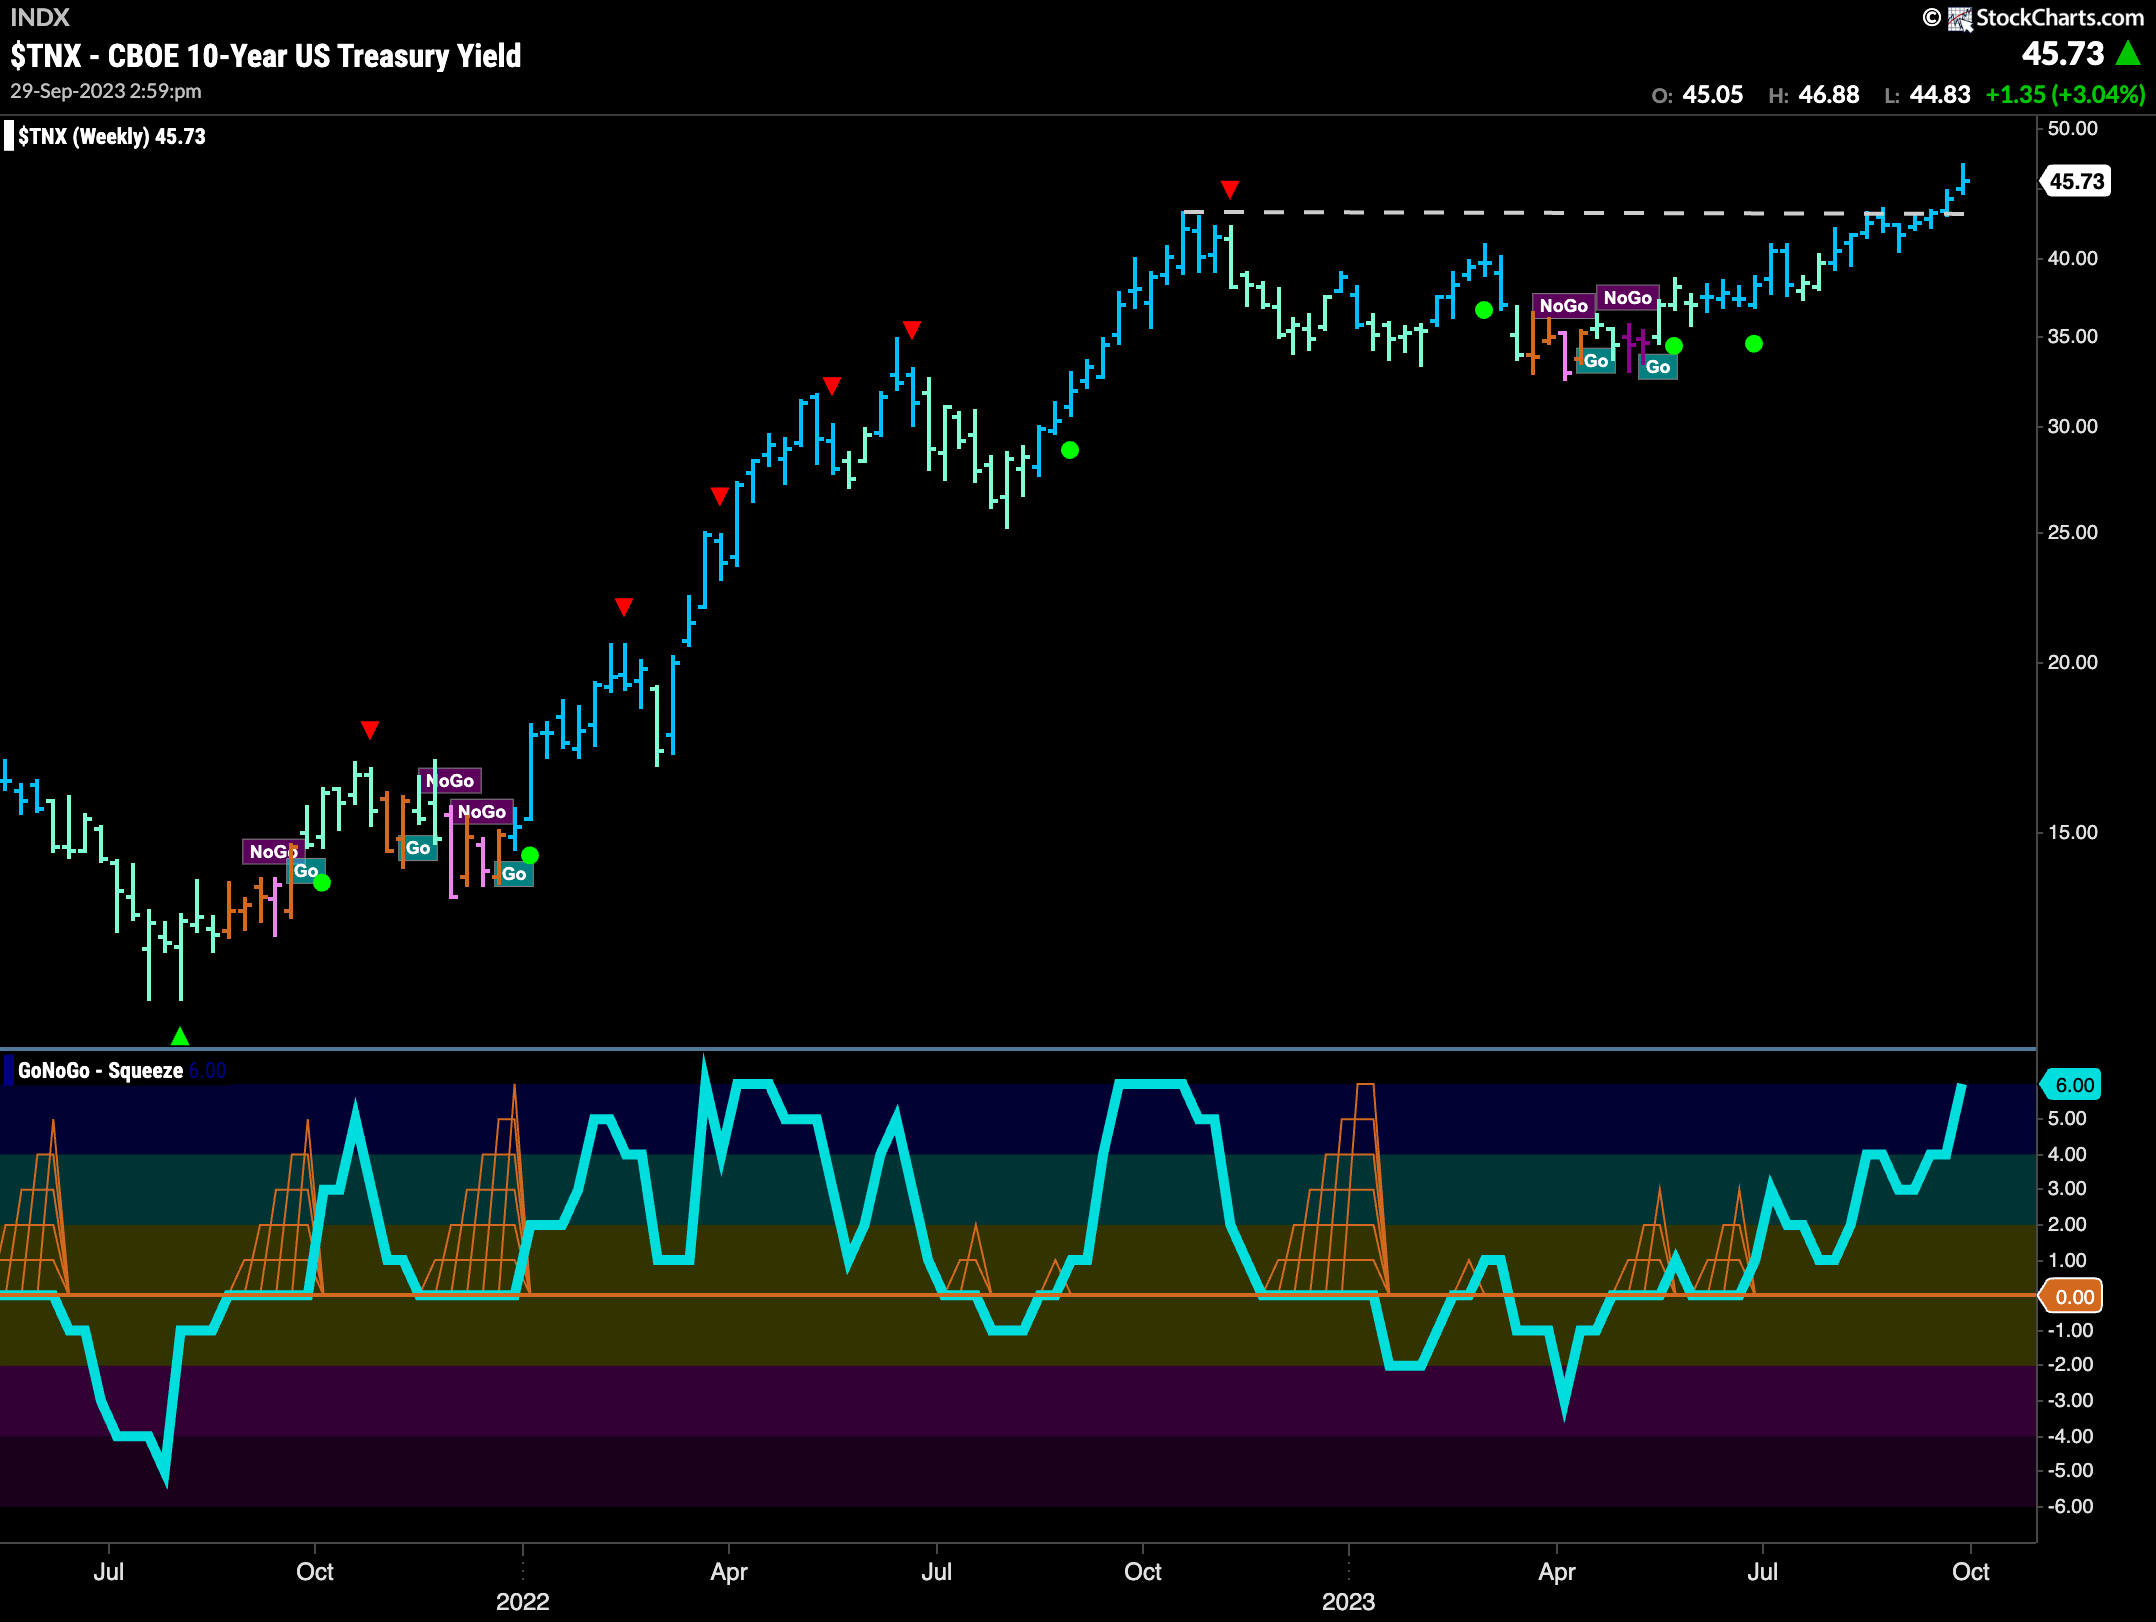
The weekly chart shows the “Go” trend has resumed in force. After breaking above resistance last week price went higher again. Strong blue “Go” bars dominate and GoNoGo Oscillator has raced higher into overbought territory showing market enthusiasm.
Dollar Makes Another Higher Weekly Close
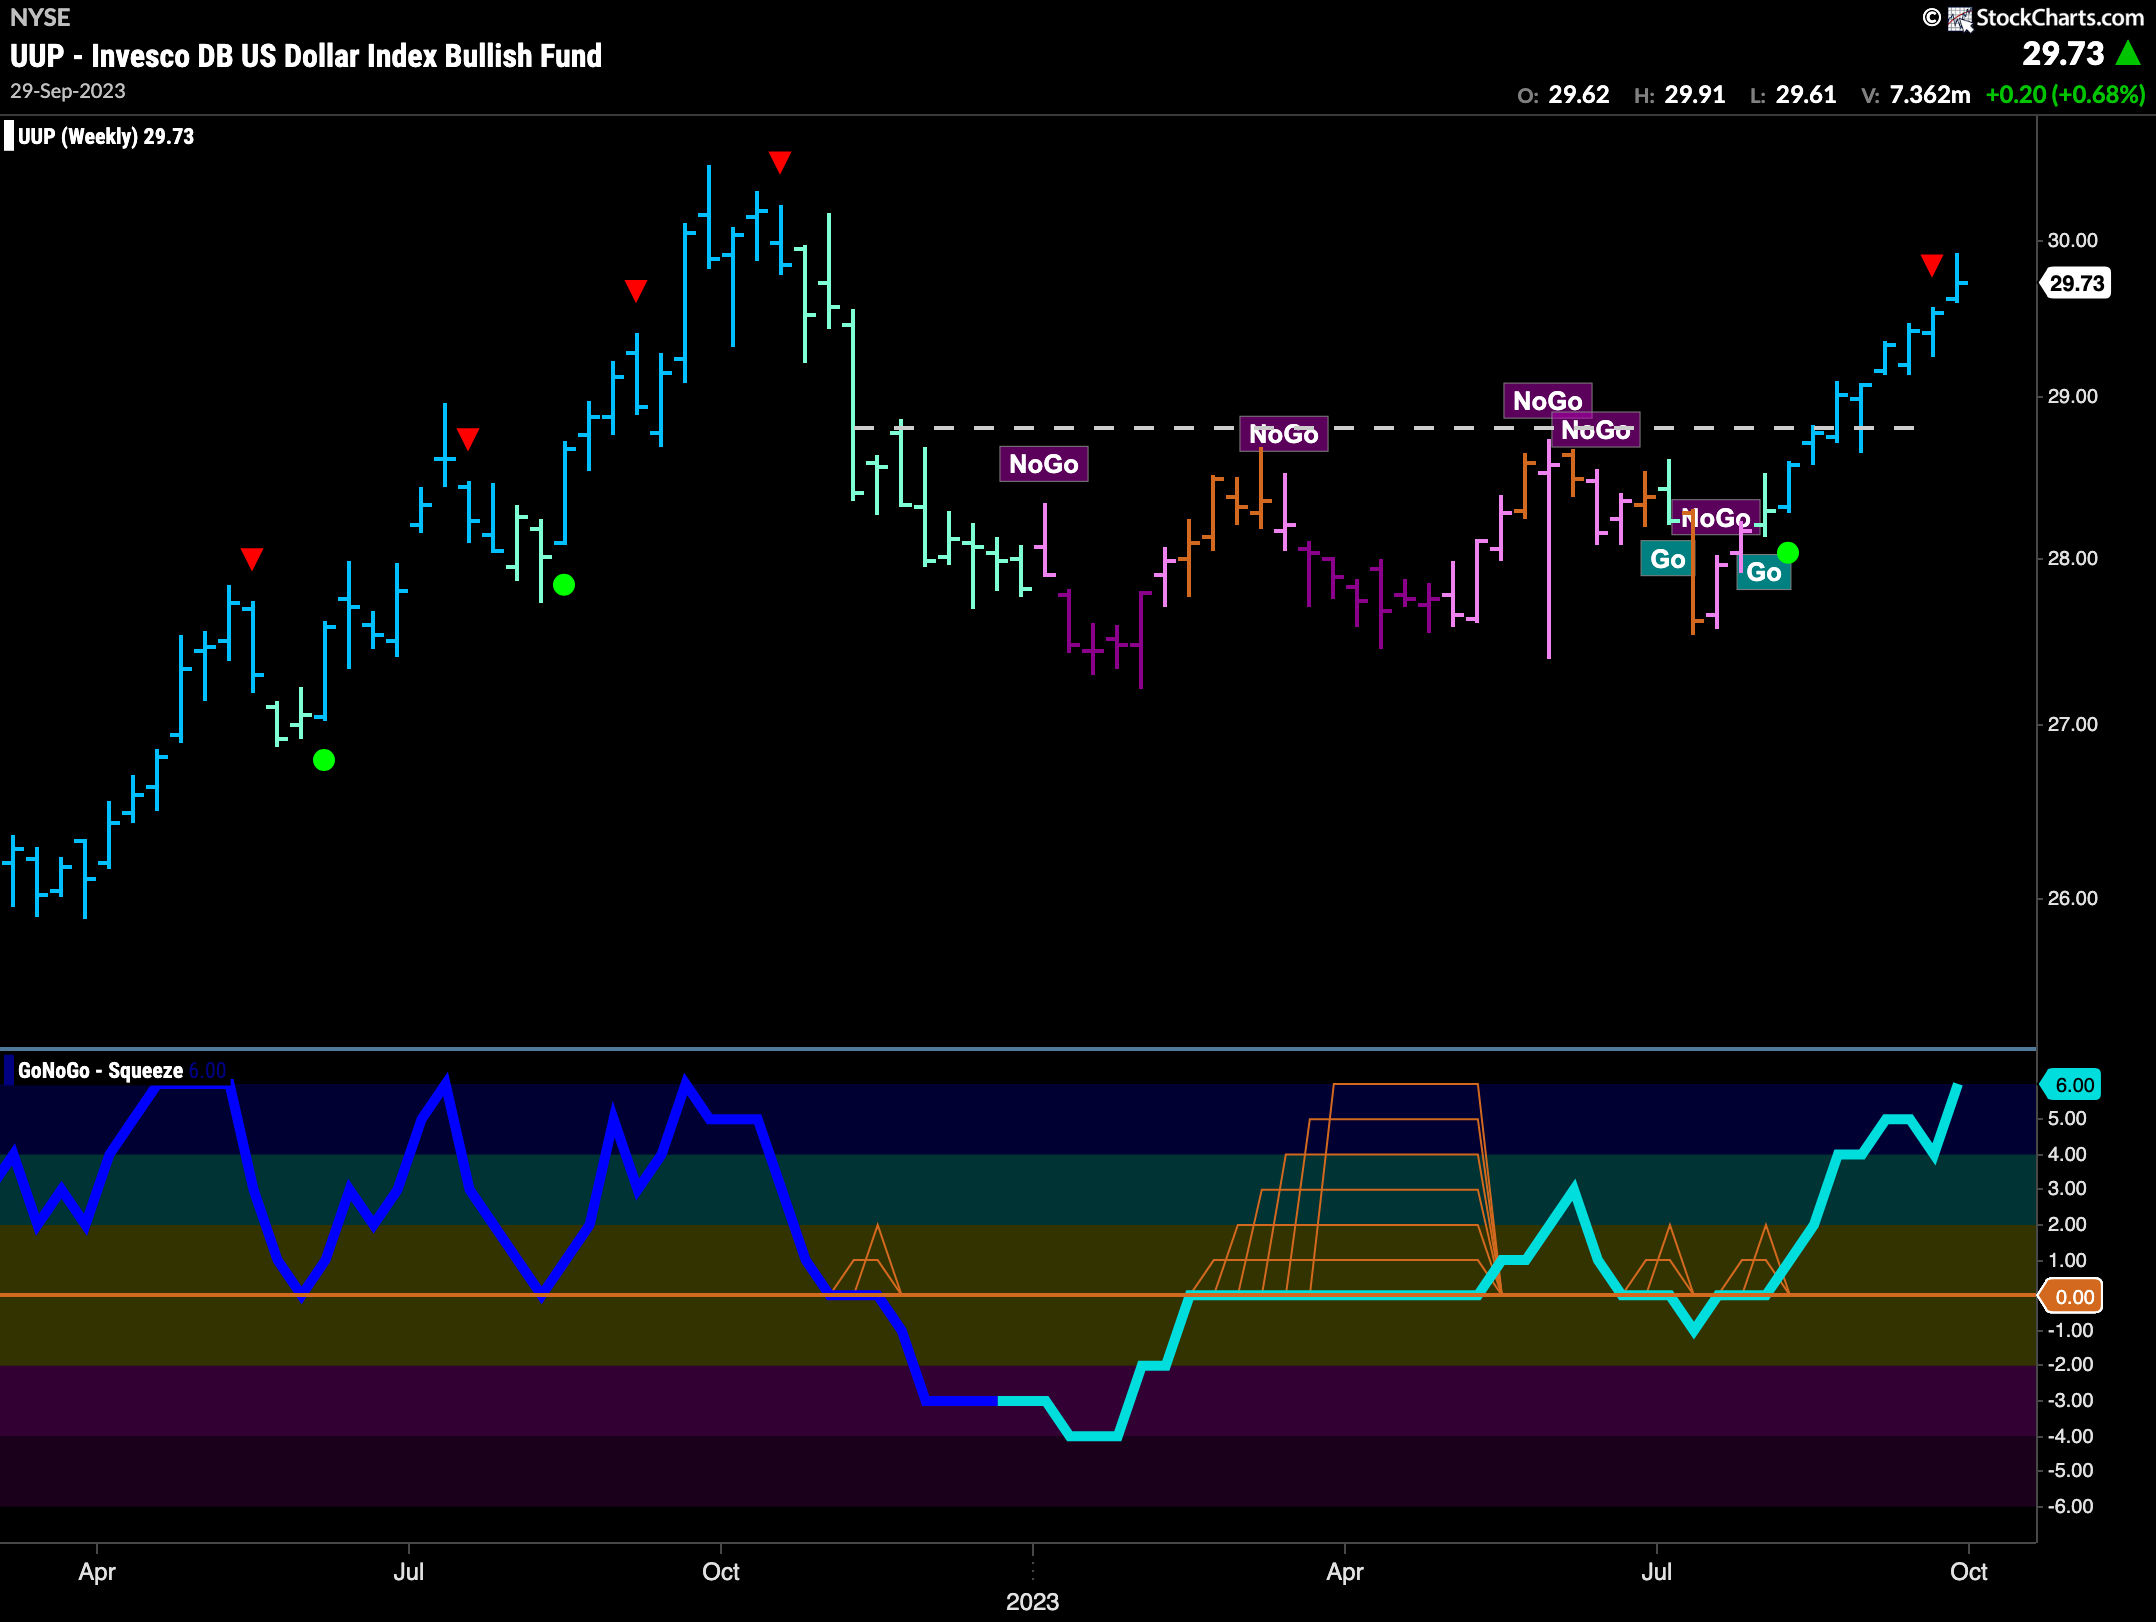
The long term chart of the dollar below shows that there is no stopping the greenback at the moment. Another strong blue “Go” bar at another higher close. Price has done nothing but move higher since breaking out of horizontal resistance a few months ago. GoNoGo Oscillator is now oversold and so we will see if this has any bearing on price action.
Another Higher High for Oil this Week
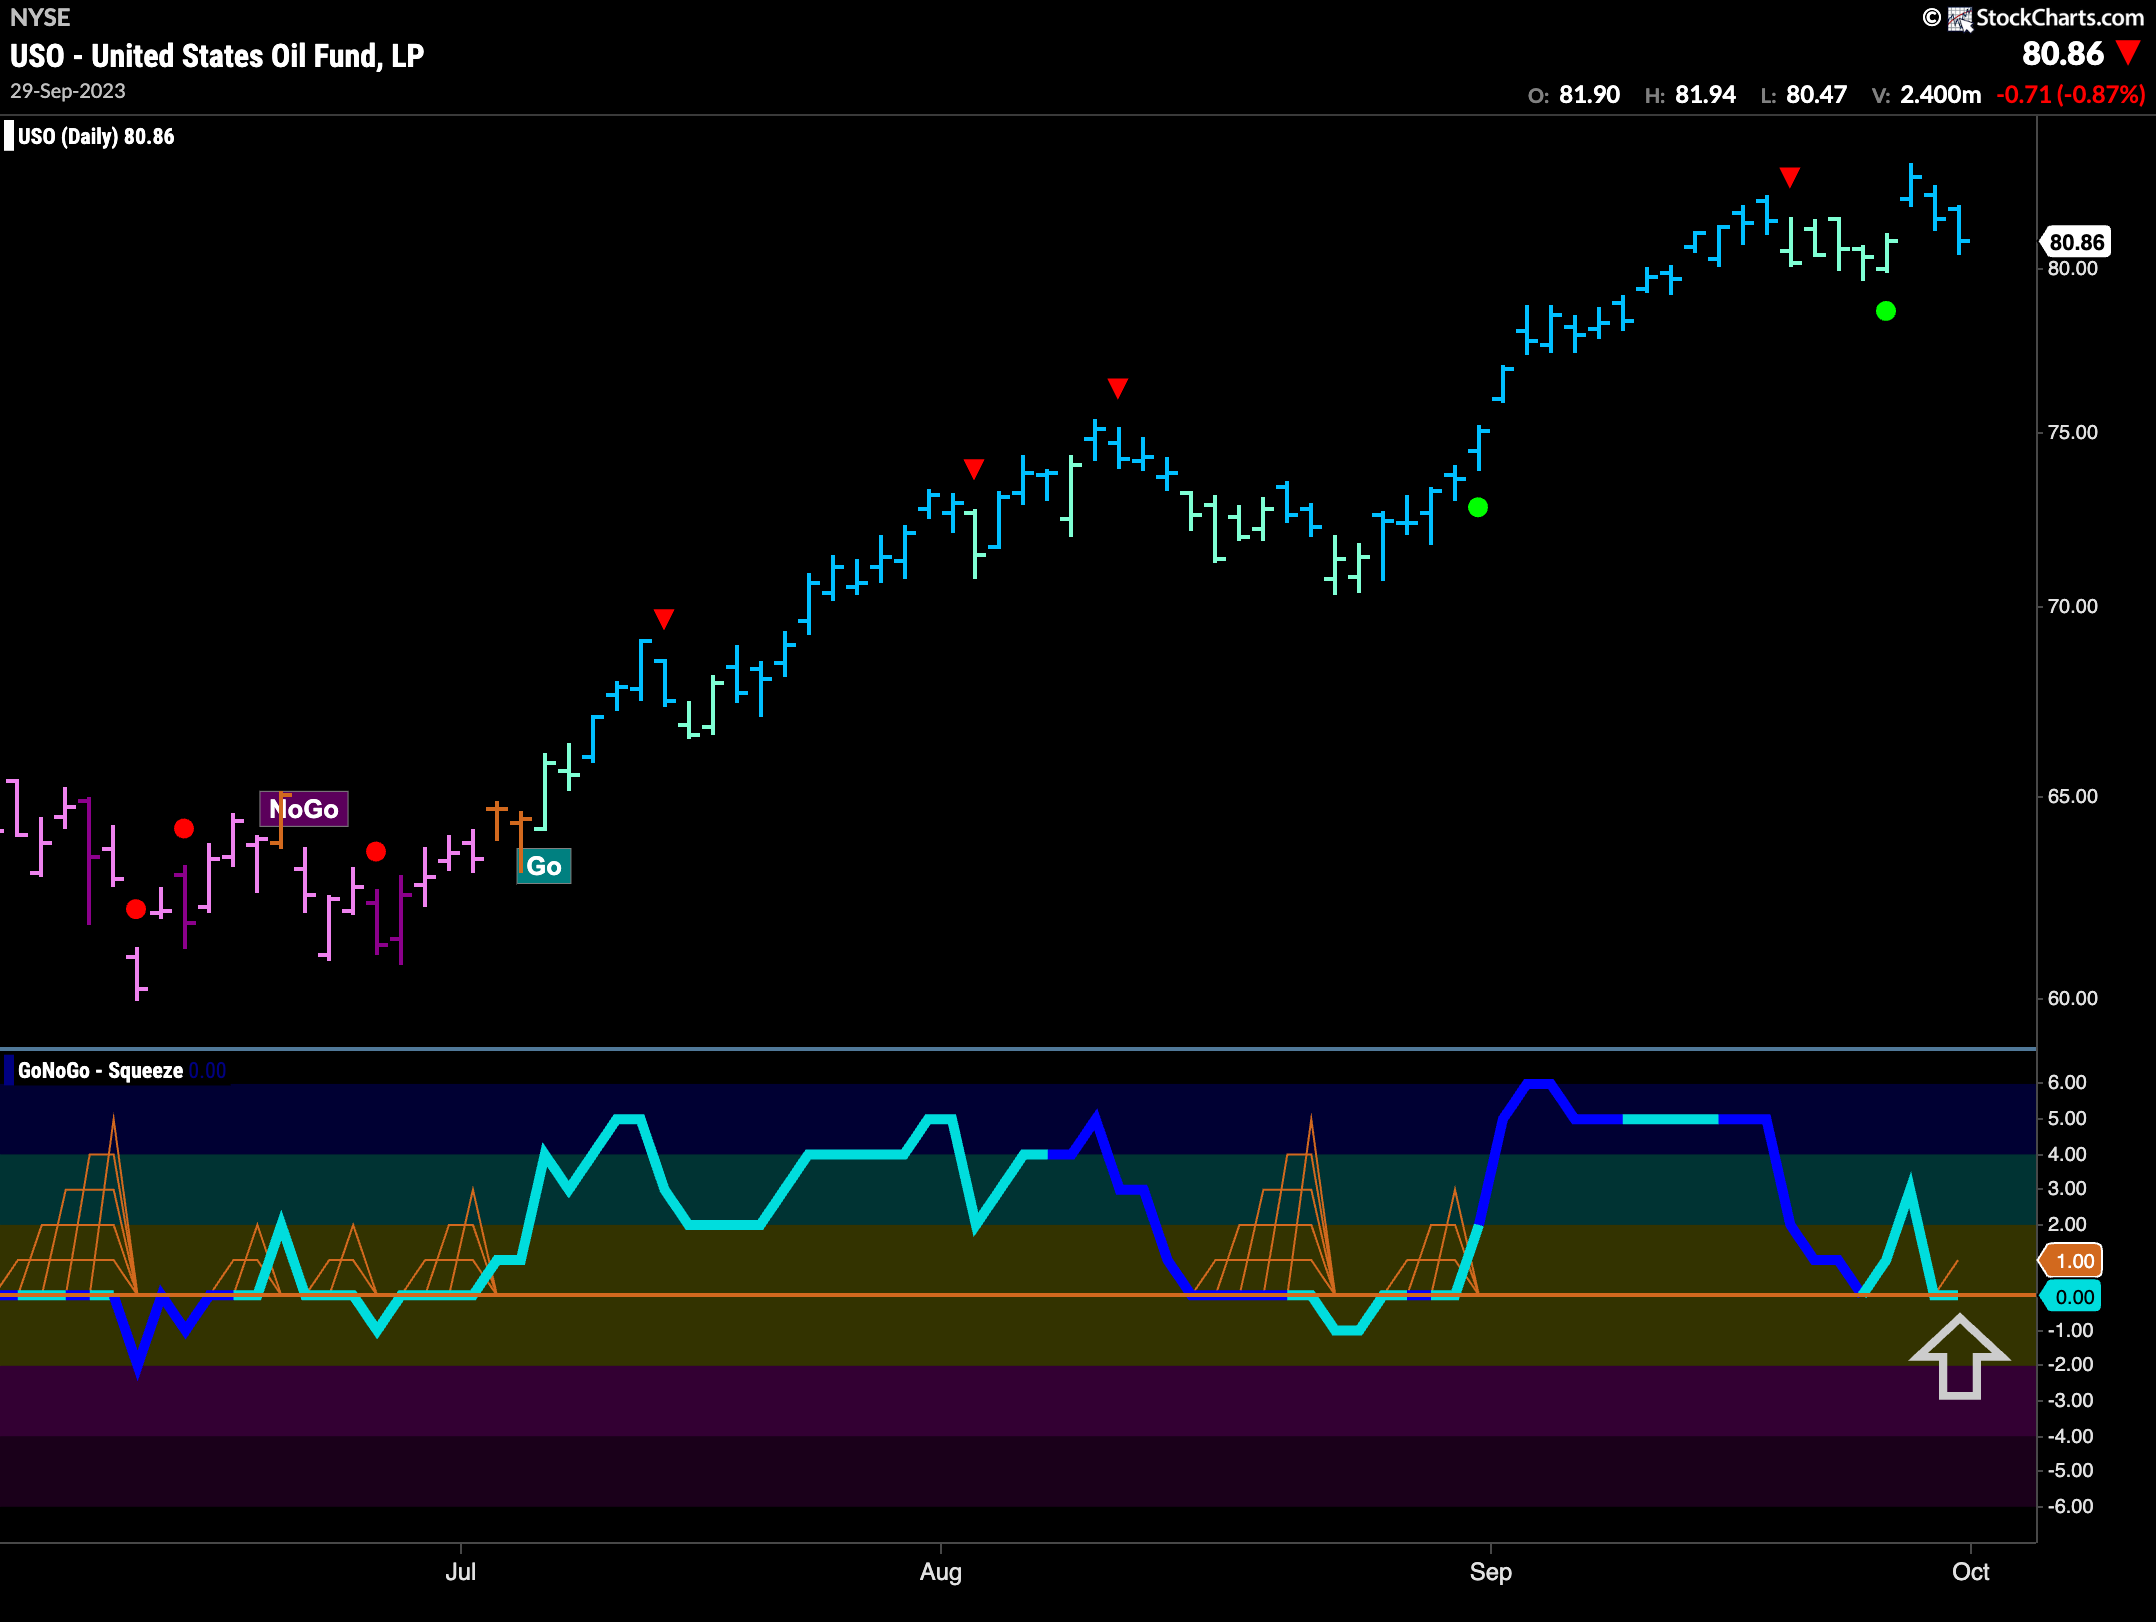
After hitting a mid week high, prices fell on the last two bars. We see that we are now at an inflection point as GoNoGo Oscillator has fallen to test the zero line from above. We will watch to see if the Oscillator finds support at the zero line. If this Go trend is to continue then we would expect GoNoGo Oscillator to find support at zero and rally into positive territory once again. If this happens we can expect an attempt at another higher high.
Gold Breaks Down
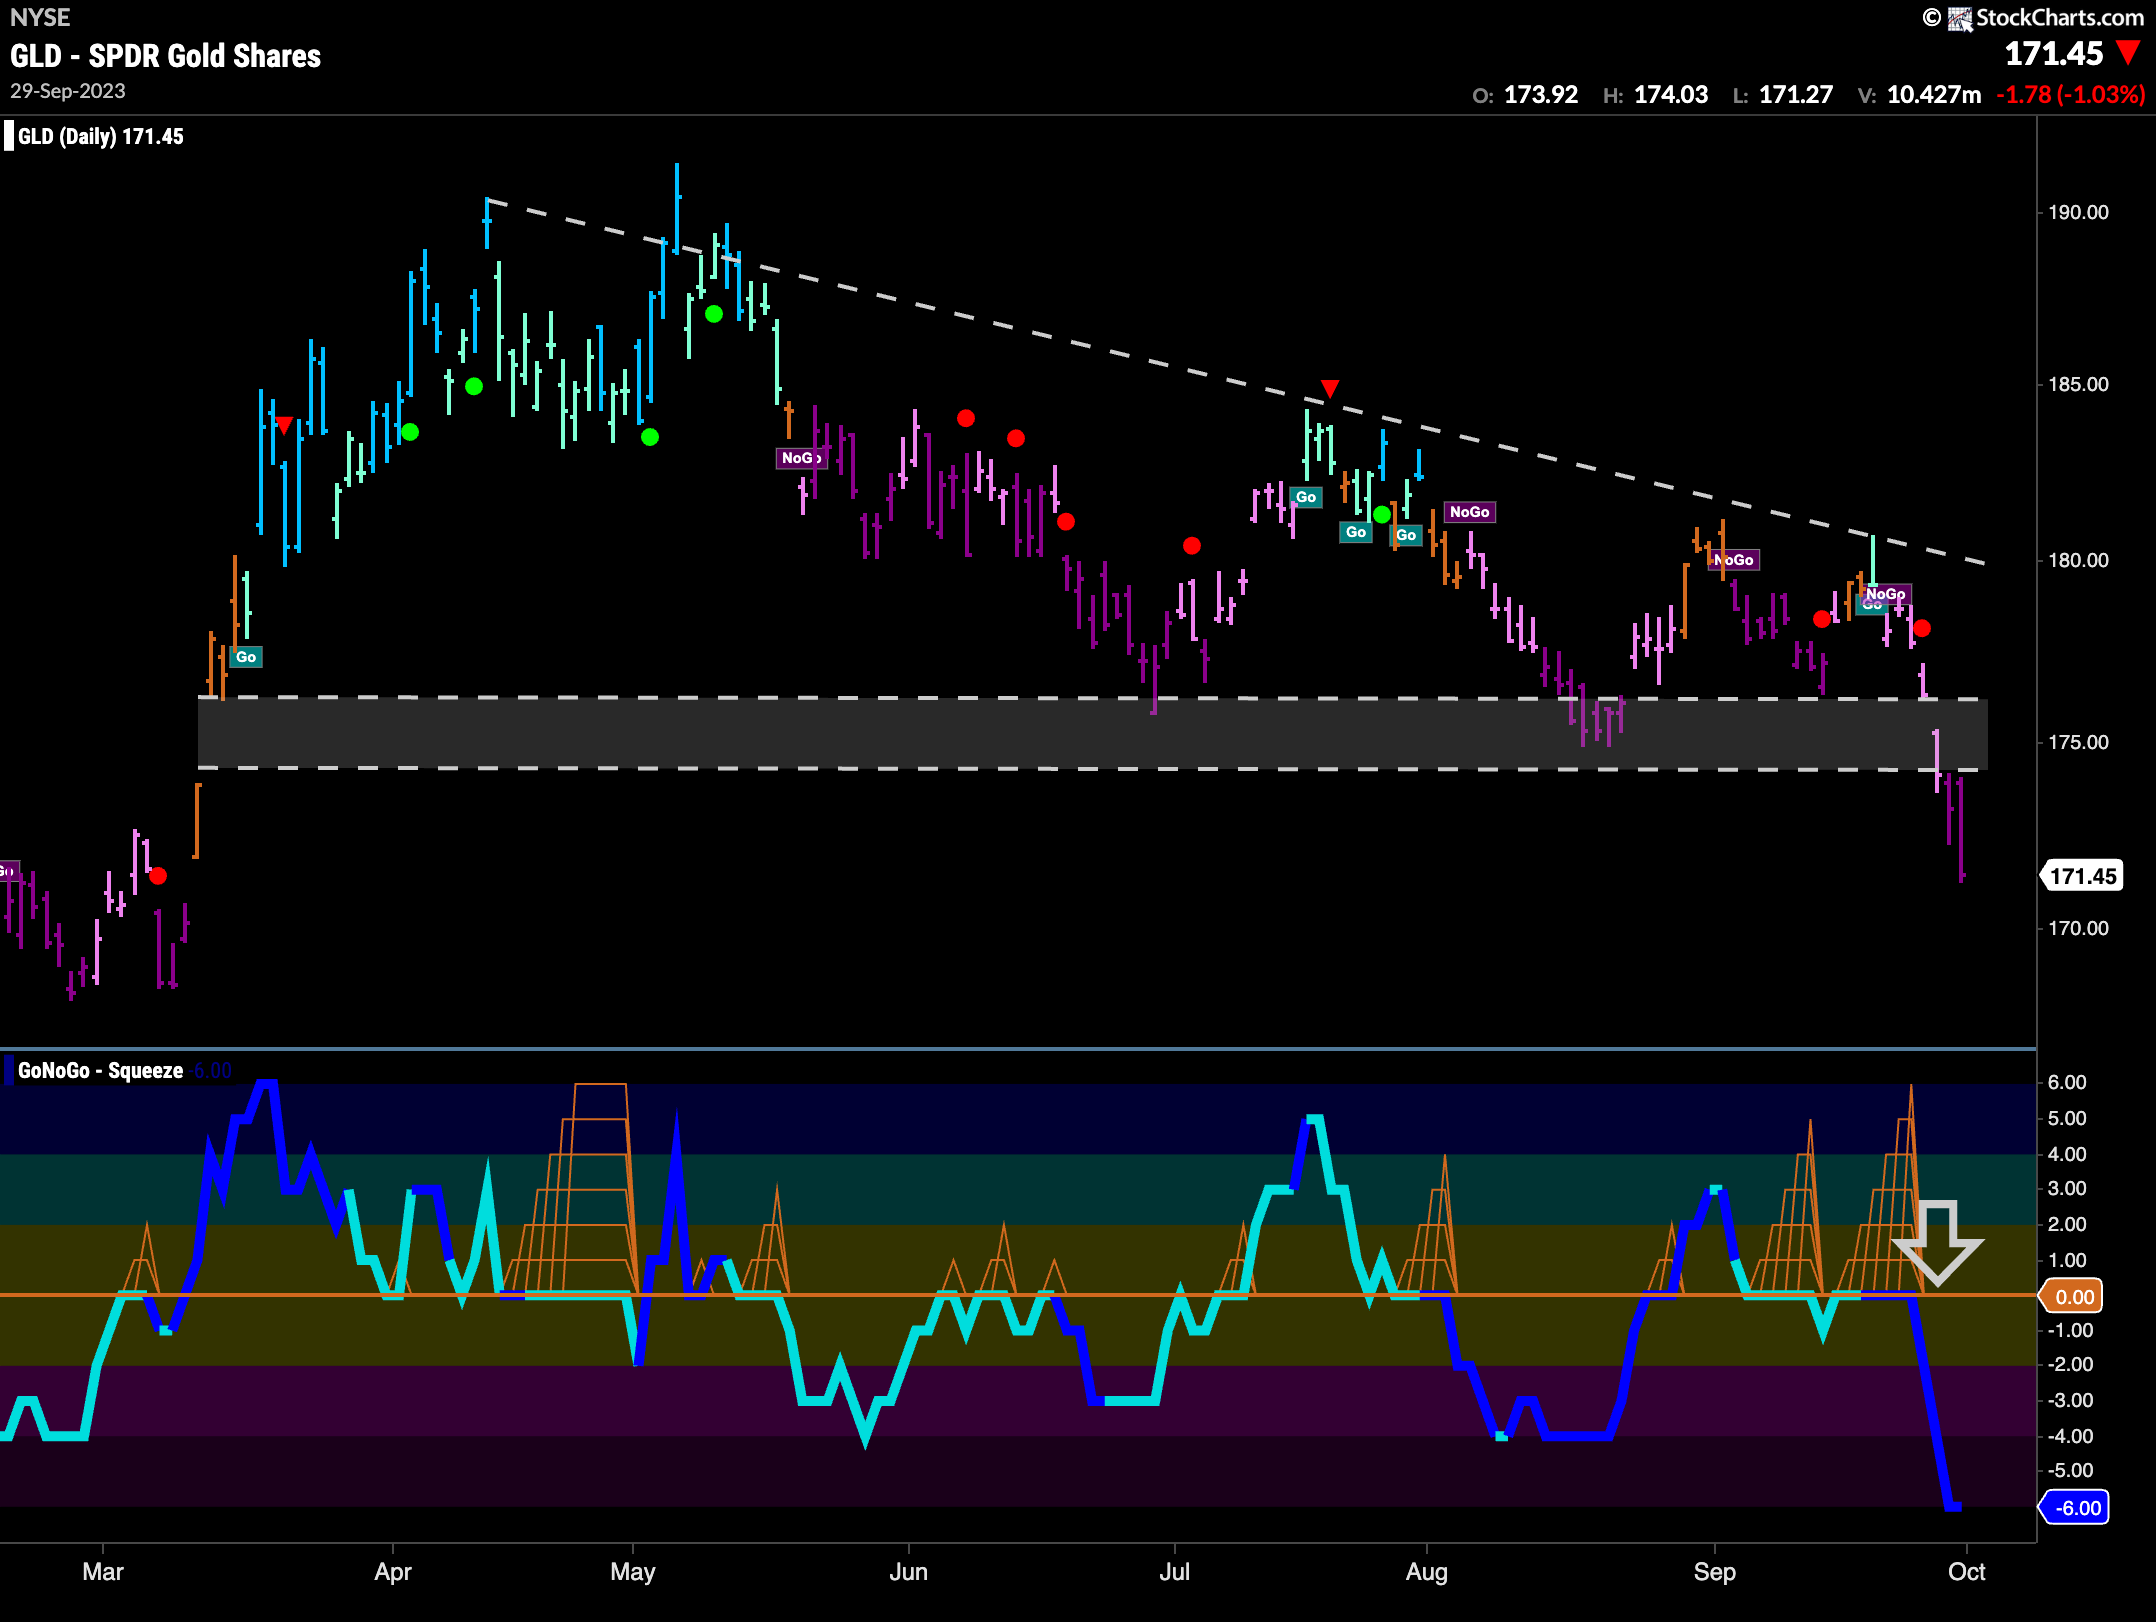
We saw this descending triangle last week and noted that GoNoGo Oscillator was building a Max GoNoGo Squeeze as price looked for support at the level from the gap earlier on the chart. It didn’t get it. Breaking out of the Max Squeeze on heavy volume, strong negative momentum confirmed the break through support and GoNoGo Trend is painting strong purple “NoGo” bars at new lows.
Sector RelMap
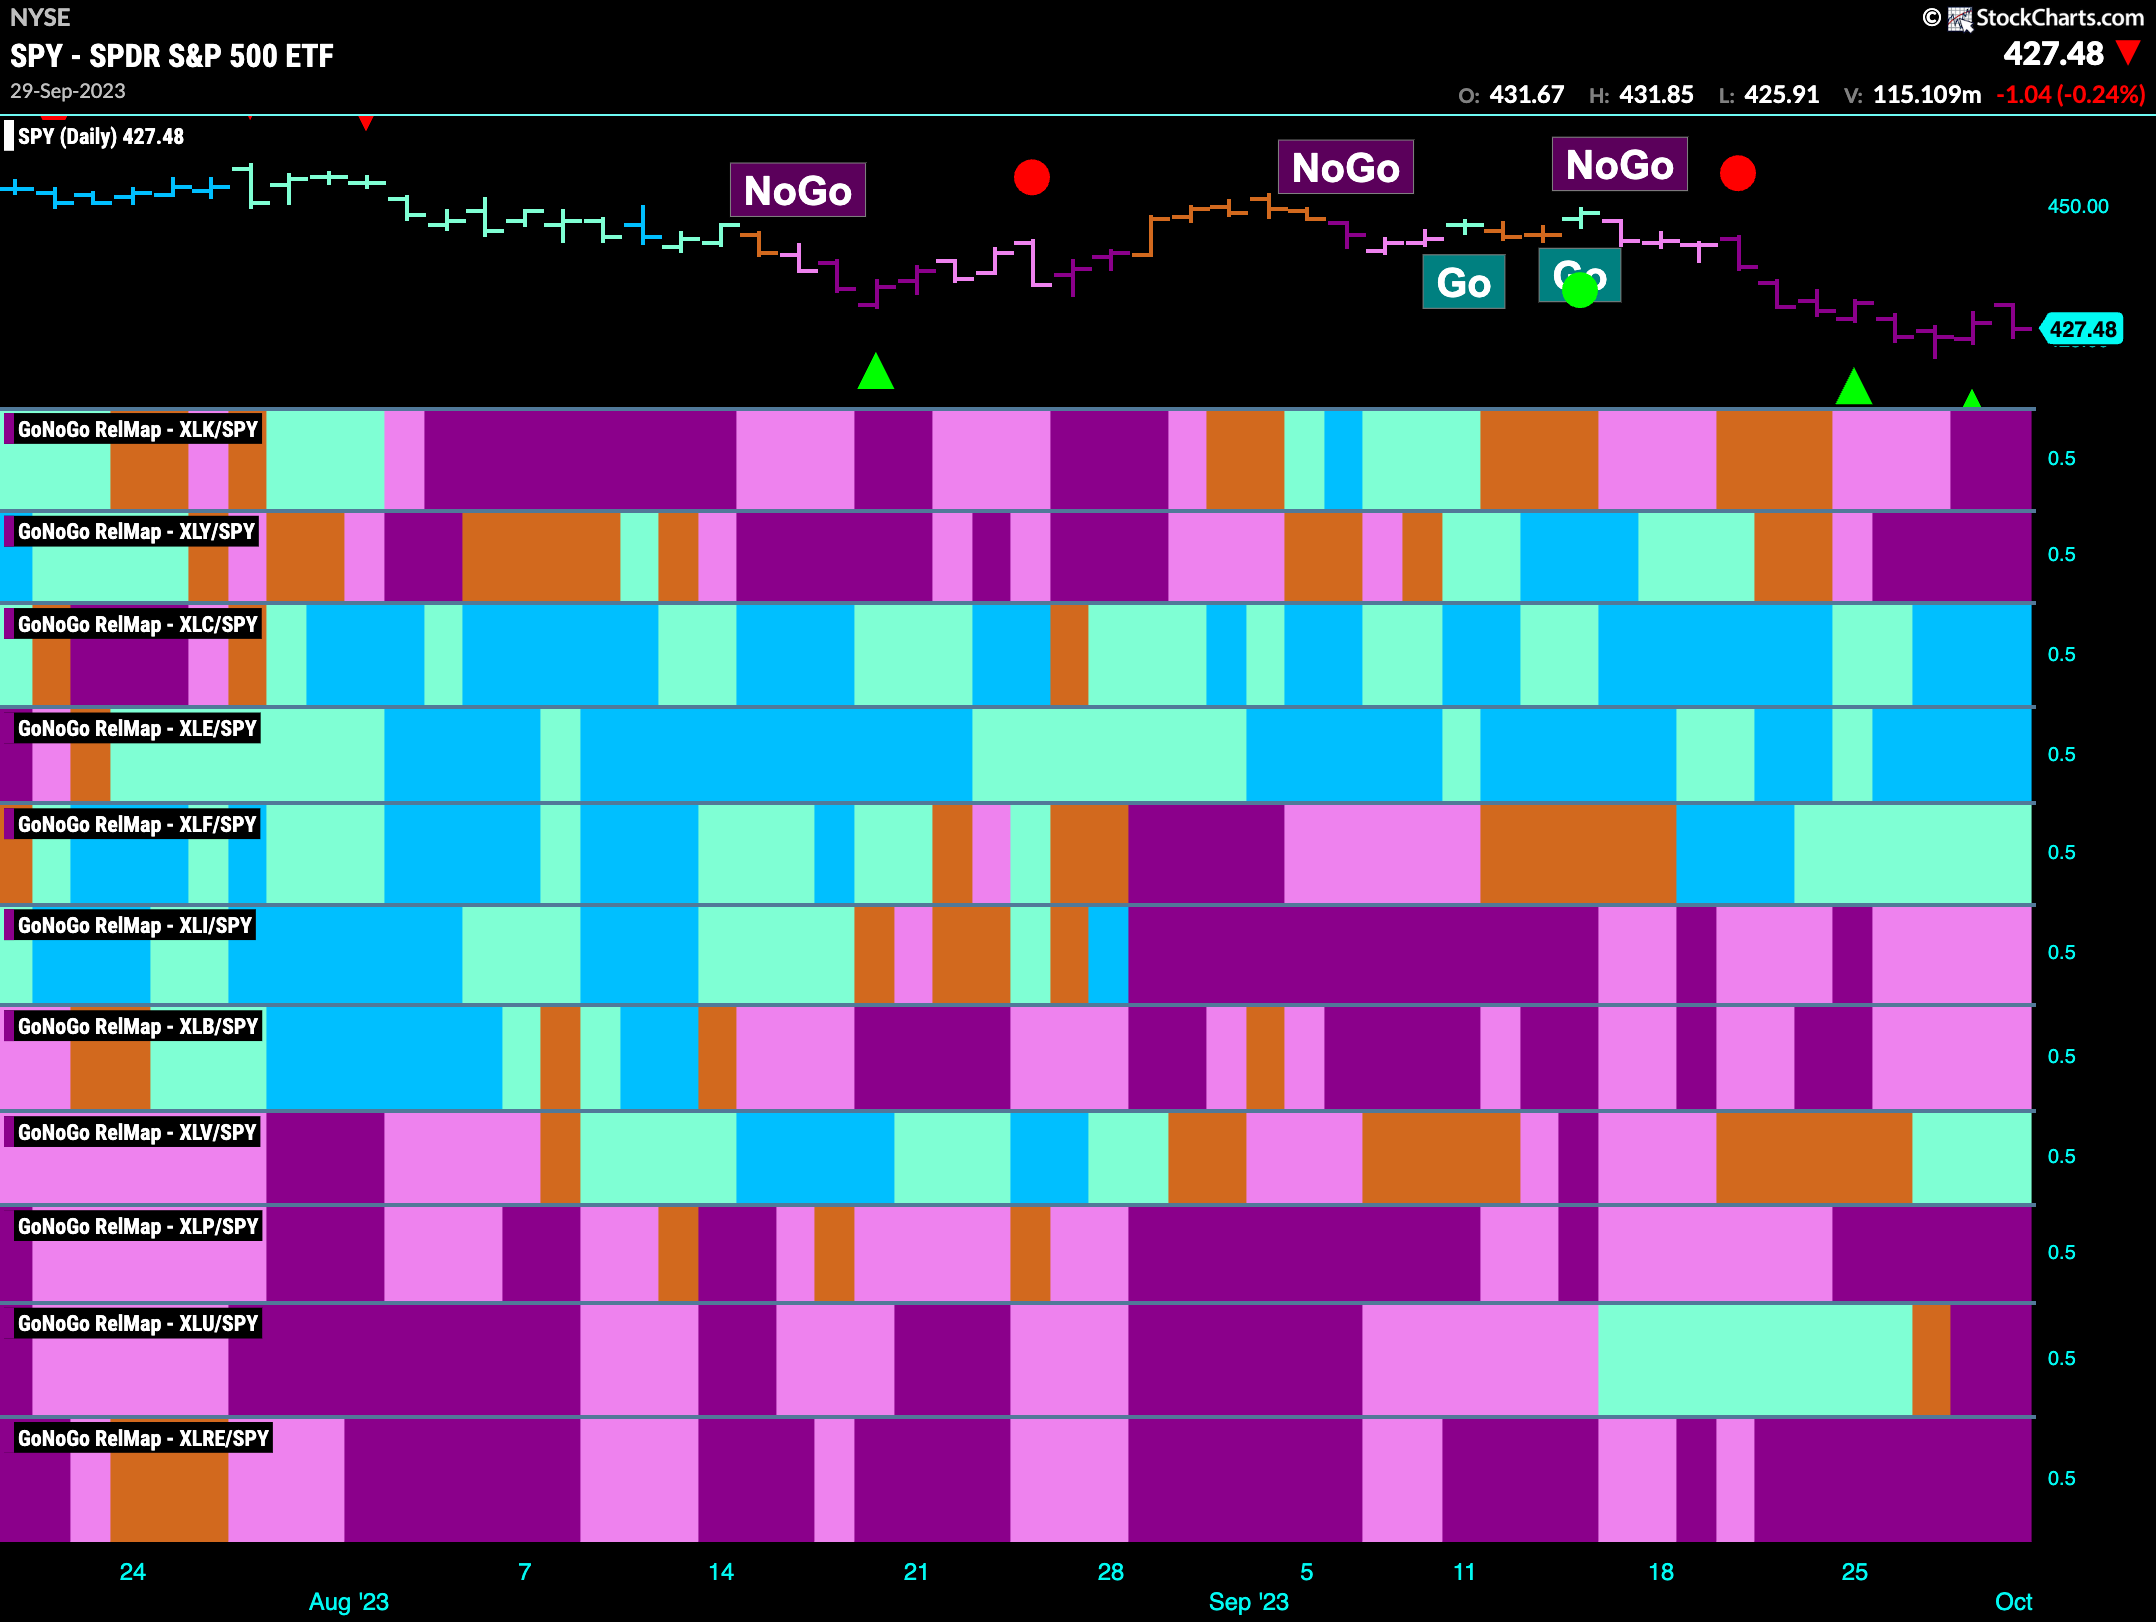
Below is the GoNoGo Sector RelMap. This GoNoGo RelMap applies the GoNoGo Trend to the relative strength ratios of the sectors to the base index. Looking at this map, we can quickly see where the relative outperformance is coming from as well as which sectors are lagging on a relative basis. 4 sectors are outperforming the base index this week. $XLC, $XLE, $XLF, and $XLV are painting “Go” bars.
Healthcare Sub-Group RelMap
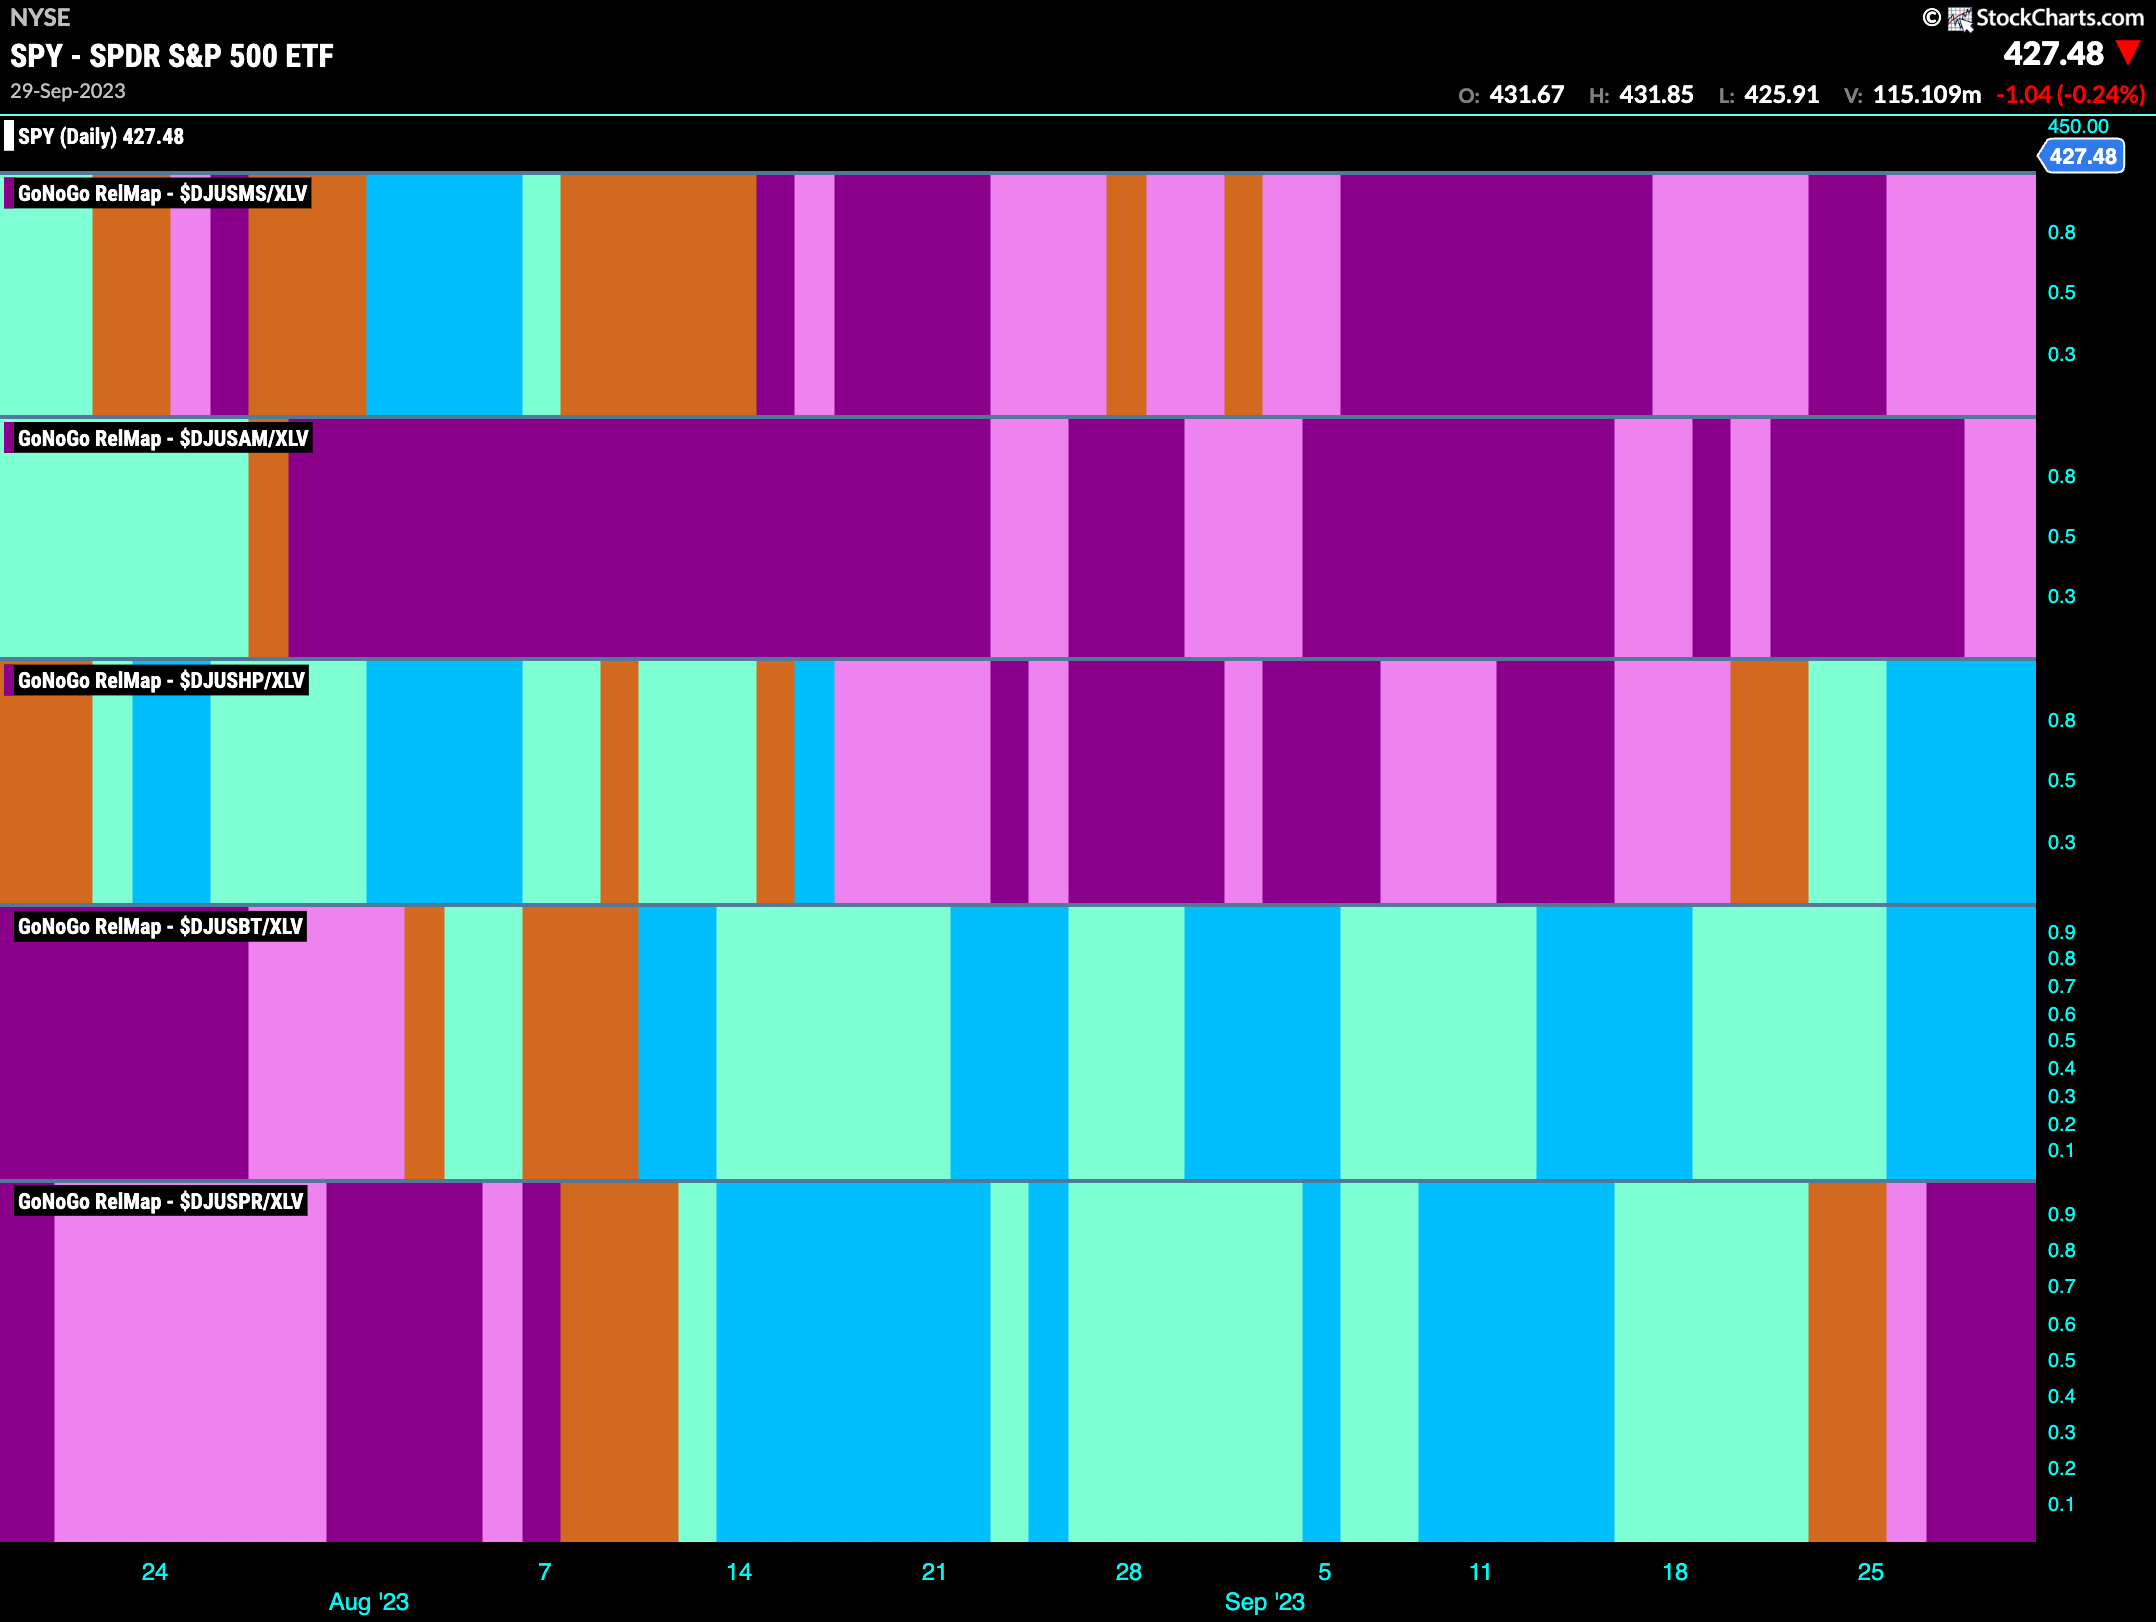
The GoNoGo Sub-Group RelMap below shows that it is not all the industries within the Healthcare sector that are driving its relative out-performance. Healthcare providers have come into their own of late and we can see that last week saw a relative “Go” trend to the $XLV strengthen to strong blue bars (third panel).
Cigna Looking to Break Out to New Highs
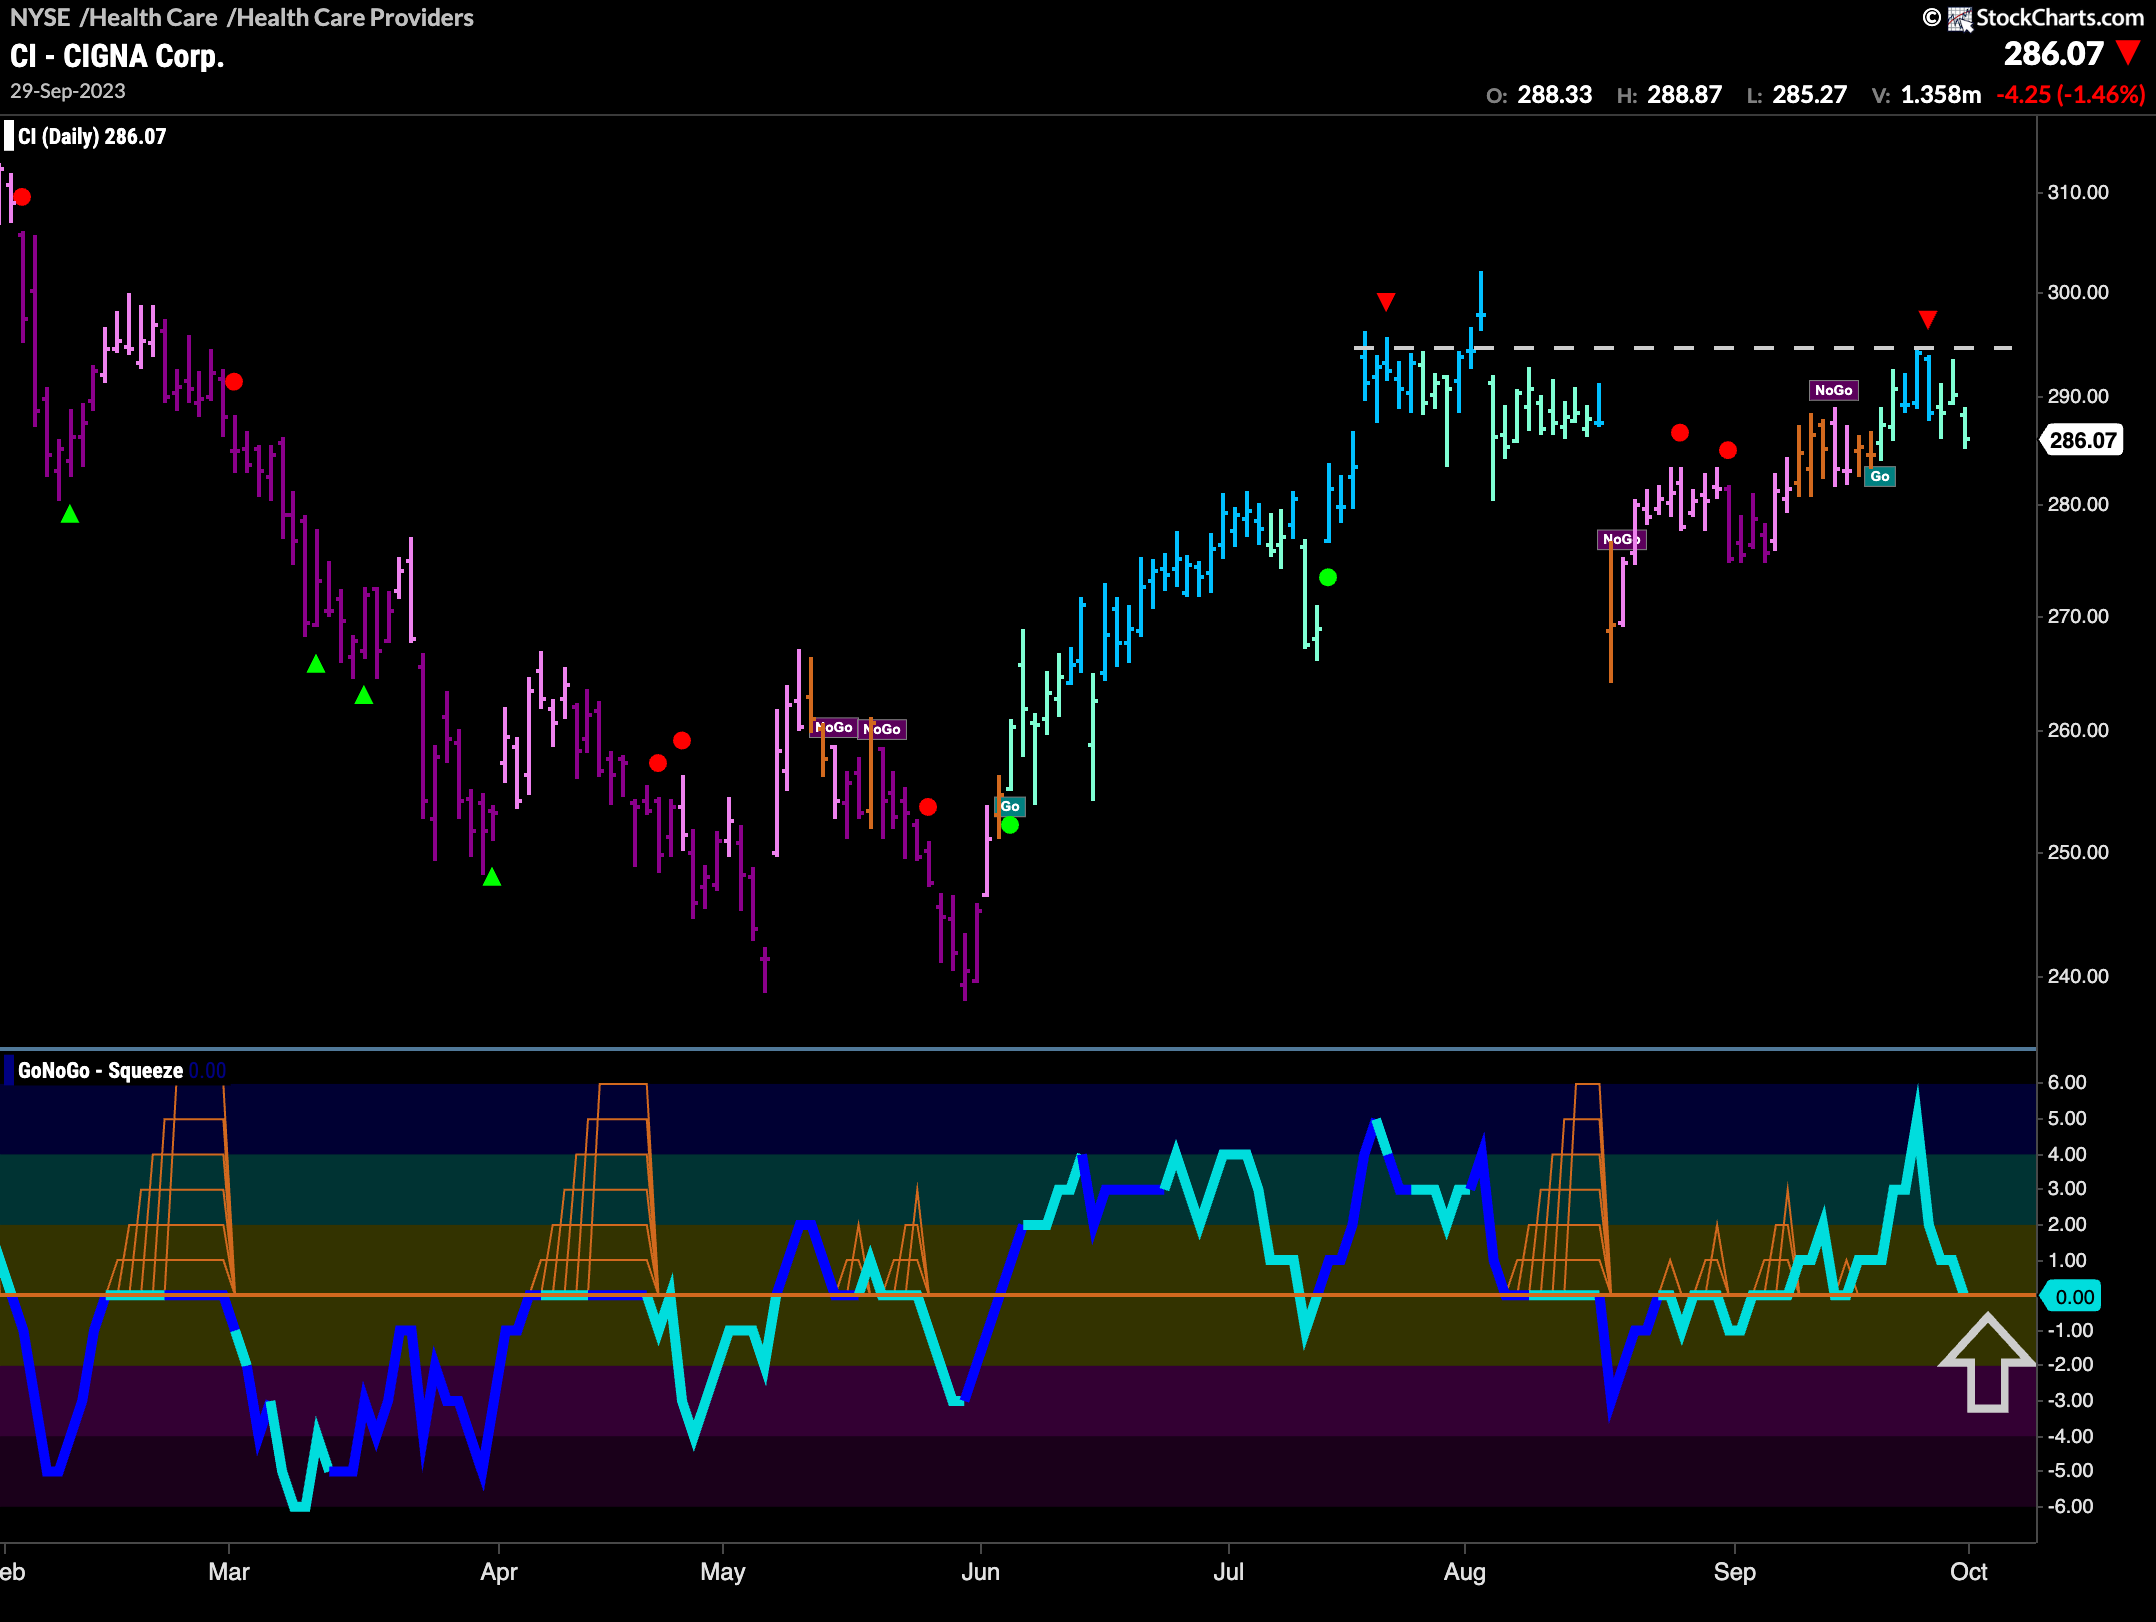
One of the securities in the healthcare providers sub-group that has an interesting chart is $CI. A tenuous “Go” trend is in place. Having been identified just over a week ago it has already run into horizontal resistance as seen on the chart. This caused GoNoGo Oscillator to fall quickly back to the zero line where we will look to see if it finds support. If it does, and rallies back into positive territory then we can look for price to make another attempt at a new high.
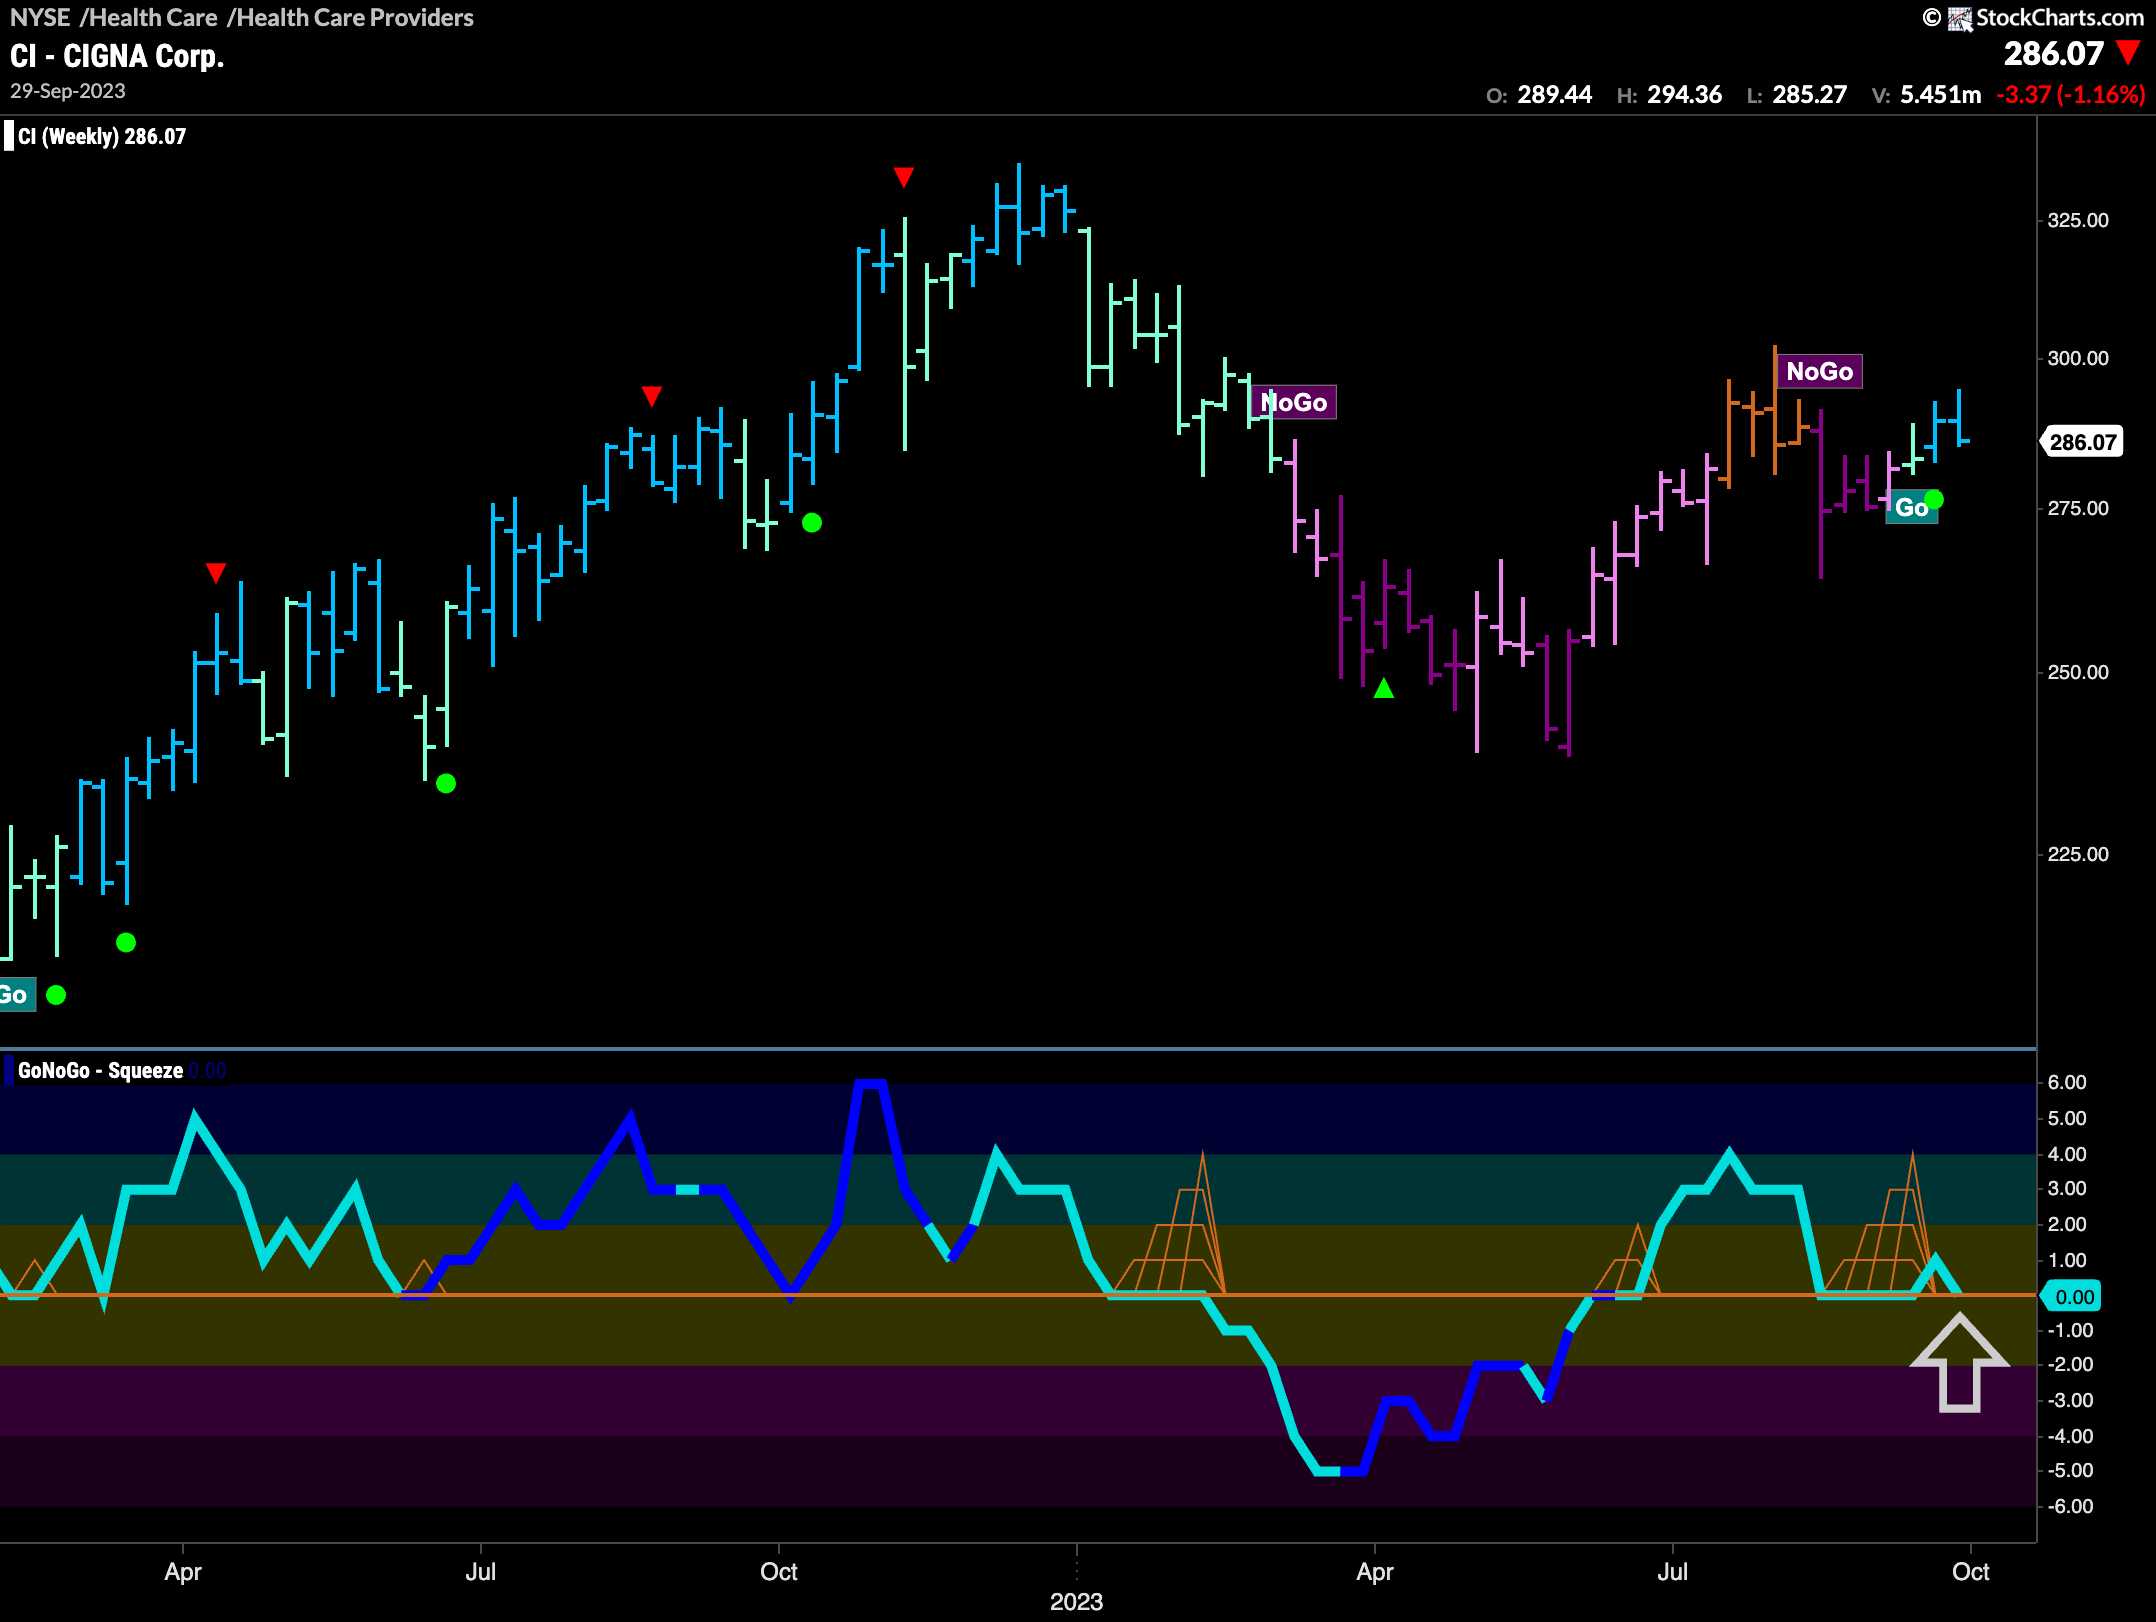
A look at the weekly chart below shows that the “Go” trend we see on the daily chart may have a chance to survive. On the larger time frame, this “Go” trend is in its infancy and GoNoGo Trend has strengthened to paint a couple of stronger “Go” bars. GoNoGo Oscillator is testing the zero line here as well where it has been able to find support up til this point. We will note if this happens again and look for a new higher high as the “Go” trend finds its legs.
Molina Healthcare “Go” Trend Looks Strong
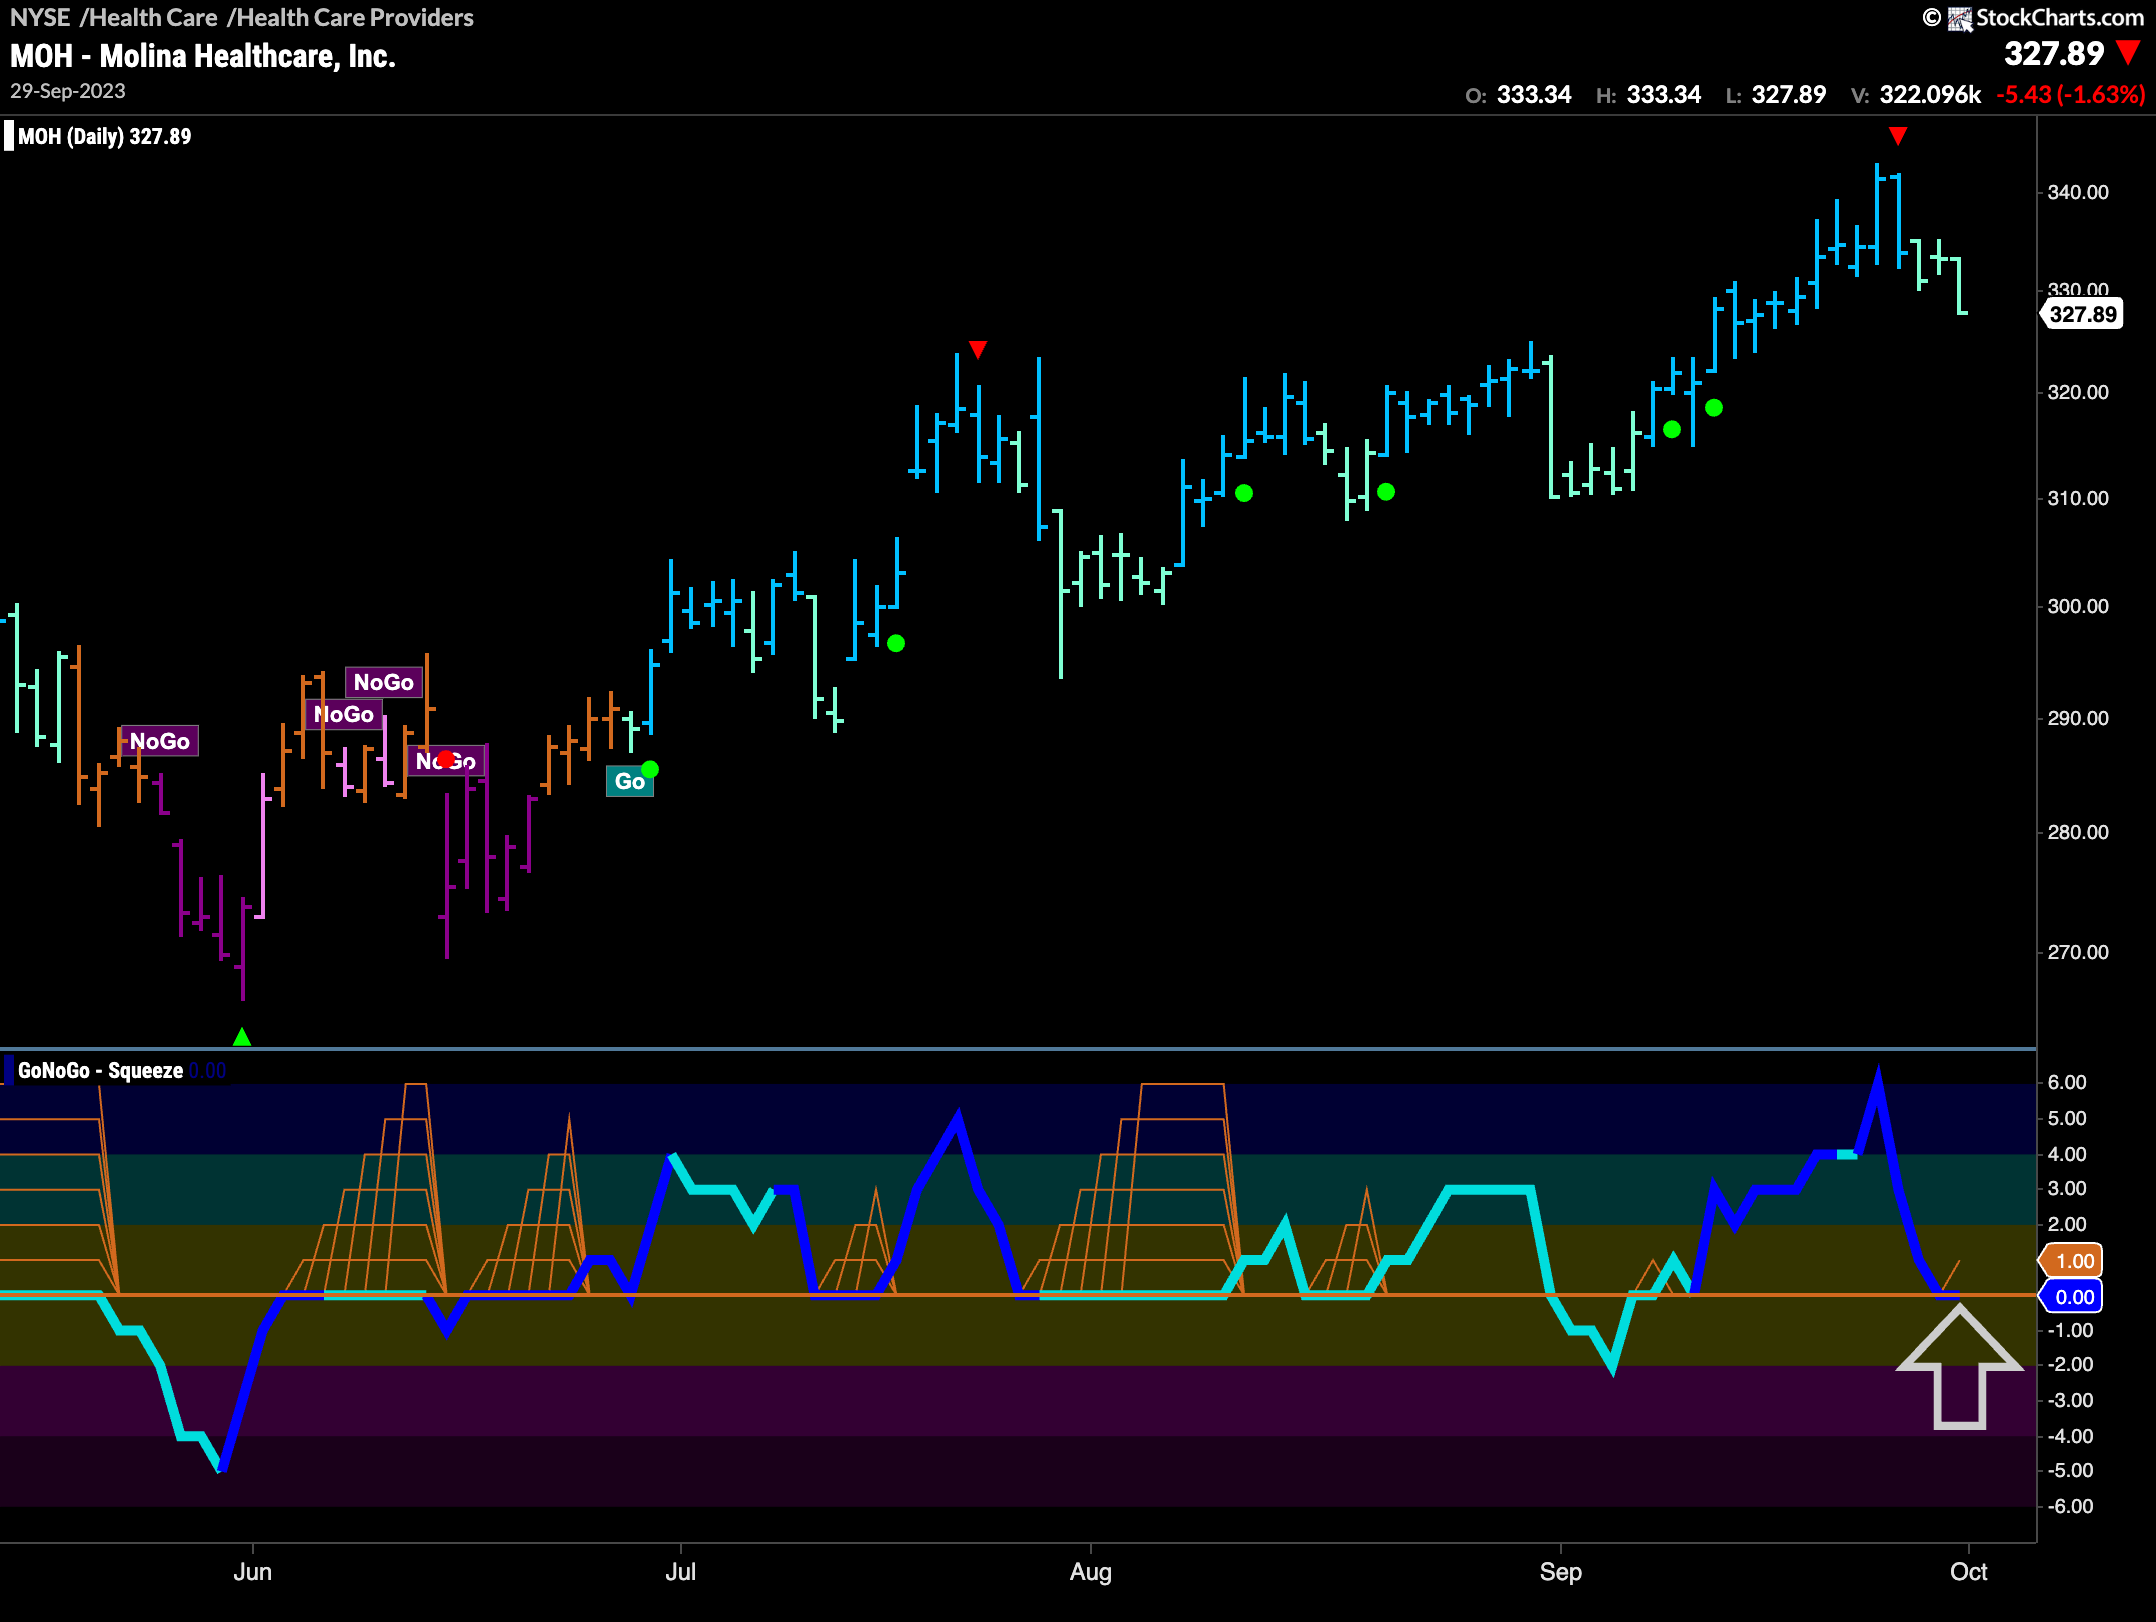
The chart below shows another security from the healthcare providers subgroup that is already thriving and capitalizing on the sub group’s relative strength. Having entered a “Go” trend in late June, it has made a series of higher highs and higher lows. During this time, GoNoGo Oscillator has largely found support at the zero line marking a strong trend. Now, after heavy volume on a new higher high, the oscillator is back testing the zero line from above. If support is found here, expect trend continuation and an opportunity for the stock to climb even higher.
