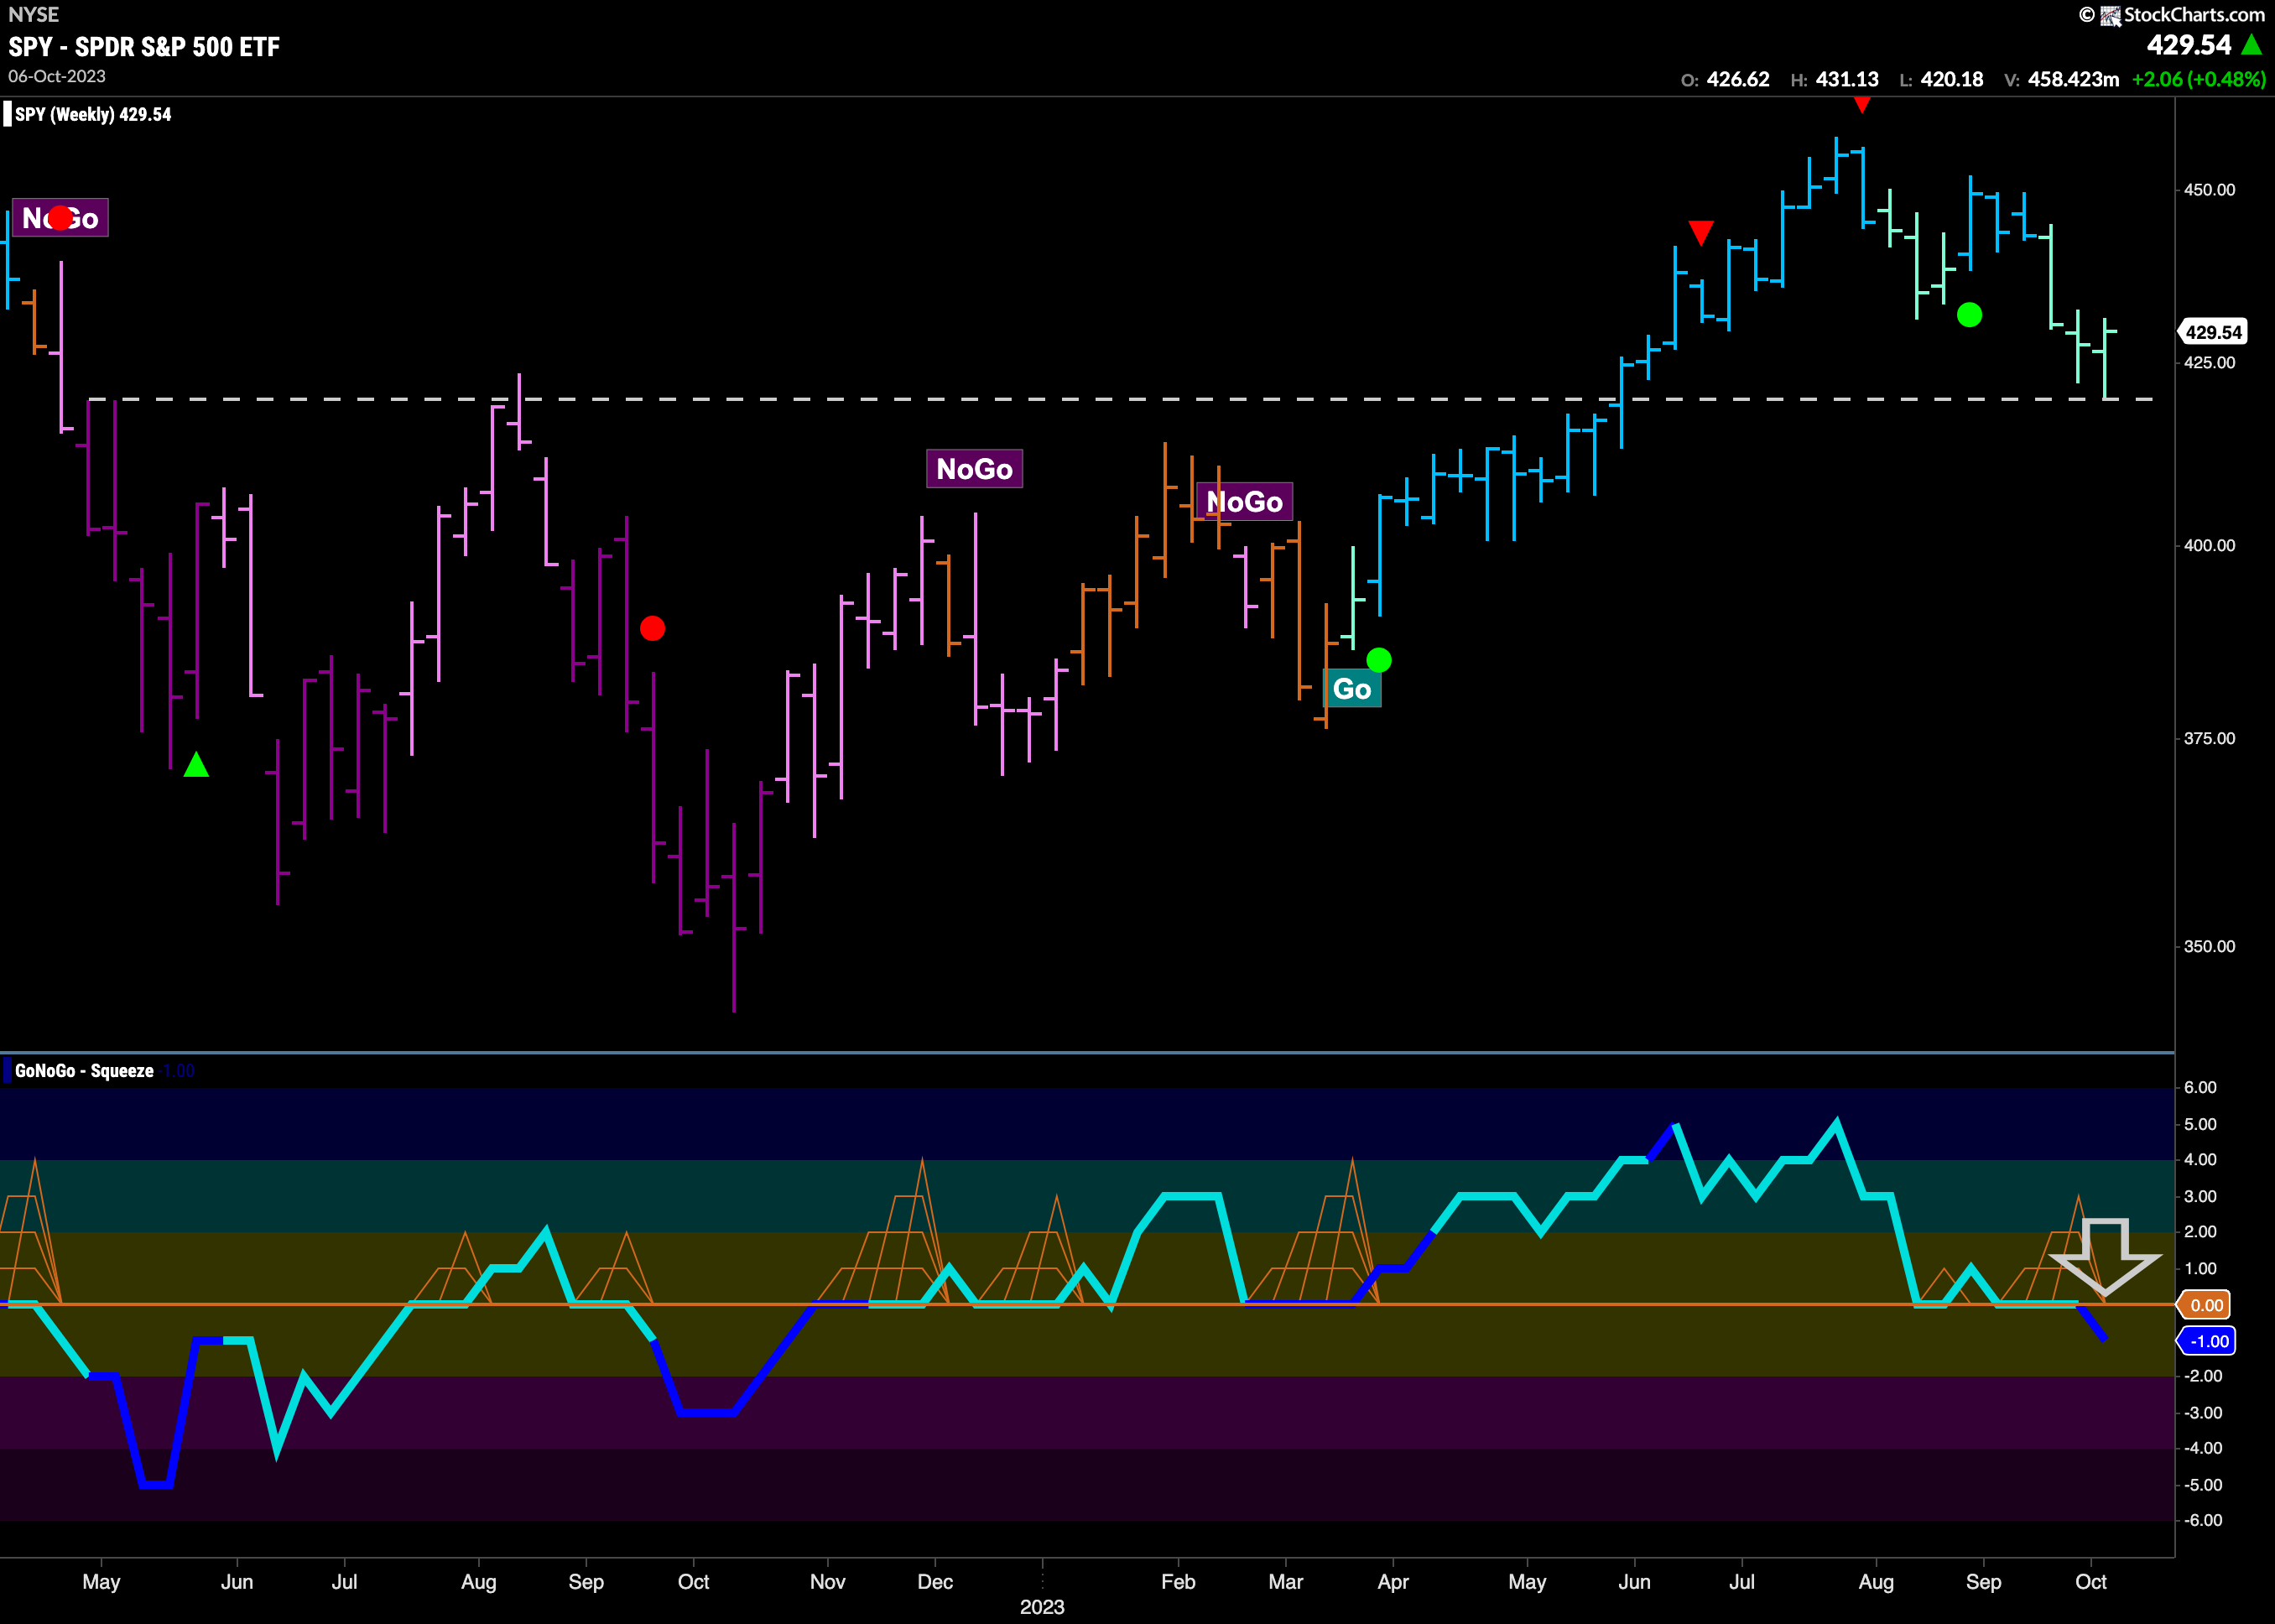
Good morning and welcome to this week’s Flight Path. The “NoGo” continued this week in U.S. equities as we saw most of the week dominated by strong purple bars. Friday saw some relief as prices rallied and GoNoGo Trend painted a weaker pink bar. Treasury bond prices were unable to make any headway against the strong “NoGo” trend with another week of uninterrupted purple bars. Commodities rolled over this week and finished the week painting strong purple “NoGo” bars. The dollar, so far, remains in a “Go” trend albeit painting weaker aqua bars.
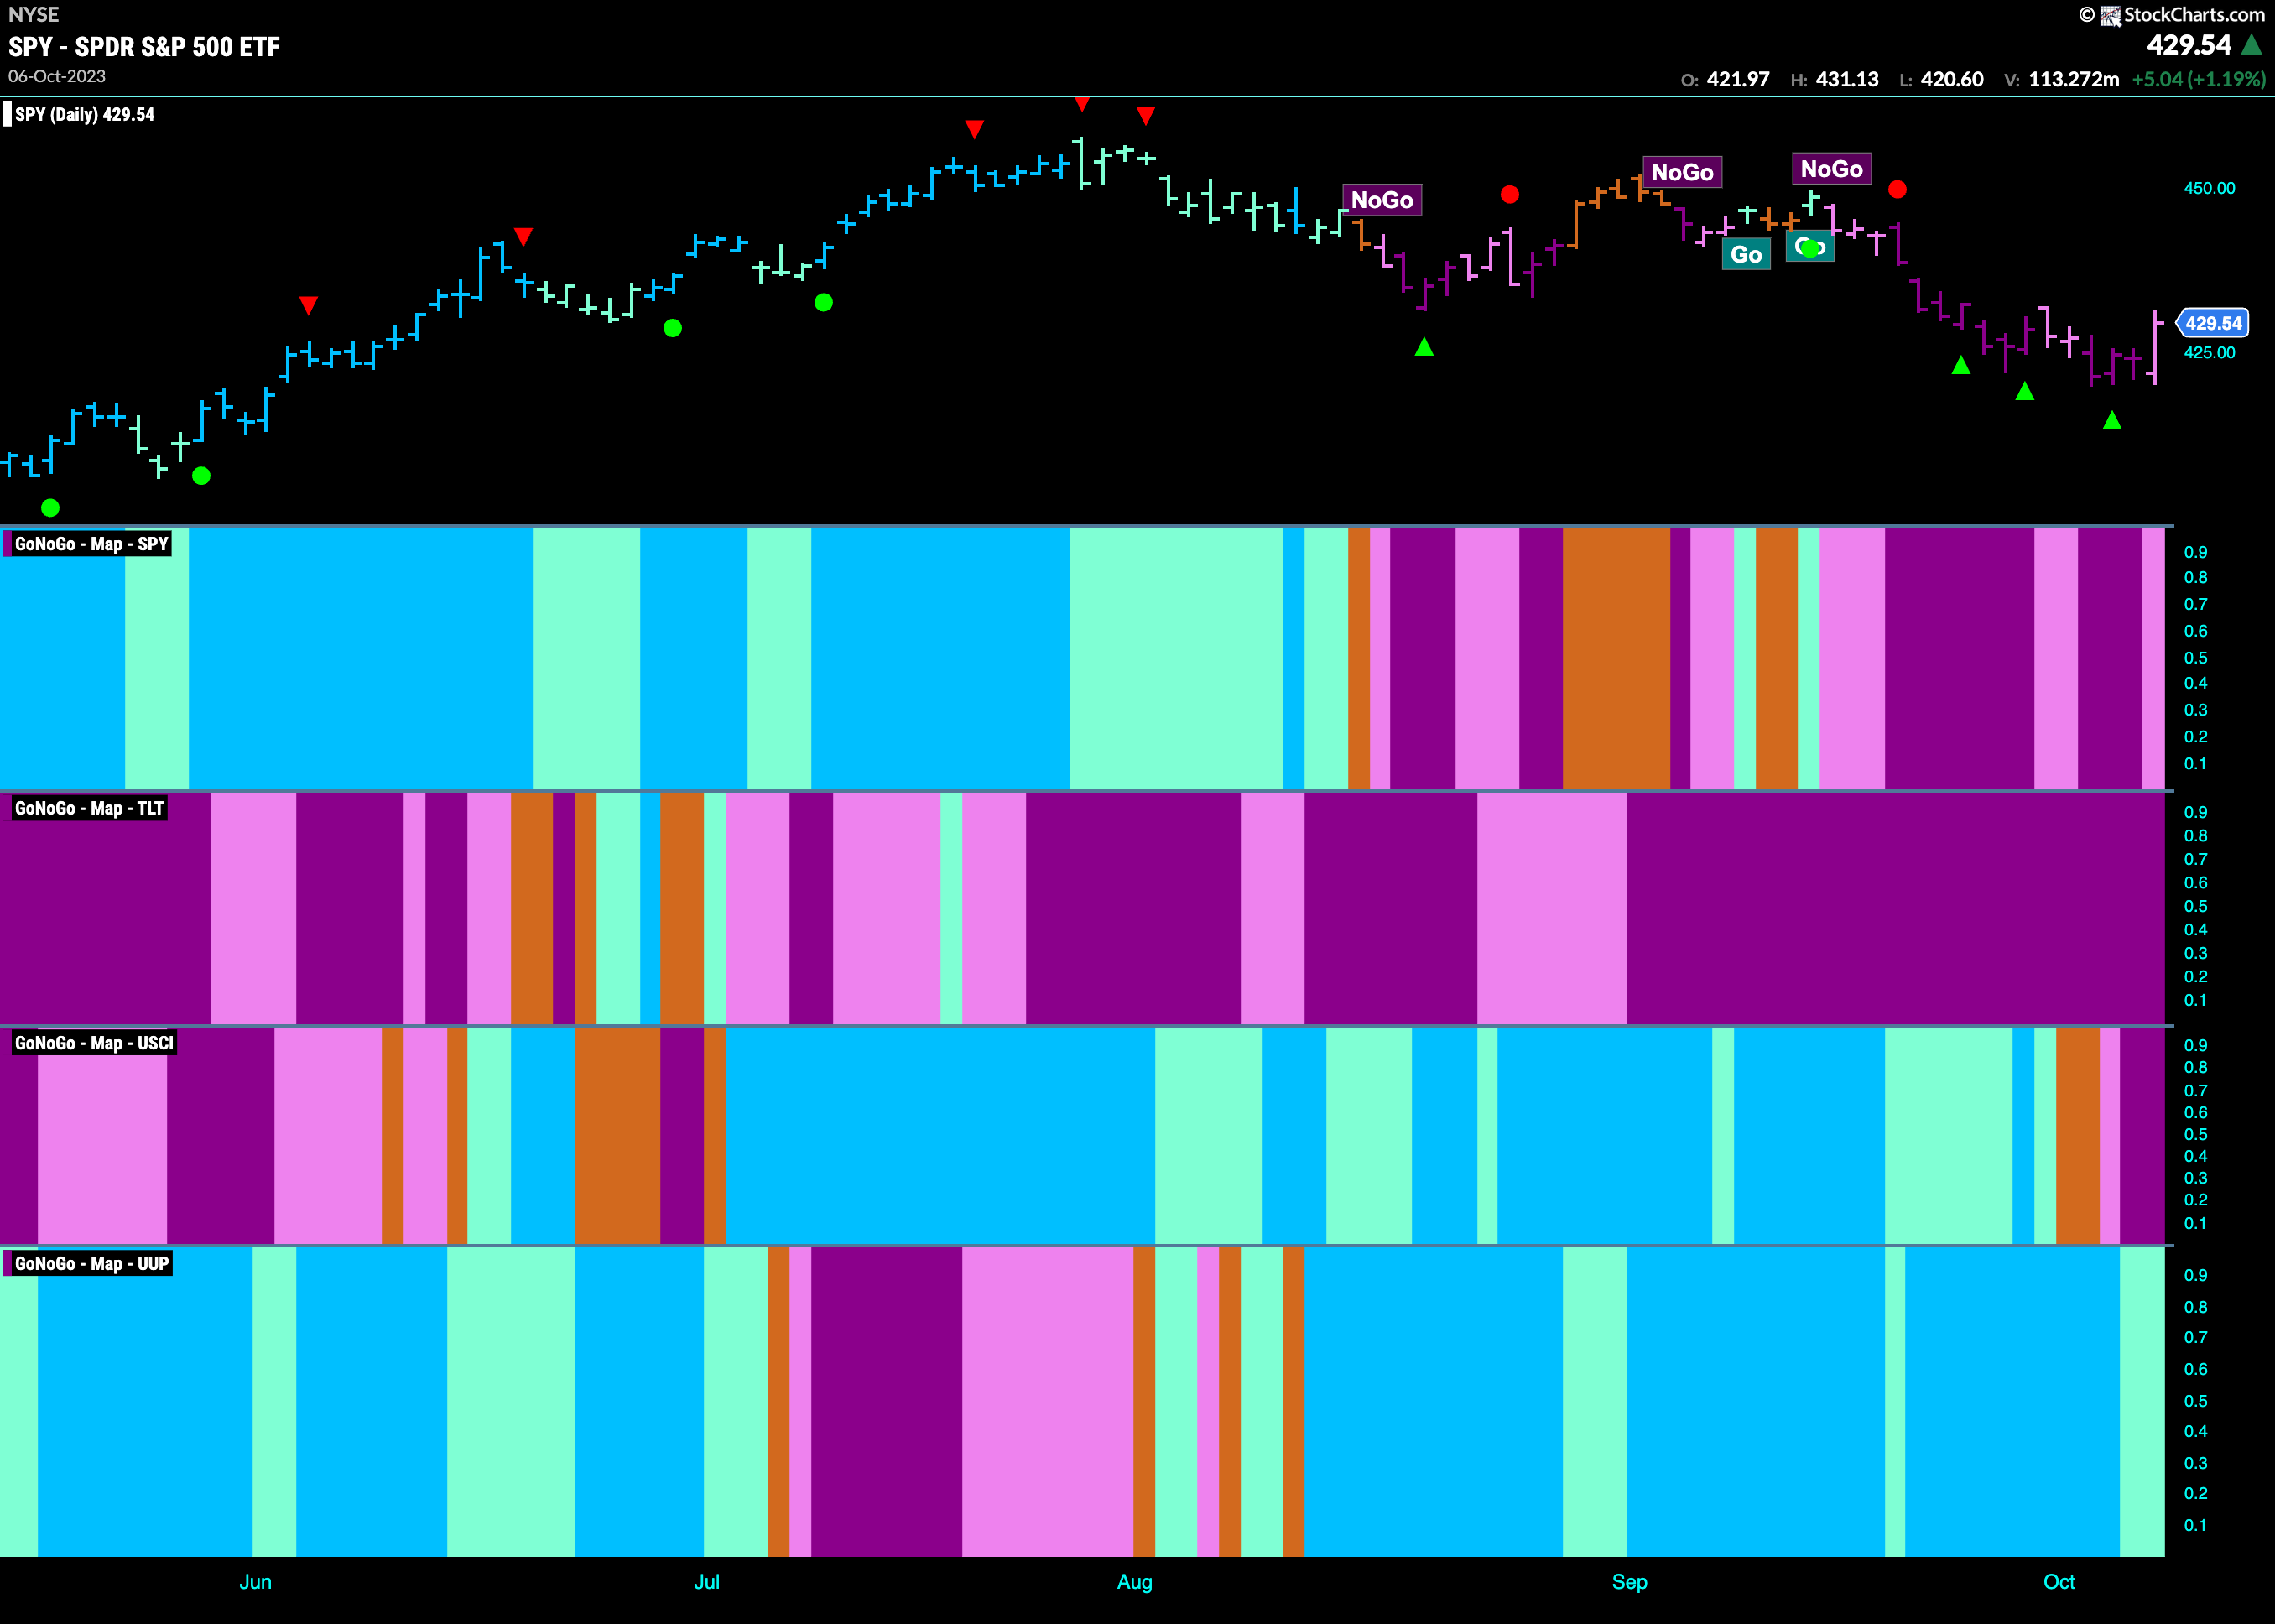
Equities Rally after Another Low
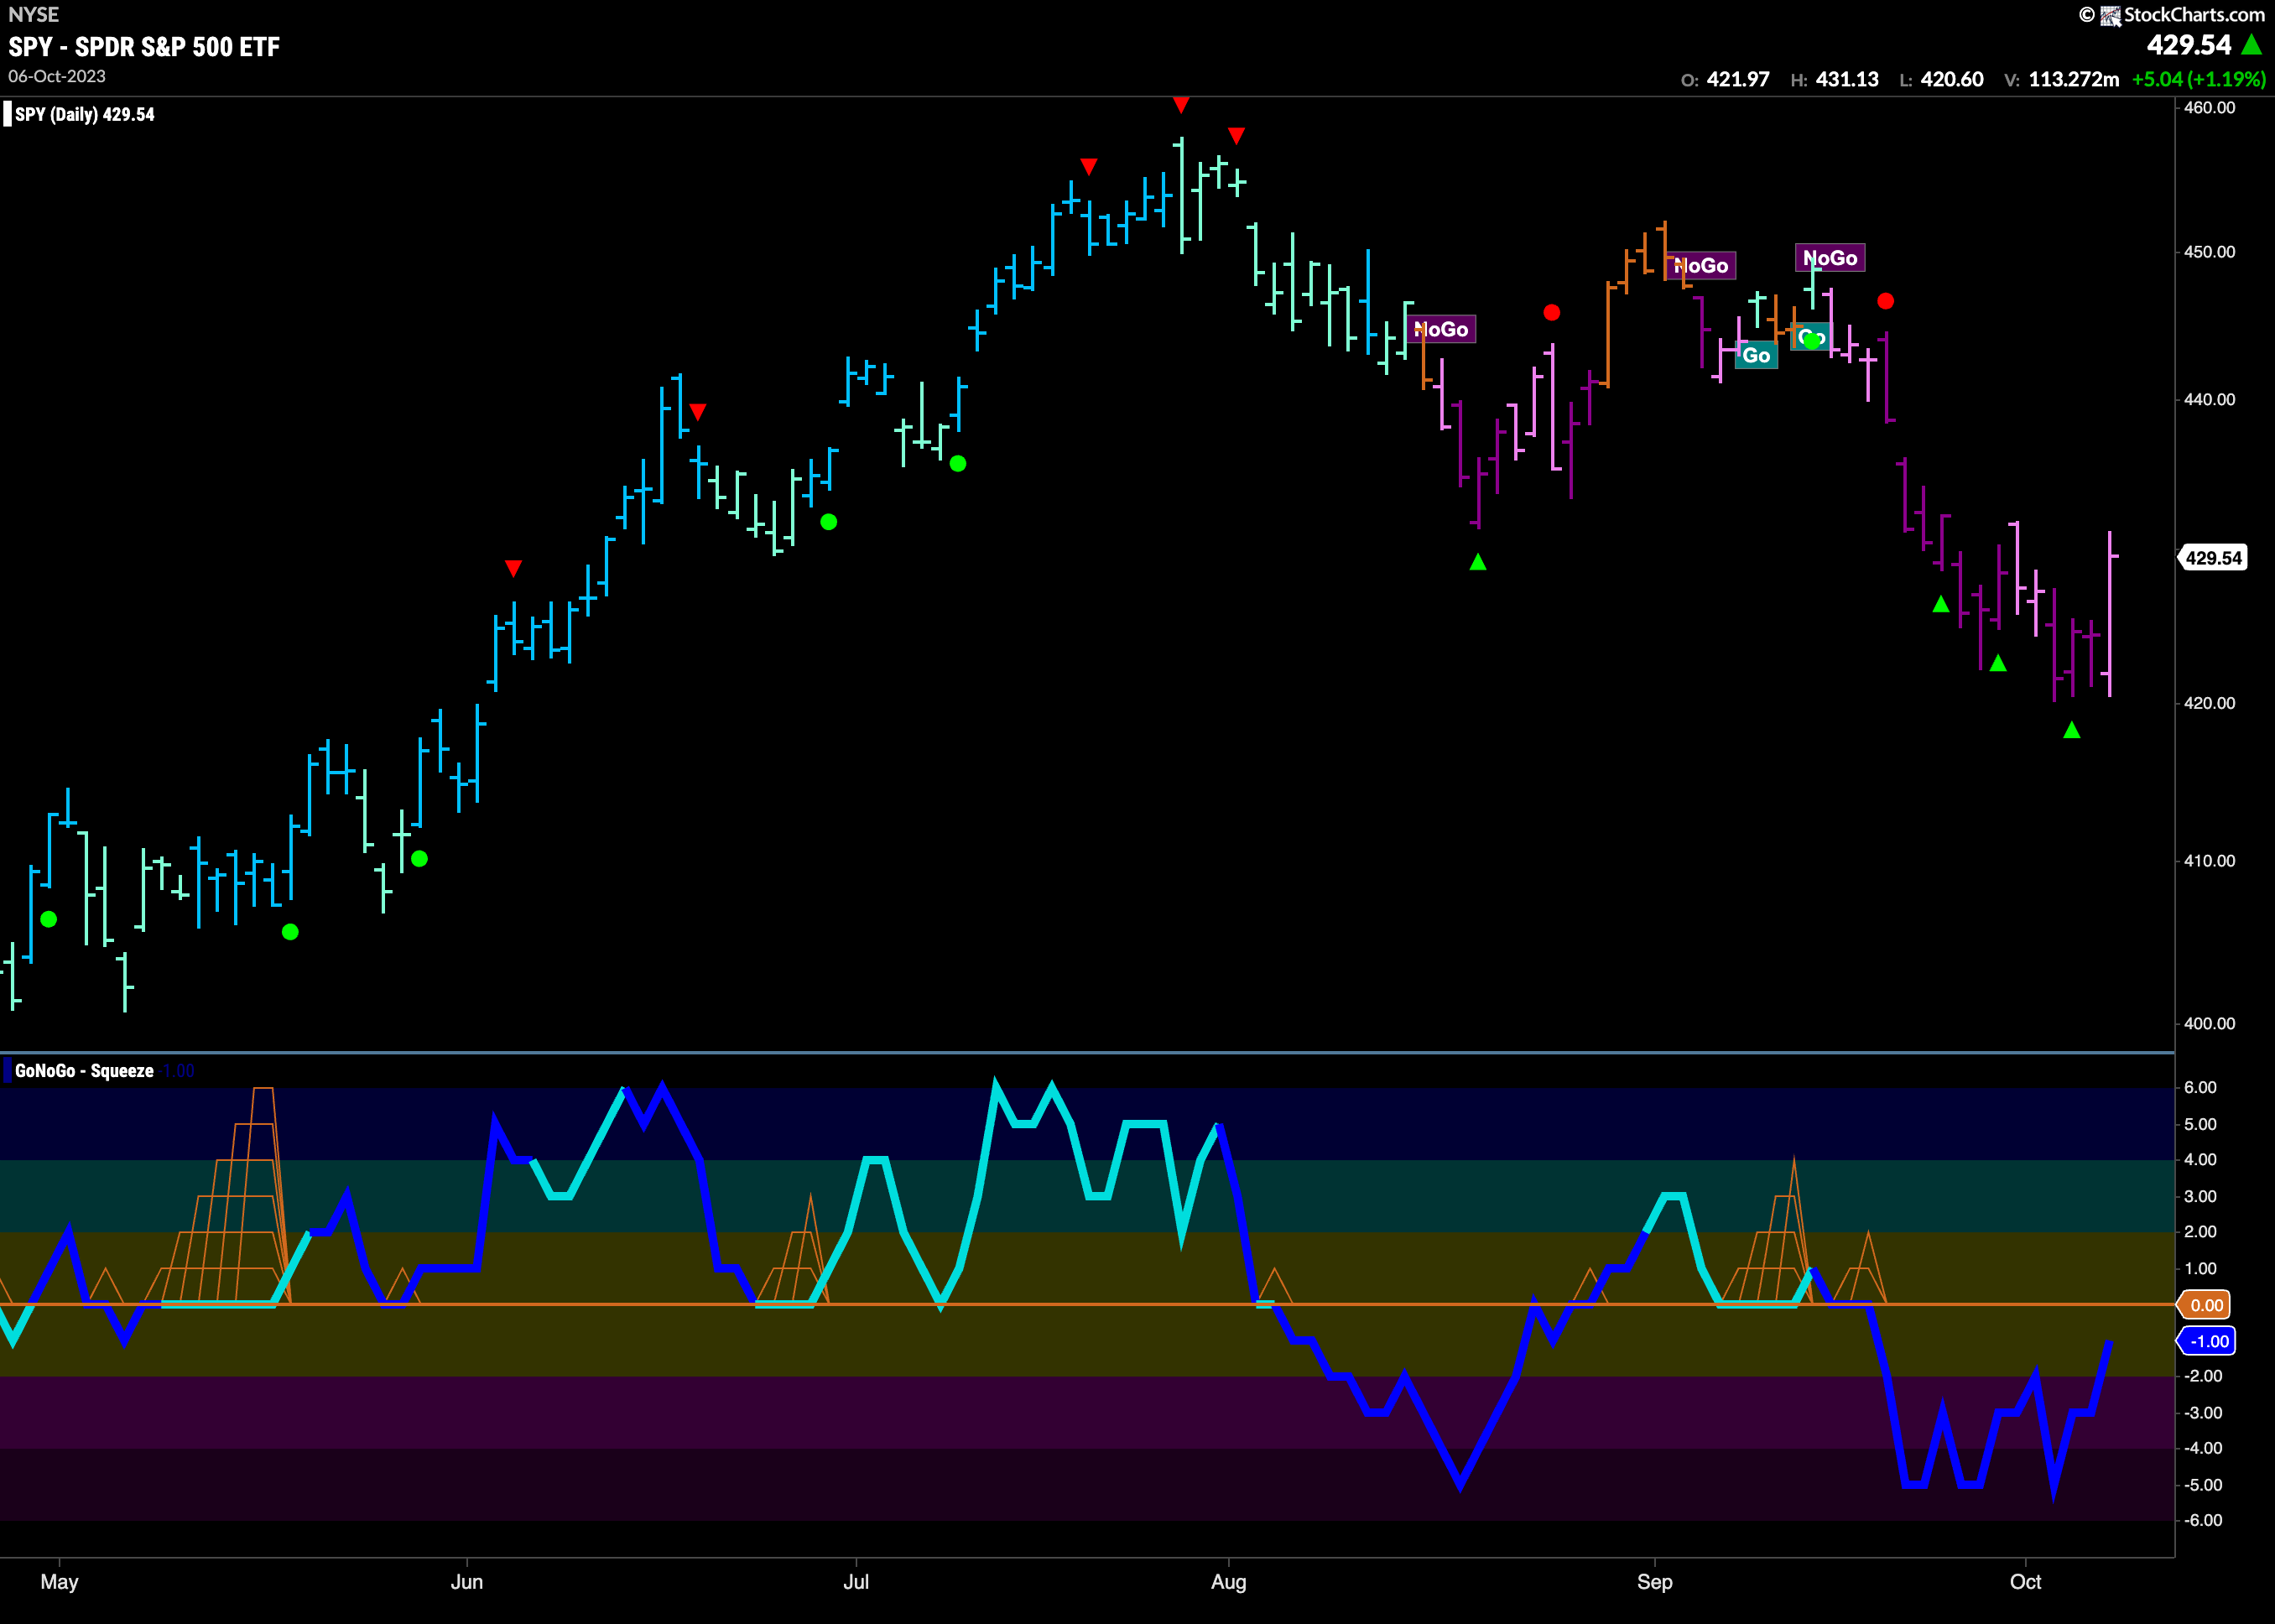
GoNoGo Trend painted mostly purple “NoGo” bars this week as we hit another mid-week low. There was a strong rally on Friday which has provided some relief with support coming in from levels we’ll see on the longer term chart. GoNoGo Oscillator is still in negative territory but rising toward the zero line where we will watch to see if it finds resistance.
The longer term weekly chart shows why buyers came in at the end of the week. Strong support at 4200 levels from last summer. We will see if this holds going forward. Worryingly, when we look at the lower panel we see that GoNoGo Oscillator has broken out of a small GoNoGo Squeeze into negative territory which tells us that for the moment momentum is out of sync with the trend. We will look to see if the oscillator can return to zero or back into positive territory before the trend changes in the panel above.
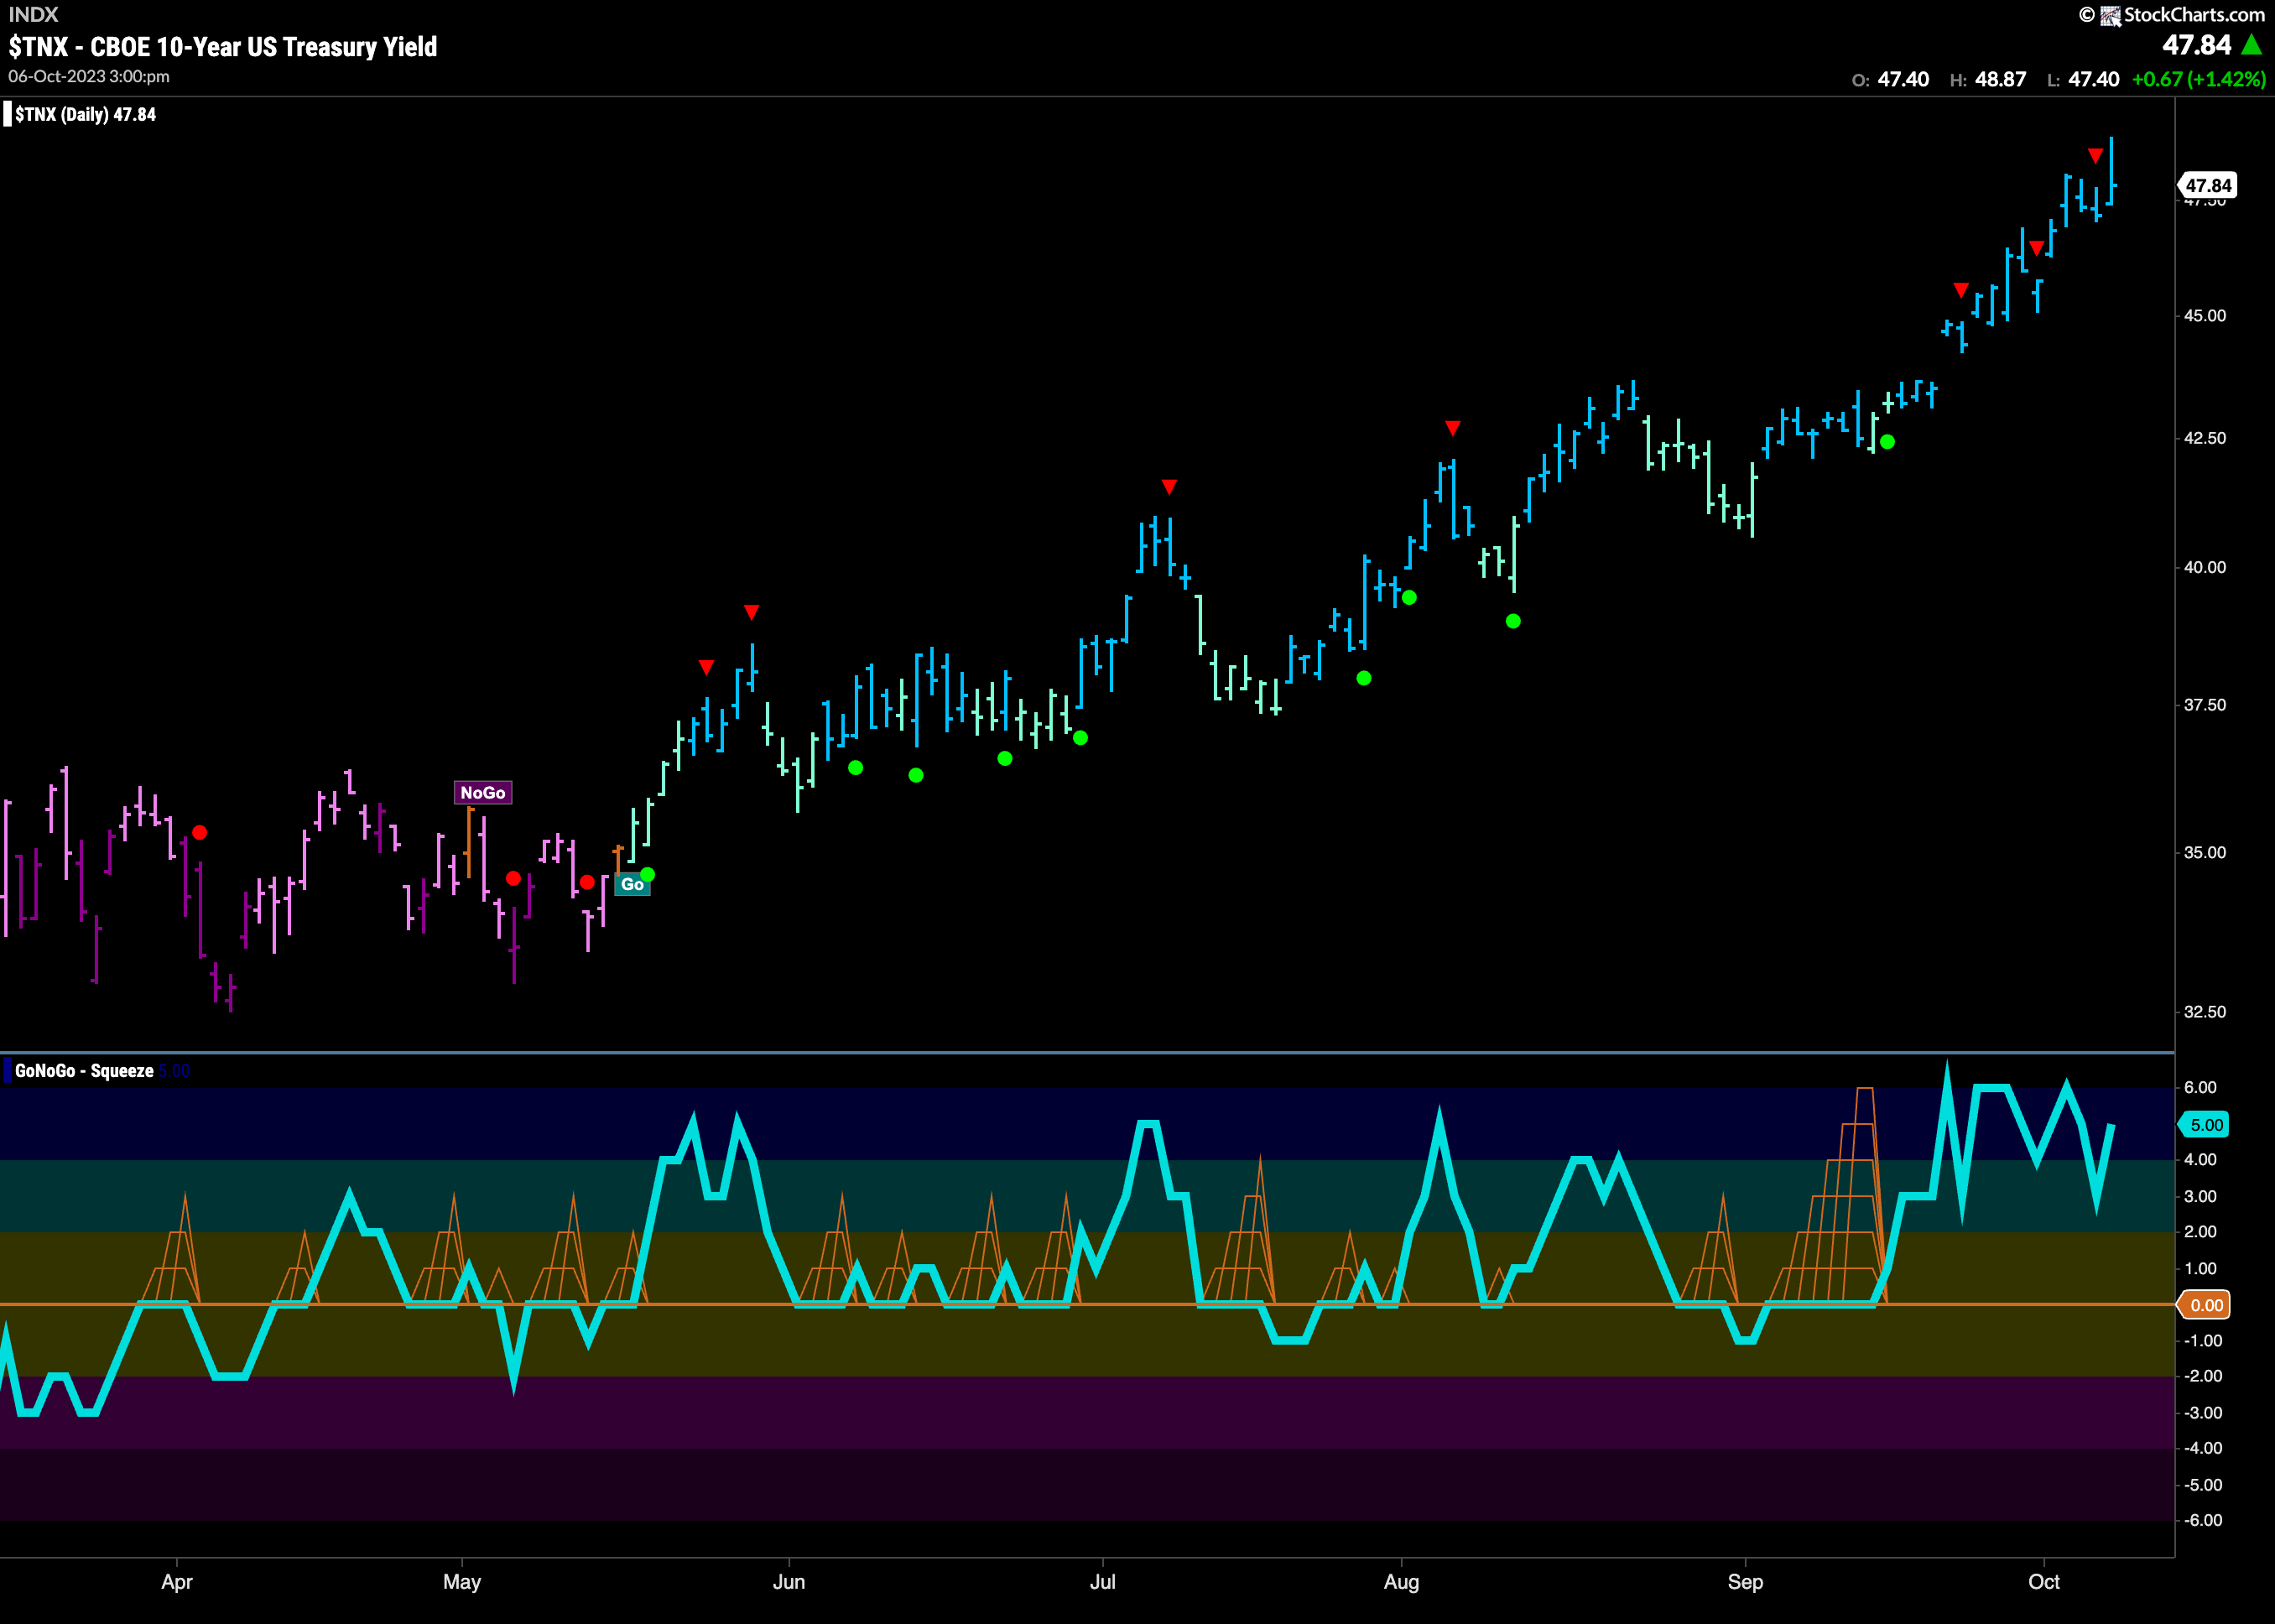
Treasury Rates No Signs of Slowing
Treasury rates hit another higher high this week as GoNoGo Trend painted more strong blue “Go” bars. Even a Go Countertrend did nothing yet to slow down the trend. GoNoGo Oscillator is in positive territory and rising again showing that momentum is supporting the “Go” trend as it climbs higher.
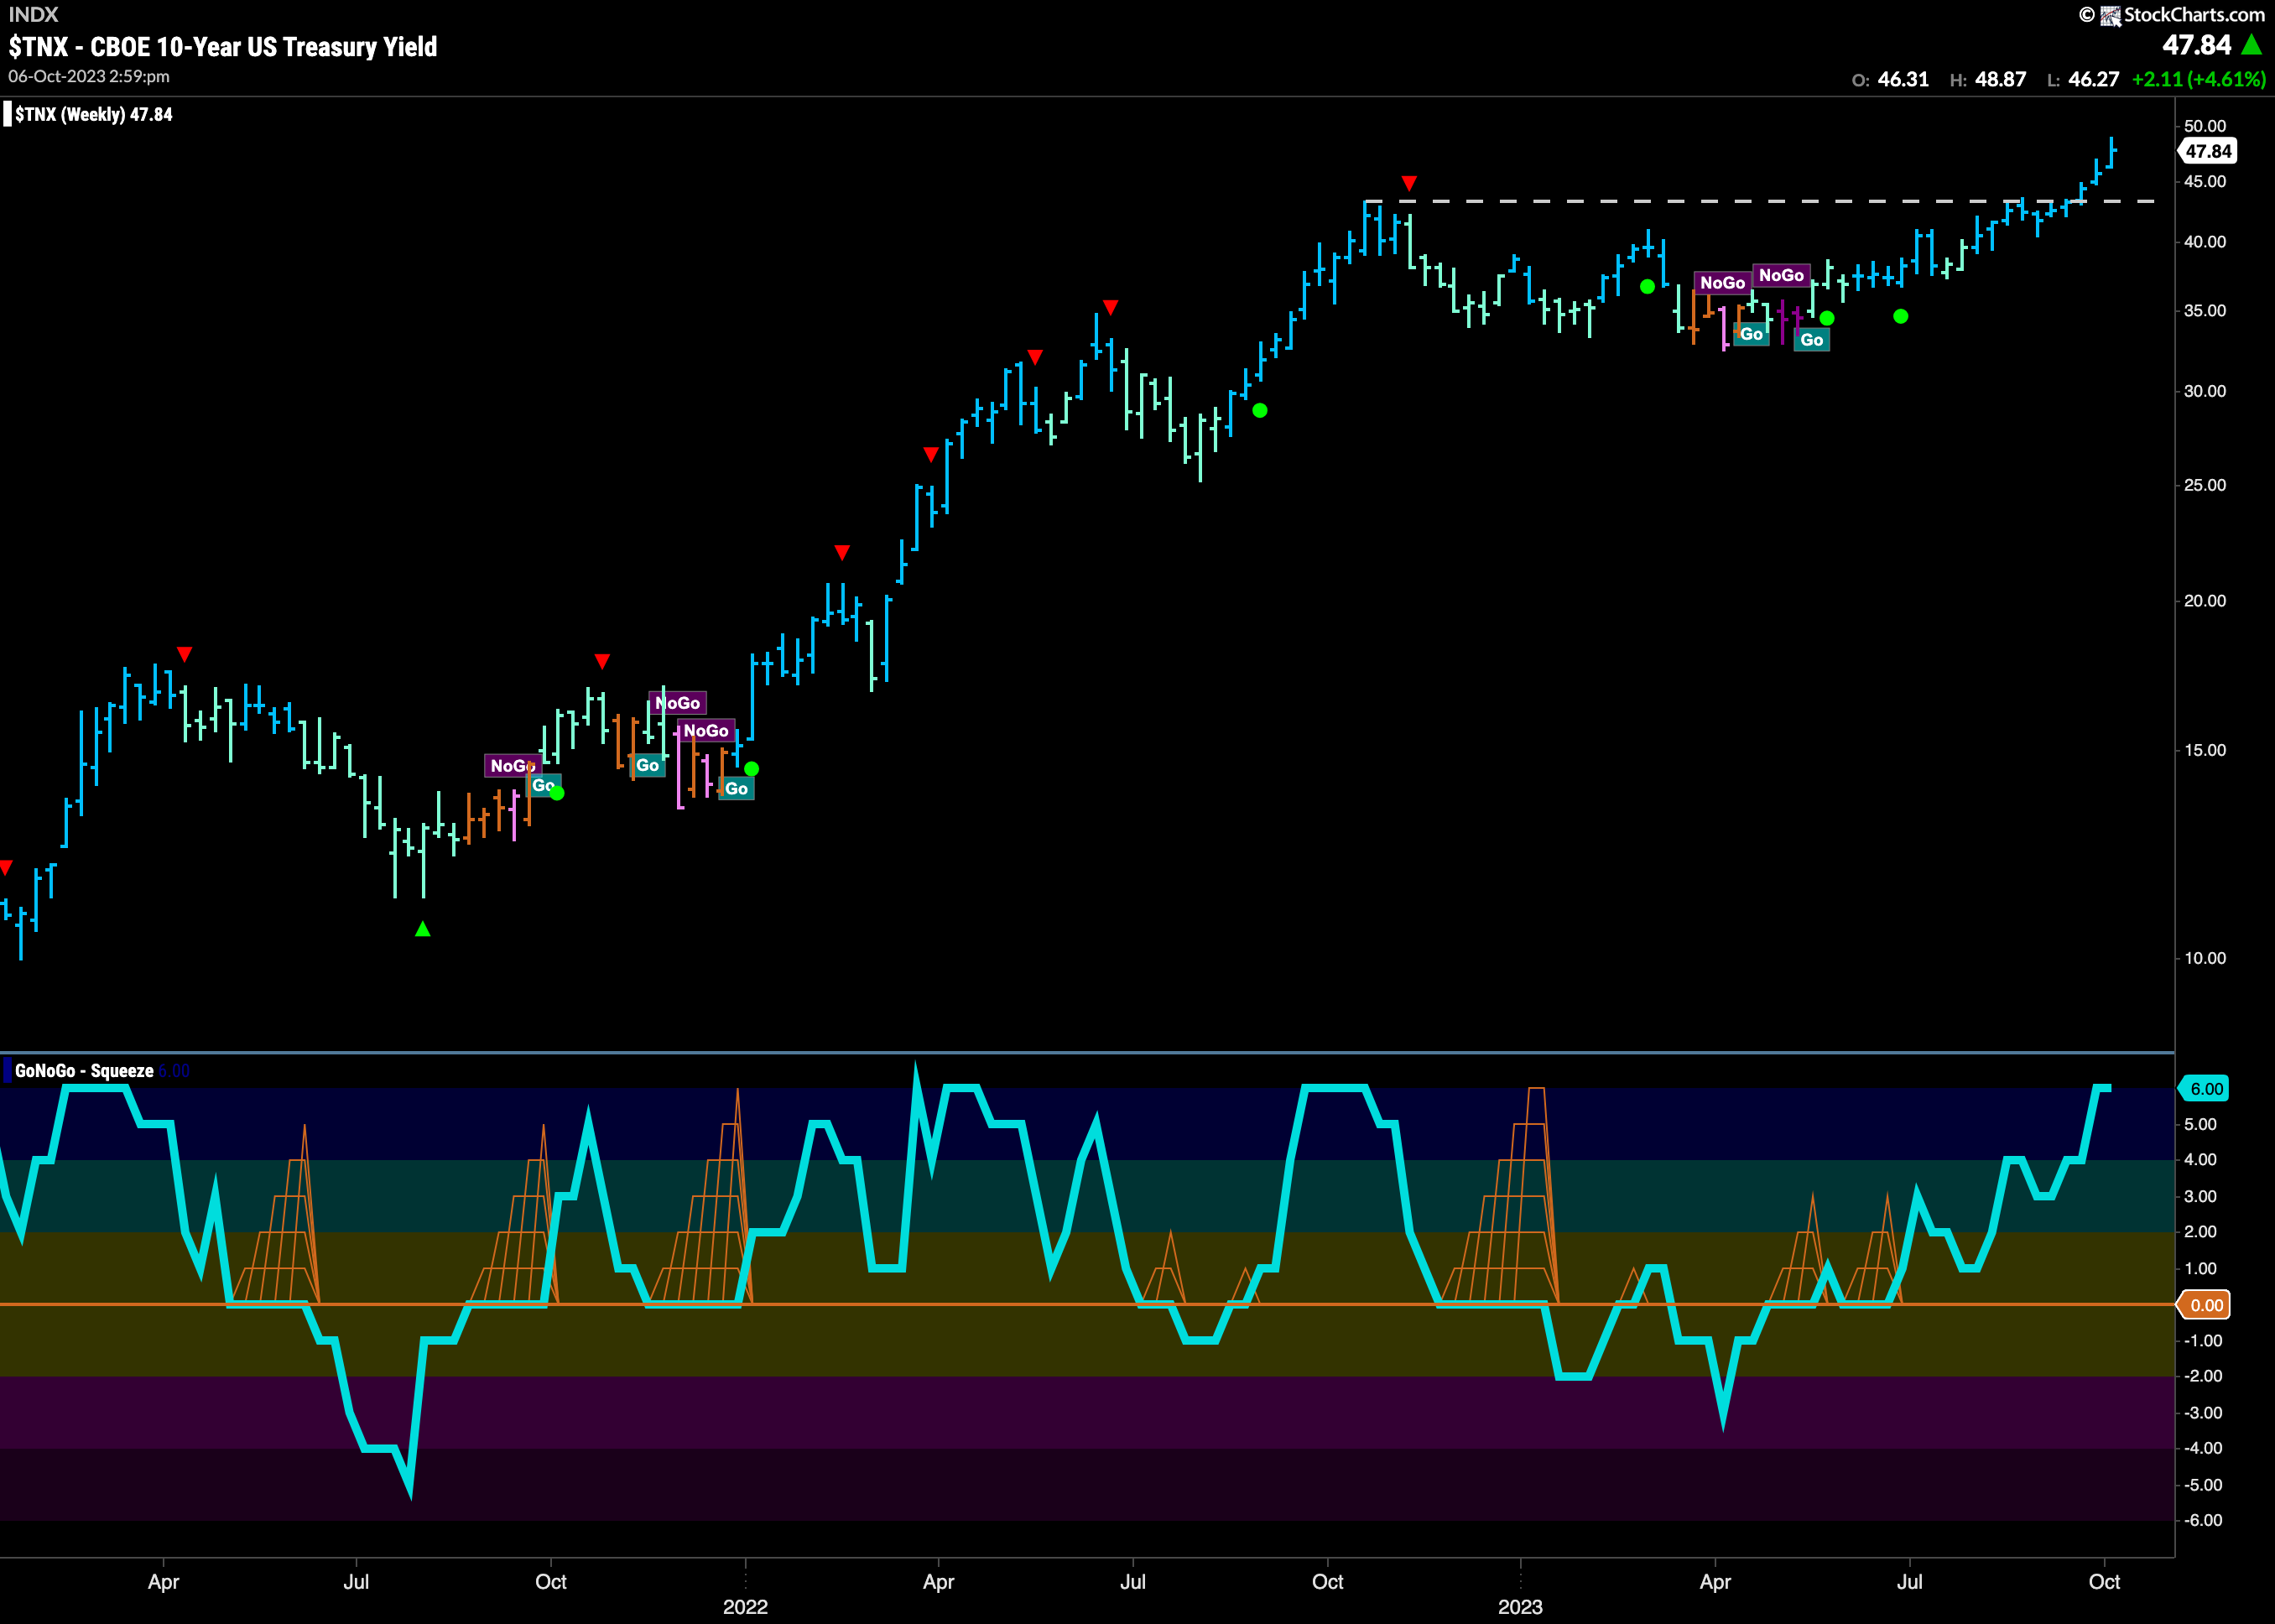
The weekly chart shows the “Go” trend established itself well above old resistance. We can expect this level to act as support now going forward. GoNoGo Trend painted another strong blue “Go” bar last week at another higher weekly close. GoNoGo Oscillator is at an overbought extreme and so we will watch to see if that momentum cools over the next few weeks.
Dollar Falls Away from Another Higher High
The dollar continues to climb as well with another higher high being hit early last week. Since then, we have seen a Go Countertrend Correction Icon (red arrow) indicating that price may struggle to go much higher in the short term. This is indeed what happened as price comes off the high and GoNoGo Trend paints a couple of weaker aqua bars. This has caused GoNoGo Oscillator to fall to test the zero line from above. We will watch closely at this level to see if support holds. If it does, and the oscillator is able to bounce back into positive territory we will see Go Trend Continuation (green circle) and expect price to make an attempt at a new high.

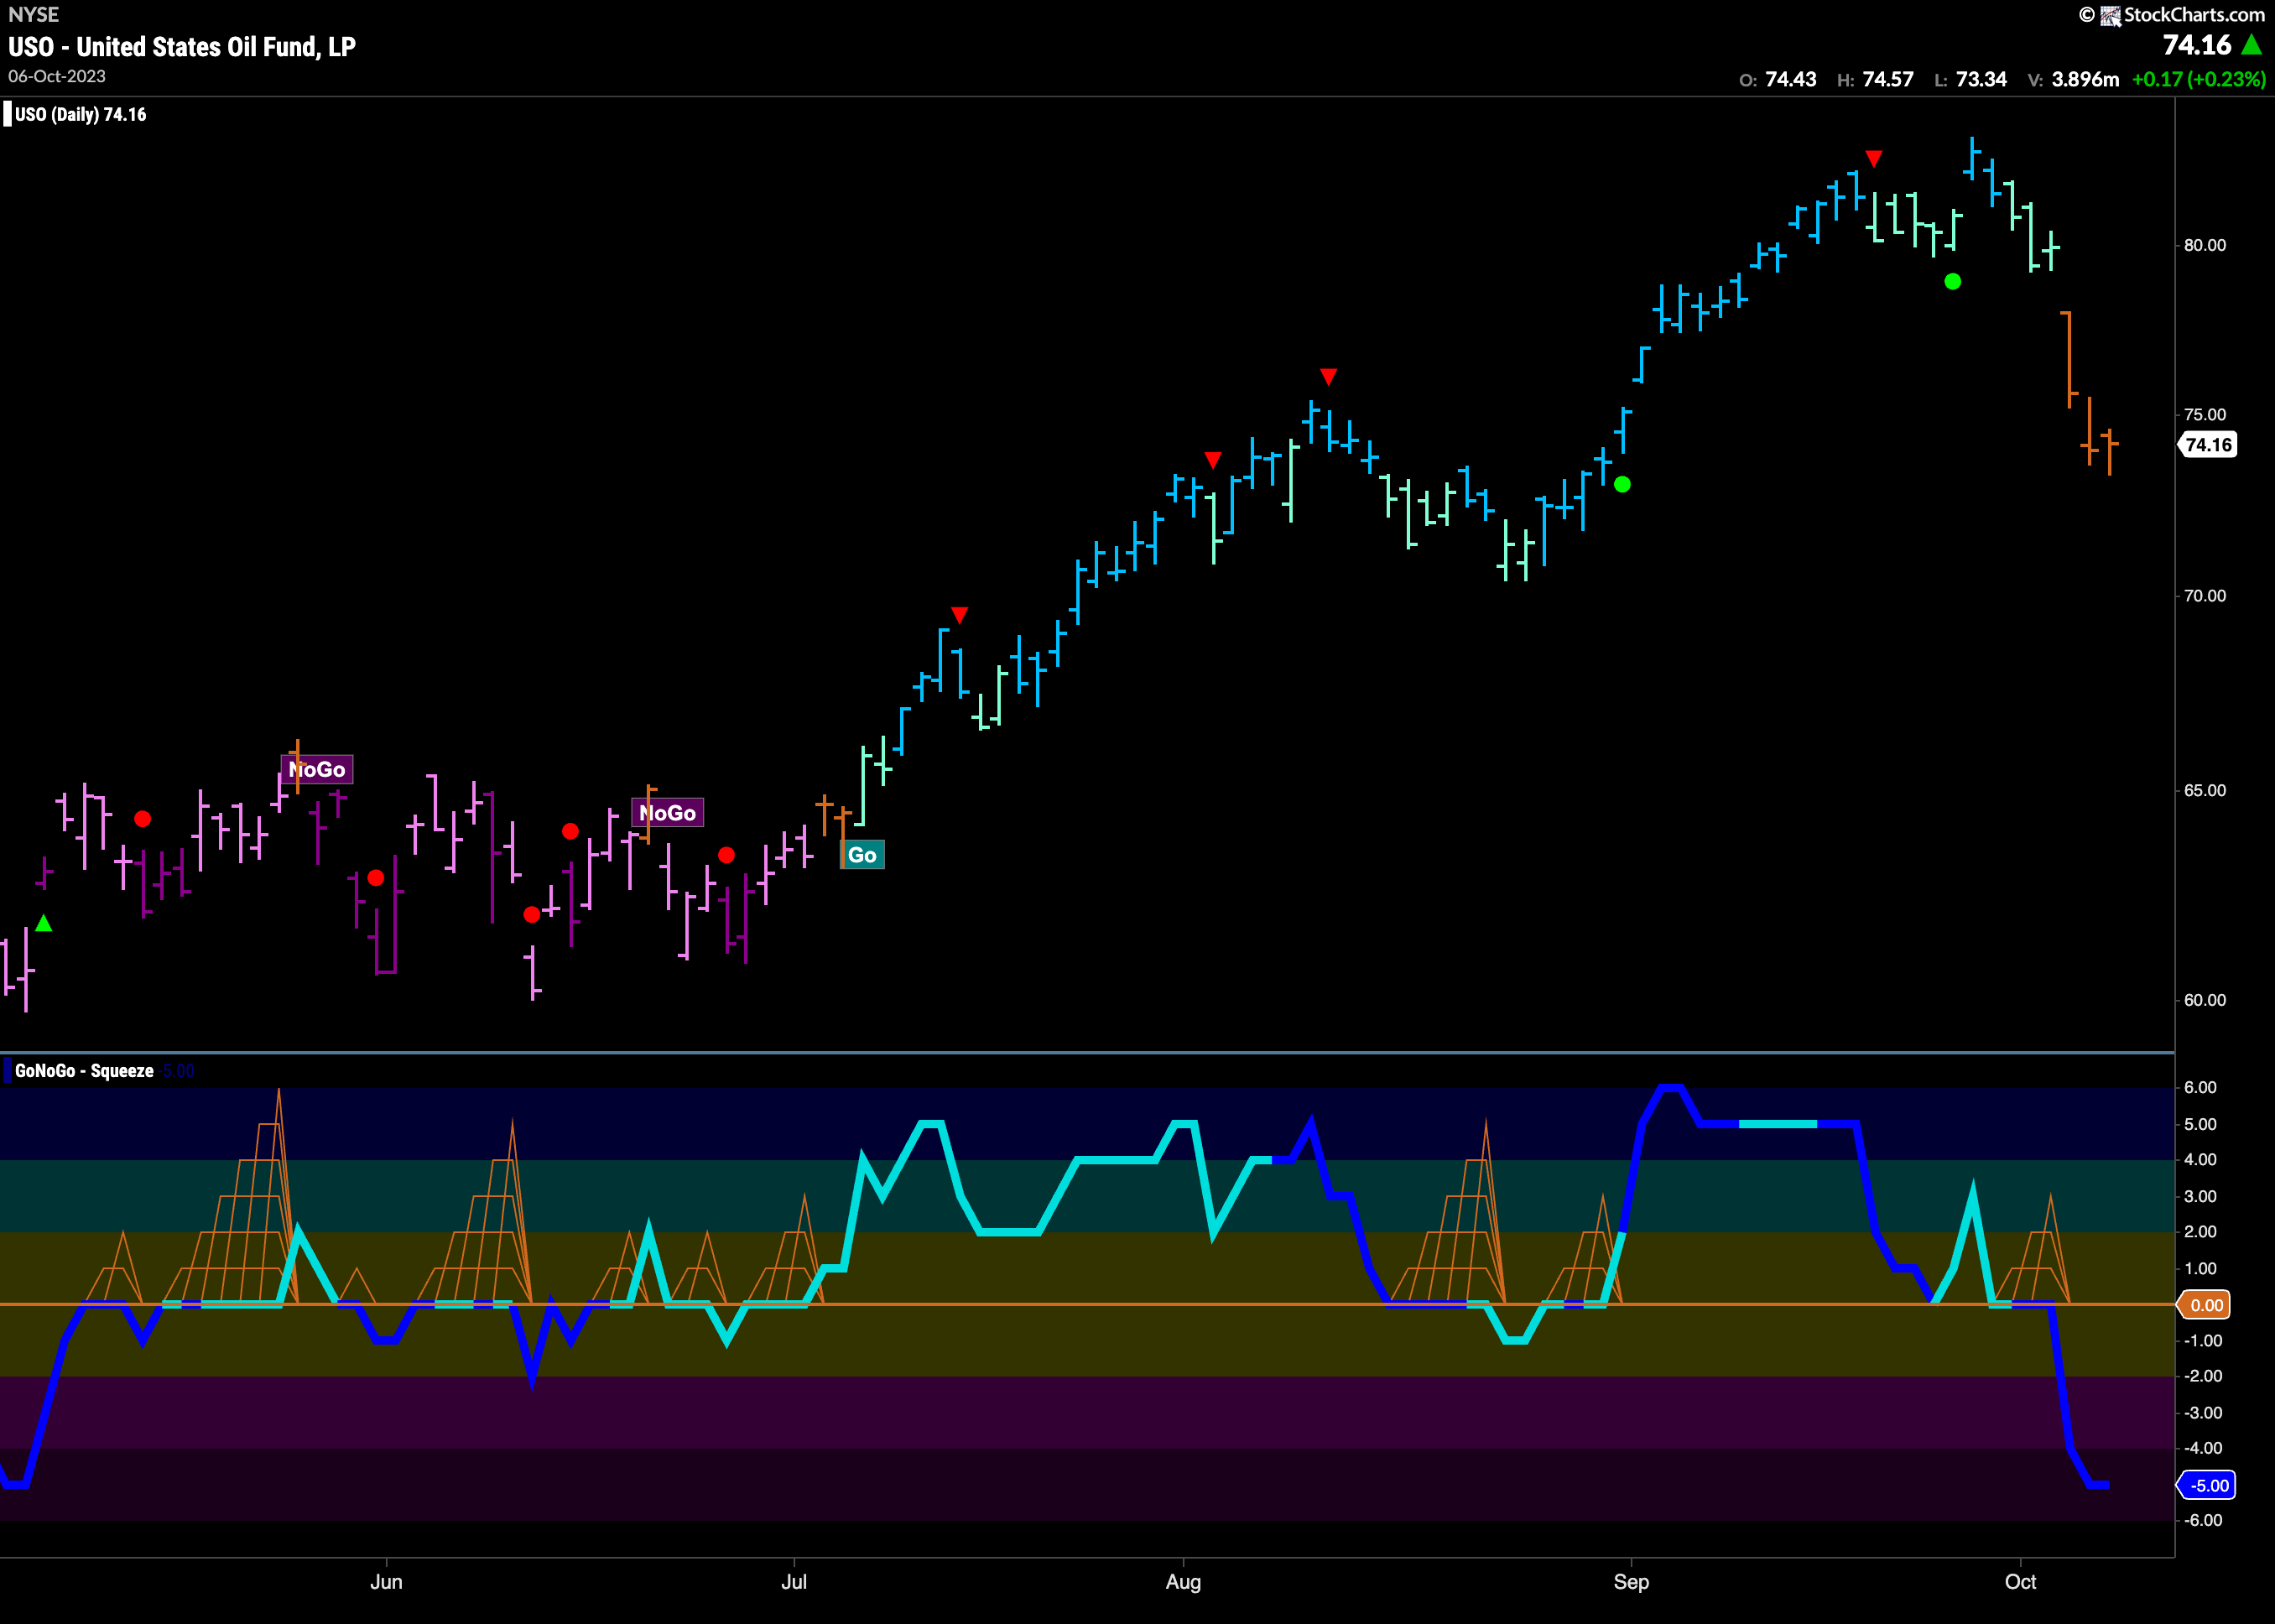
Oil Takes a Tumble
We saw a lot of weaker aqua bars after the Go Countertrend Correction Icon (red arrow) a couple of weeks ago. GoNoGo Oscillator at the same time fell to test the zero line from above where it tried to find support. Eventually, it couldn’t, and the oscillator crashed into negative territory on heavy volume. Price continued to fall and now we see GoNoGo Trend painting a string of amber “Go Fish” bars.
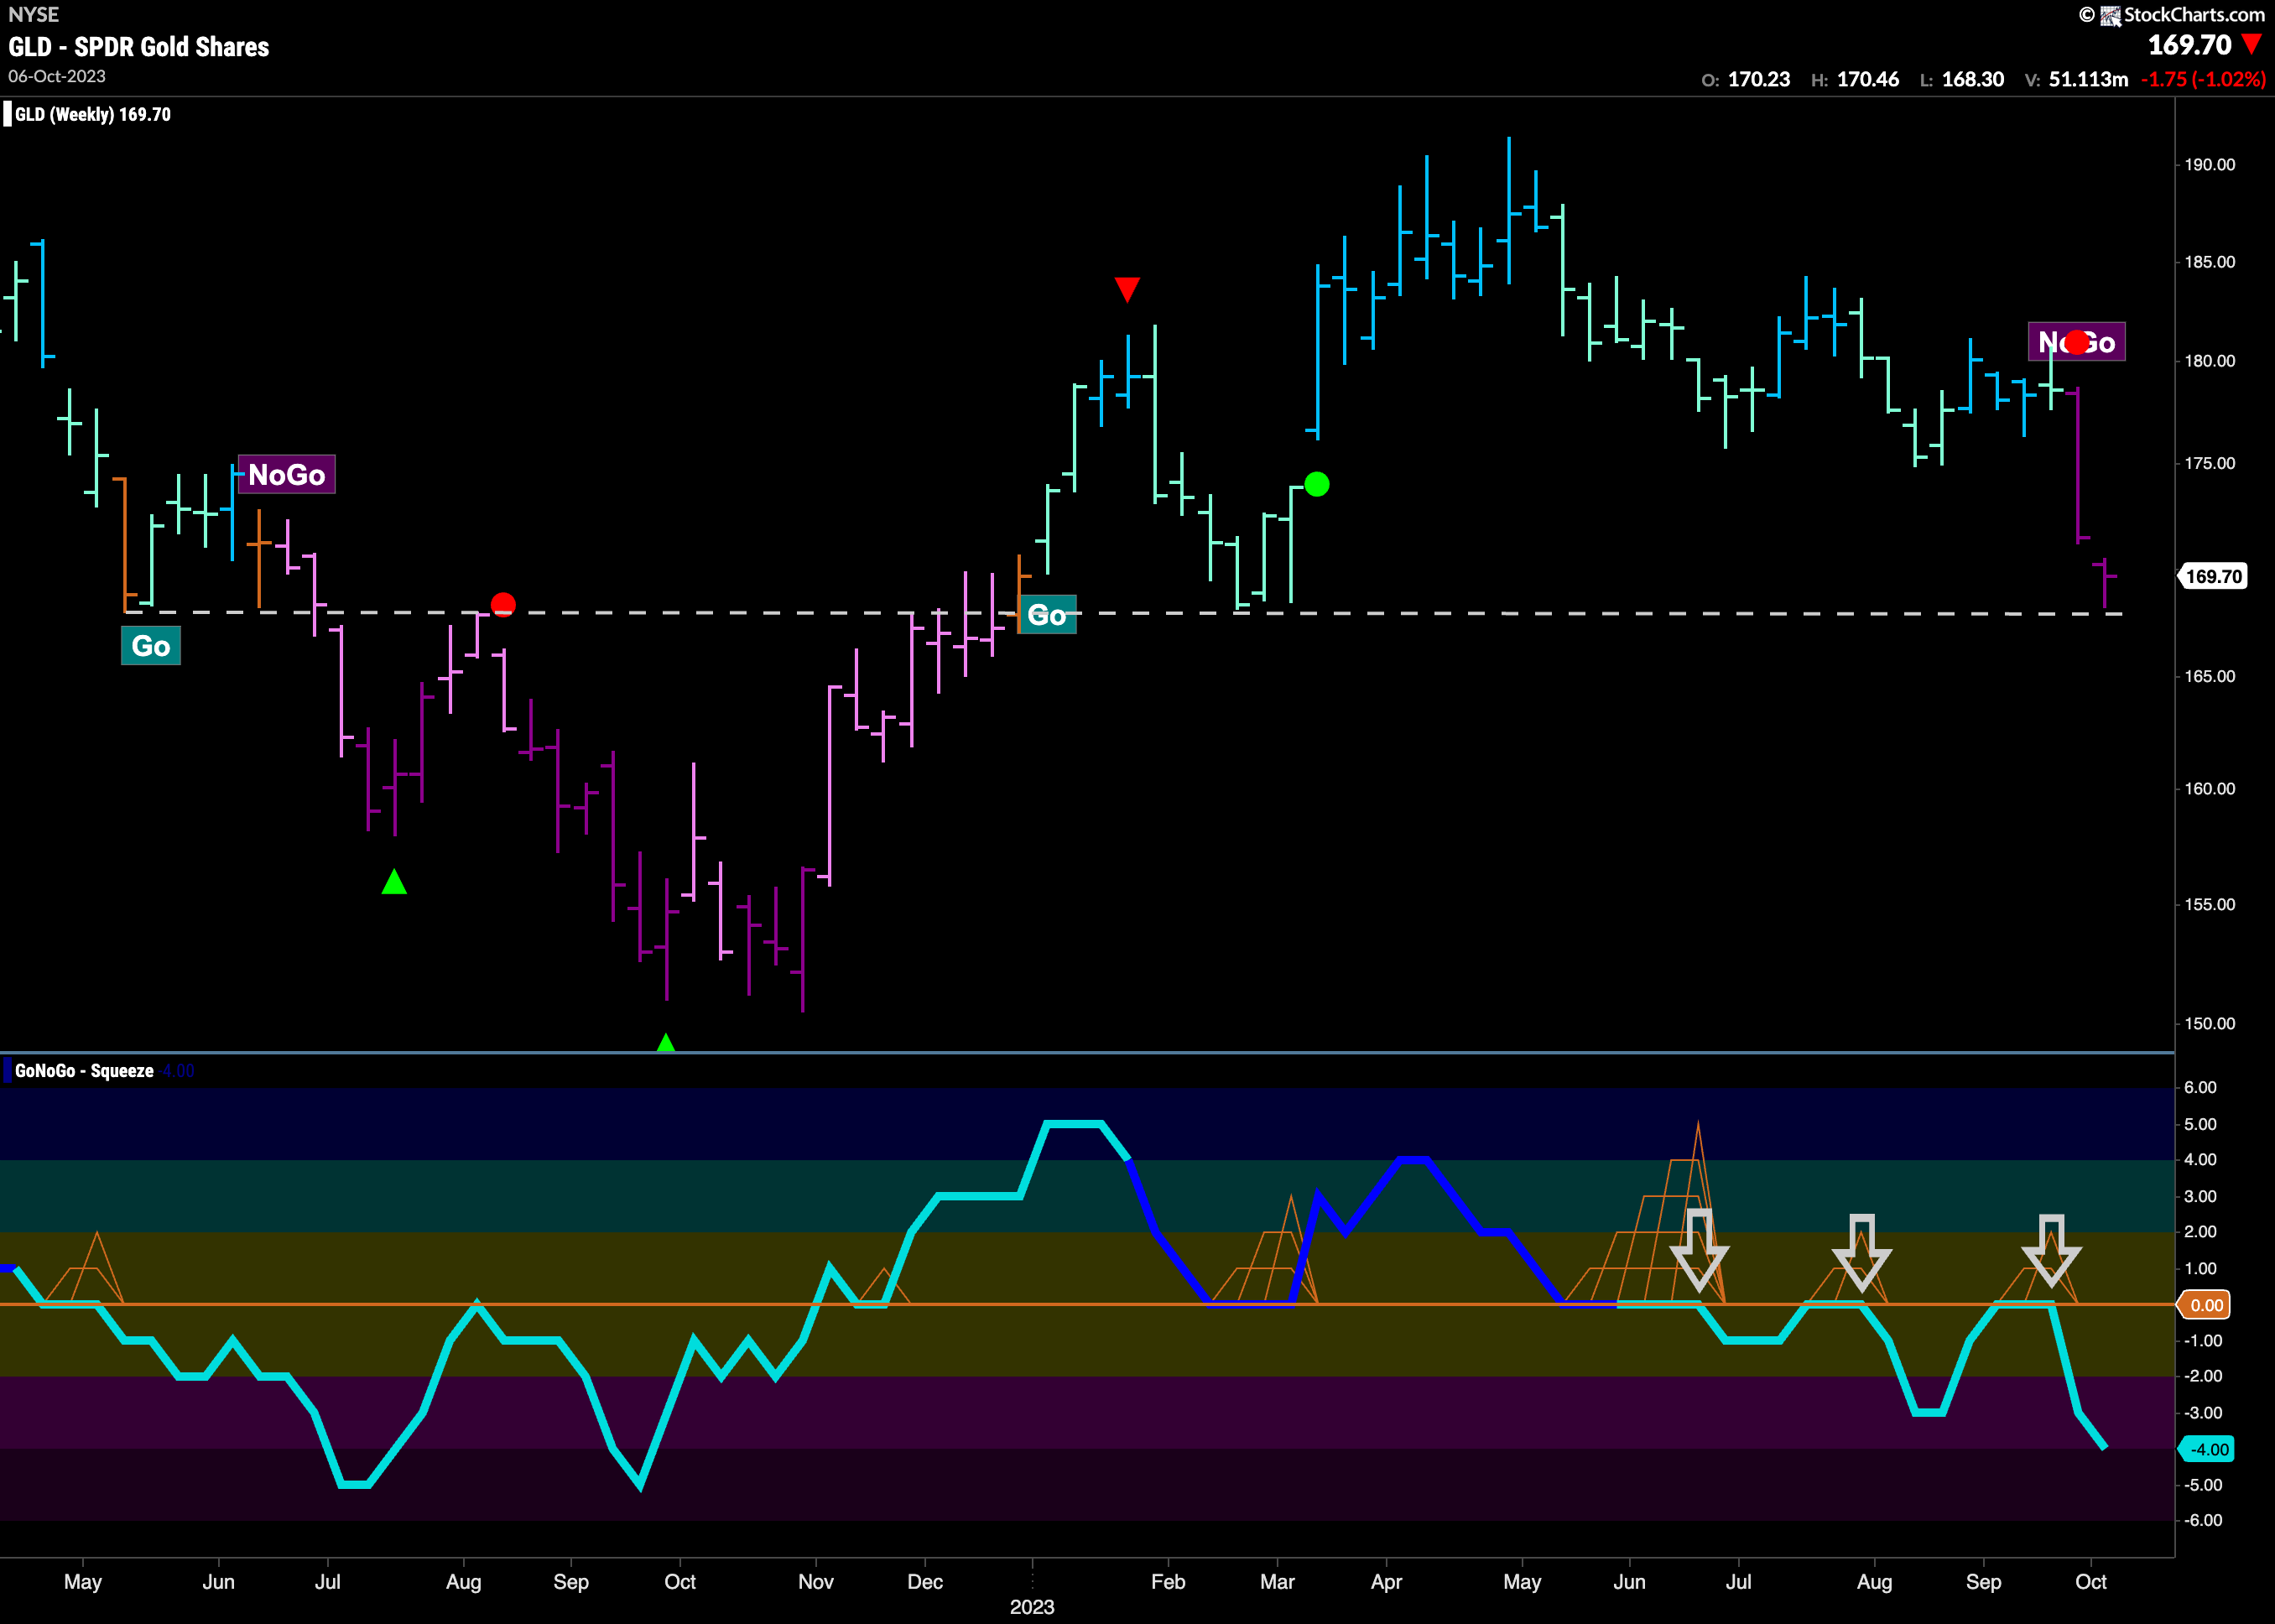
Gold Falls to Long Term Support
Last week we looked at the daily chart of Gold and noted the descending triangle that it was breaking out of to the downside. Prices fell further this week and the weekly chart below shows just how far. Now in a strong “NoGo” trend, prices have fallen to test support from prior lows as seen by the horizontal level drawn on the chart. Failure to hold here would suggest price can go much lower. Note in the lower panel the leading indication of price struggles as GoNoGo Oscillator was repeatedly turned away from the zero line back into negative territory.
Sector RelMap
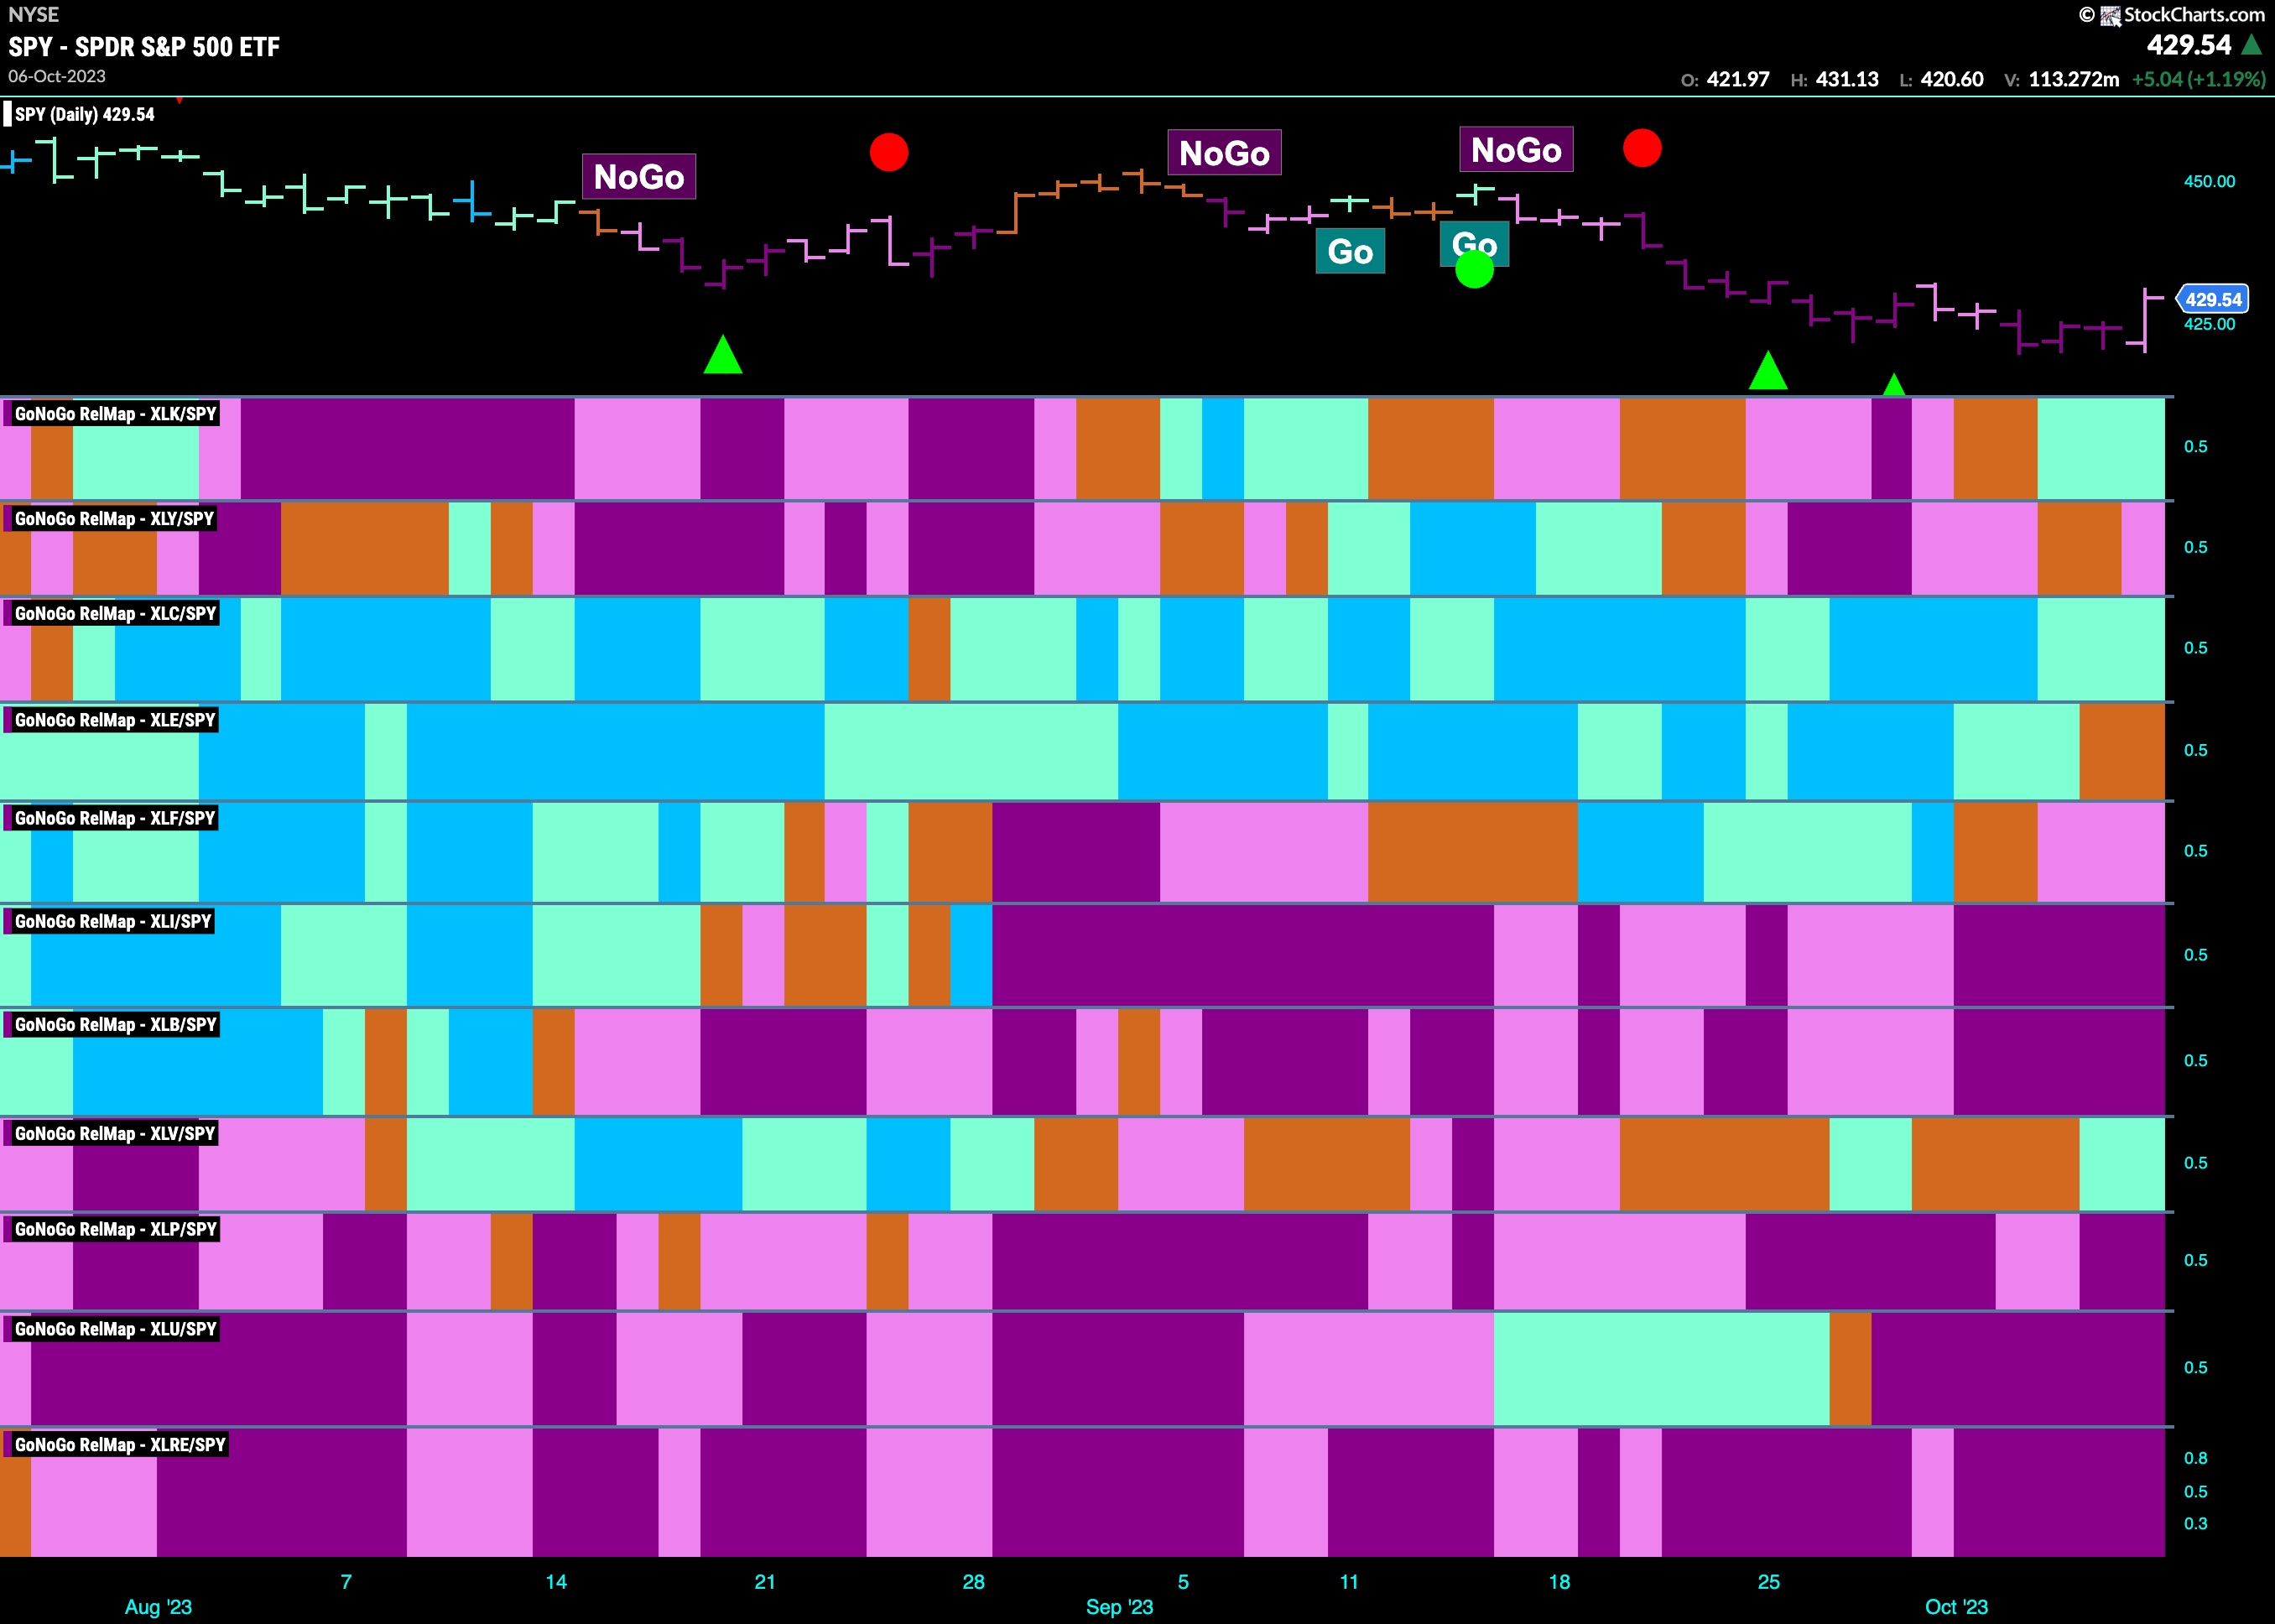
Below is the GoNoGo Sector RelMap. This GoNoGo RelMap applies the GoNoGo Trend to the relative strength ratios of the sectors to the base index. Looking at this map, we can quickly see where the relative outperformance is coming from as well as which sectors are lagging on a relative basis. 3 sectors are outperforming the base index this week. $XLK, $XLC, $XLE, and $XLV are painting “Go” bars.
Communications Sub-Group RelMap
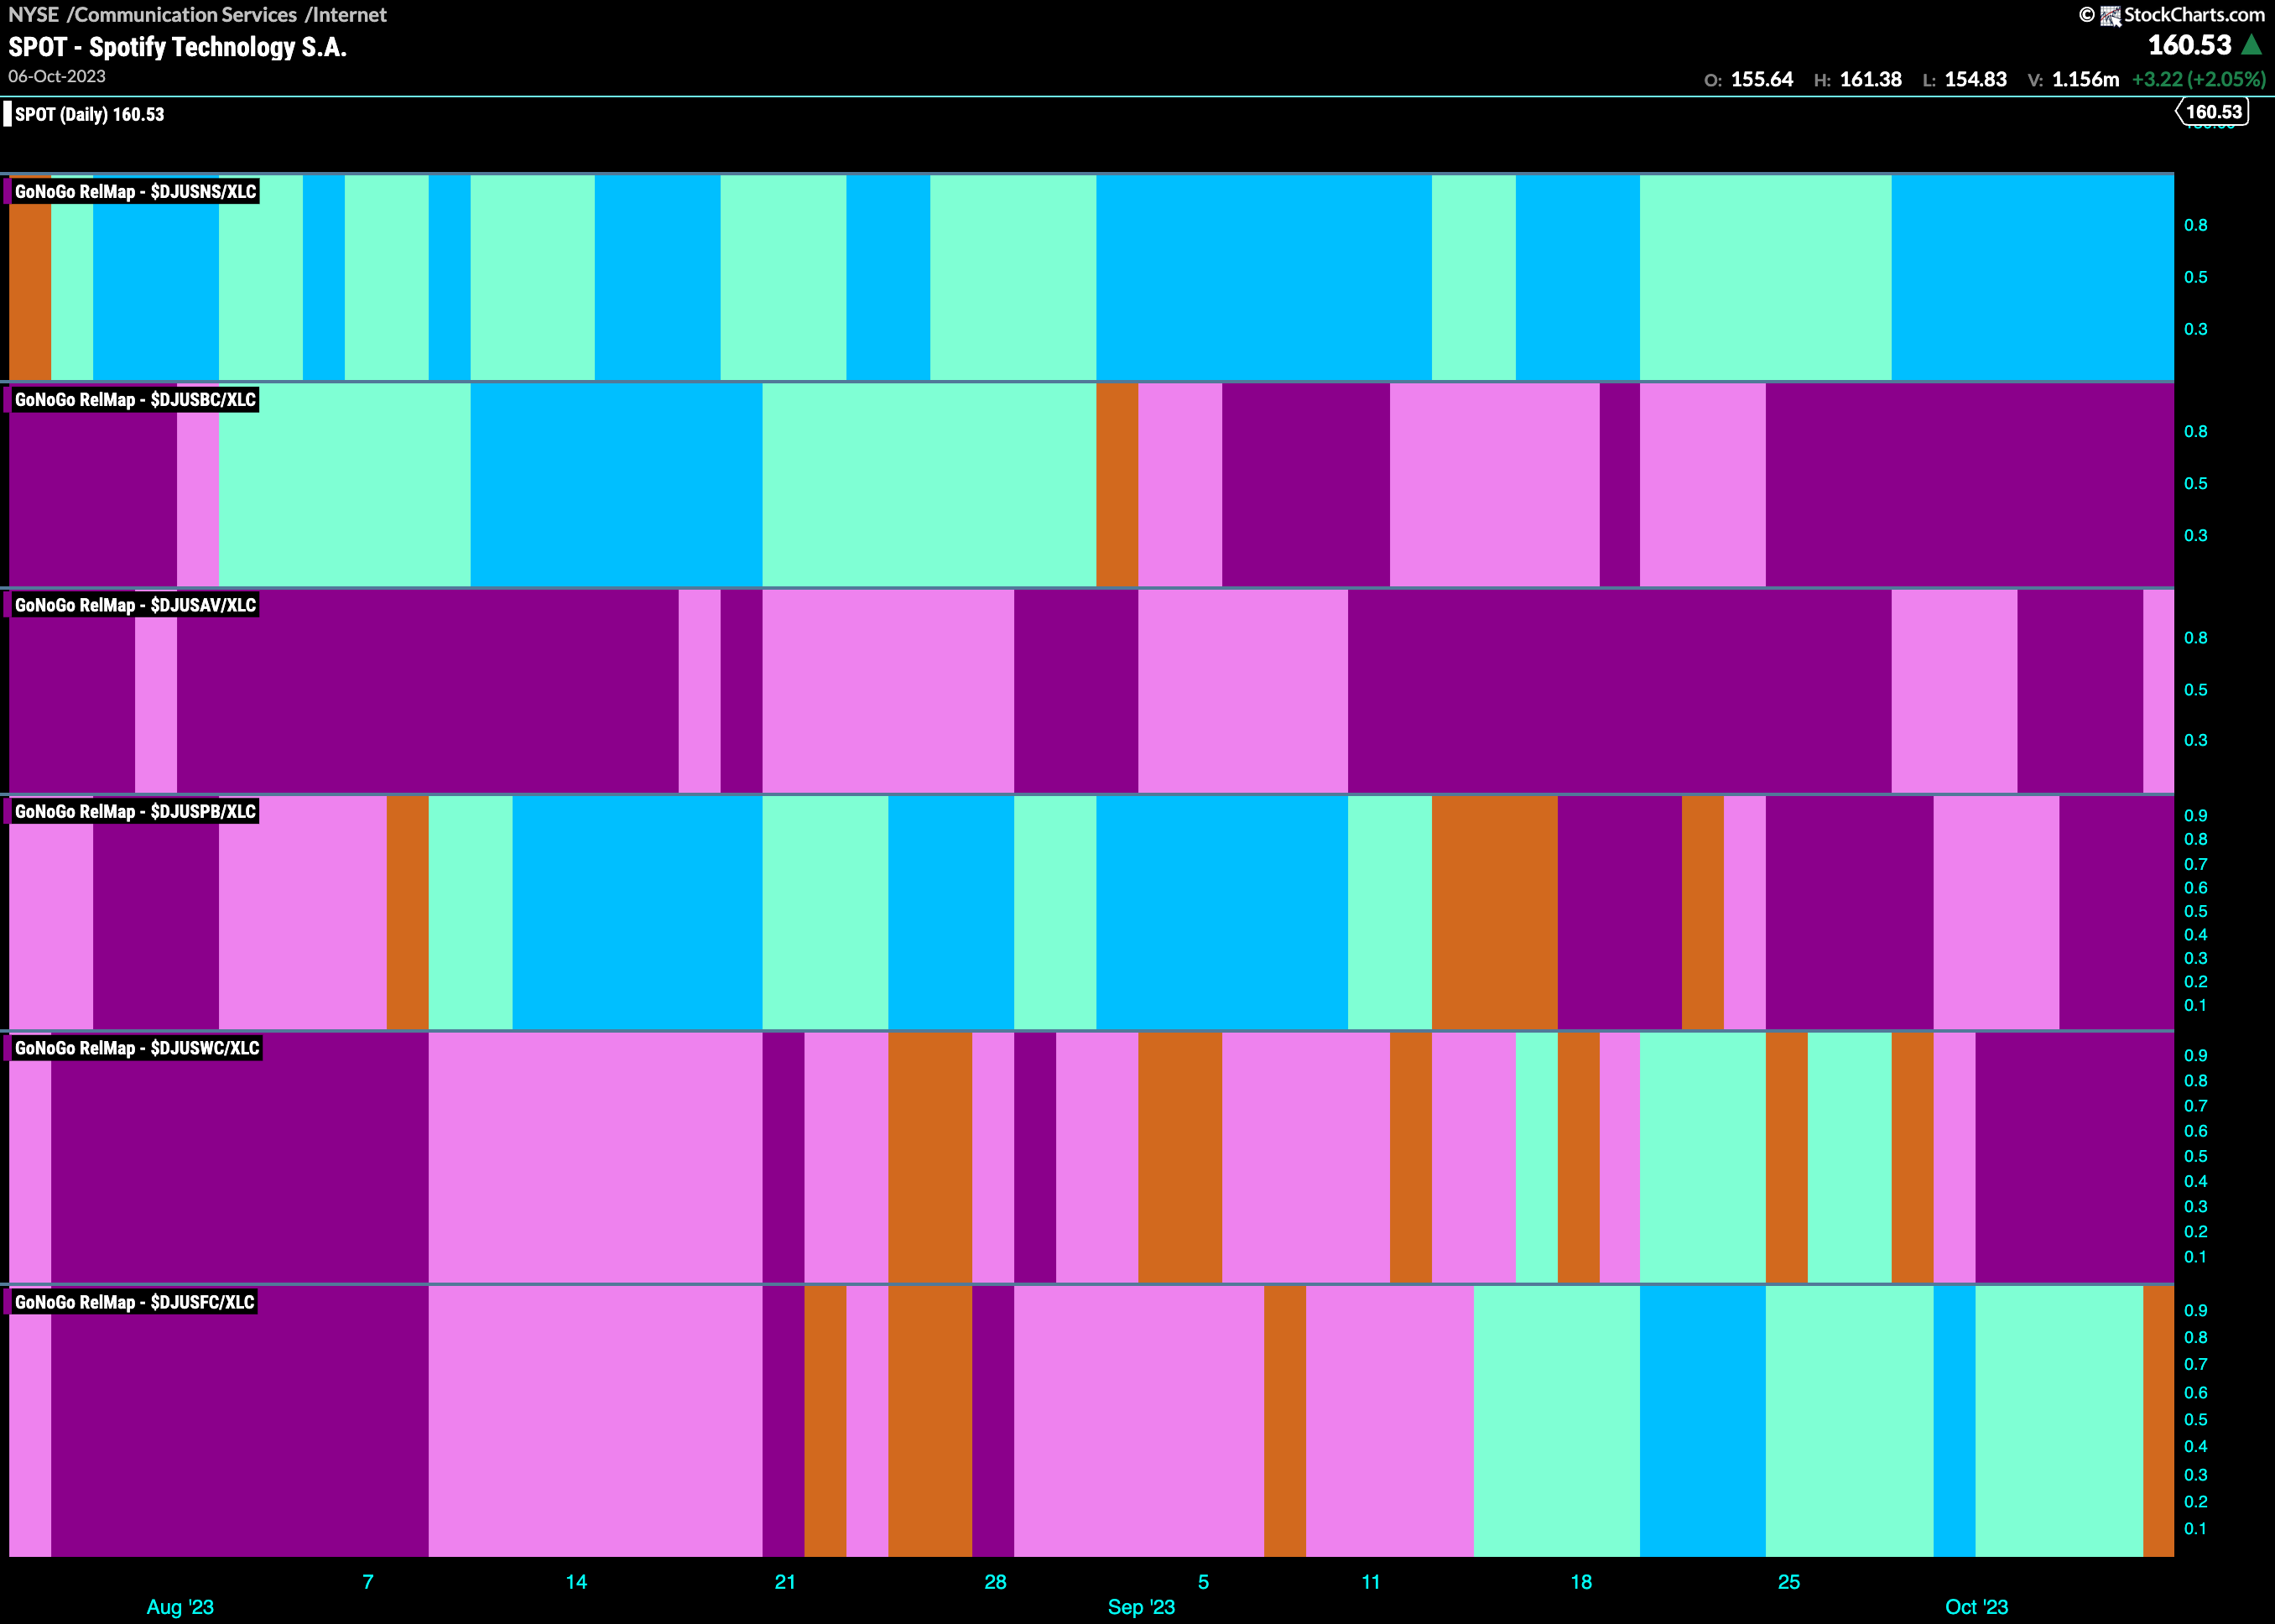
The GoNoGo Sector RelMap above shows that the communications has been holding up better than any other sector in terms of relative out-performance. It has been in a relative “Go” trend for the longest. The GoNoGo SubGroup Map below shows that it is the internet index that continues to drive that performance (top panel). We see a week of strong blue “GO” bars as the trend continues.
$SPOT Looks for Support as “Go” Persists
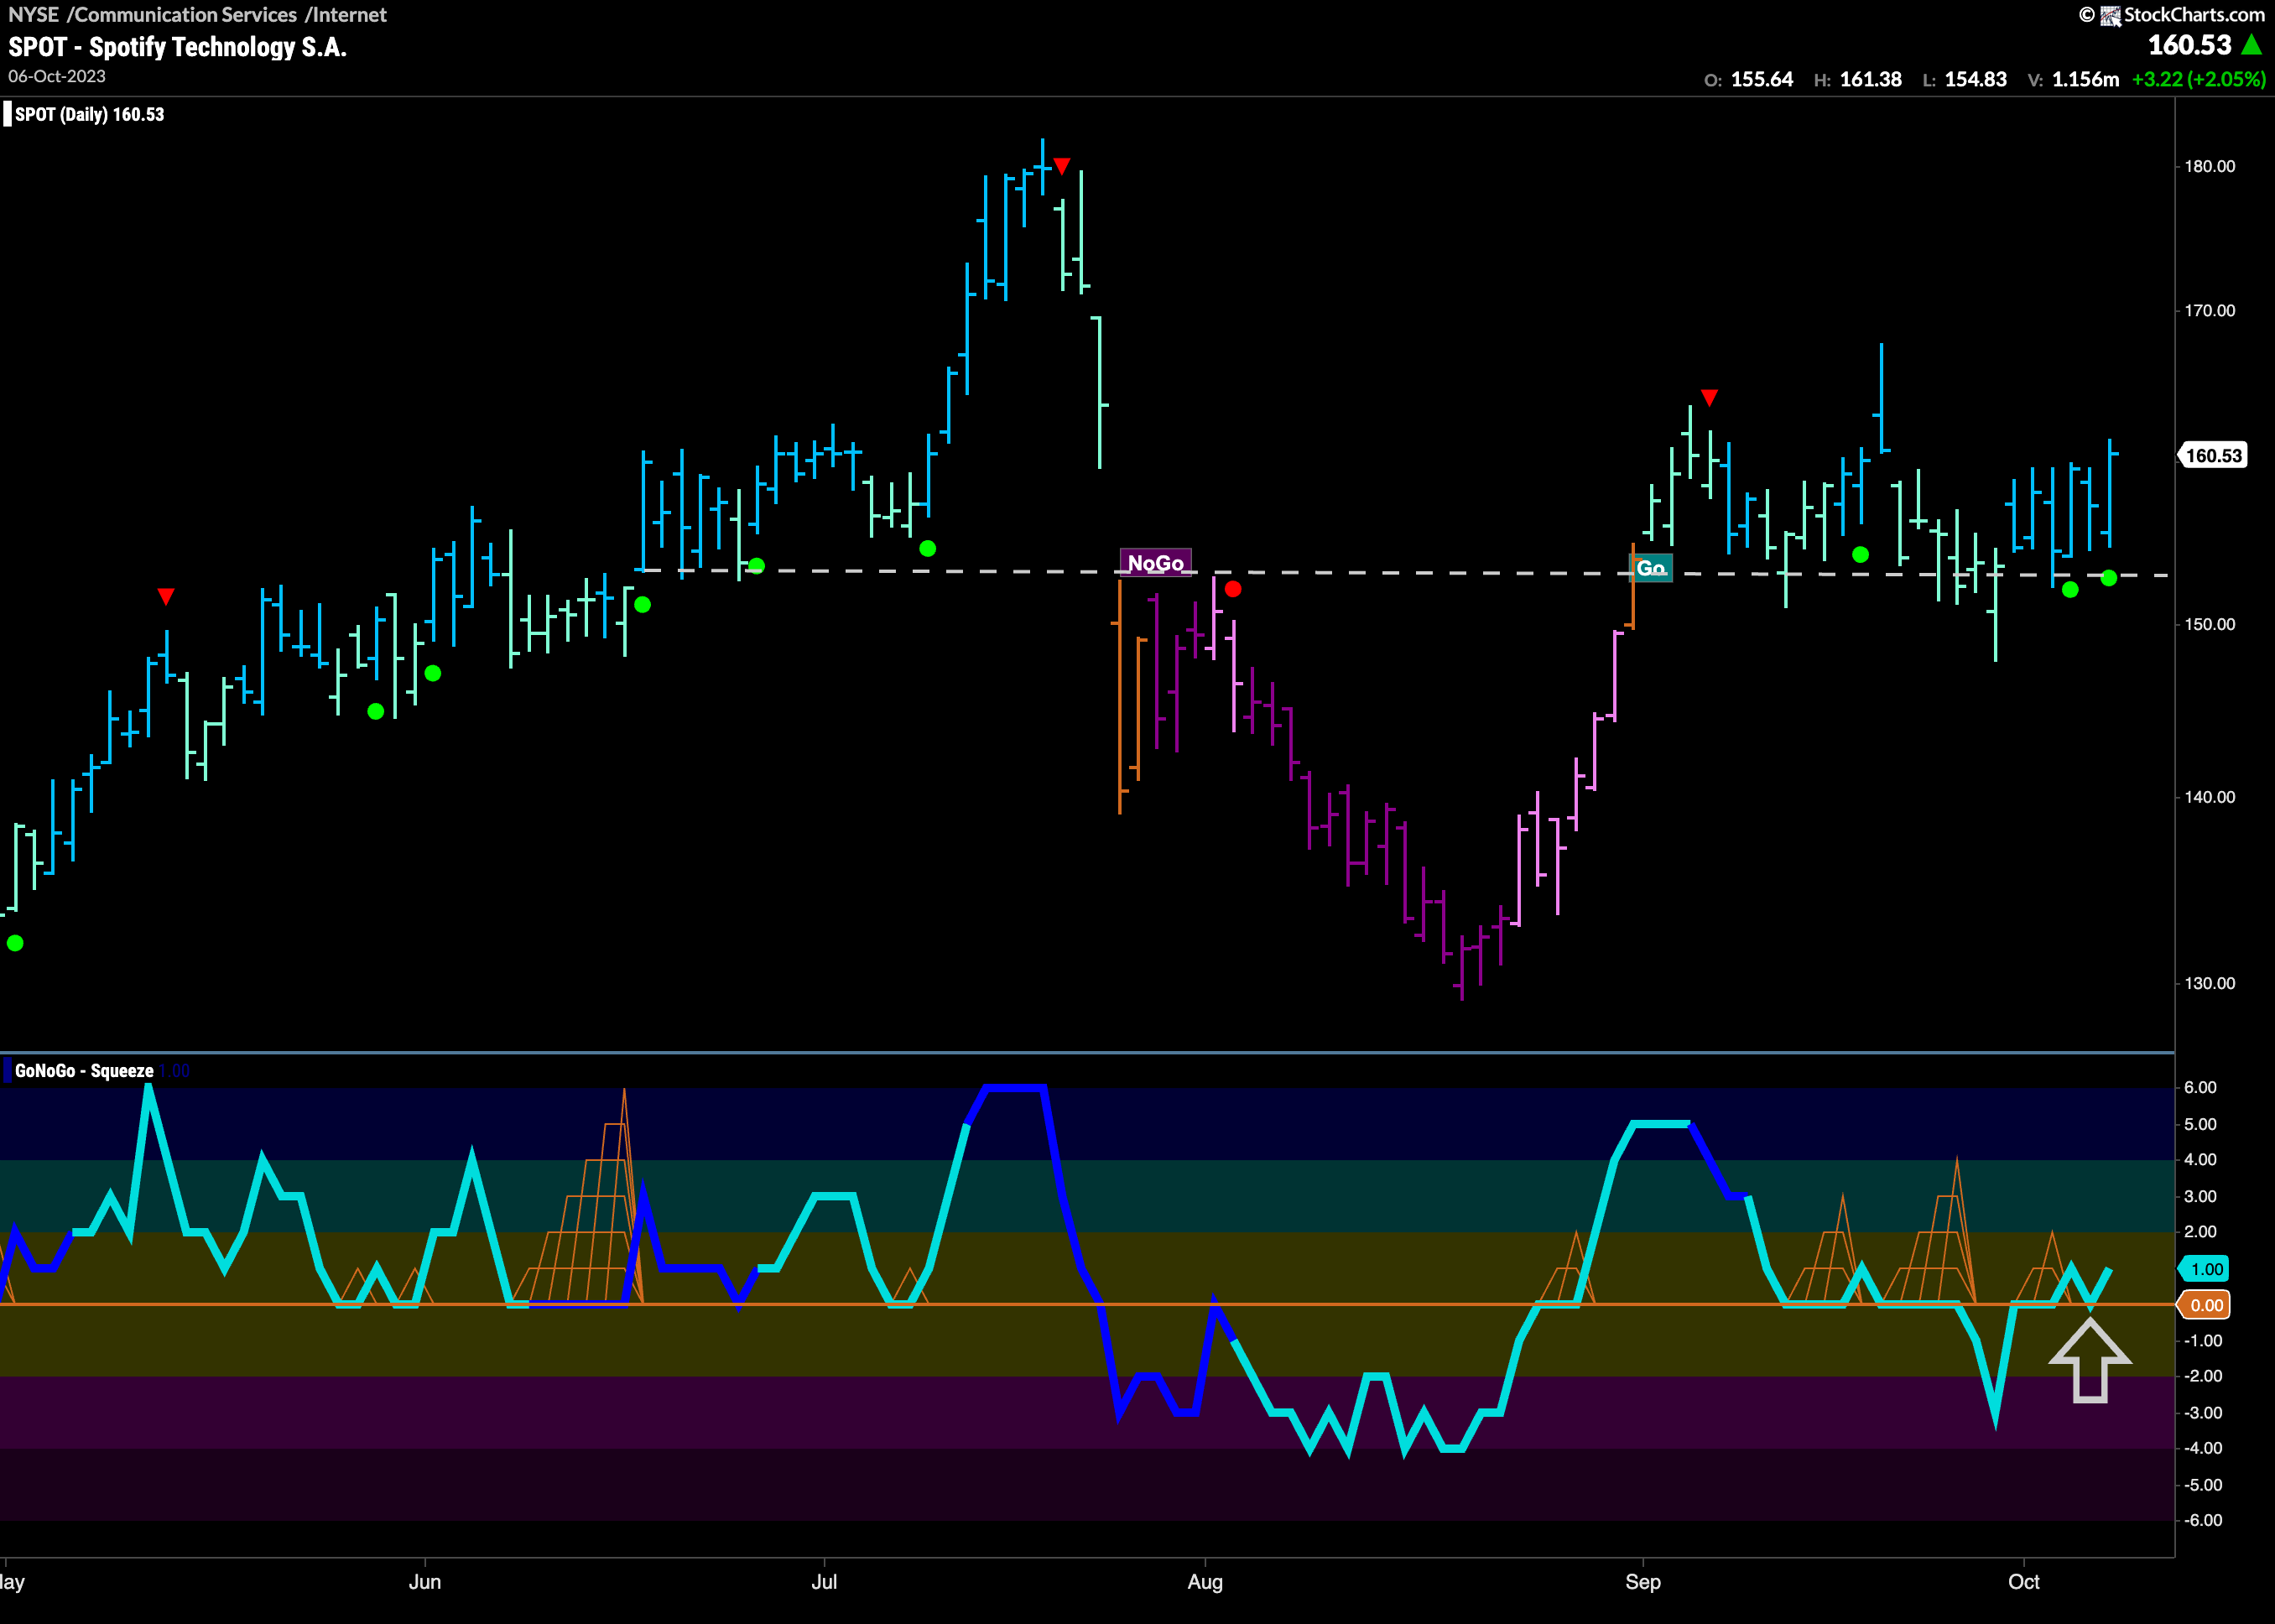
One of the securities in the internet index is Spotify Technology. We can see on the daily chart below that it has been hanging on to a “Go” trend for several weeks as price has moved mostly sideways. Now, with GoNoGo Trend painting a string of stronger blue bars, we see GoNoGo Oscillator has climbed back above the zero line and seems to be finding support at this level. We will watch to see if this positive momentum will give price the push it needs to make an attempt at a new high.
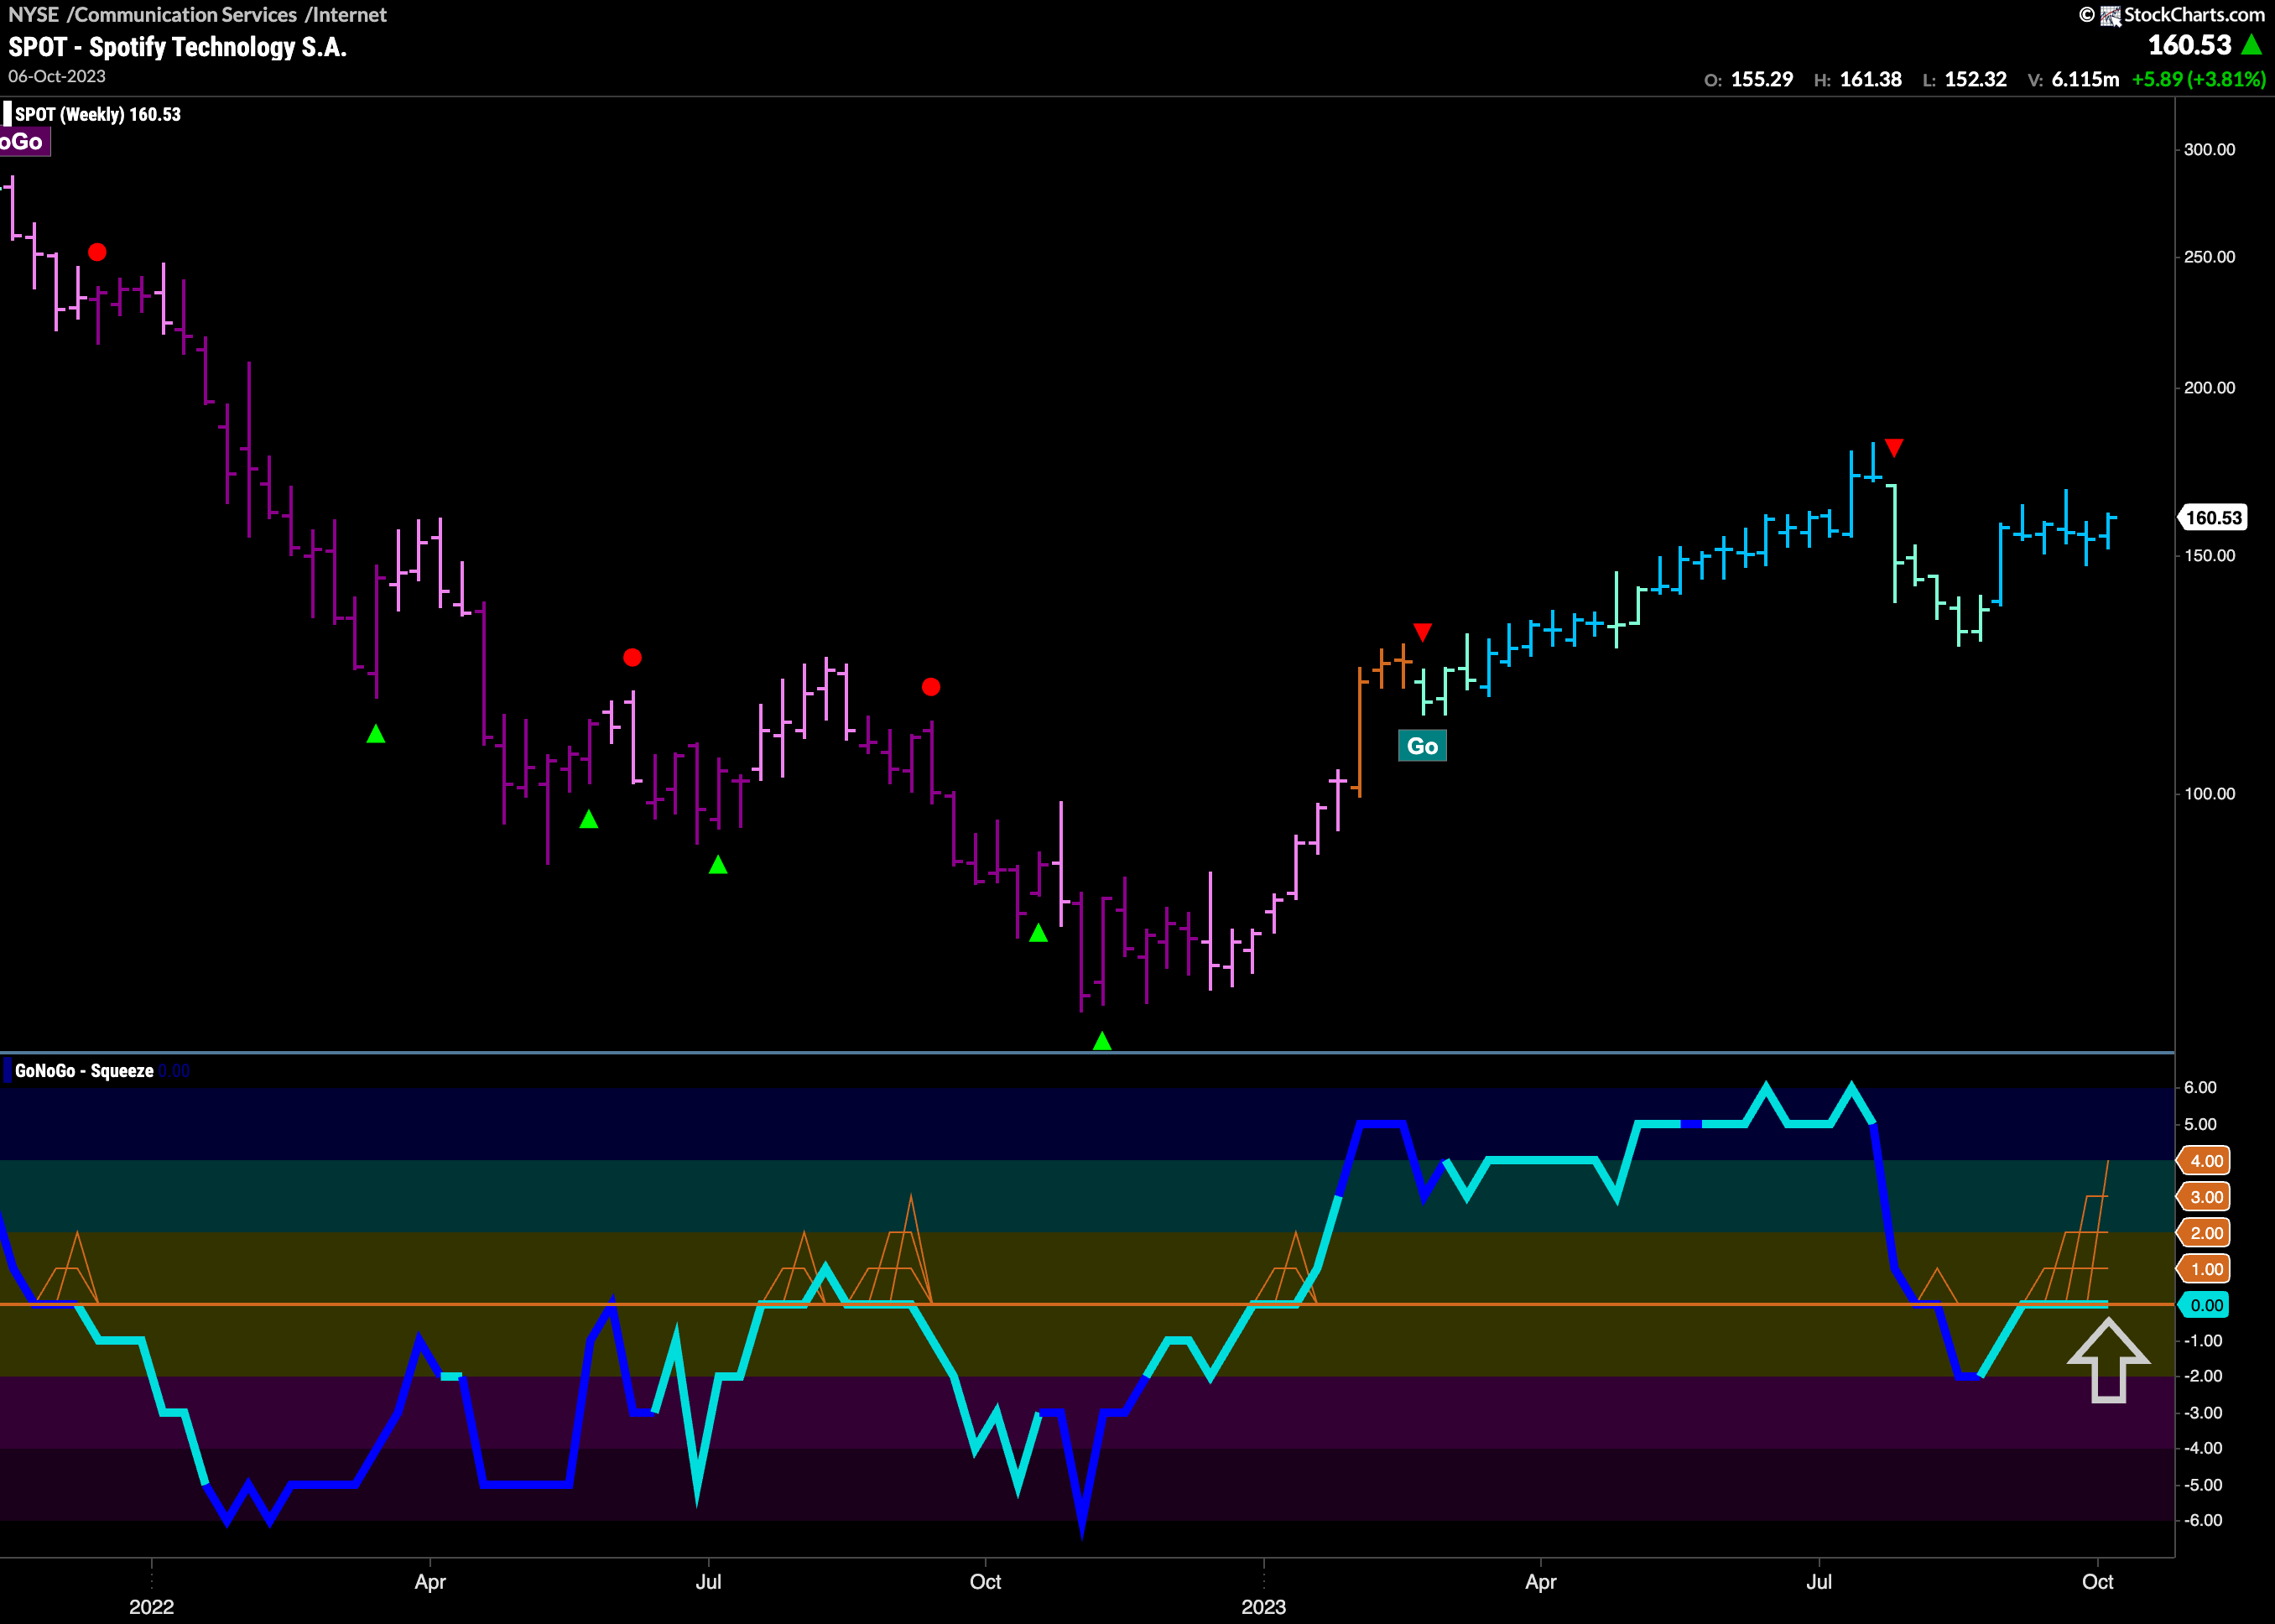
A look at the weekly chart shows that momentum is looking for direction here as well. A strong “Go” trend is in place, however we are waiting for a new higher high in price. With GoNoGo Oscillator riding the zero line and causing the climbing grid of GoNoGo Squeeze to climb we will watch to see if buyers or sellers win this tug of war. If the oscillator can move back into positive territory we would expect price to move higher from here.
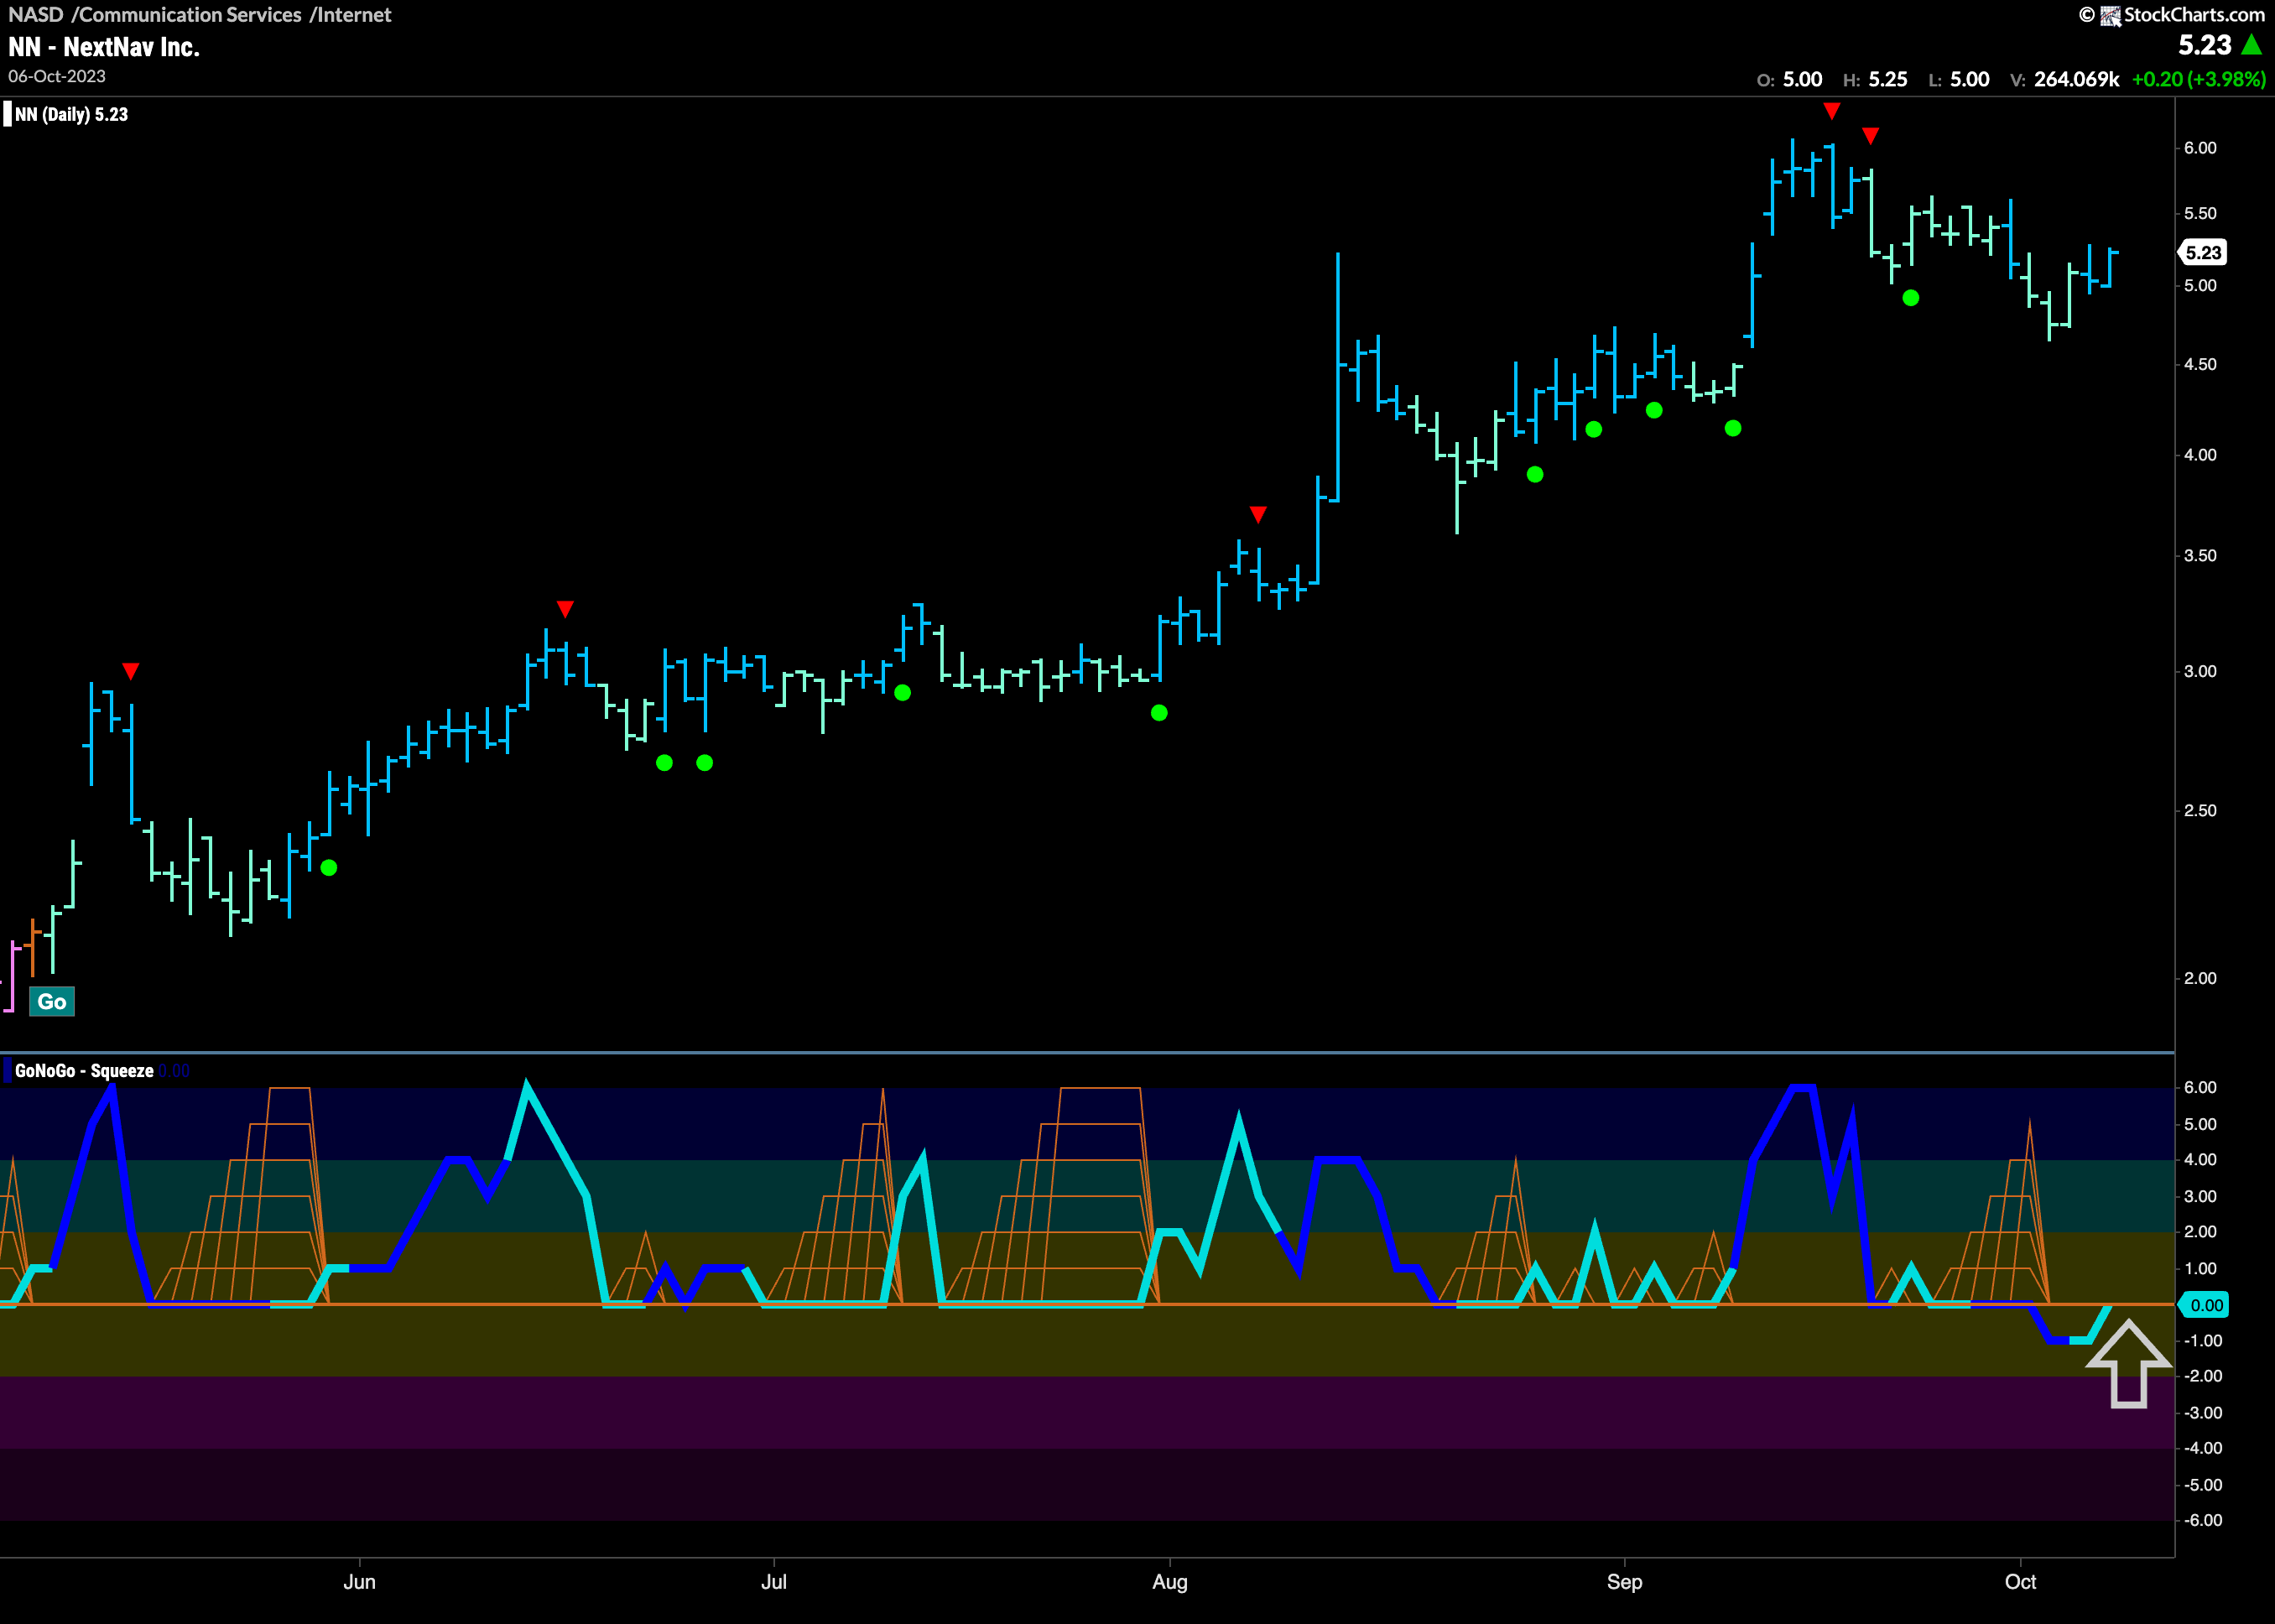
$NN Looks for Support
Also in the internet index, NextNav is pulling back within a “Go” trend. Often a sensible place to enter a trend, we will want to see positive momentum return to confirm GoNoGo Trend’s return to strong blue bars. If the oscillator moves back into positive territory we will see a Go Trend Continuation Icon (green circle) under the price bar.
$META Shows Signs of Trend Continuation
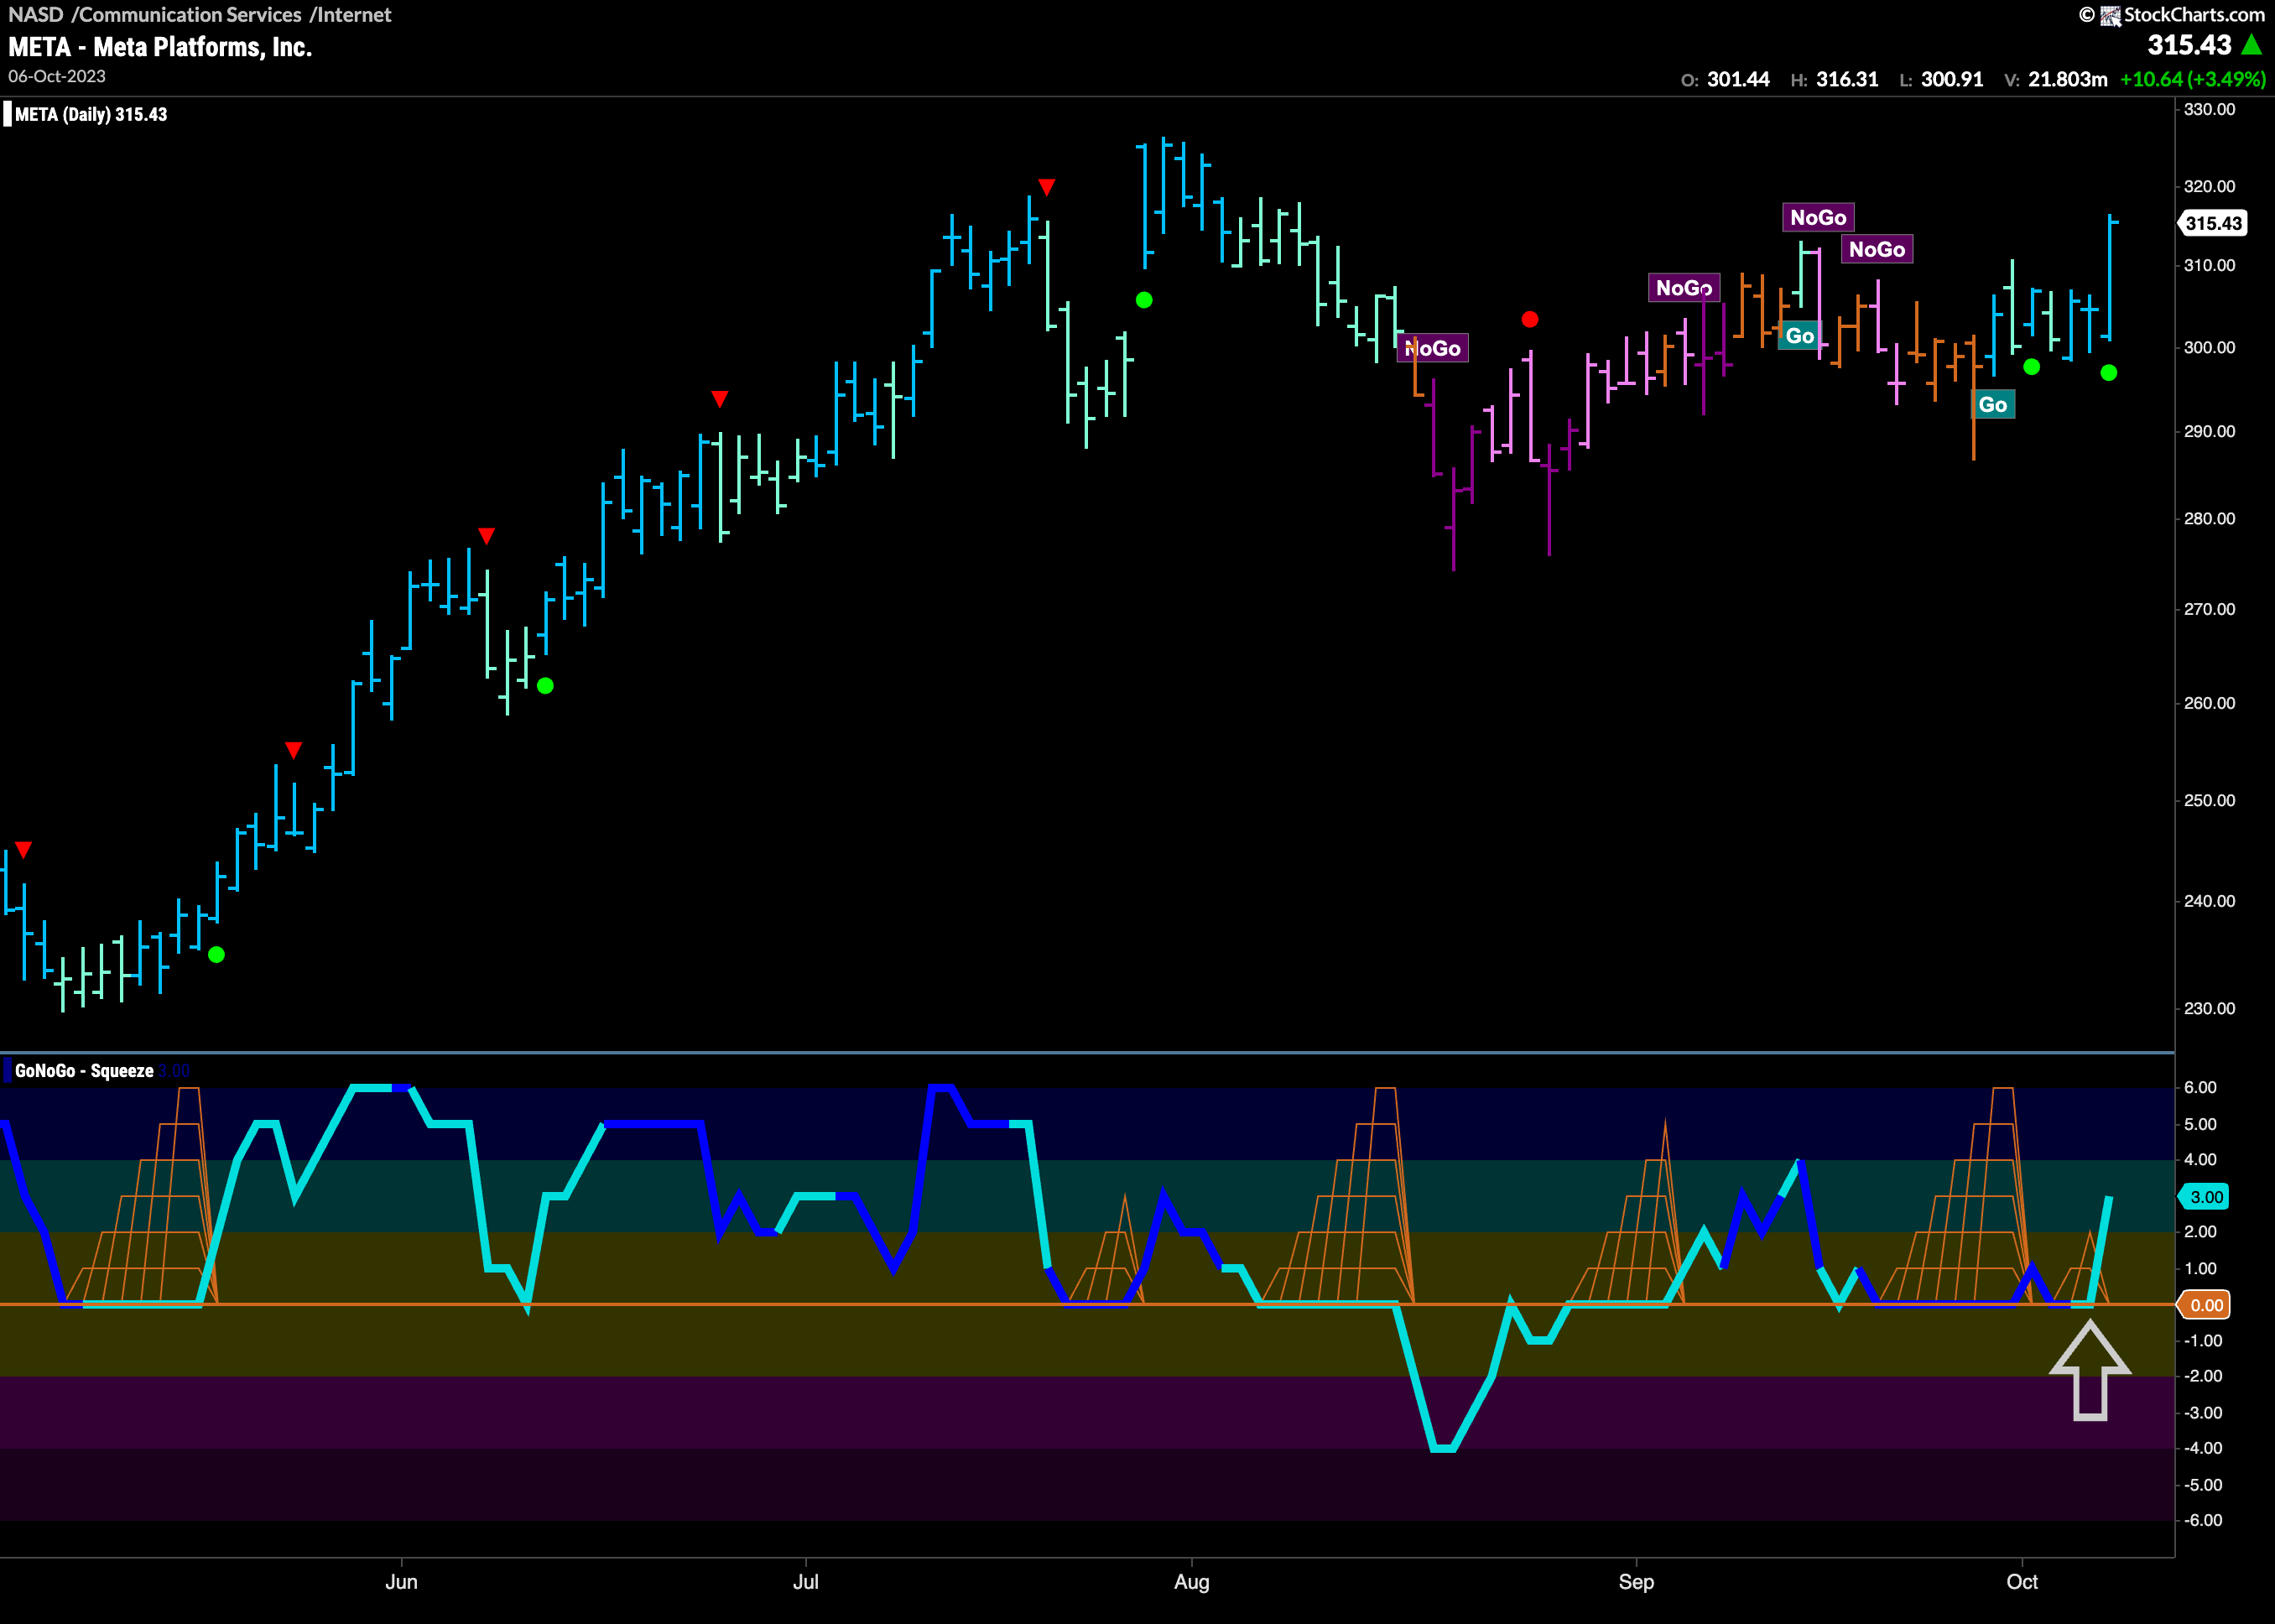
What about one of the giants of the internet index? $META shows that it is poised to continue its “Go” trend. Having experienced a “NoGo” correction, we have seen price return to paint “Go” bars as GoNoGo Oscillator continued to find support at the zero line in the lower panel. More recently, we saw a Max GoNoGo Squeeze that was broken into positive territory. This resurgent momentum is in line with the “Go” trend and Friday saw a strong bar as price climbed to a new short term high. We will watch to see if this can continue and see the next level of resistance at the prior highs from August.
