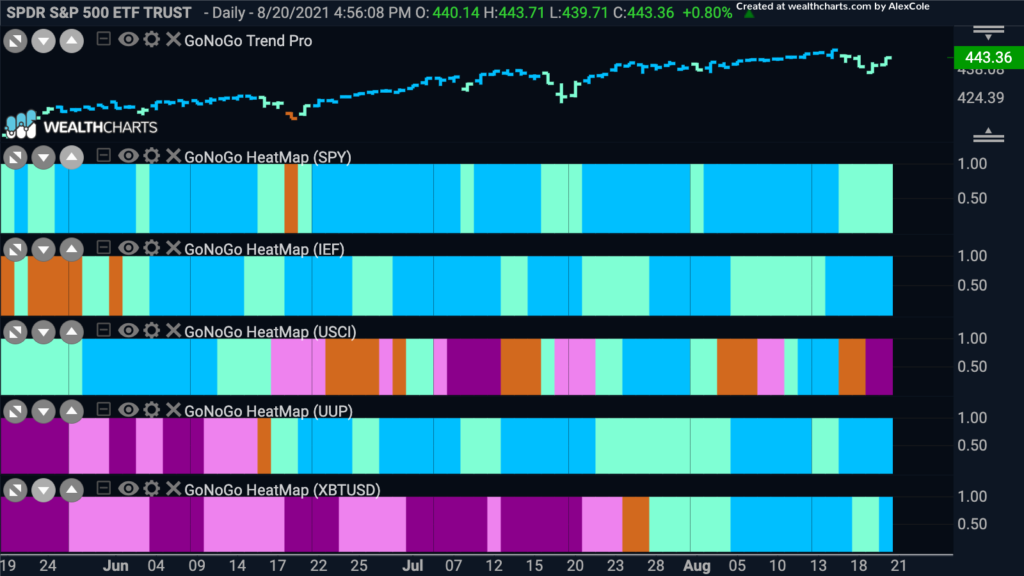
Although Friday was a good day for U.S. domestic markets prices came off this week but not before hitting a new high of $4480 this week, which amazingly is double the low of $2192 from March 2020. So the “Go” trend remains in place, as it does for treasury bond prices and the dollar. The dollar is coming up against resistance in the form of prior highs and so we will be well served to keep an eye on that. Commodities have fallen again into a “NoGo” trend and ended the week painting strong purple “NoGo” bars. Bitcoin prices seem to have settled into a strong “Go” trend having set a series of higher highs and higher lows.
Bitcoin Now in Established Go Trend
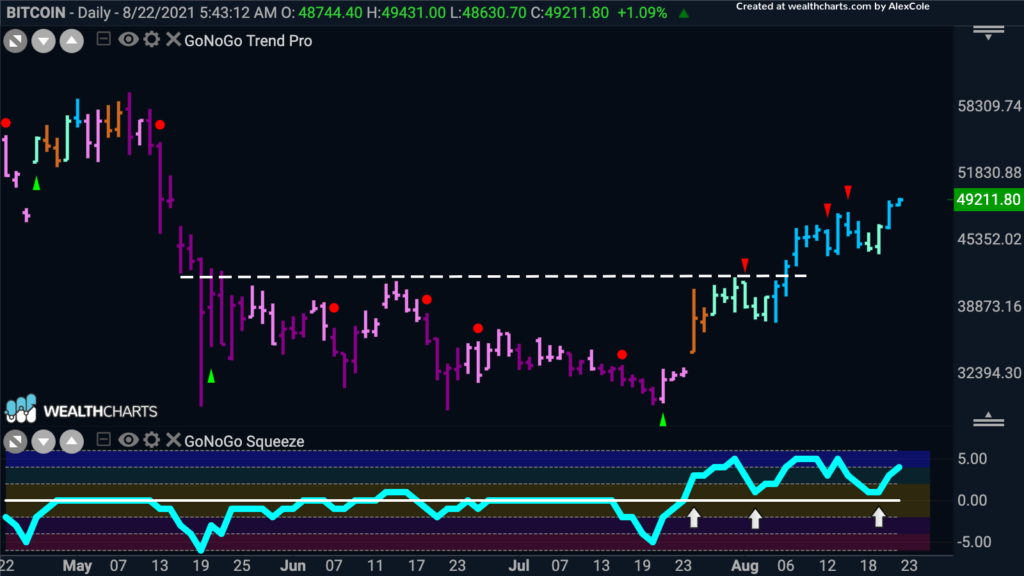
The chart below is the daily GoNoGo chart of Bitcoin prices. The trend is a strong “Go” as the indicator paints bright blue bars and price sets another higher high. The GoNoGo Oscillator broke above zero on July 23rd and this suggested price might have the momentum to break out of the NoGo move it was in. After a few amber “Go Fish” bars the GoNoGo Trend was able to paint pale aqua “Go” bars and then after the oscillator found support at zero price broke through horizontal resistance. This coincided with the GoNoGo Trend turning bright blue and price was free to move higher.
Bitcoin Mining Companies to Climb Higher
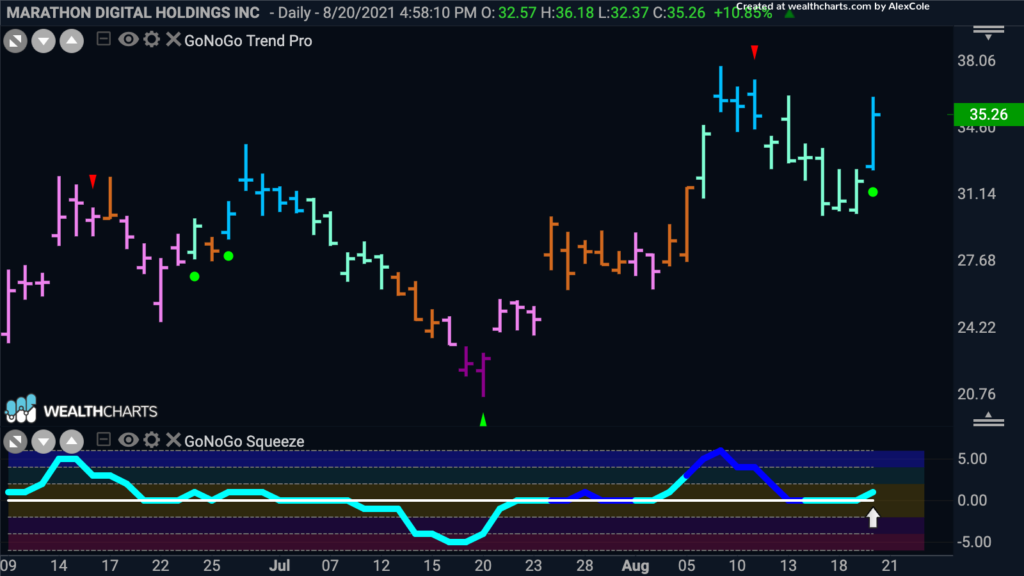
Bitcoin mining companies will likely move higher when the world’s largest digital asset itself is in a strong “Go” trend. The chart below is the GoNoGo chart for Marathon Digital Holdings. We see that in early August, after riding the zero line for several bars the GoNoGo Oscillator was able to significantly rally into positive territory. This suggested that the GoNoGo Trend would climb out of the “Go Fish” bars and be able to paint “Go” bars. After setting a high price has come back, painting mostly pale aqua bars as the GoNoGo Oscillator has fallen to zero. It looks now as if we have found support at that level and have begun to move back into positive territory as the GoNoGo Trend paints a fresh bright blue “Go” bar. At the same time, a low risk trend continuation green circle has appeared under the latest price bar.
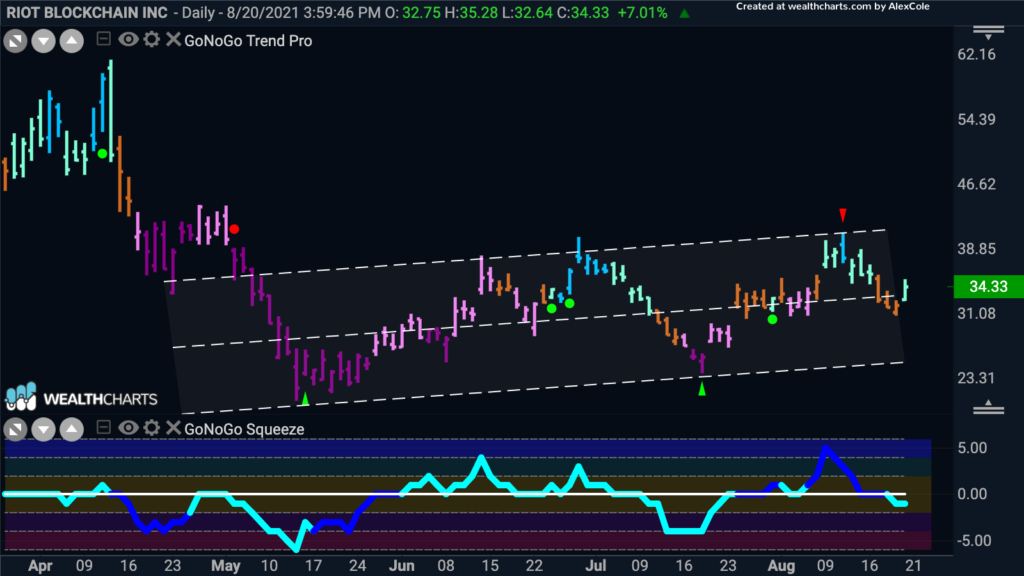
Riot Blockchain is another bitcoin mining company and the chart below is the GoNoGo chart of daily prices. We can see that price has been in a choppy channel moving mostly sideways but has been making slightly higher highs and lows. After moving lower from the recent high of the channel the GoNoGo Trend slipped again out of “Go” colors and painted a series of amber bars but Friday’s bar turned aqua once again. We will see if the GoNoGo Oscillator can get back above the zero line which would send price back up toward the top of the channel.
Companies to Climb on Bitcoin Gains
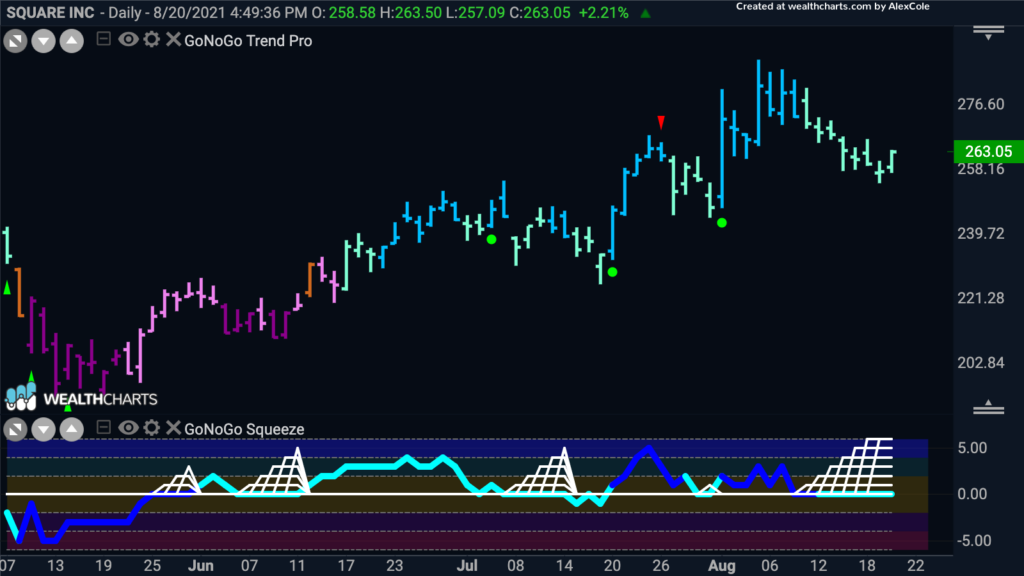
Square saw a massive run in 2020 as bitcoin prices rallied to over $60,000. The Square cash mobile app has seen great adoption and is being used world wide as a way to buy and sell bitcoin. If bitcoin is set to rally again, perhaps Square is likewise set to break higher. The chart below is a GoNoGo chart of Square prices and we can see that after setting a high earlier this month price has fallen. The GoNoGo Trend has painted aqua bars all week as the GoNoGo Oscillator has been riding the zero line. The GoNoGo Squeeze shows that the climbing grid has risen to its extreme. We will look to see if price can break out of the squeeze into positive territory and mount an attack on the recent high.
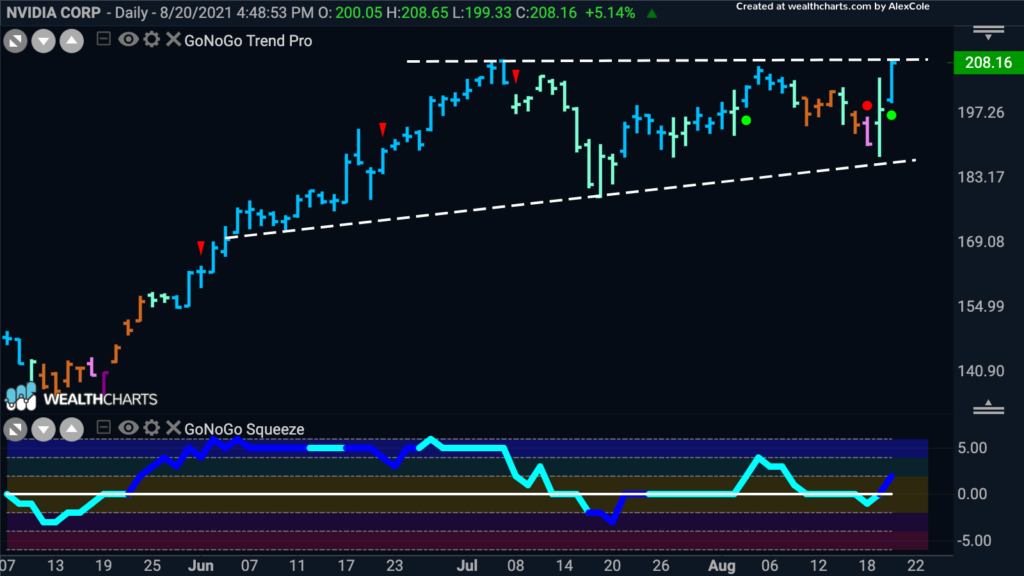
Nvidia is another company that has found application for its business acumen in bitcoin mining and likewise saw a strong run last year. Recently, price has been stuck in an ascending triangle formation and is now testing the upper bound of the triangle again. The GoNoGo Oscillator has clawed its way back above the zero line on heavy volume and perhaps that shows there is momentum for a break out of the triangle to the upside.
Commodities falling
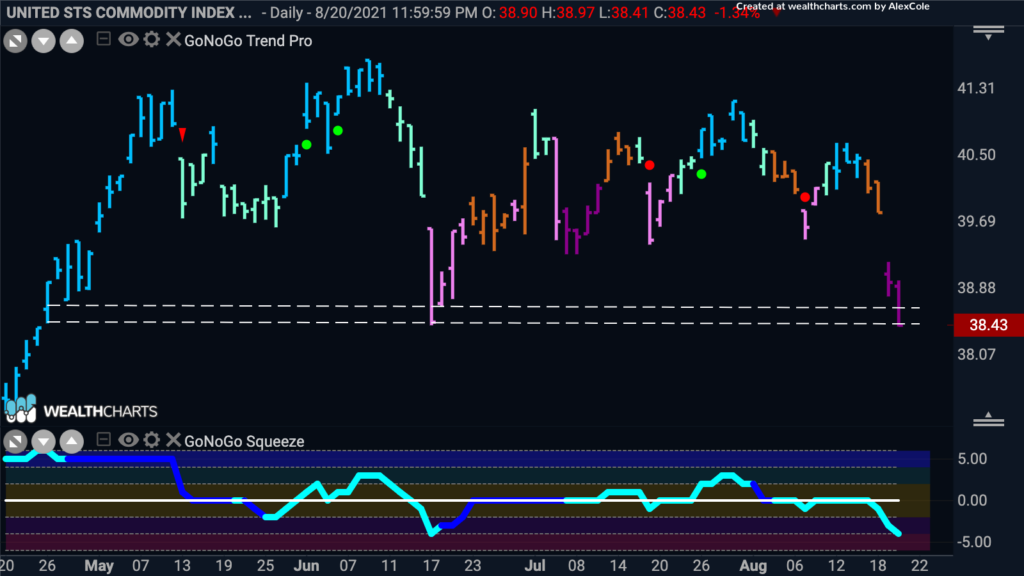
When we looked at the GoNoGo Asset Map to start we saw that commodities had fallen into a “NoGo” trend again. Looking at the GoNoGo Chart below of $USCI we can see that it wasn’t a good week for the commodity index. Prices gapped lower in the middle of the week and are now painting strong purple “NoGo” bats as we run into resistance from June lows. The GoNoGo Oscillator which had been straining at the zero line has now convincingly fallen into negative territory.
Oil Leading the Drop
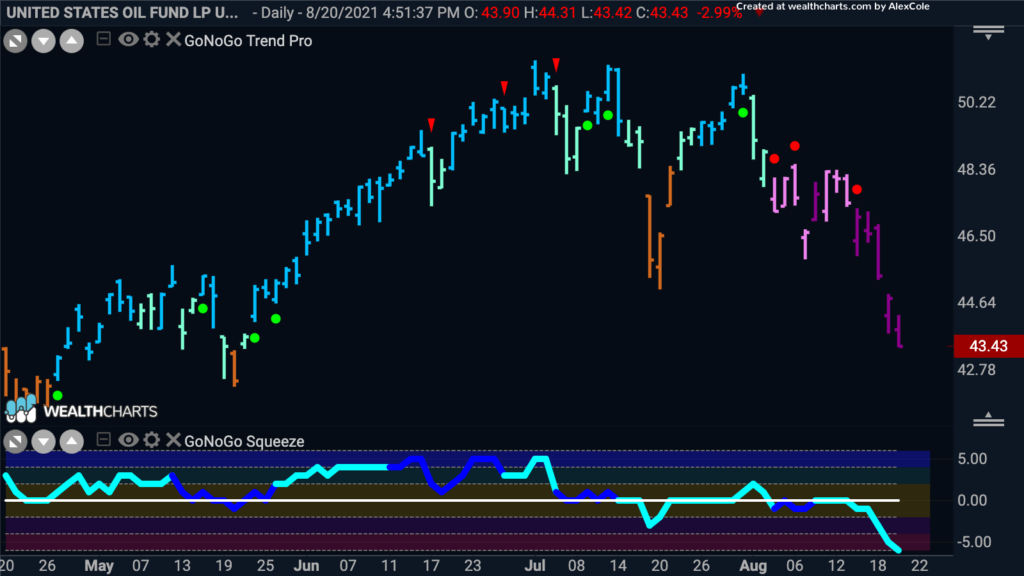
If we were to take a look at a GoNoGo Sector RelMap we would see that the energy sector is embroiled in a relative “NoGo” trend and painting strong “NoGo” bars. The chart below shows that the United States Oil Fund, $USO has set a lower low as prices fall sharply. With prices painting strong purple “NoGo” bars and the GoNoGo Oscillator in oversold territory the “NoGo” trend seems to have really taken hold. We will look to see if there is support to be found around $42 at prior lows.
Marathon Oil to Fall Further?
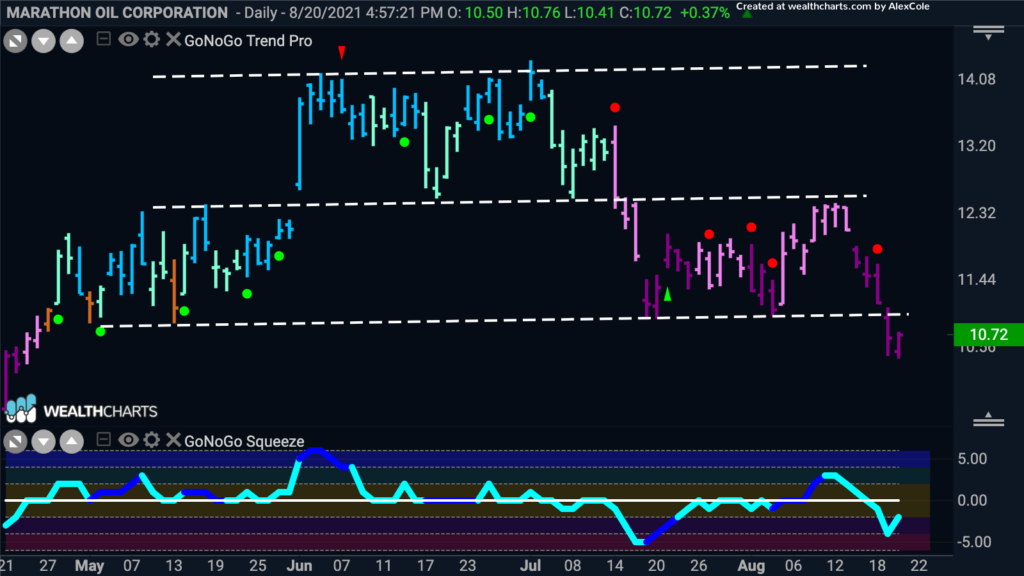
Marathon Oil has been a technical treasure over the last few months. A double top completed when the first pink bar in mid July broke through the support of the neckline and then the target implied by a measured move of the height of the pattern from neckline to top was hit almost exactly. This then become strong support as price rallied to test the neckline that now had become resistance; polarity. This week, on strong purple “NoGo” bars, price broke through that support and the GoNoGo Oscillator moved back into negative territory. Price has room to move lower, with next support levels perhaps cropping up just below $10 from prior lows.
