
It is tempting to follow the herd into TopShot, Gamestop, or silicon valley unicorns. These are exciting times with widespread participation in an early-stage bull market. Technical Analysis is an incredible tool for separating what people are talking about, from what investors are buying.
As Walter Deemer says, "watch their feet, not their mouths."
So, let us pay close attention to the new leadership groups as the economy comes back online after a world-altering pandemic year. Rotation away from growth, into value, and rotation away from technology and into industrials are key themes that will play out in the months ahead. Below is your Flight Path weekly newsletter for March 1, 2021.

The GoNoGo Heat Map® above shows us the daily trend performance of five asset classes: Equities, Bonds, Commodities, Currencies, and Digital Assets from the US perspective. The takeaway remains the same as it has been for several months. Equities, commodities, and the cryptocurrency markets are still in established “Go” trends.
Panel 1 – Stocks continue to paint aqua “Go” bars as the trend persists. The $SPY ETF seeks to provide investment results that correspond generally to the price and yield performance of the S&P.
Panel 2 – Government bonds, continue to paint strong purple “NoGo” bars, as investors seek yield elsewhere. $IEF tracks a market-value-weighted index of debt issued by the US Treasury with 7-10 years to maturity remaining.
Panel 3 – Commodities are a “Go,” painting blue and aqua bars last week. $USCI tracks an equal-weighted index of 14 commodity futures contracts and holds at least one precious metal, industrial metal, energy, livestock, soft, and grain commodity.
Panel 4 – The US Dollar is retreating again from the “Go” trend of the last few weeks and concluded last week’s session with an amber. $DXY is an index of the value of the United States Dollar relative to a basket of foreign currencies.
Panel 5 – Bitcoin’s “Go” trend continues though we saw sharply corrective price action last week as it paints aqua bars.
EQUITIES FOR THE LONG RUN
Stepping back from the daily swings in the market, we can better understand long-term trends from long-term charts. See the monthly GoNoGo Trend chart of the S&P 500 below going back five years. We can better understand how dominant the equity “Go” trend has been coming off the March lows of 2020:

To outperform the benchmark, you have to own the stocks that are outperforming the benchmark. To separate leaders from laggards, we look at ratio charts. but to compare all of the sectors of the S&P against the index, a GoNoGo RelMap® gives a clear picture of the trend of each relative strength ratio. Blue and aqua bands show us sectors with outperformance that are trending higher. Purple and pink bands show sectors with underperformance that are trending lower.

Energy stocks outperformed as the sector ETF ($XLE) gained 4.3%. Oil prices rose nearly 4% again last week to $61.45 per barrel and we’ll talk more about that when we address commodity trends below. Financials ($XLF) and Communications ($XLC) sectors also outperformed the benchmark, but look at the new leadership emerging in the Industrials sector ($XLI). The continued rotation into cyclical shares only accelerated as vaccine progress fueled optimism about the reopening of the global economy.
TRAINS PLANES AND MANUFACTURING $XLI BEGINS LEADERSHIP
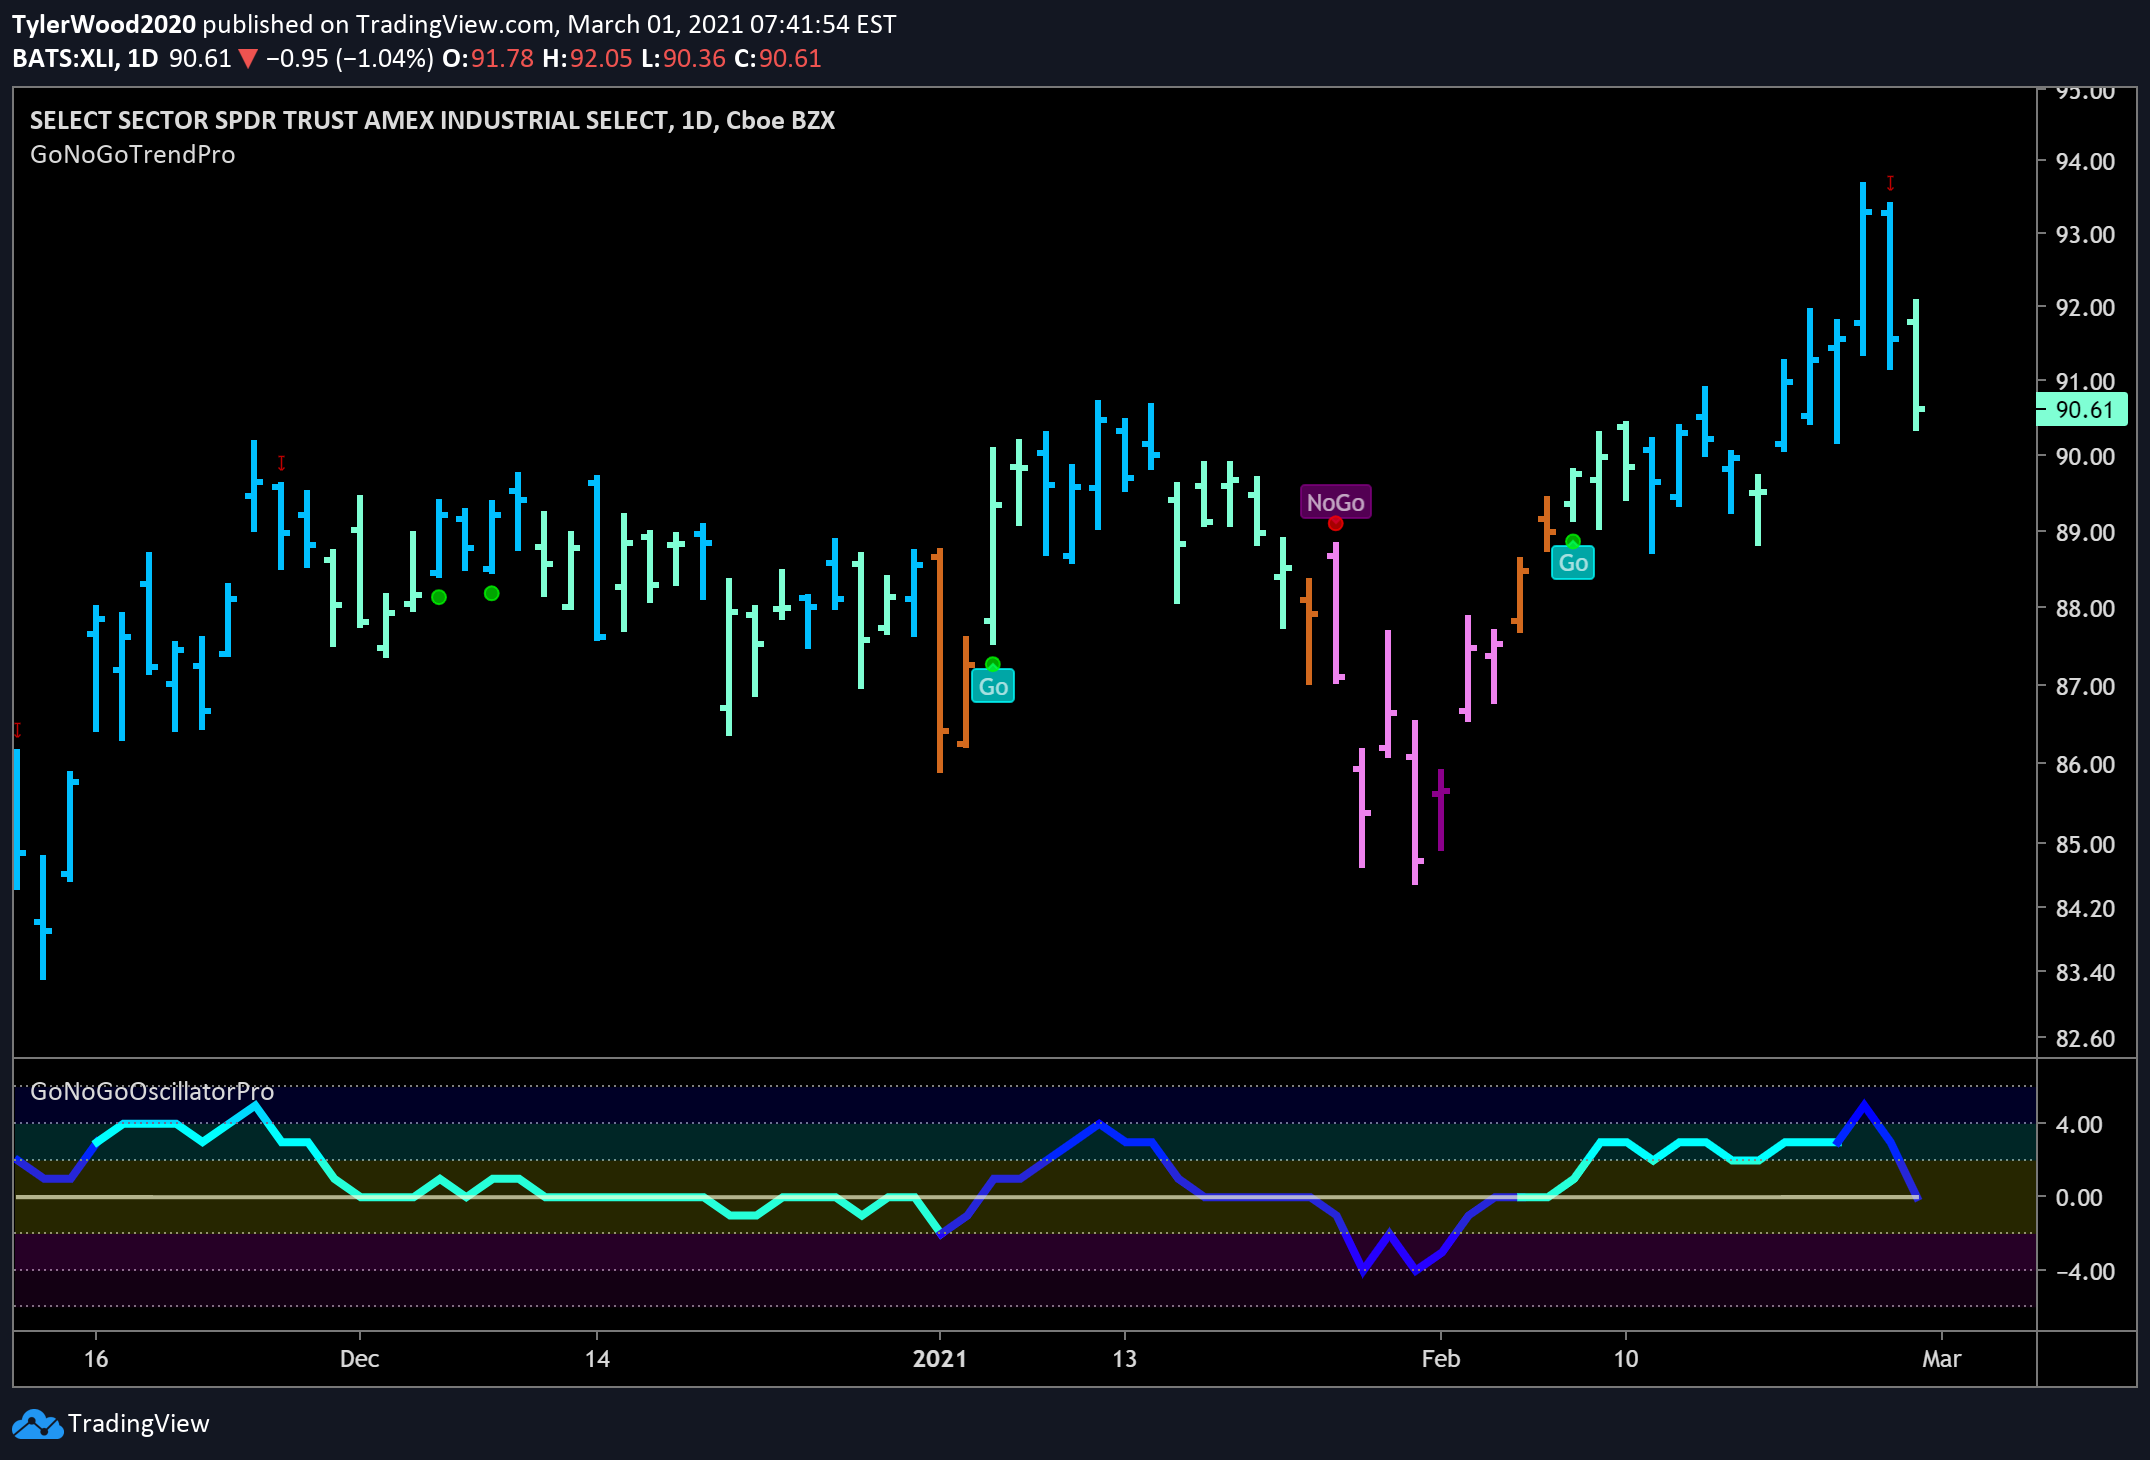
Below is a daily GoNoGo Trend chart of the industrial sector ETF $XLI which just entered the leadership of S&P sectors last week. The industrial sector includes companies that produce machinery, equipment, and supplies that are used in construction and manufacturing, as well as those that provide related services. These were the least-loved stocks of the quarantine economy in 2020. These companies are closely tied to the economy, and their business volume often falls sharply during recessions. So, while they get no attention in the reddit threads of 2021, you’ll remember that buying up railroads was a great strategy in the games of Monopoly you played as a kid. Berkshire Hathaway still likes that strategy.
Industrials did not escape choppy trading last week, and closed the session on a weaker aqua bar of corrective price action. We see a counter-trend correction signal (red arrow) above Thursday’s bar. GoNoGo Oscillator in the lower panel retesting the zero line on heavy volume. If the oscillator finds support, this sector could be a solid trend as investors allocate to the industrial economy as it comes back into full capacity.

Owning the sector is one way to gain exposure. For a more concentrated position, investors will allocate to individual companies within leading sectors. Railroads are one of the major holdings within the $XLI. While these companies are not emblazoned across headlines about the digital economy, they are essential to the transportation infrastructure in North America. Raw materials and manufactured goods alike are largely shipped by rail. See the daily GoNoGo Trend chart of Old Dominion Freight Line, Inc. $ODFL:

Old Dominion maintained strong blue trend conditions through the week and we see GoNoGo Oscillator retesting the zero line.
If we zoom out to the weekly chart, we can see this trend is as steady as the locomotives driving the recent outperformance. This trend is the picture of health. GoNoGo Oscillator repeatedly tests the zero line when momentum falls, but it always finds support and does not break down to negative territory. It appears as though Q4 was a long period of sideways consolidation. As the $XLI gains traction, look for a strong trend continuation over the coming weeks and months.

If we zoom out to the monthly chart, we can see this trend is one for the long run:

Charles H. Dow wrote extensively about the importance of confirmation between DJIA and the DJTA. The transportation index needed to confirm moves in the industrial average to be sure that the economic expansion was real – that goods were actually being shipped to customers not just inflating inventory. Today quants are poring over satellite data to track parking lot occupancy as a leading indicator of whether retail stores will make or beat earnings. In that way, Dow Theory was actually the first expression of big data analytics!
Below are trends worth looking into from a manufacturing company within the $XLI. Huntington Ingalls Industries is a military shipbuilding company and a provider of professional services to partners in government and industry. Below is a weekly GoNoGo Chart of $HII showing how this trend is just getting started:

Zooming into the daily chart, we can see that a sharp countertrend correction arrow appeared above Thursday’s bar as the trend conditions weakened to aqua bars. At the same time, GoNoGo Oscillator crashed to the zero line on heavy volume. If we see the oscillator find support here, that high volume and surging momentum could take this rally back to new highs providing a compelling entry signal with very well-defined risk.

THE FIRES OF INDUSTRY BURN WHAT?
At the outset of this note, we saw that commodities were also in strong “Go” trends from the GoNoGo Heat Map. Our next step of research is to compare how various sectors of the commodities space are trending. See the GoNoGo Heat Map below which shows the trend of each subgroup within the US Commodities Index $USCI:

Literally, everything except Gold ($IAU – second panel) is in a “Go” trend! As yields rise, and inflation expectations climb, commodities are an appropriate asset allocation for institutional and individual investors alike. However, looking at the same $USCI components on a relative basis – each sector component divided by the index shows a very different story. If you recall, the $XLE was the top-performing equity sector last week as oil made large moves to $61.45 per barrel. See the GoNoGo RelMap below to see what has outperformed the commodities index:

DRILLING INTO $USO
Last week we focused on the largest player in the game – Exxon Mobil $XOM. To capture this incredible outperformance in the oil industry, and also take advantage of trends in the small-cap value categories, let us look at two less obvious stocks.
Below is a daily GoNoGo Trend chart of Whiting Petroleum, an oil and gas exploration company that went through a major restructuring in September, cutting 16% of staff, largely from executive positions. The firm acquires, explores, and produces a variety of petroleum products. Stong blue Go trend and GoNoGo Oscillator is positive on heavy volume but no longer overbought:

Another opportunity to capture this trend is through Headwater Exploration Inc, $HWX a Canada-based energy producer that explores and develops oil and natural gas assets. Weak price action on Friday could be the precursor to another low-risk entry signal to this trend.


