It’s summer in the Northern Hemisphere, sentiment is heating up for US Equities, but when we cast our lens around the globe, we’re seeing B.R.I.SK. breakouts… Welcome to a new trading week and your latest issue of Flight Path from GoNoGo Research.
This week the research note will take a slightly different approach. Last week marked the close of May trading for everyone outside of US markets, so we want to look internationally at key global indices to understand the longer-term trends and get a sense of the health of markets broadly. However, the rangebound nature of many areas of the equity space has given way to some leading signs of correction which we’ll take a look at specifically. Oil had an impressive run last week and we will survey the landscape for commodities across the spectrum including trends in industrial commodities, softs, and precious metals which have all been on the move. And finally, evaluating the weight of the evidence, we’ll look at the credit markets to see if there are any leading indications of a pullback near-term.
INTERNATIONAL EQUITIES
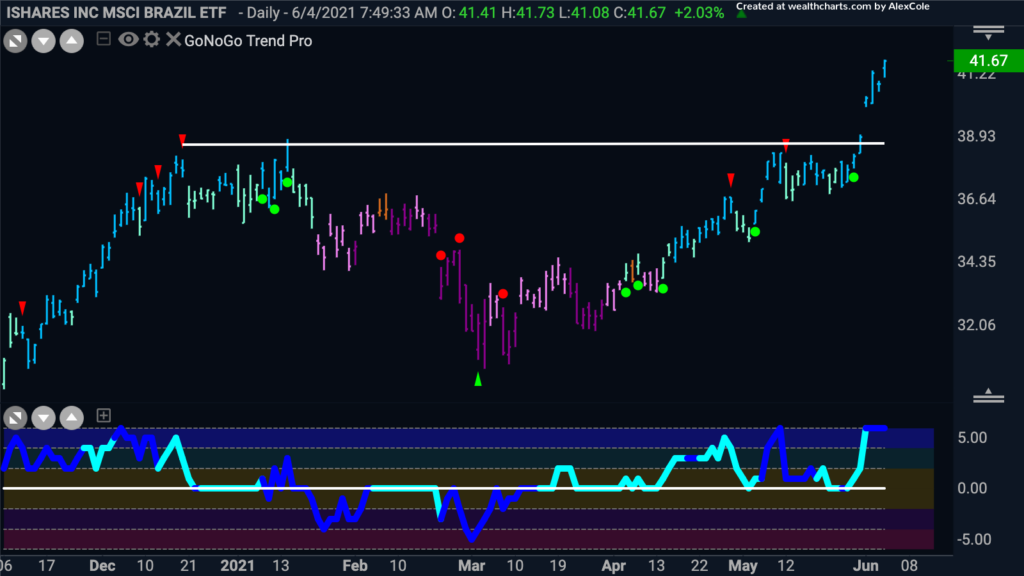
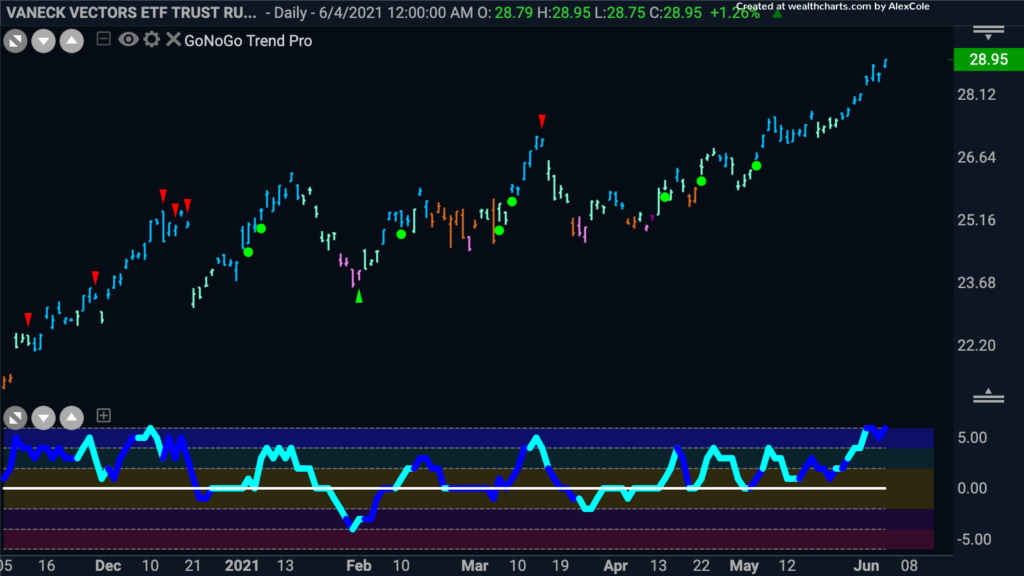
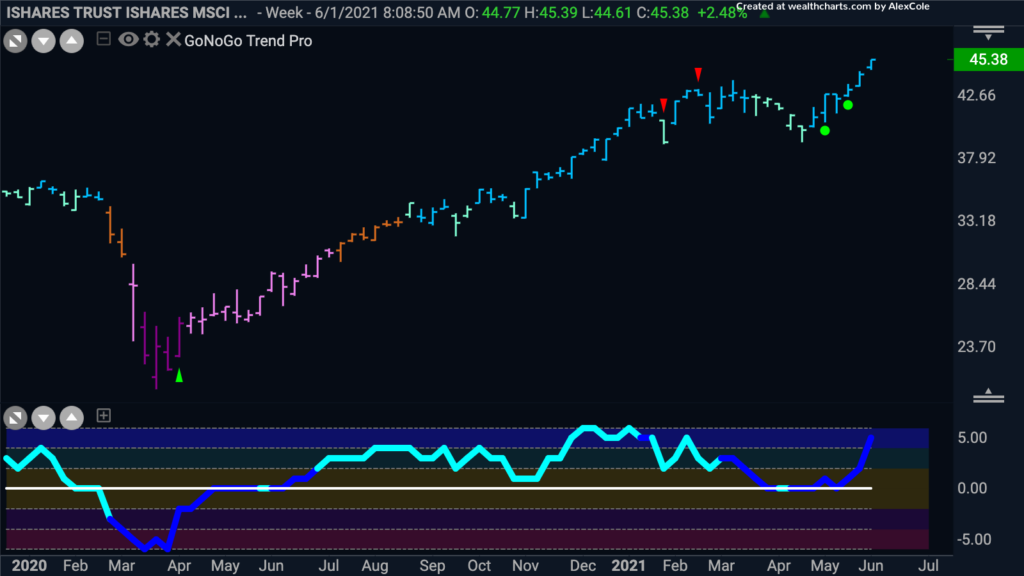
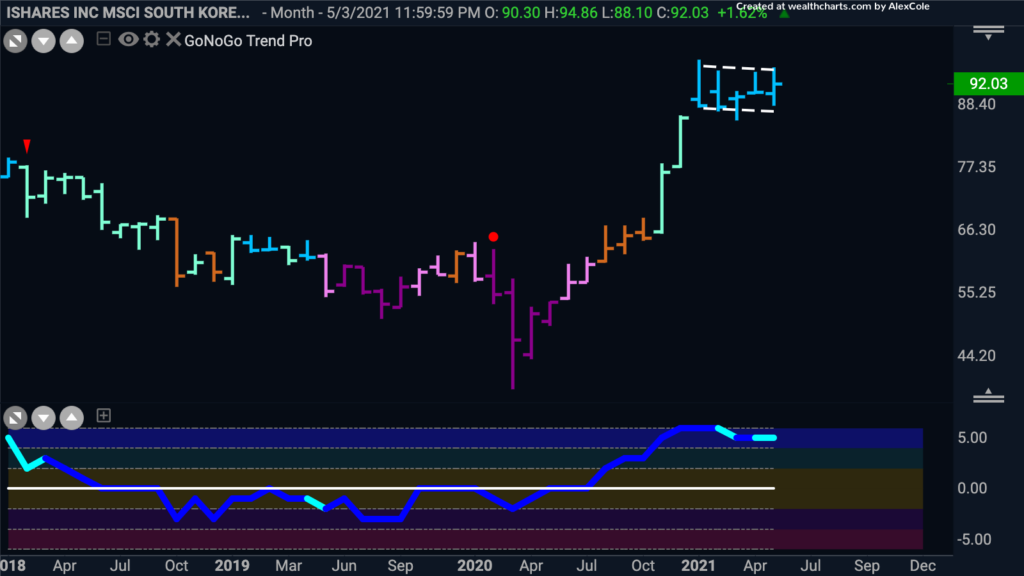
In order to experience a fully confirmed global expansion, we should see evidence of “Go” trends around the world. As May came to an end last month, we saw fresh breakouts and strong “Go” trends for many equity indexes. Brasil, Russia, India, and South Korea were standouts. See the GoNoGo Trend charts below:
Bovespa Index (Brasil) – Daily $EWZ
Moex Index (Russia) – Daily
BSE Sensex Index (India) – Weekly
Kospi Index (South Korea) – Monthly
Just look at the bull flag on this Monthly GoNoGo chart of the Kospi Index of South Korea:
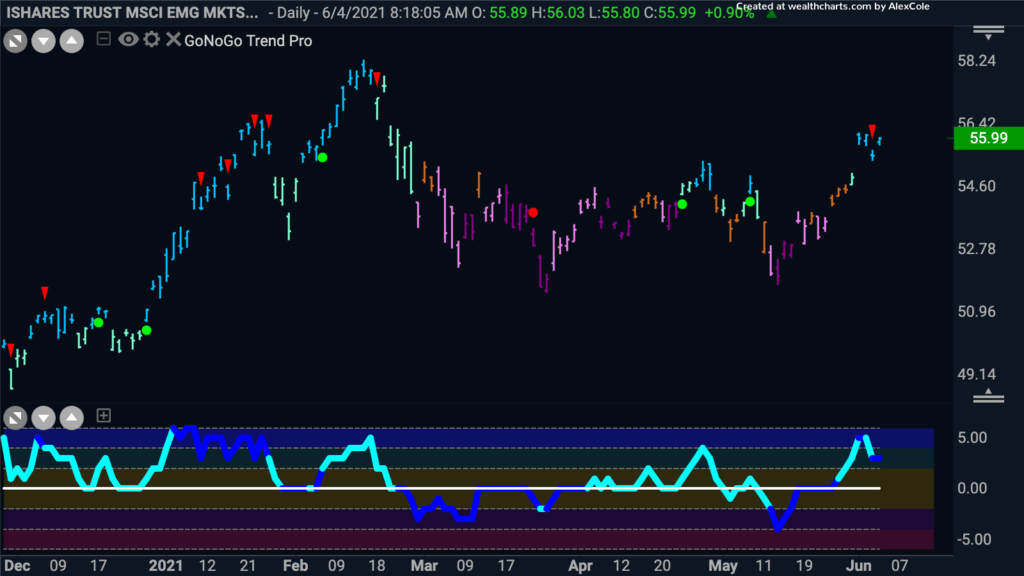
We can see the Emerging Markets are generally coming back into trend, but have not yet regained the Feb highs. The chart below shows the four-month consolidation of $EEM which looks ready to resume the prior move:
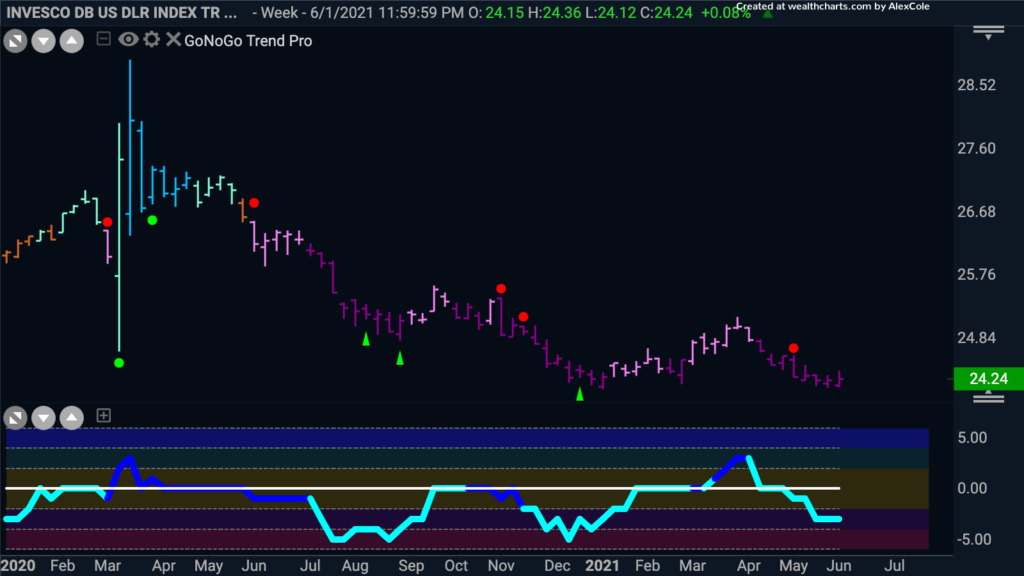
Before running out and dumping your portfolio holding to buy up the Moscow Exchange, keep in mind the currency risk associated with exposure to international equities. One of the tailwinds that is helping accelerate trends across emerging markets is a weak US Dollar. Consider the $UUP dollar etf chart below:
SEASONAL PUSH FOR ENERGY
Within the US context, Memorial Day weekend marks the official start to Summer, Covid vaccine rollouts have been successful, families are reuniting, and many are hitting the road for summer vacations despite the lack of rental cars. This, plus the energy demand of home cooling create a demand spike for fuel of every flavor.
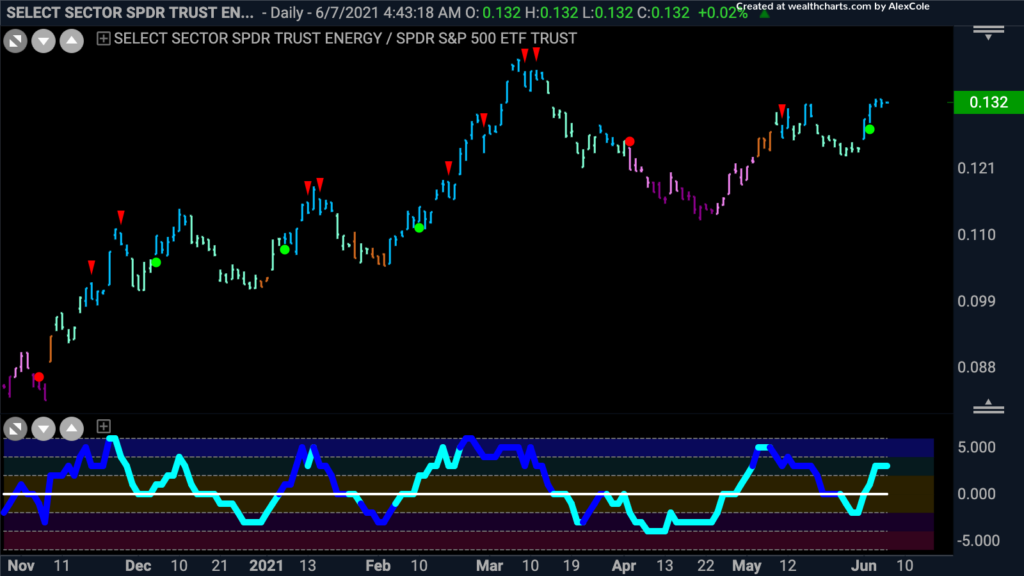
Year to date, the energy sector has delivered a 45.3% return, against roughly 12% for the S&P, and only a 6% return from the technology sector. See the daily GoNoGo chart below of the energy sector relative to the S&P 500 $XLE/SPY:
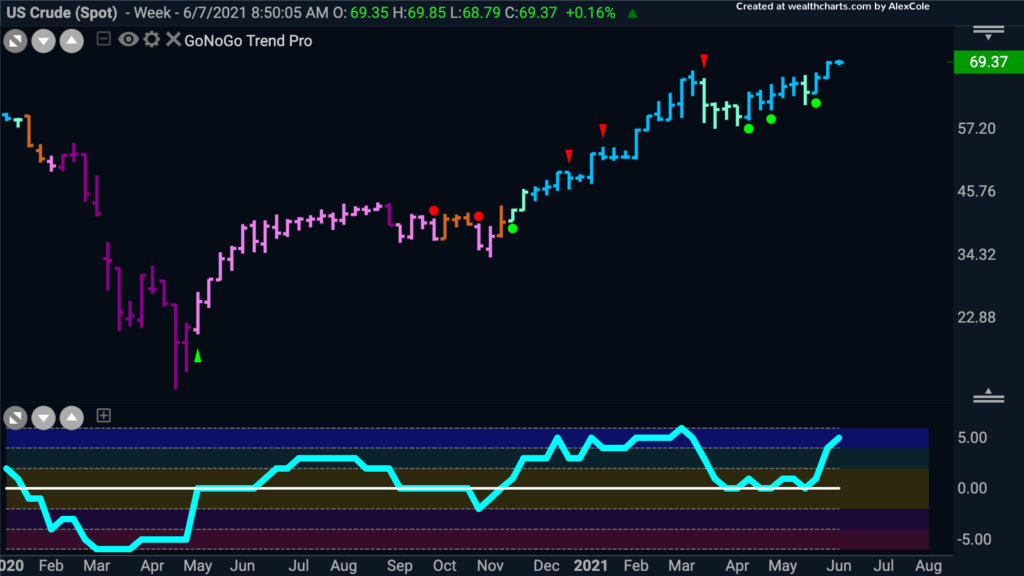
On an absolute basis, the trend for $USO is as strong as ever. WTI crude oil rose $0.81 to $69.62 per barrel last week. See the weekly GoNoGo Chart below of WTI futures:
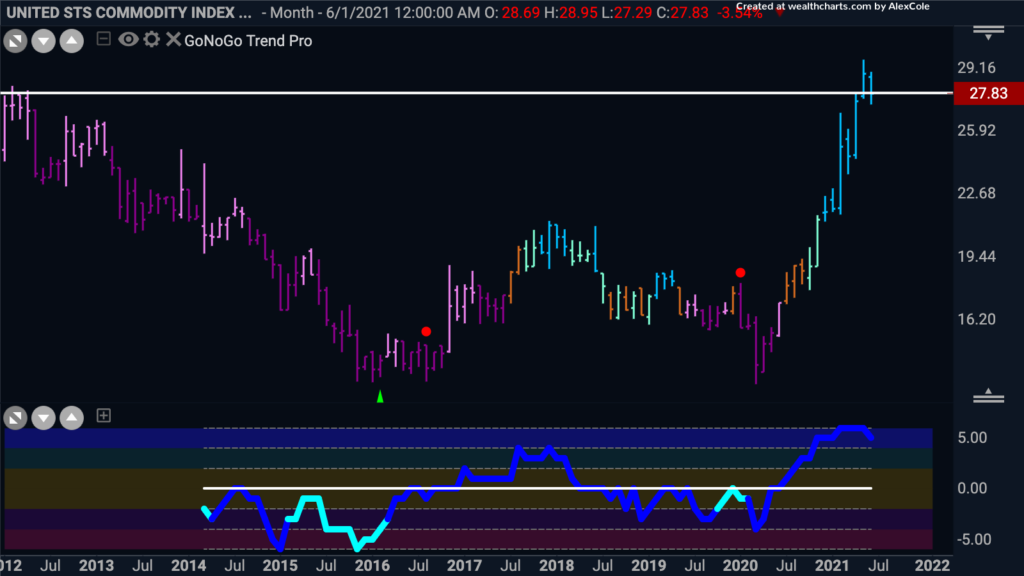
But this is not just an energy theme, commodities have been a strong asset class across the wide spectrum. See the monthly chart below of Copper breaking out of a 10-year base for its highest ever monthly closing price:
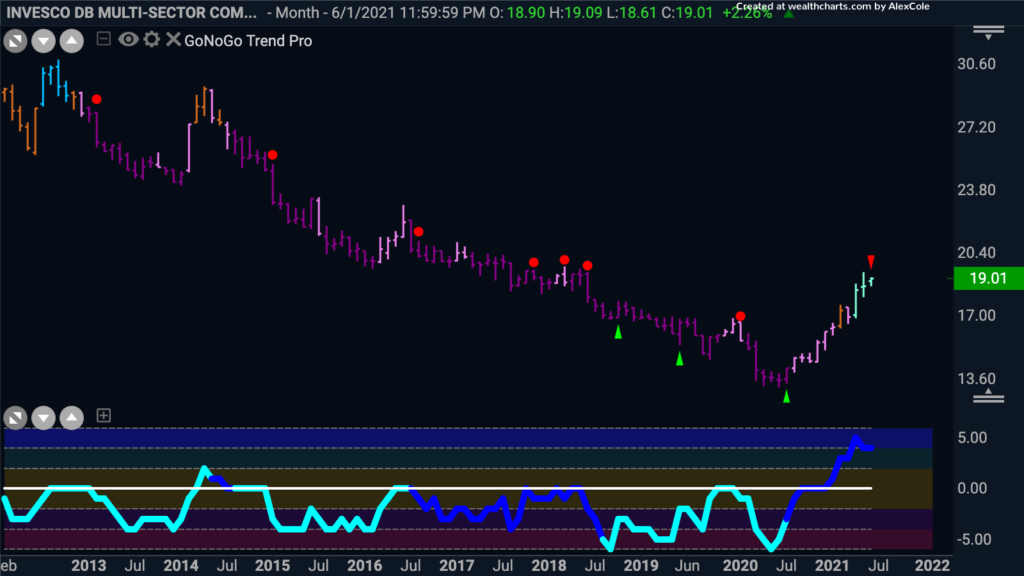
Agricultural commodities are an area GoNoGo Research has been harping on since the recovery rally began in 2020. Looking at the Monthly chart of $DBA, these soft commodities are just getting started…
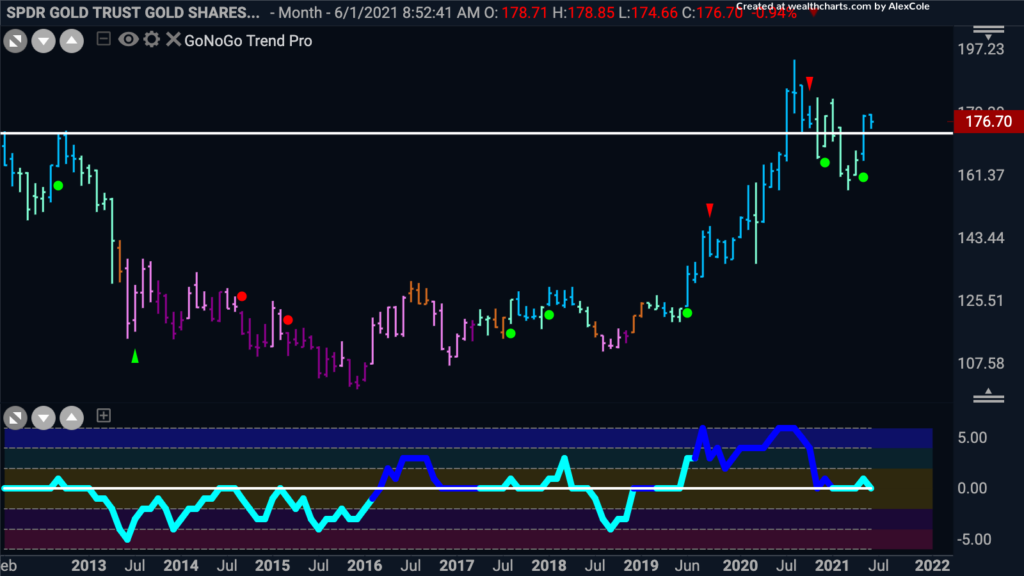
And, while we’ve seen commodities outperform for months now, the lone outcast was Gold. 2020 amounted to what looked like a failed breakout, but the bullish thesis for Gold is regaining its argument. See the Monthly close above prior resistance and the multi-year base breakout and retest:
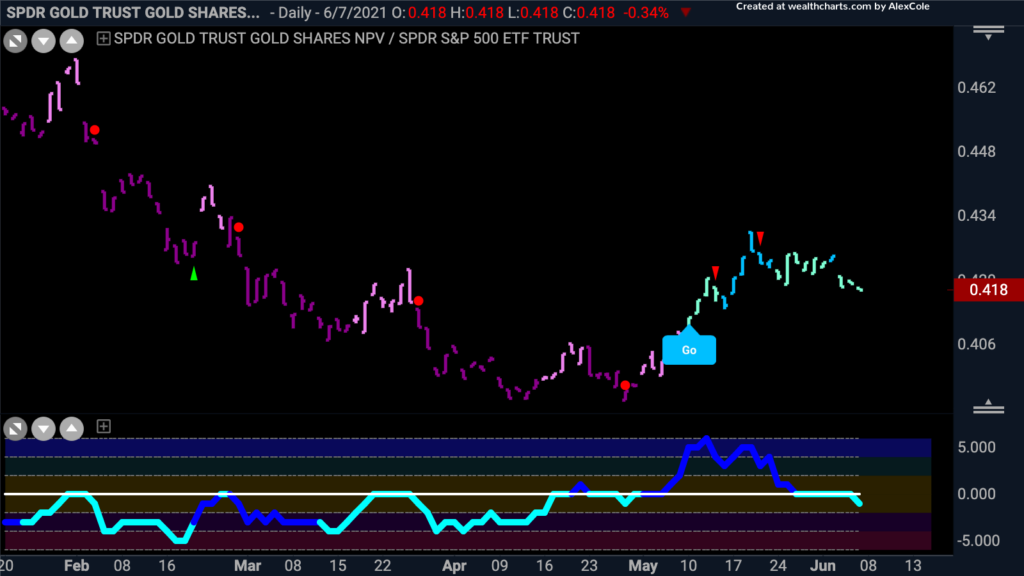
Gold become a particularly interesting trade when you look at the relative performance of gold to US Equities. See the daily chart below of $GLD/SPY:
BOND BEARS
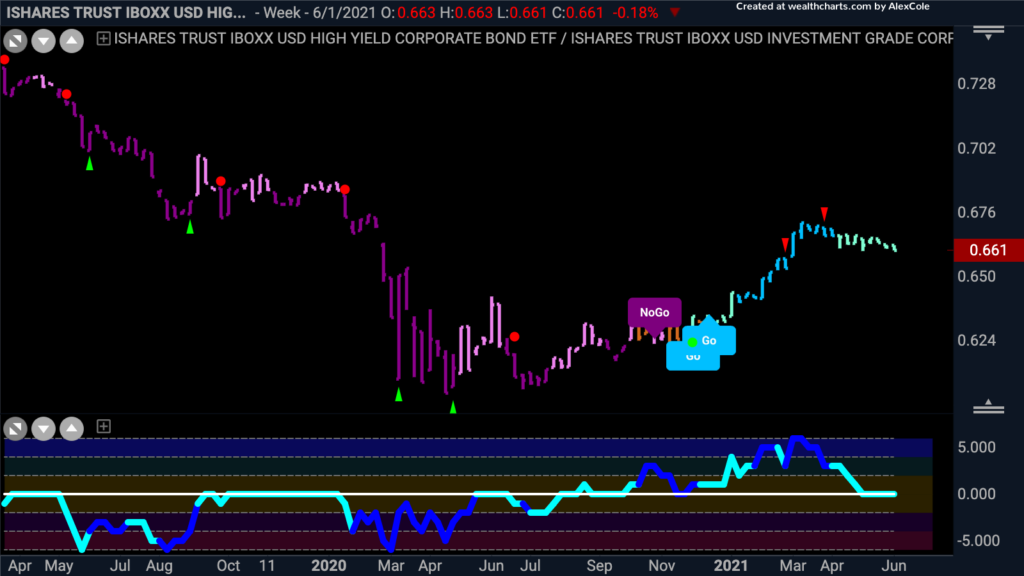
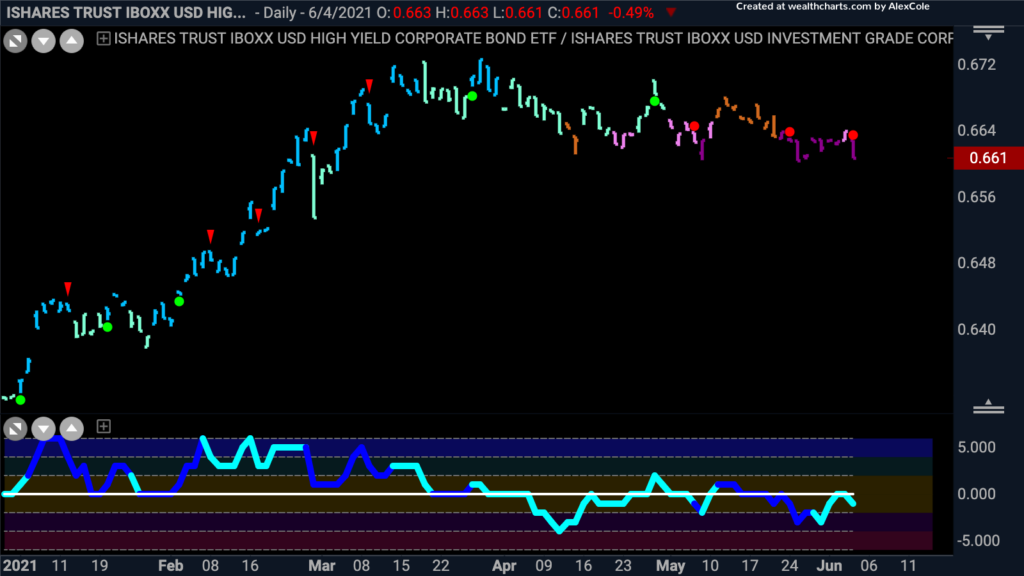
They say the smart money is in credit. Maybe its just the pessimism. But we can certainly look to the bond market for leading indicators to the stock market. For example, we can see a deterioration in risk appetite by simply looking at the trend of High Yield (or “junk”) bonds to corporate-grade credit. See the ratio charts below of $HYG/LQD.
On the weekly timeframe, there is nothing too troubling. This is still in a weak “Go” trend, GoNoGo Oscillator is at zero and the GoNoGo Squeeze grid is climbing. It looks like this risk proxy has the potential to resolve in the direction of the underlying trend:
But drilling into the daily time period we can see further deterioration in this pair:
The Weight of the Evidence in Summary:
Risk-off readings in the bond market could be a warning towards a near-term pullback in the equities markets. Gold outperforming the S&P is another sign of deterioration. But the big picture view is that the health of the global economy is picking up. The rest of the world is joining the recovery rally and natural resource heavy markets across the globe are catching the bid.
Let’s close with a look at the US equity sectors relative to the S&P Benchmark. In this map we can see that consumer staples ($XLP) are outperforming the benchmark, while consumer discretionary ($XLY) are underperforming. That is a cautionary sign for US equities, however, we know the cap-weightings of constituents like Tesla can throw off these relationships on the basis of short term volatility in a single name. We do not see confirmation in the Utilities sector of a completely risk-off move for equities. WE do continue to see cyclical sectors outperforming, though there was a notable move within the communications sector ($XLC) to close out last week.
Food for thought from Dr. Richard Thaler, Nobel prize-winning behavioral economist:
There are many failings that get us into trouble financially, as I describe in Misbehaving. … The first is loss aversion. Losses have about twice the emotional impact of an equivalent gain. Fear of losses (and a tendency toward short-term thinking — I’m sneaking in a third one here) can inhibit appropriate risk-taking.
For example, investing in the stock market has historically provided much higher returns than investing in bonds or savings accounts, but stock prices fluctuate more, producing a greater risk of losses. Loss aversion can prevent investors from taking advantage of the long-term opportunities in stocks.


