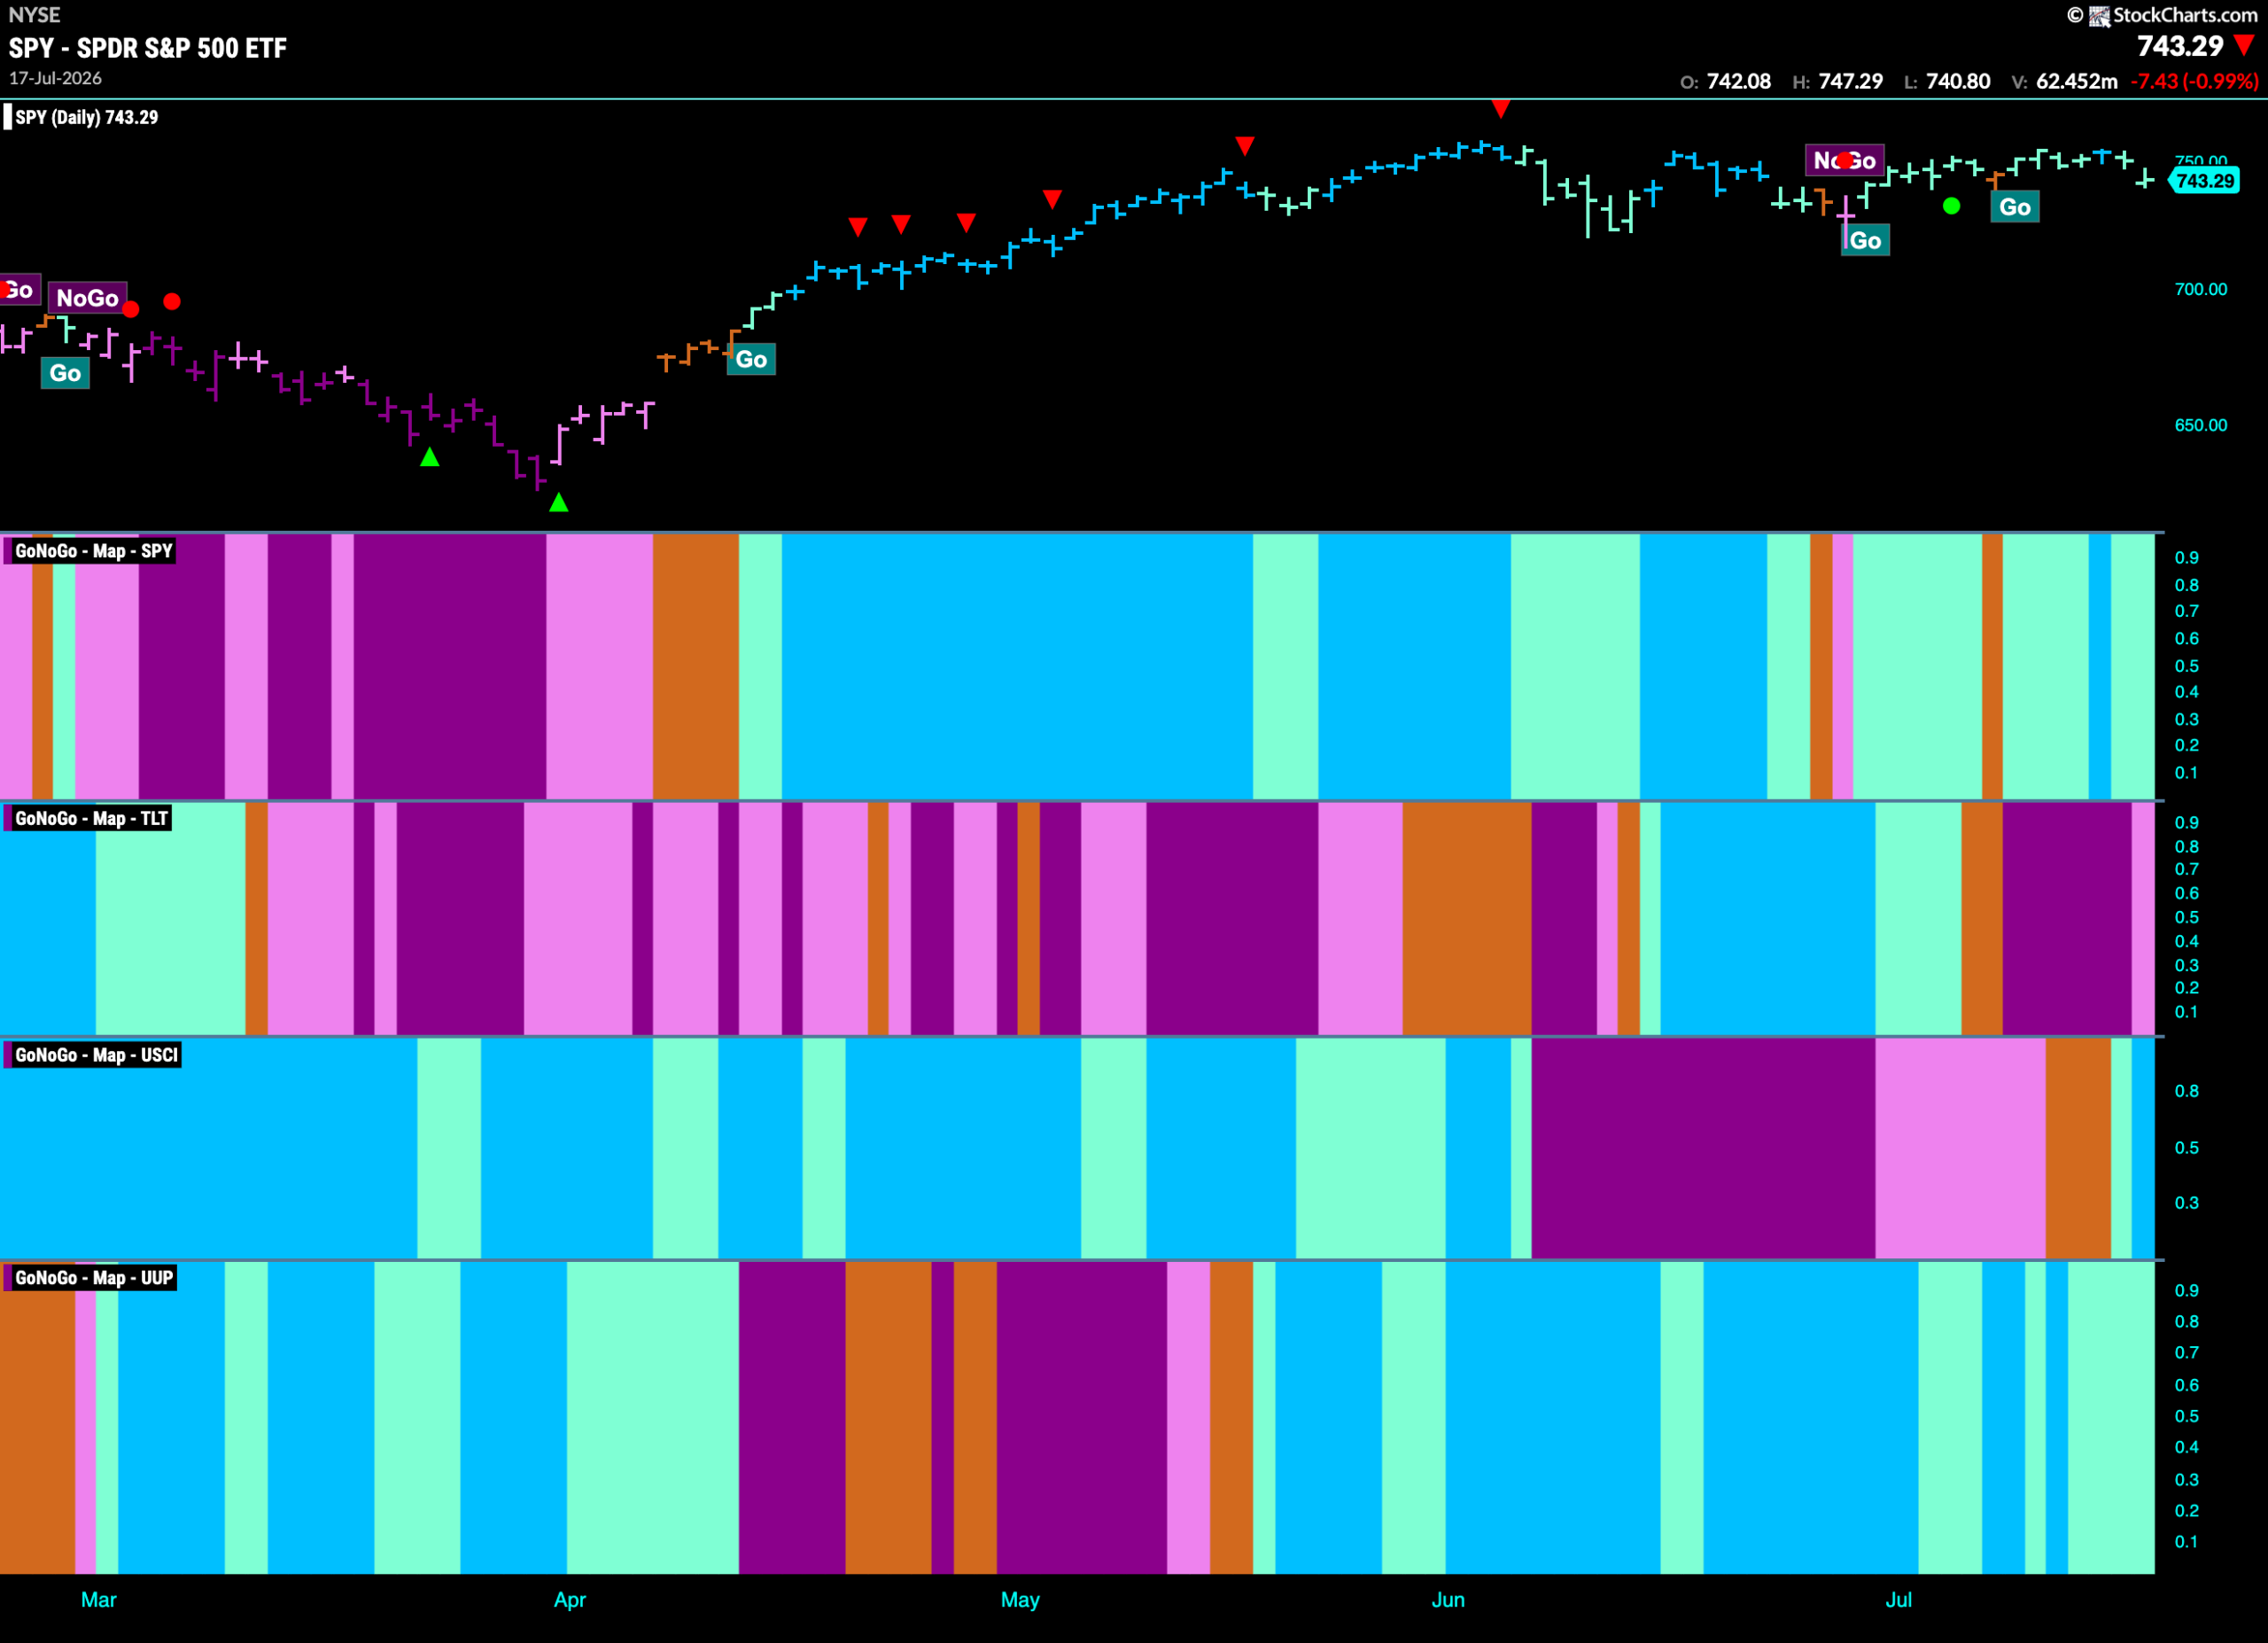
Good morning and welcome to this week’s Flight Path. The equity trend survived another week but after a single strong bar we saw weaker aqua colors return. Treasury bond prices remained in a “NoGo” trend and here also we saw weakness with a pink bar. The U.S. commodities saw a “Go” trend return after several amber “Go Fish” bars of uncertainty and the week ended with a strong blue bar. The dollar saw its “Go” trend continue but again we see weakness with aqua bars.
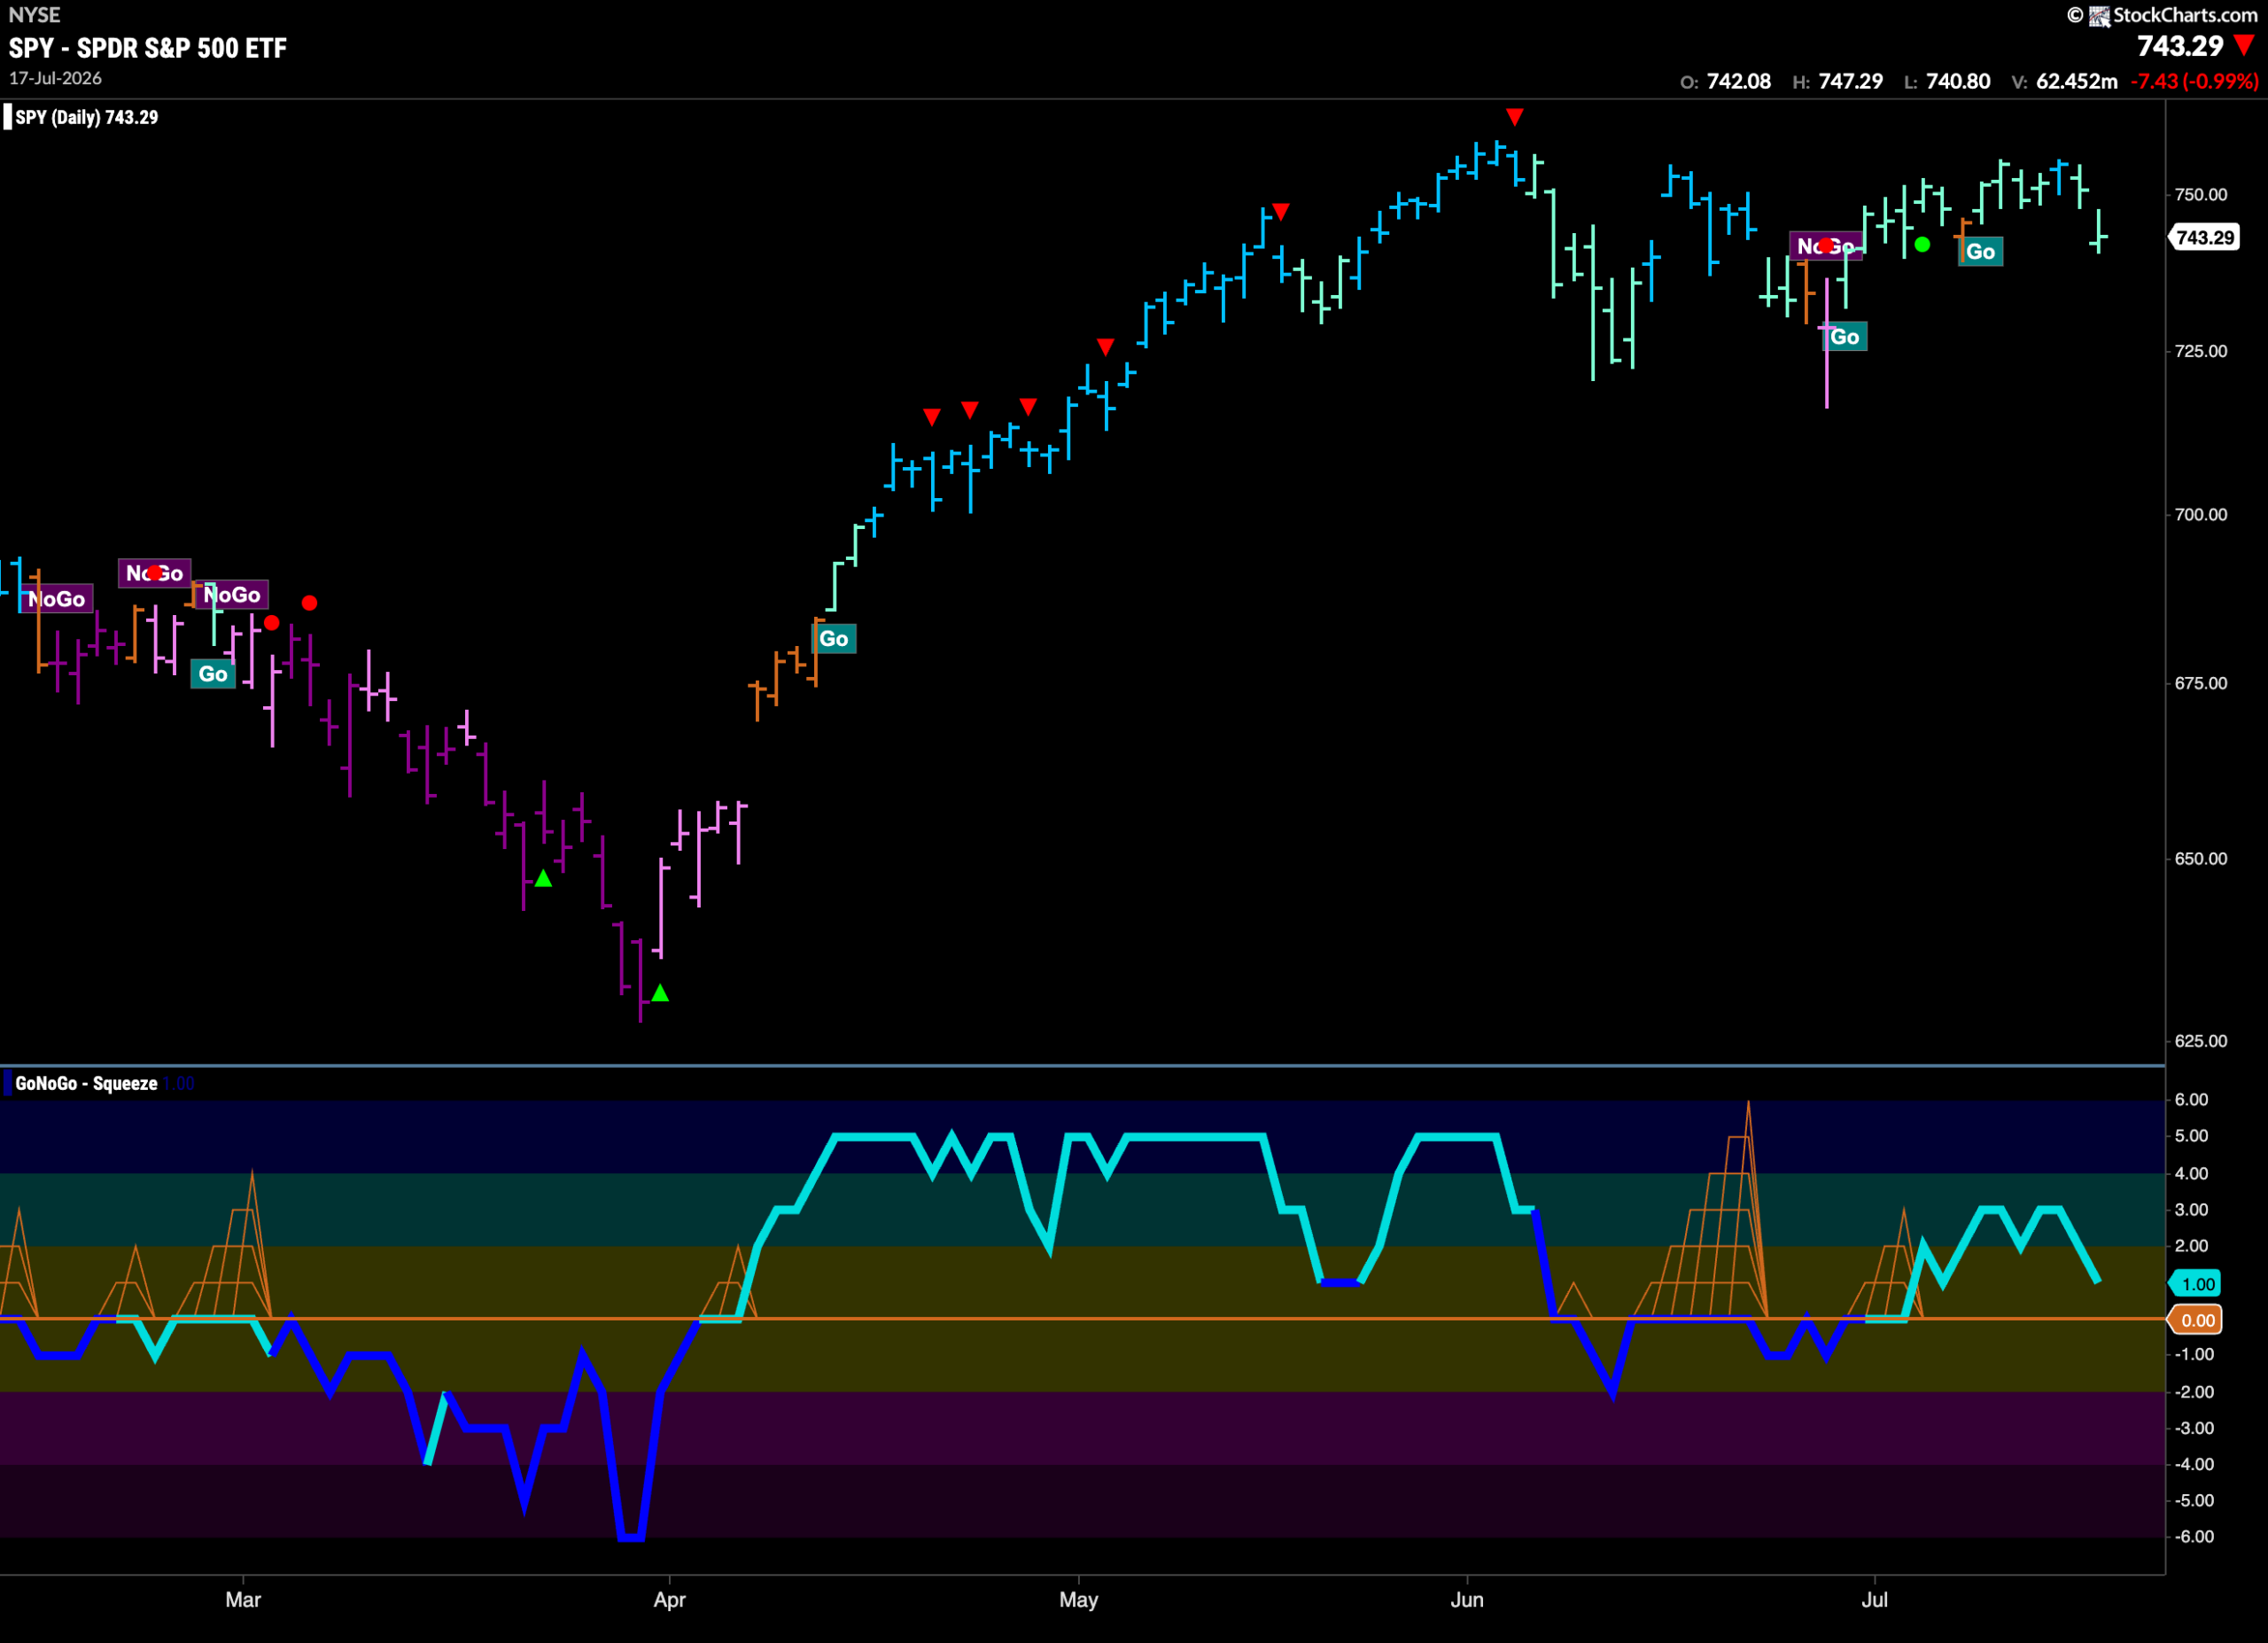
$SPY Sees Prices Fall but “Go” Remain for Now
The GoNoGo chart below shows that price fell on the last bar of the week as GoNoGo Trend painted aqua bars and price failed to hit a new higher high. If we turn our attention to the oscillator panel we can see that although it is still in positive territory at a value of 1 it is falling toward the zero line. It will be important to note whether it finds support at this level should it test it in the next few days.
The weekly chart shows that the “Go” trend continues and we see the indicator paint another strong blue “Go” bar. It is interesting to note that this week saw a lower weekly close and a failure to set a new higher high. GoNoGo Oscillator is in positive territory but not overbought at a value of 2.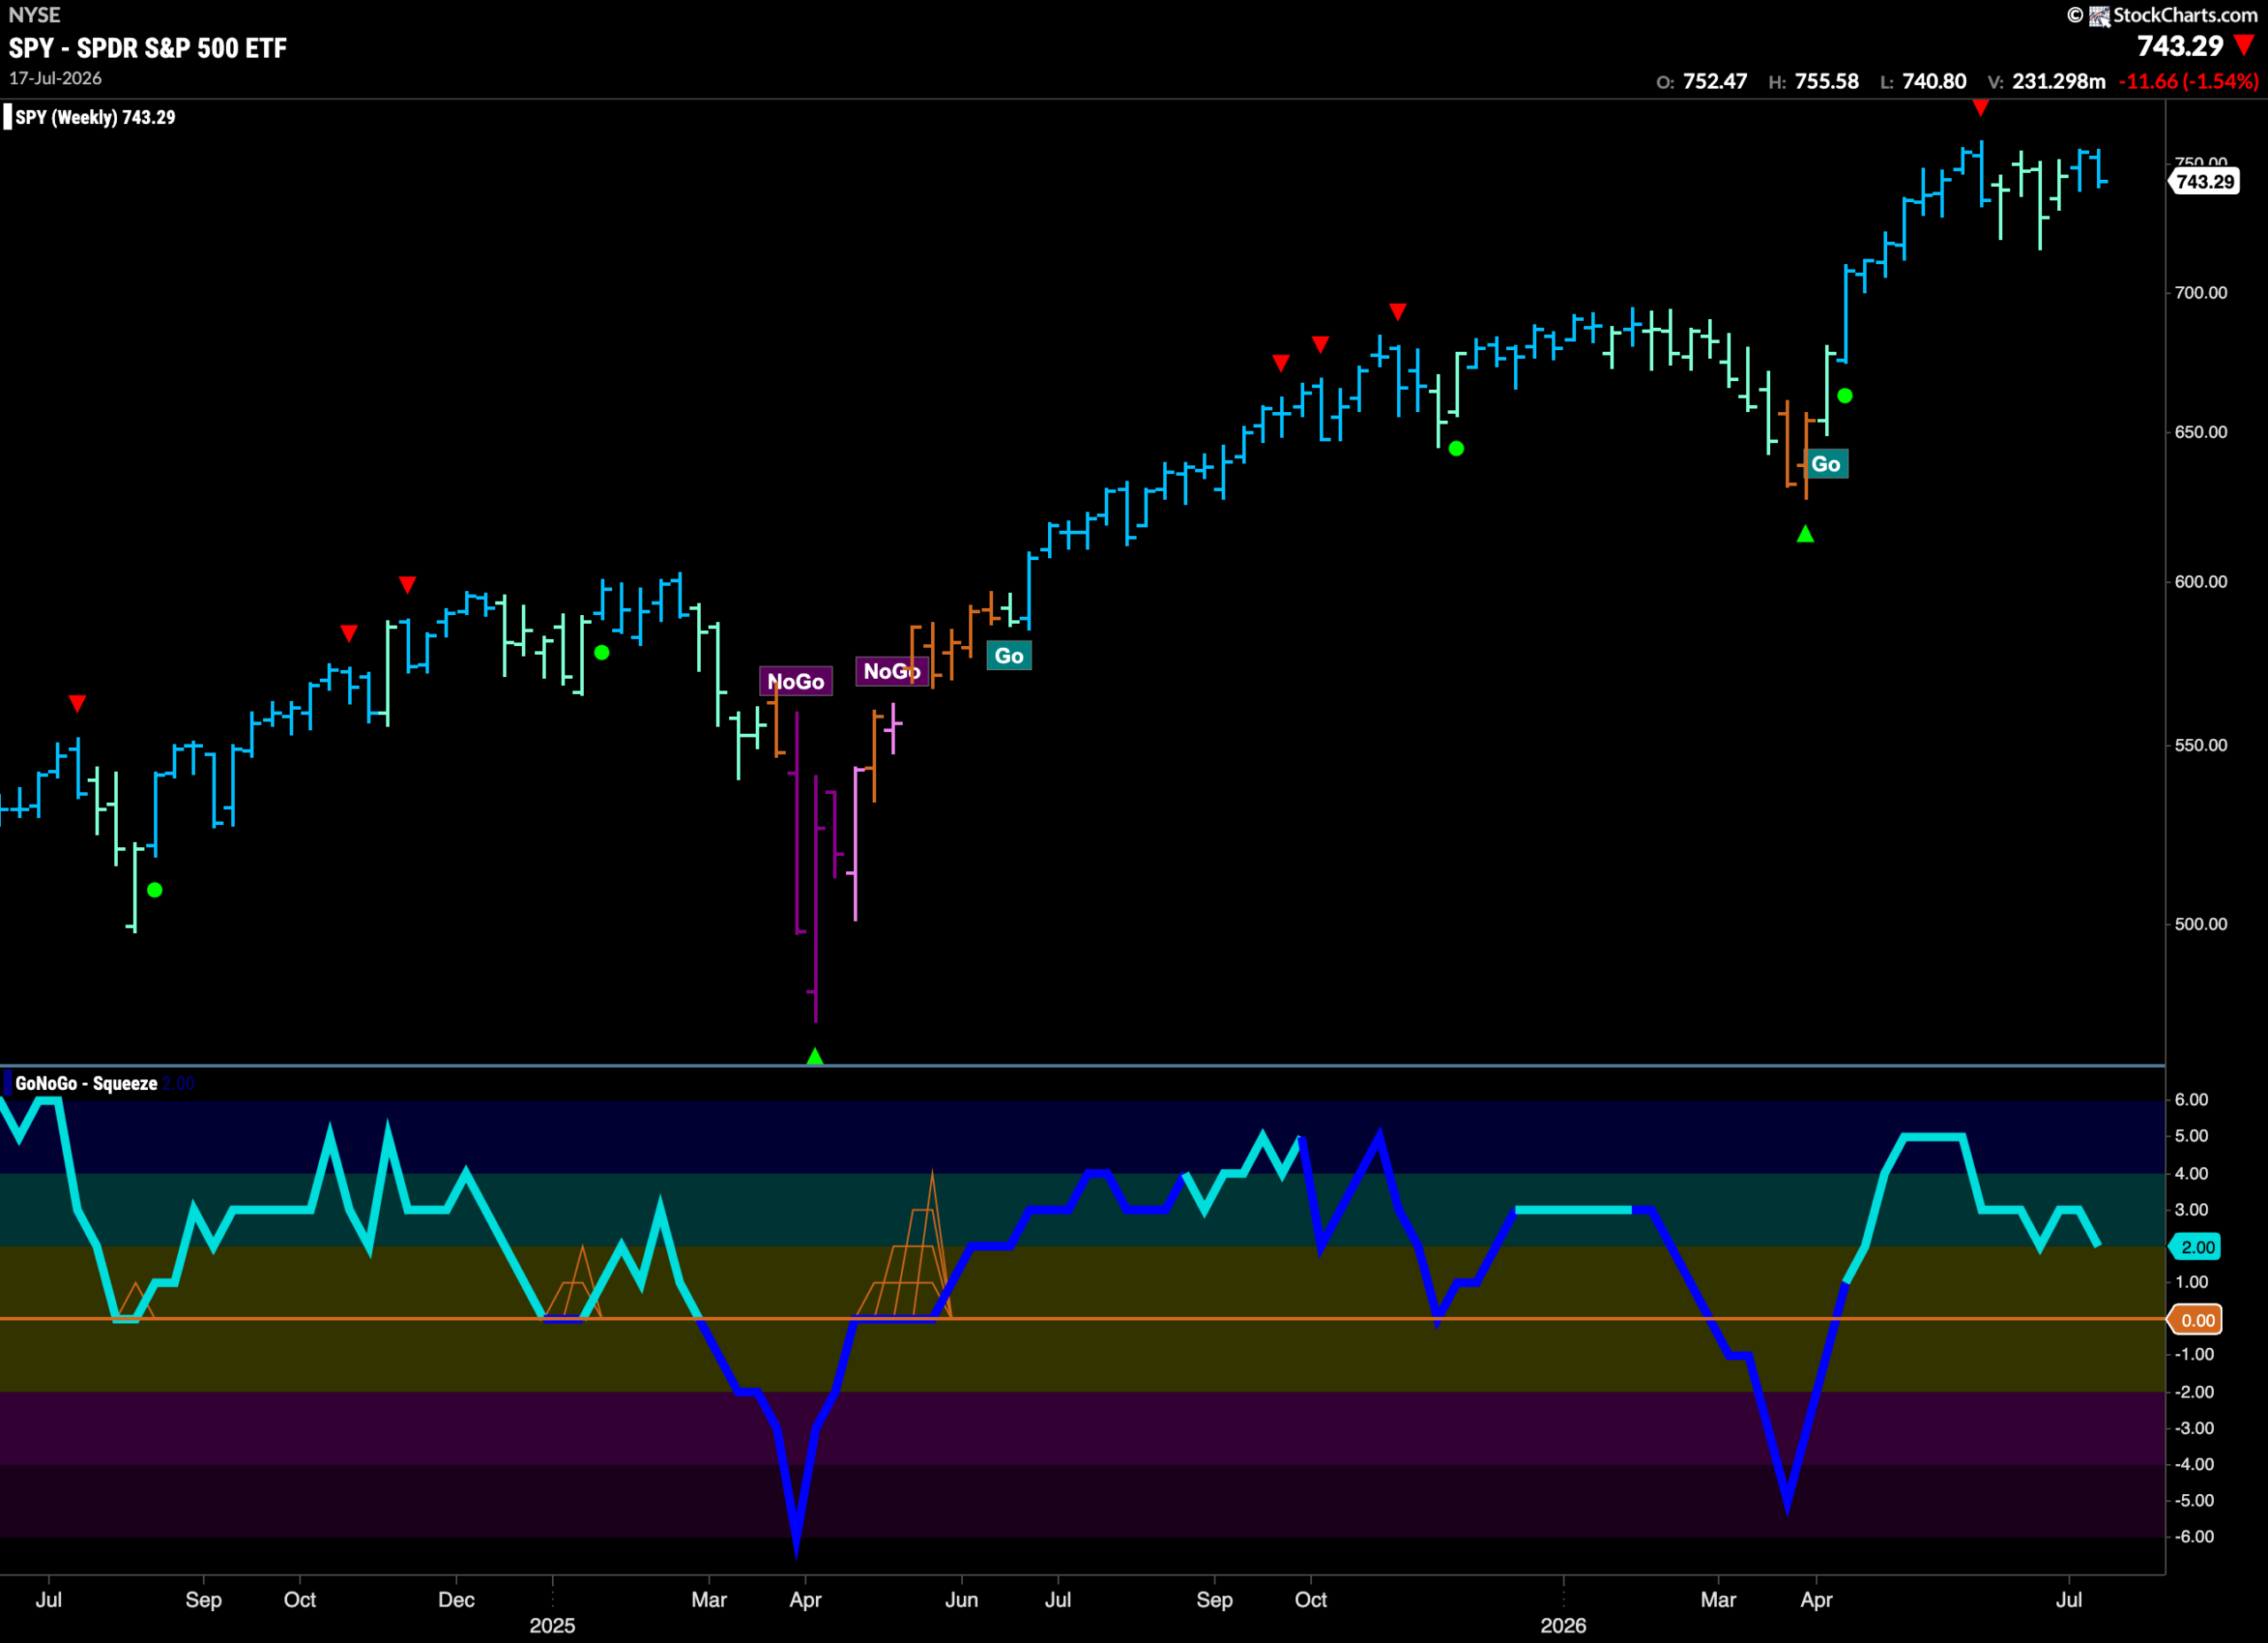
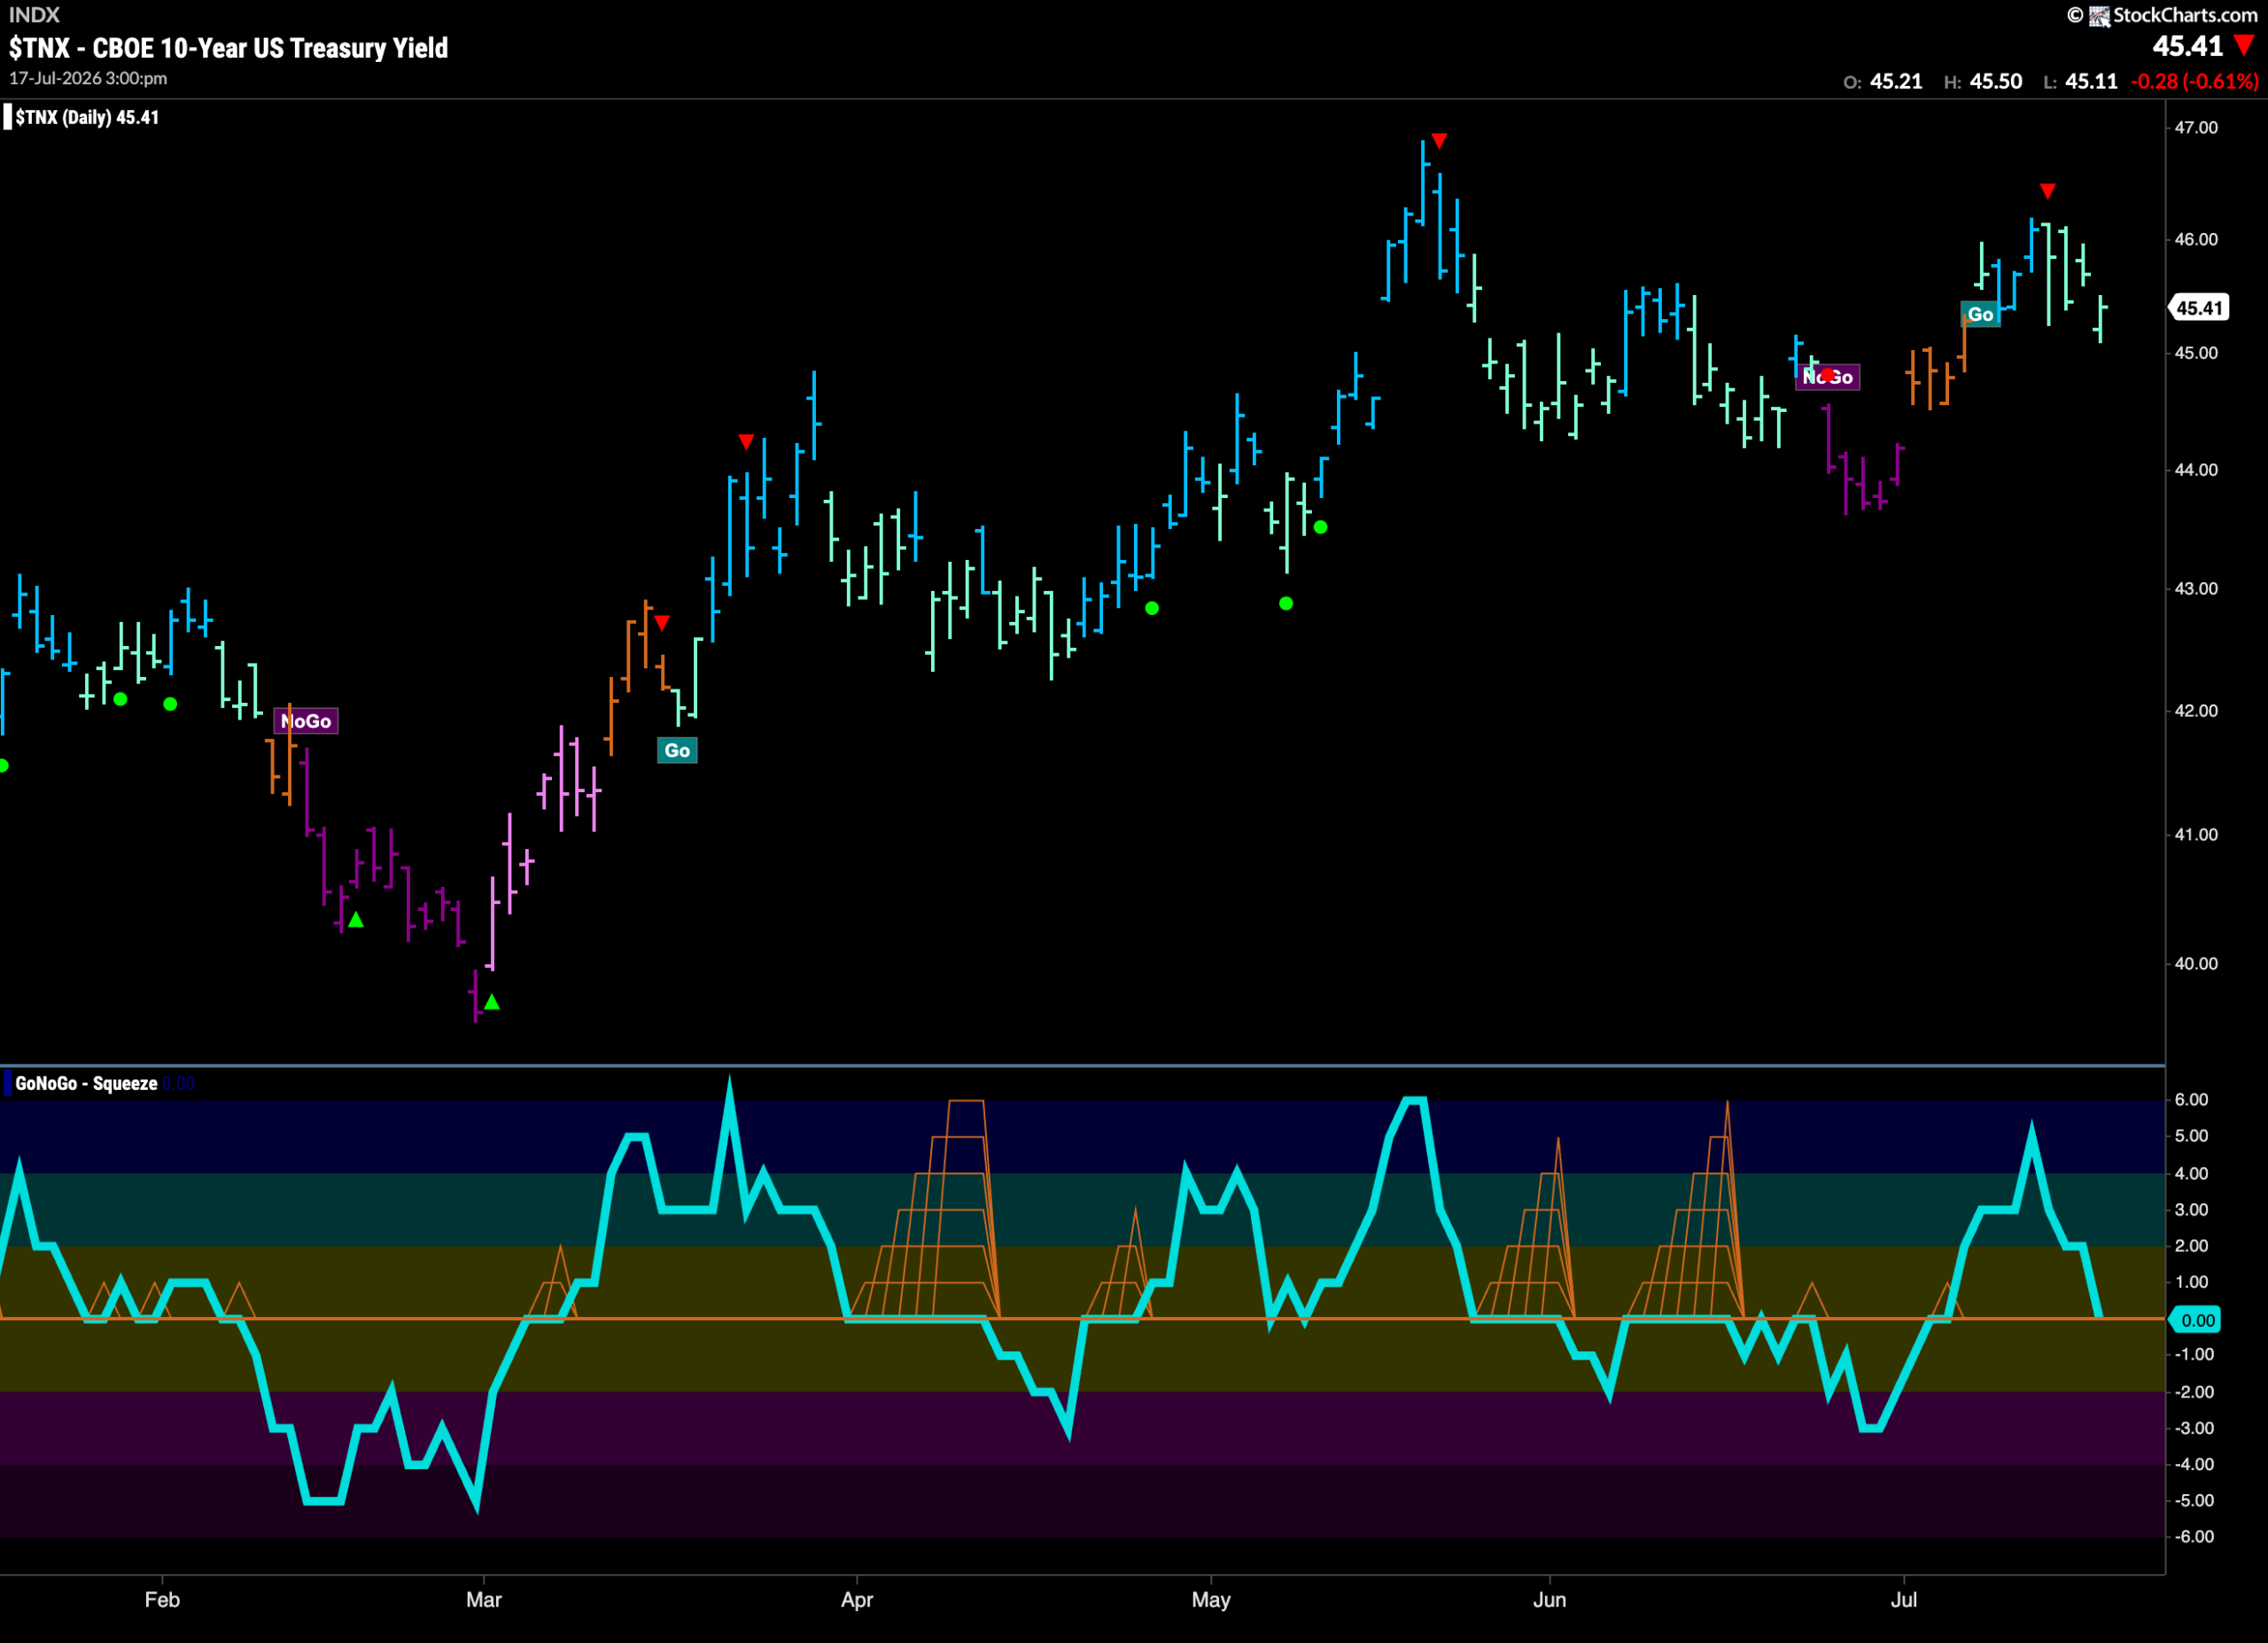
Treasury Rates Remain in “Go” Trend but Quickly Show Weakness
GoNoGo Trend shows that the “Go” trend for rates survives but we see a string of weaker aqua bars as no new higher high is set. If we look at the oscillator panel we see that GoNoGo Oscillator is testing the zero line from above and it will be important to watch to see if support is found at this level or if momentum turns negative.
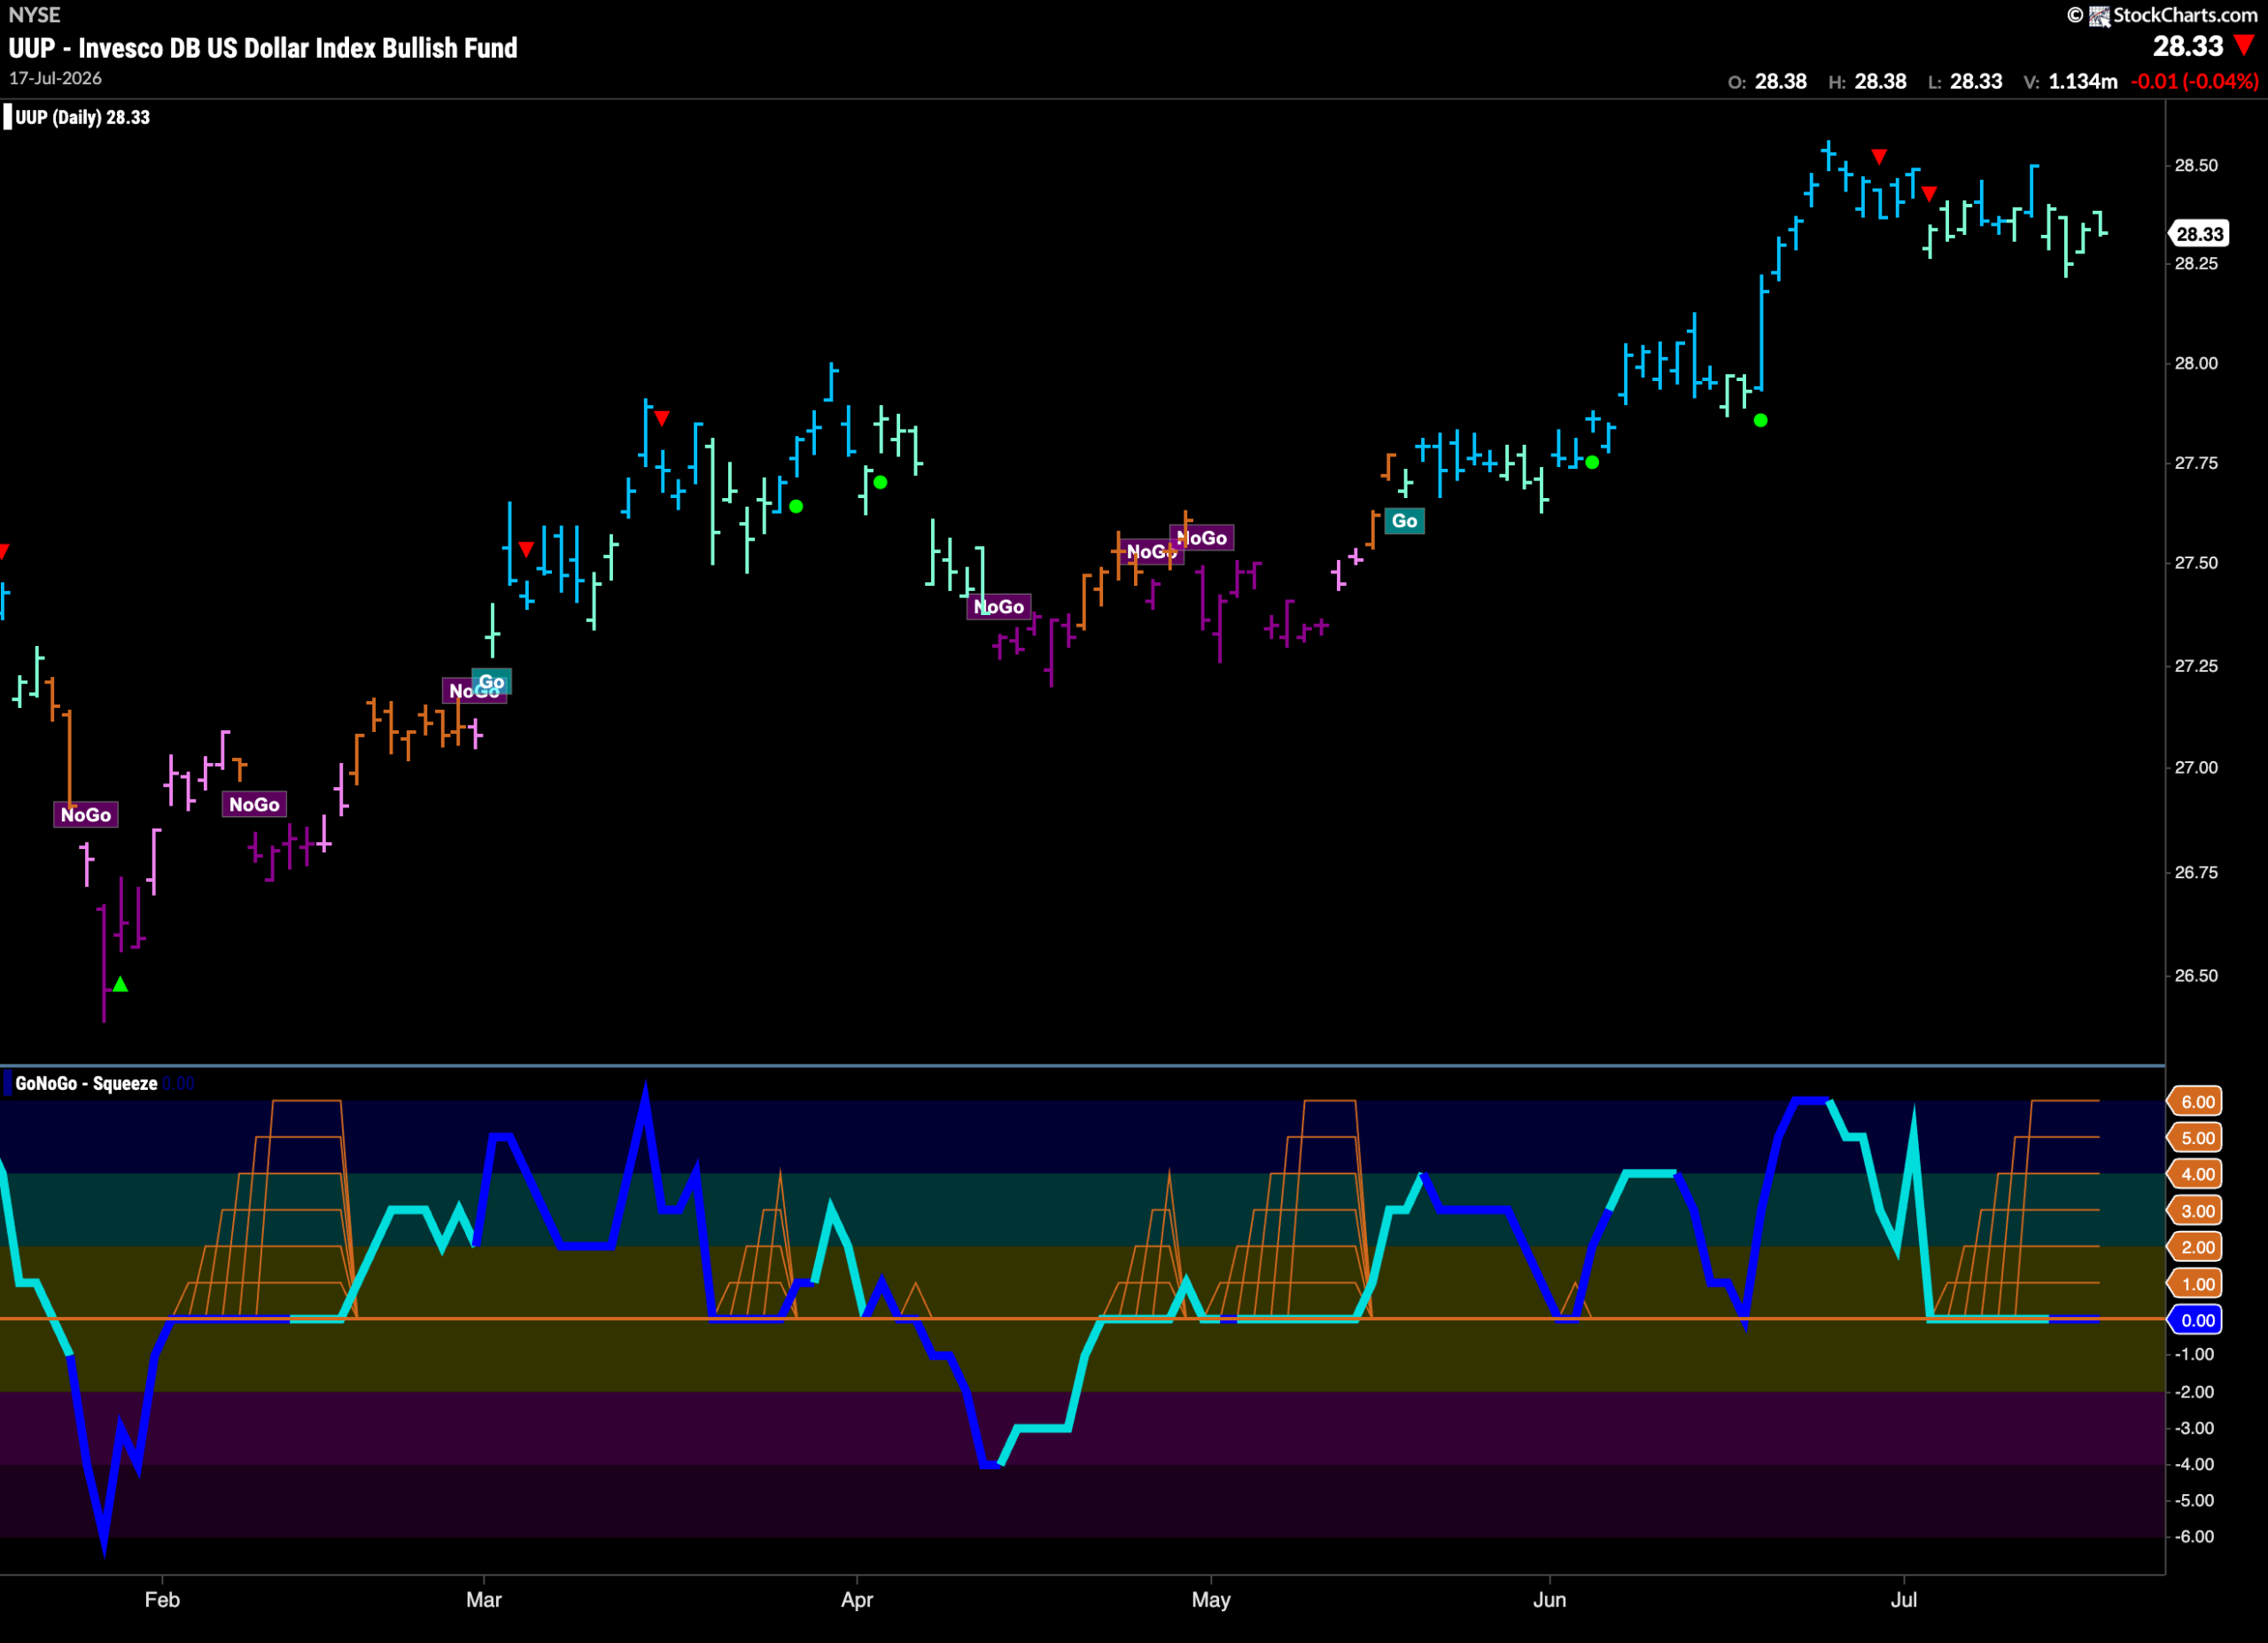
Dollar ($UUP) Shows Weakness as The GreenBack Falters
The chart below shows that the “Go” trend has remained in place for another week but we see weakness as the indicator paints pale aqua bars and price edges further away from the recent high. GoNoGo Oscillator is in an extended Max GoNoGo Squeeze and we will watch to see in which direction the Squeeze is broken to help us determine price’s next move.
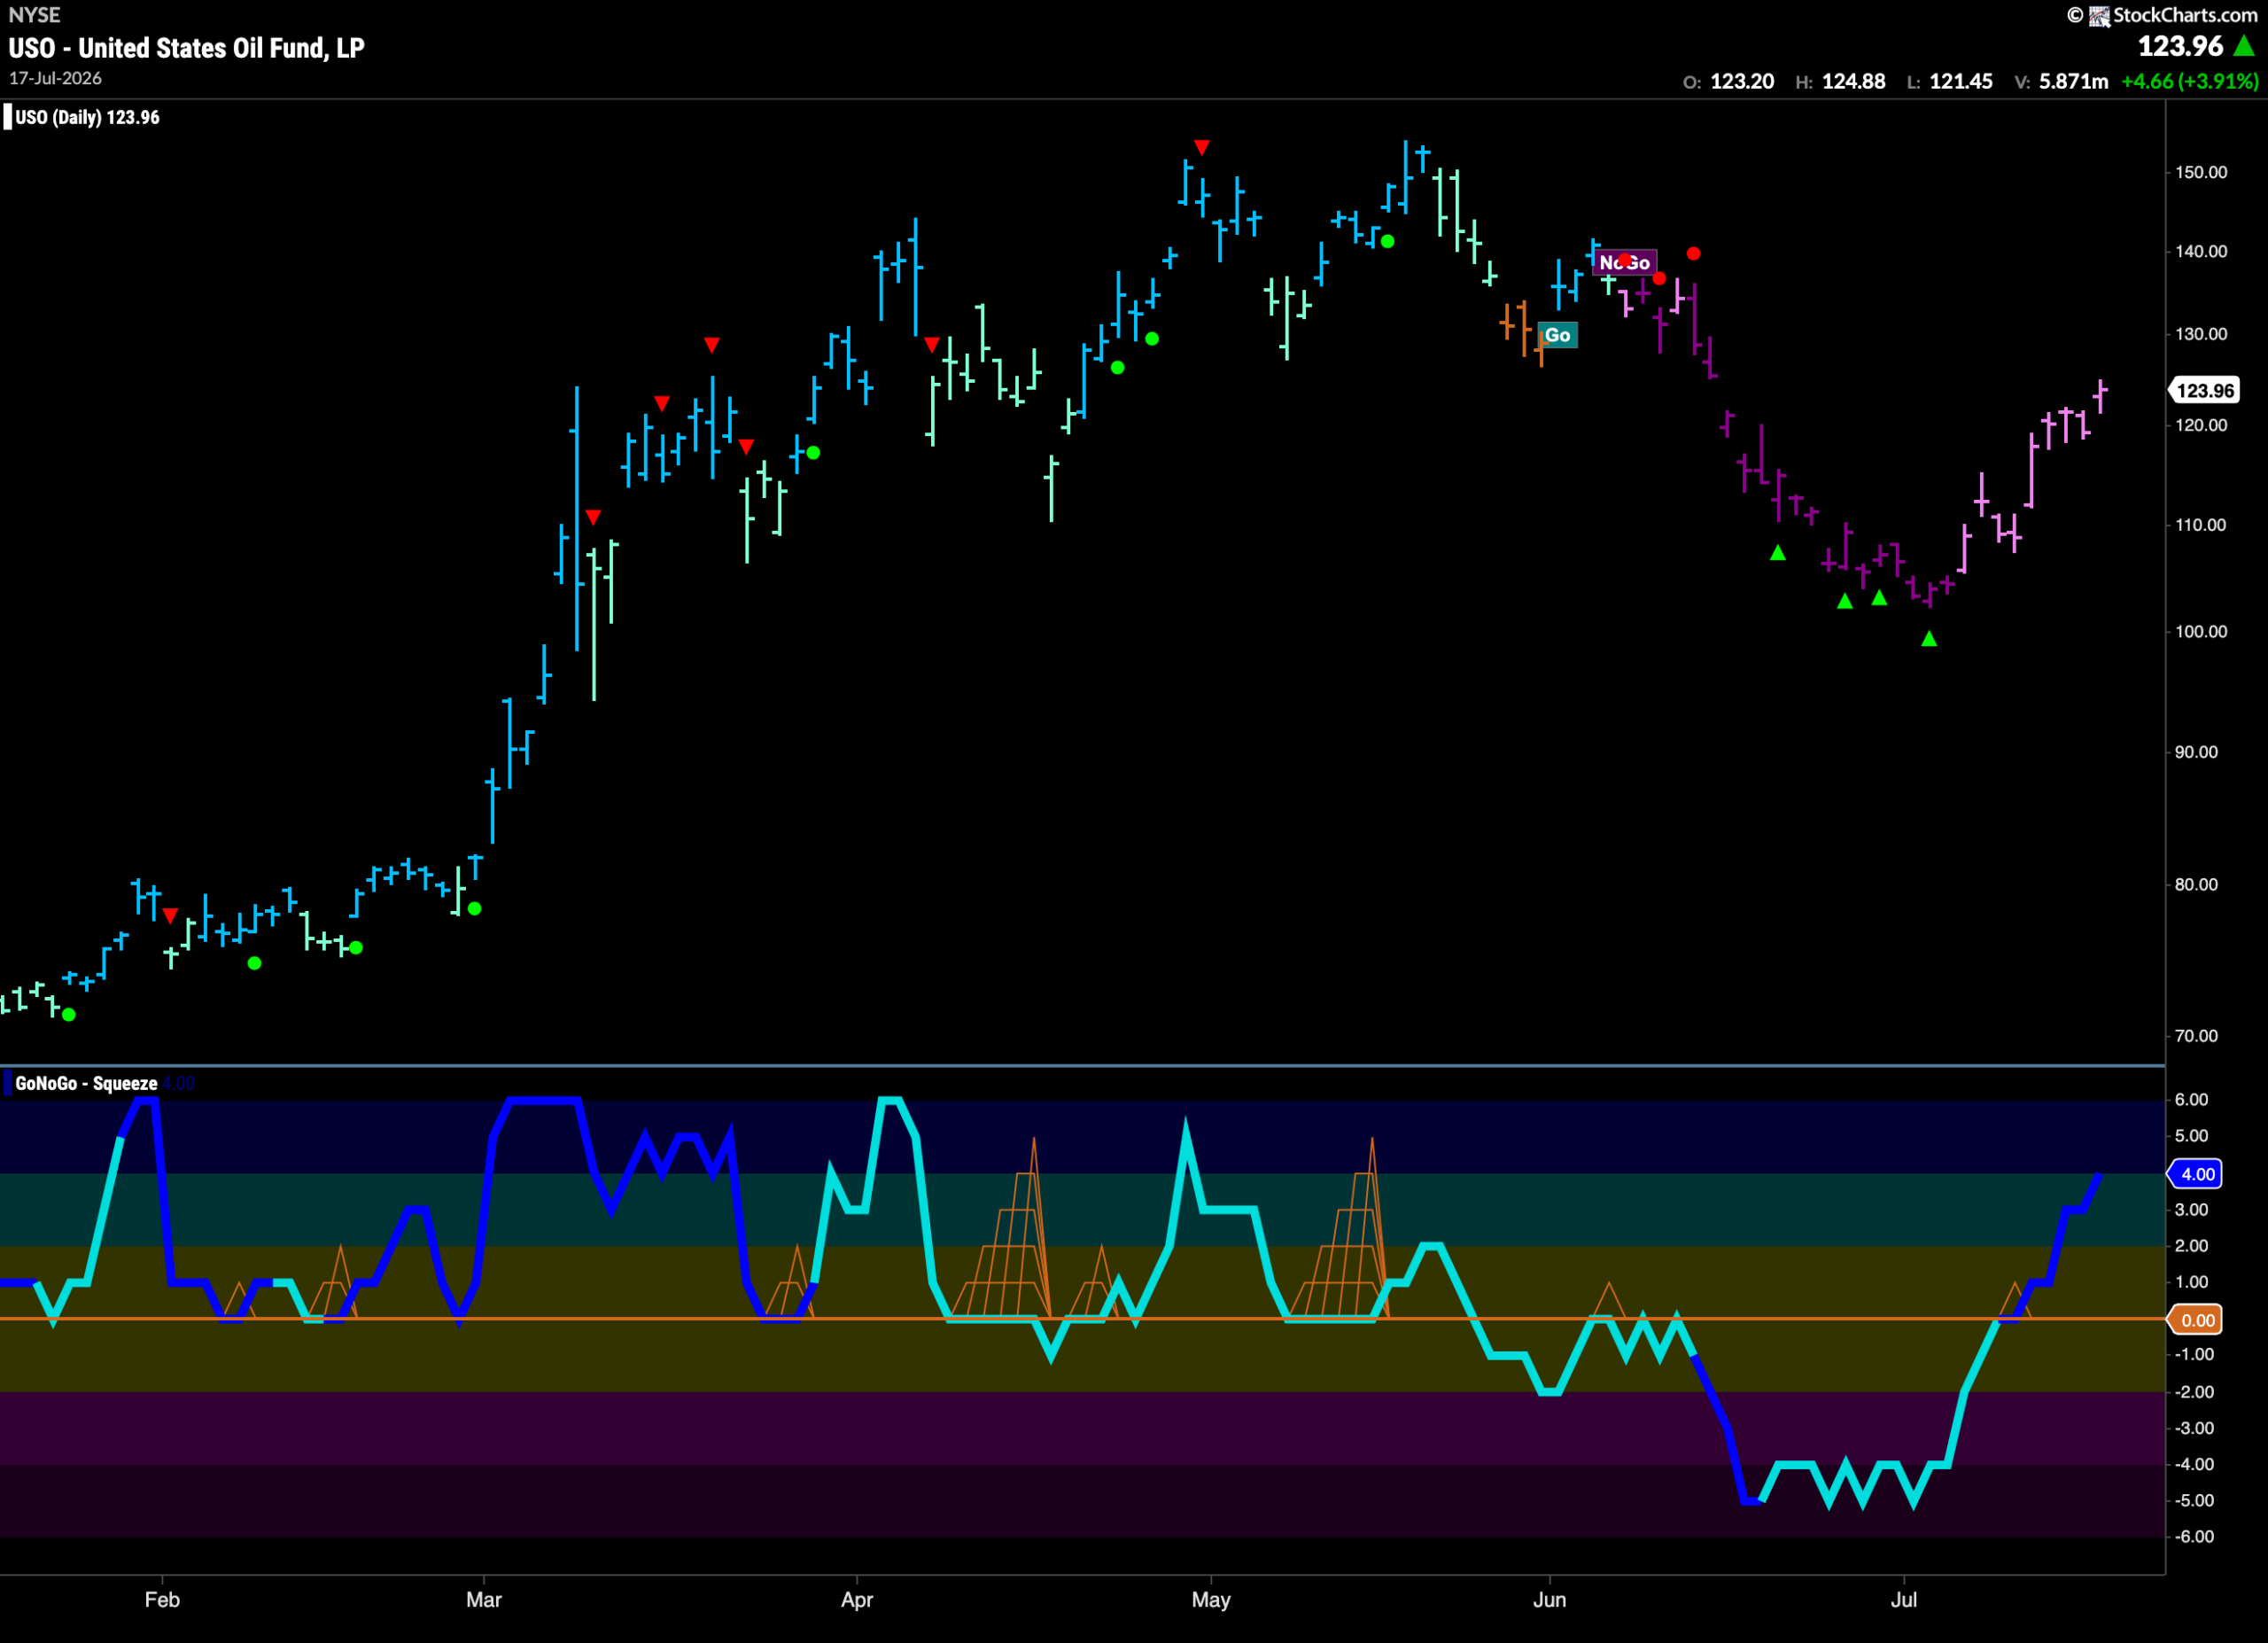
Are We Seeing Strong Relief Rally in $USO?
GoNoGo Trend shows that the “NoGo” trend in oil has continued this week but we see more weakness with continued pink bars. Is this a drawn out relief rally or are we heading for a new “Go” trend. If we turn our attention to the oscillator panel we see that it broke through the zero line back into positive territory on heavy volume. This tells us that momentum is out of step with the “NoGo” trend we see in the price panel.
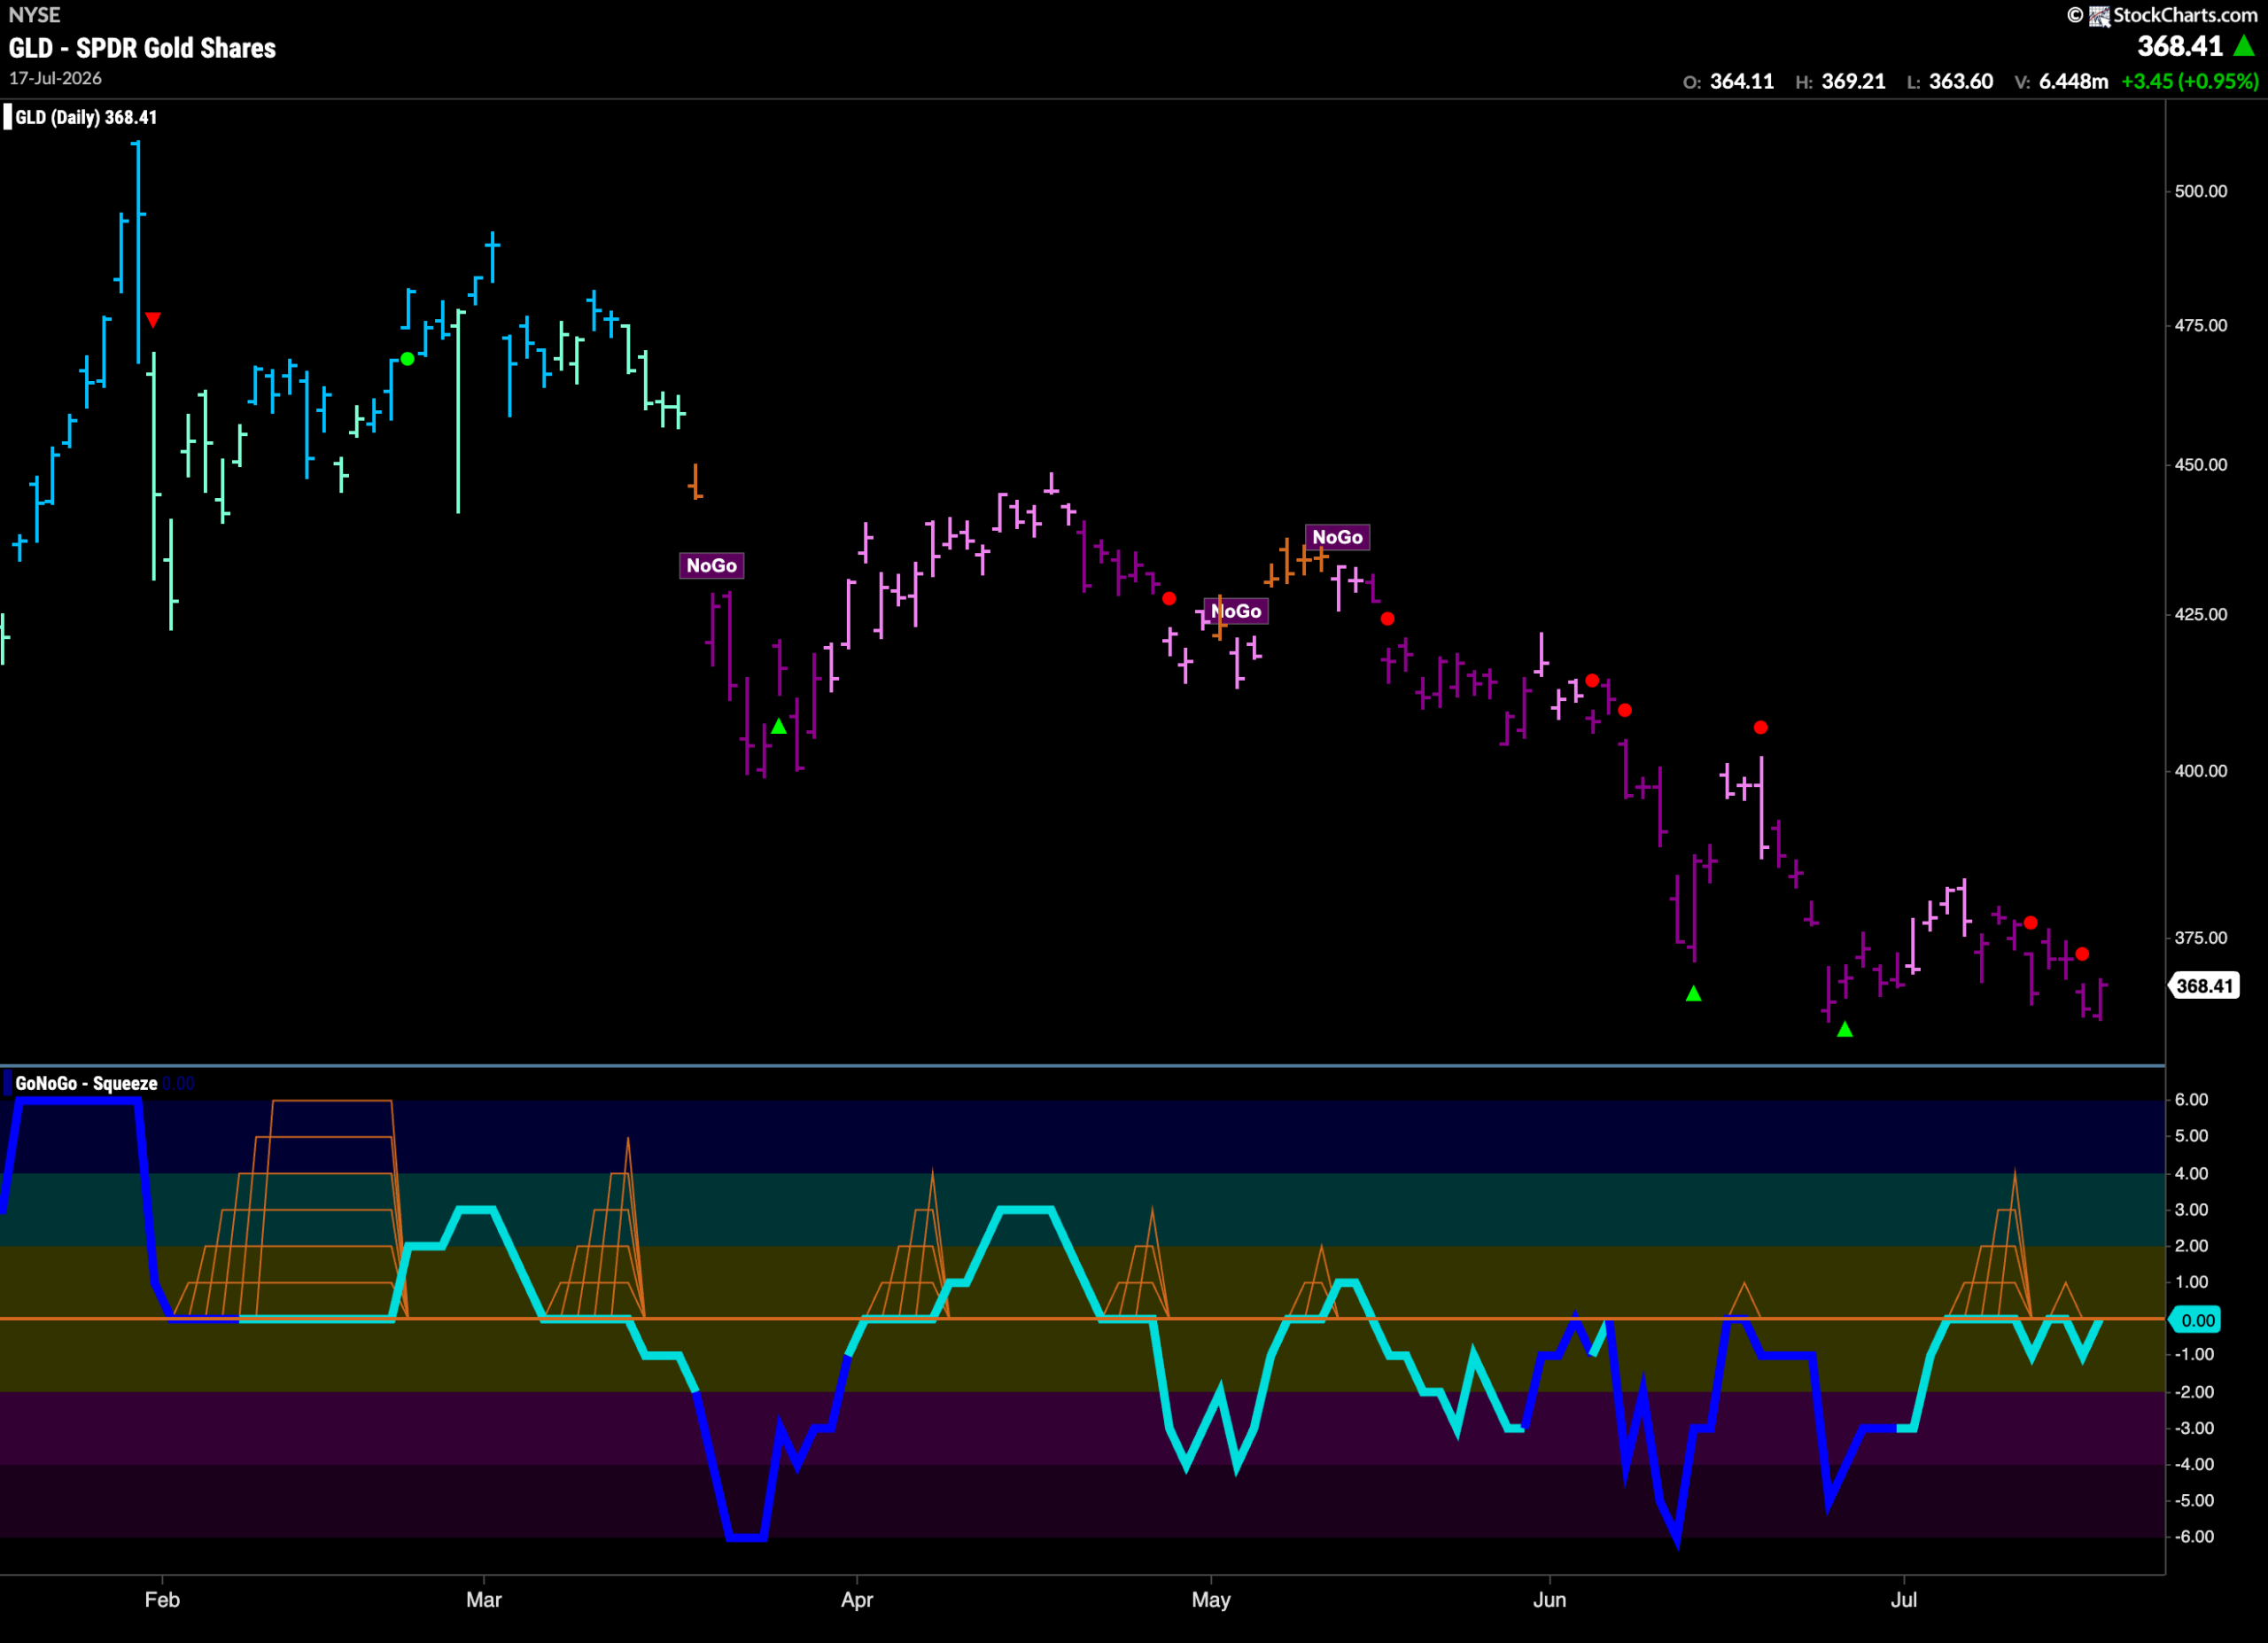
Gold ($GLD) “NoGo” Stays Strong
The “NoGo” trend continues for gold as we see a week of strong purple bars pushing price back toward prior lows. With GoNoGo Oscillator once again testing the zero line from below, we will watch to see if it is turned away from this level. If it is, we will know that momentum is resurgent in the direction of the “Go” trend and will expect price to challenge for new lows.
Sector RelMap
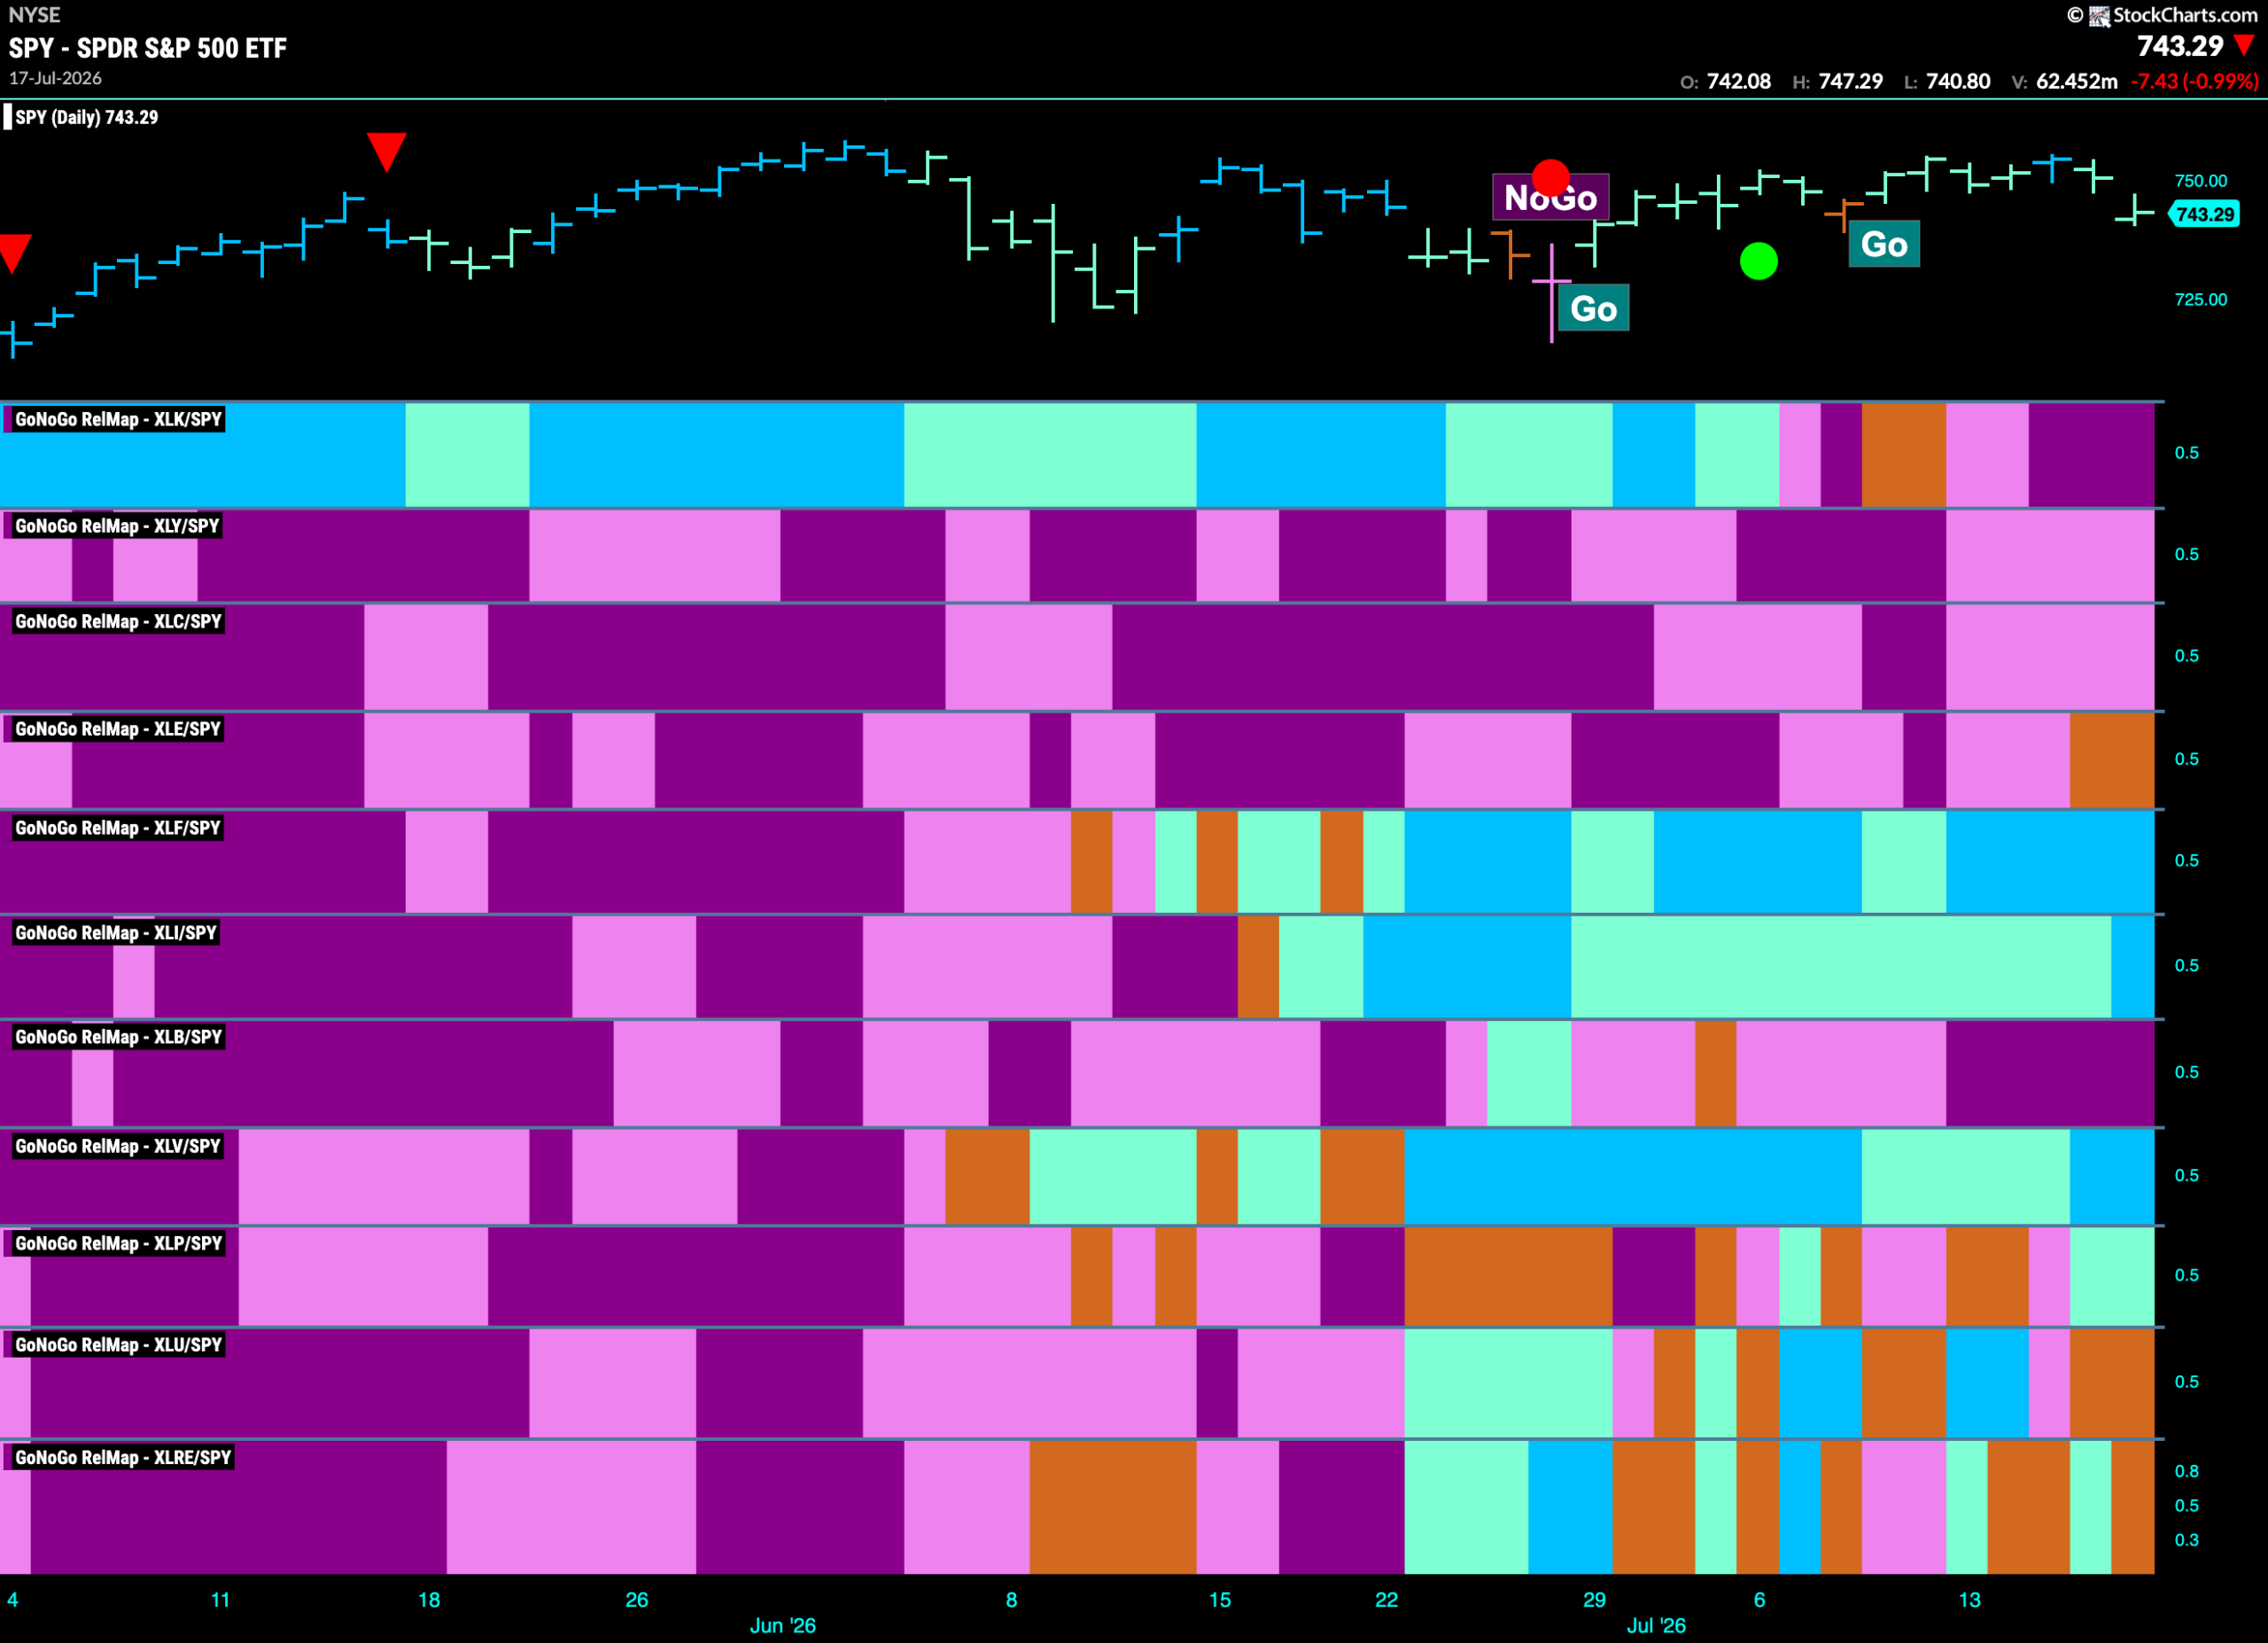
Below is the GoNoGo Sector RelMap. This GoNoGo RelMap applies the GoNoGo Trend to the relative strength ratios of the sectors to the base index. With this view we can get a sense of the relative out performance and relative underperformance of the sectors. 3 sectors are in a relative “Go” trend.$XLF, $XLI, $XLV, and $XLP are painting blue relative “Go” bars.
Healthcare Sub-Group RelMap
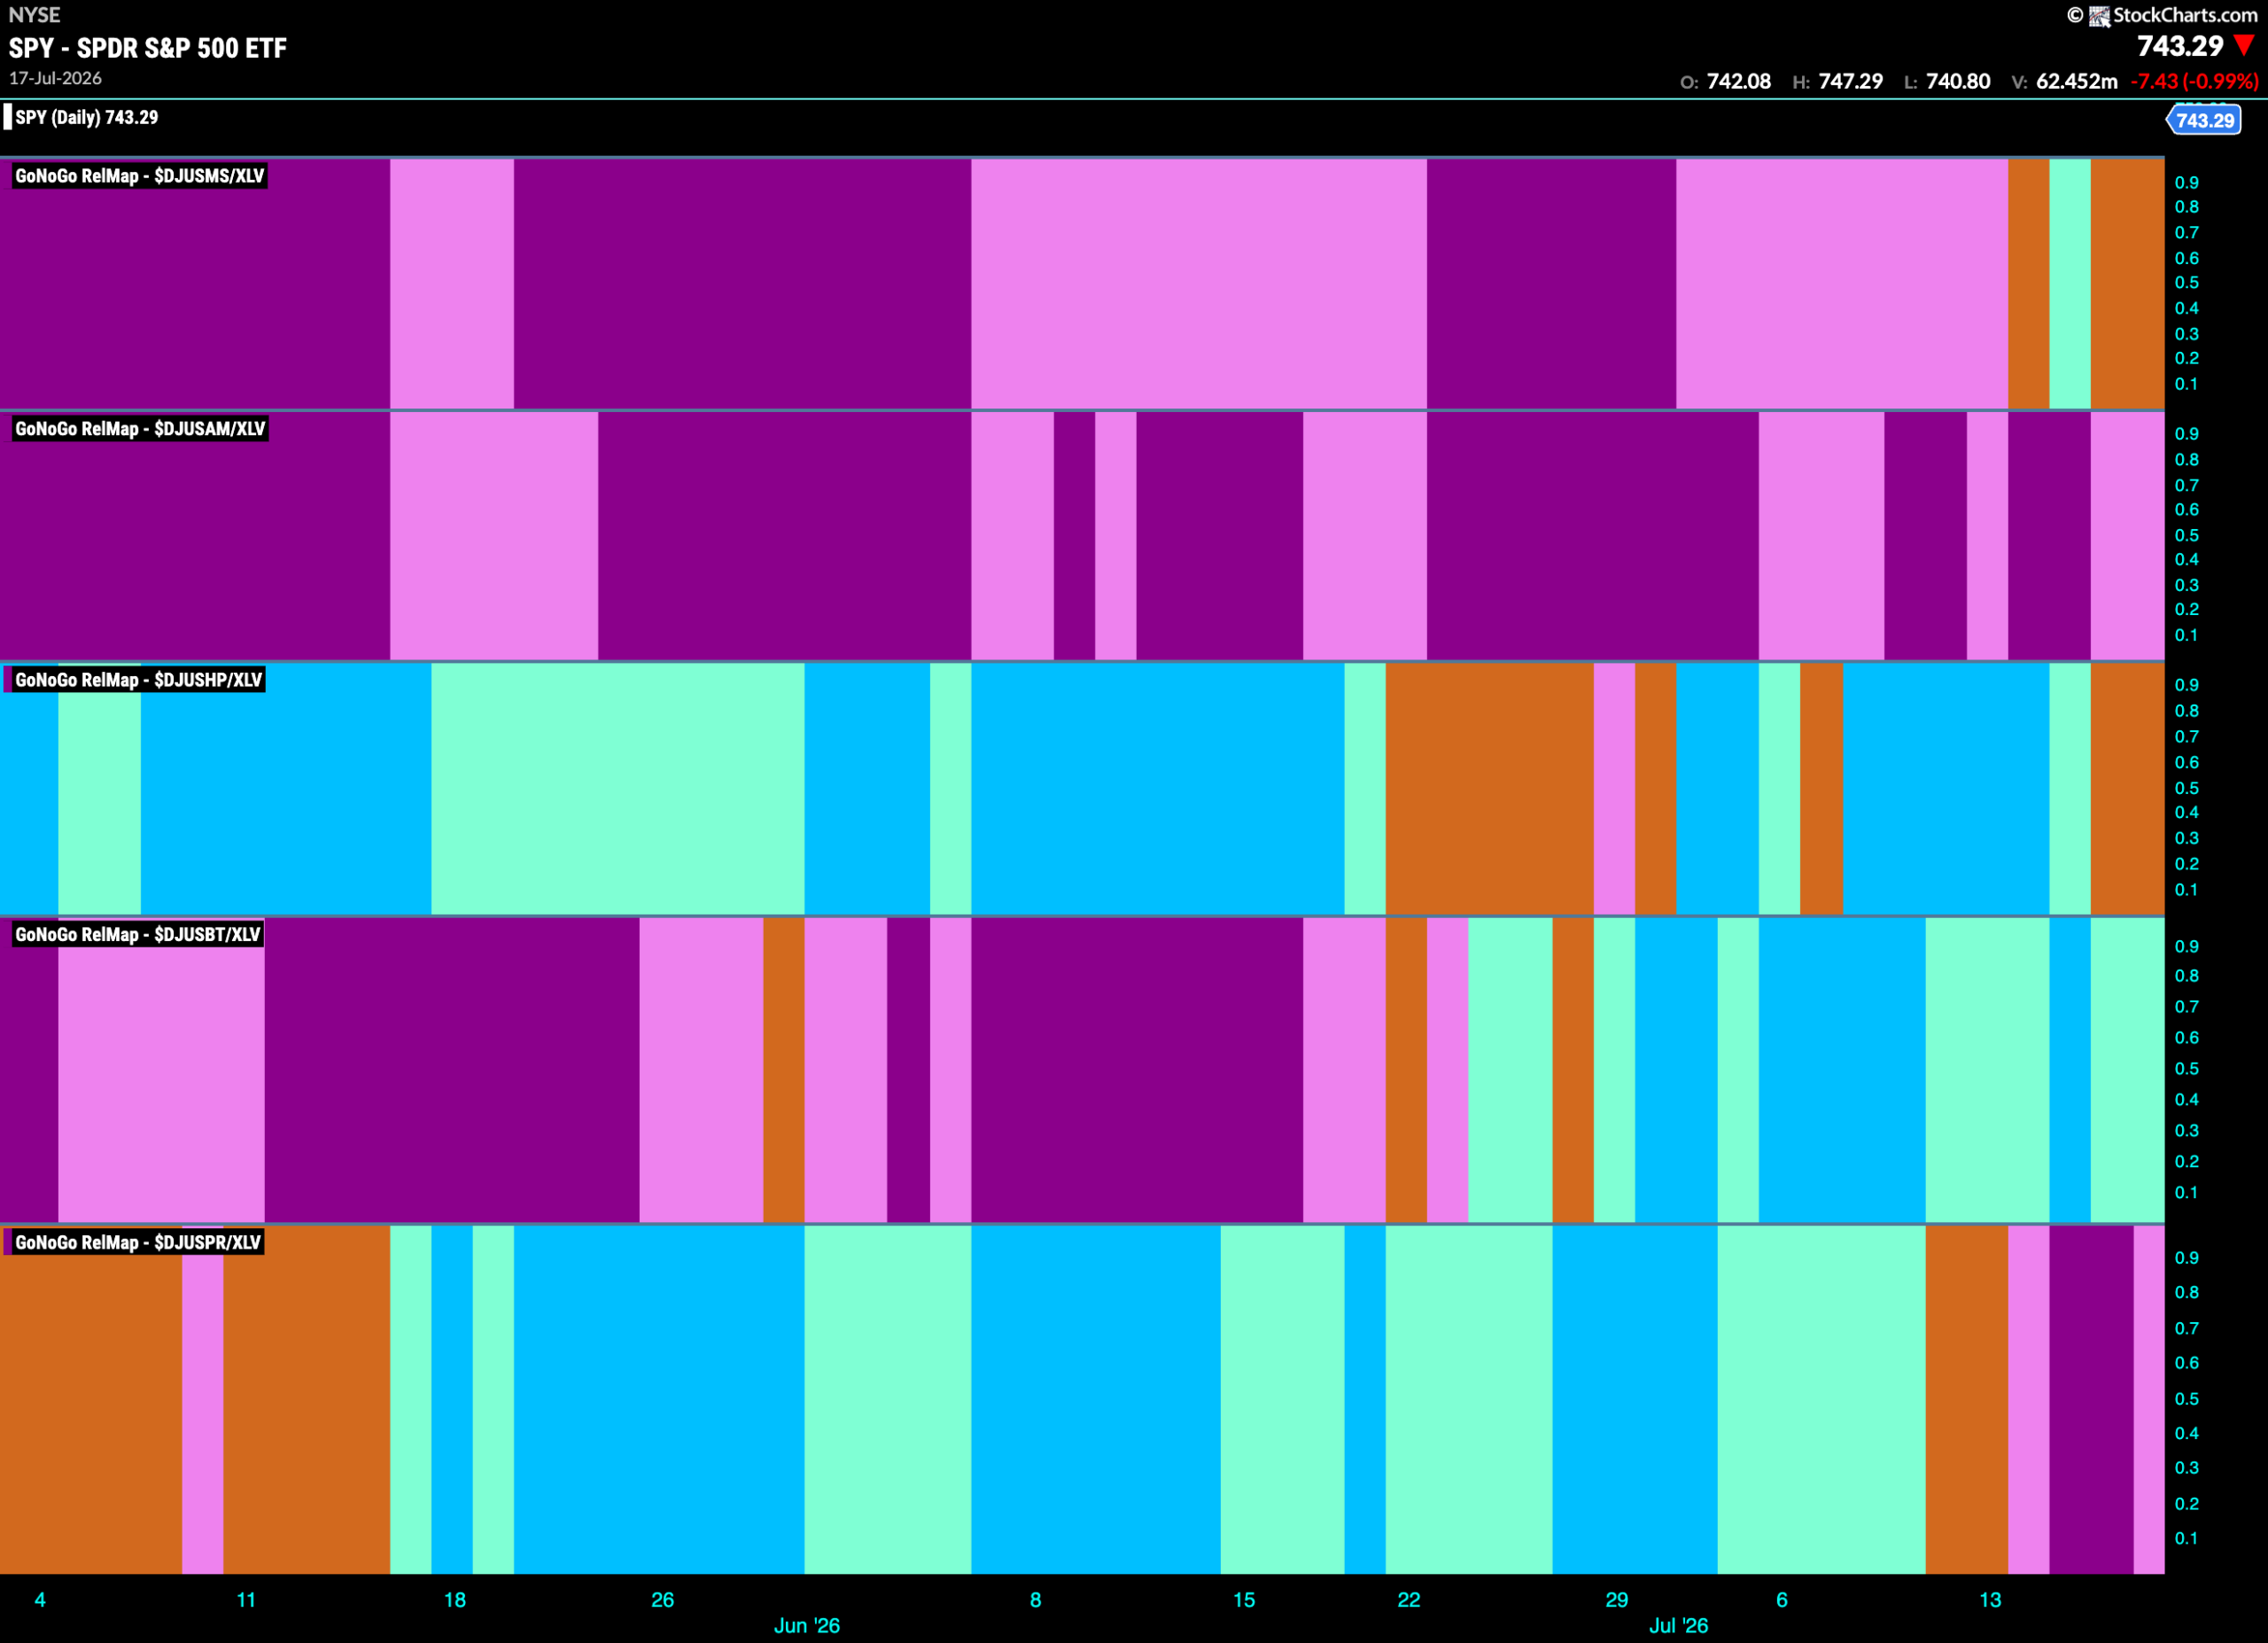
The chart below shows a relative trend breakdown of the sub groups within the healthcare sector this week. The Sub-Group RelMap plots the GoNoGo Trend of each sub index to the $XLV. We saw in the above GoNoGo Sector HeatMap that $XLV is painting relative “Go” bars. When we look at the below RelMap we can see that the biotechnology index in the 4th panel is painting aqua “Go” bars on a relative basis.
$RLAY Looks for Support in “Go” Trend
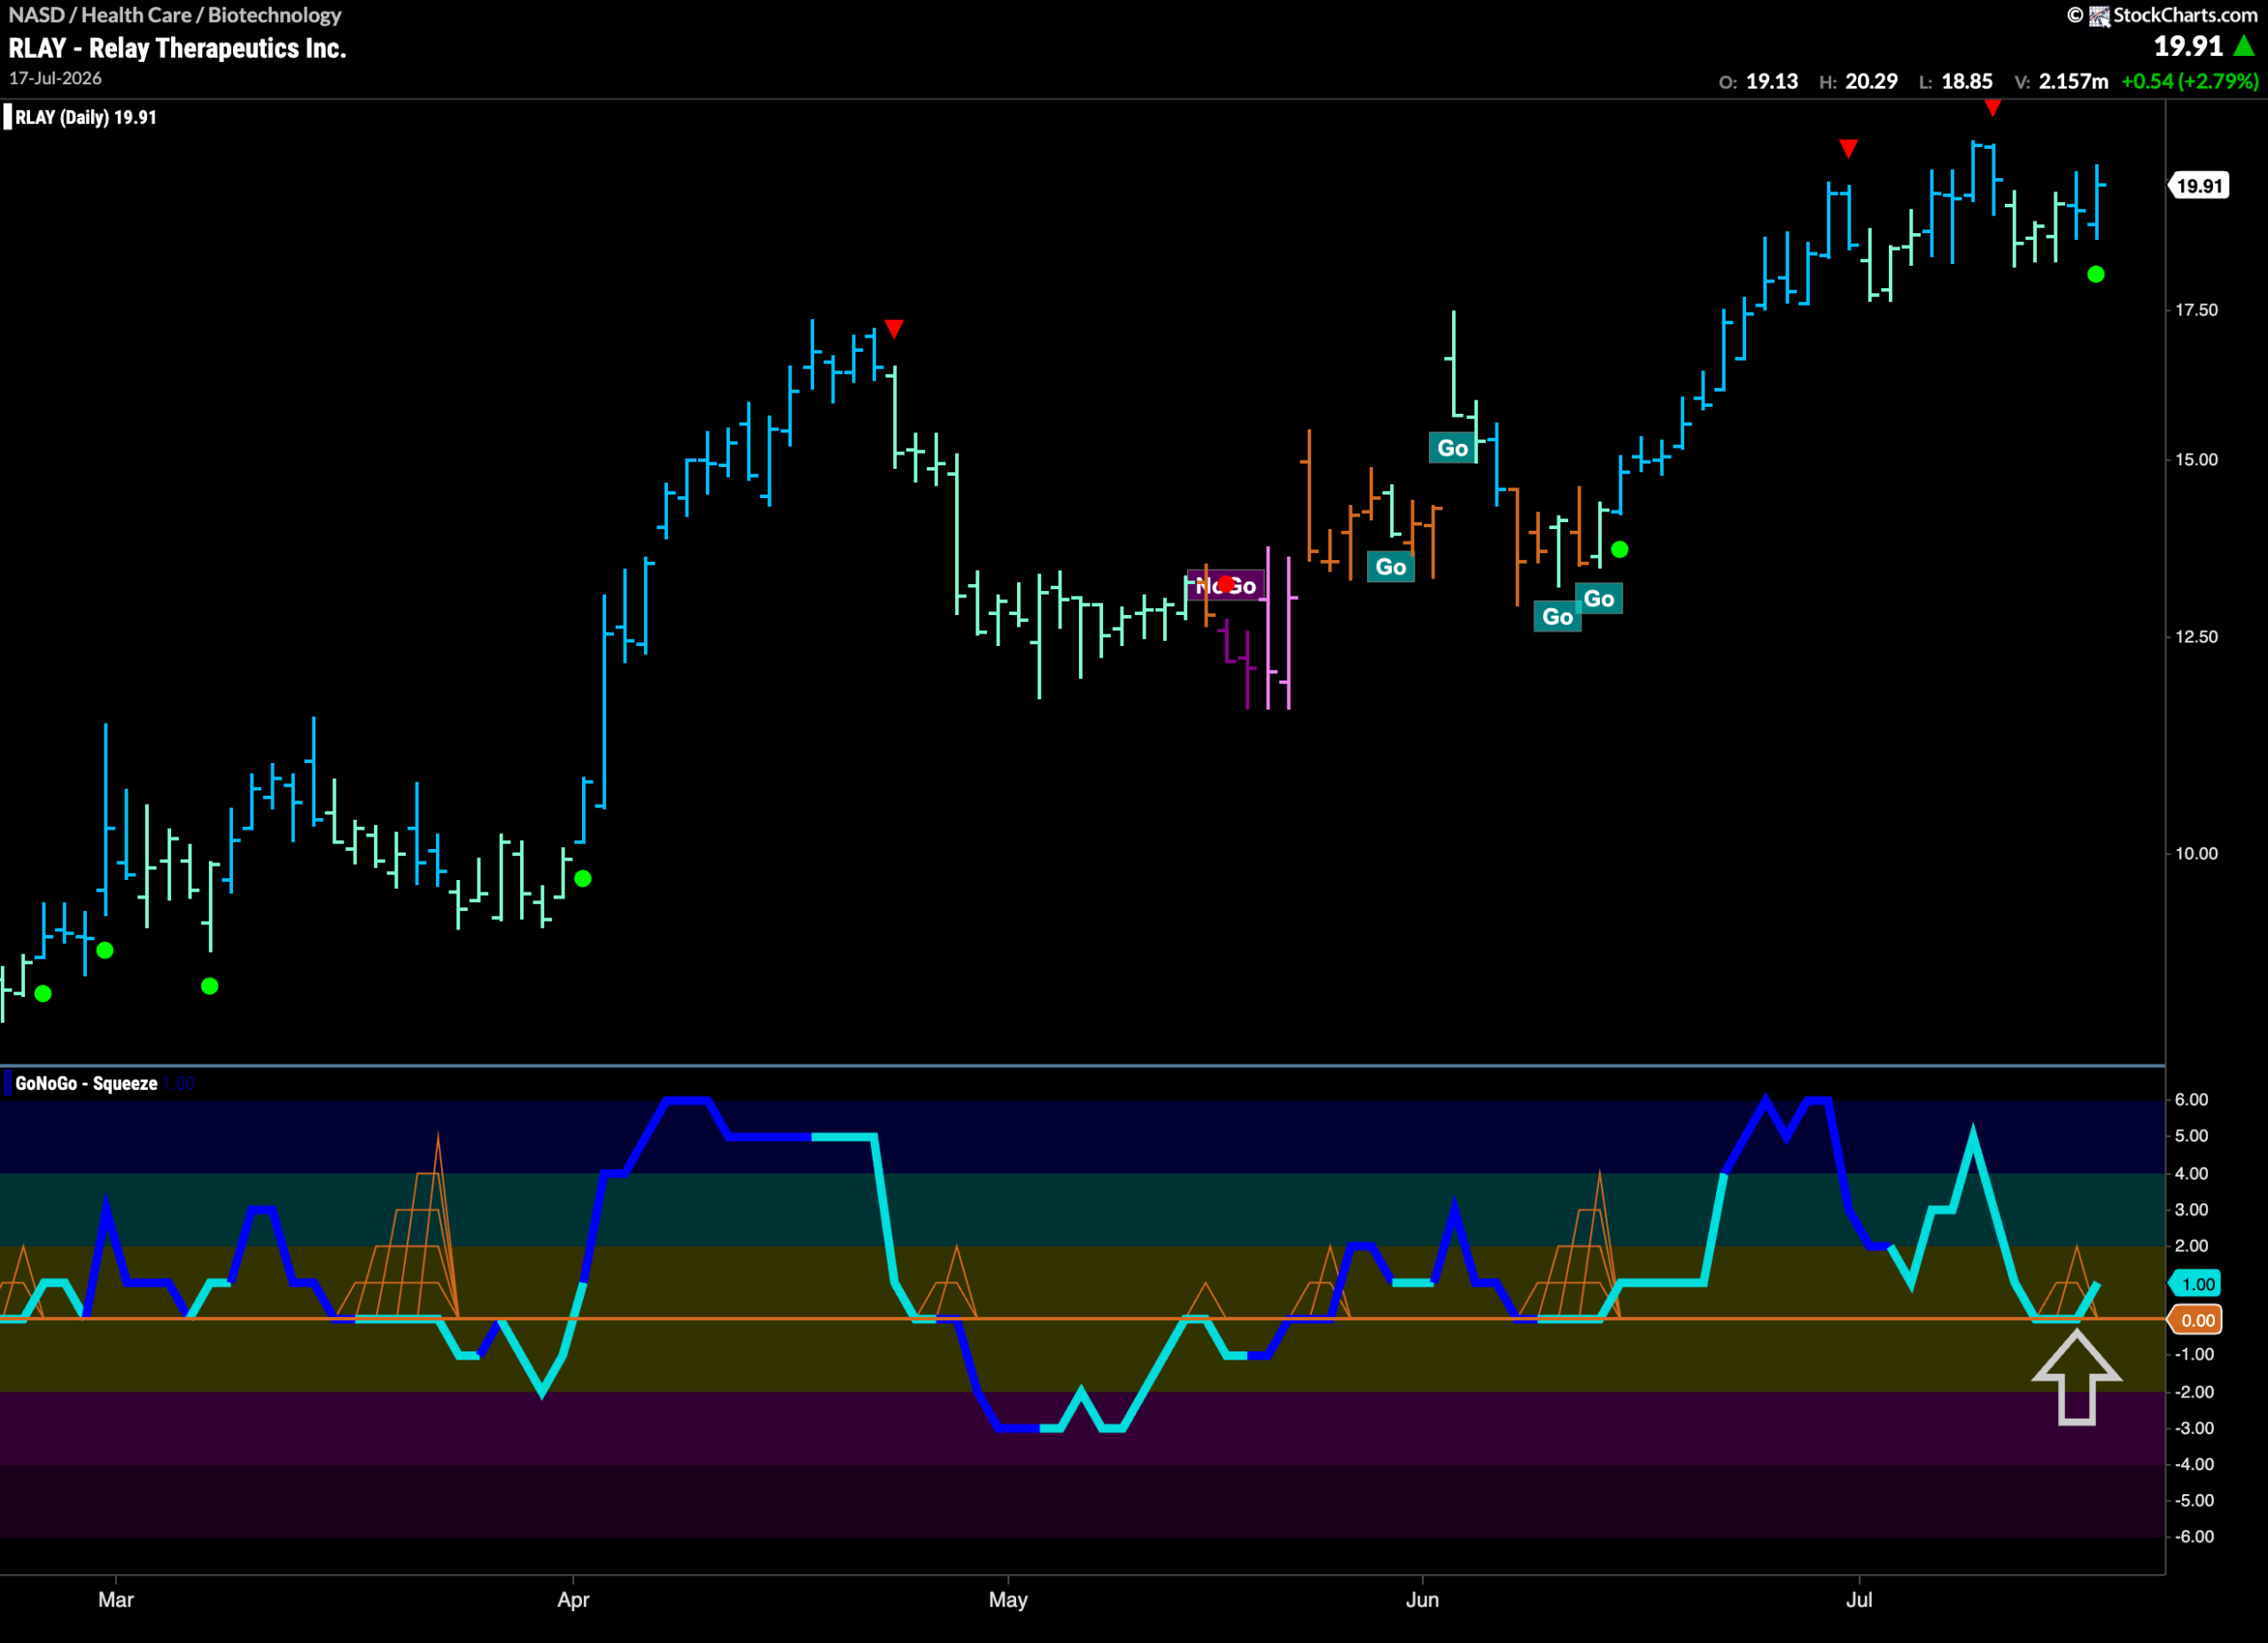
The GoNoGo Chart below shows that price is trying once again to climb to a new higher high. After a couple of Go Countertrend Correction Icons (red arrows) that told us price might struggle to move higher in the short term, we saw mostly sideways movement. GoNoGo Trend shows that strength has returned as it paints bright blue bars and this comes as GoNoGo Oscillator tests the zero line from above. As we see it bounce back into positive territory, we know that momentum is resurgent in the direction of the “Go” trend and so we will watch to see if this gives price the push it needs to set a new higher high in the coming days.
$SYRE Tests Prior High Resistance
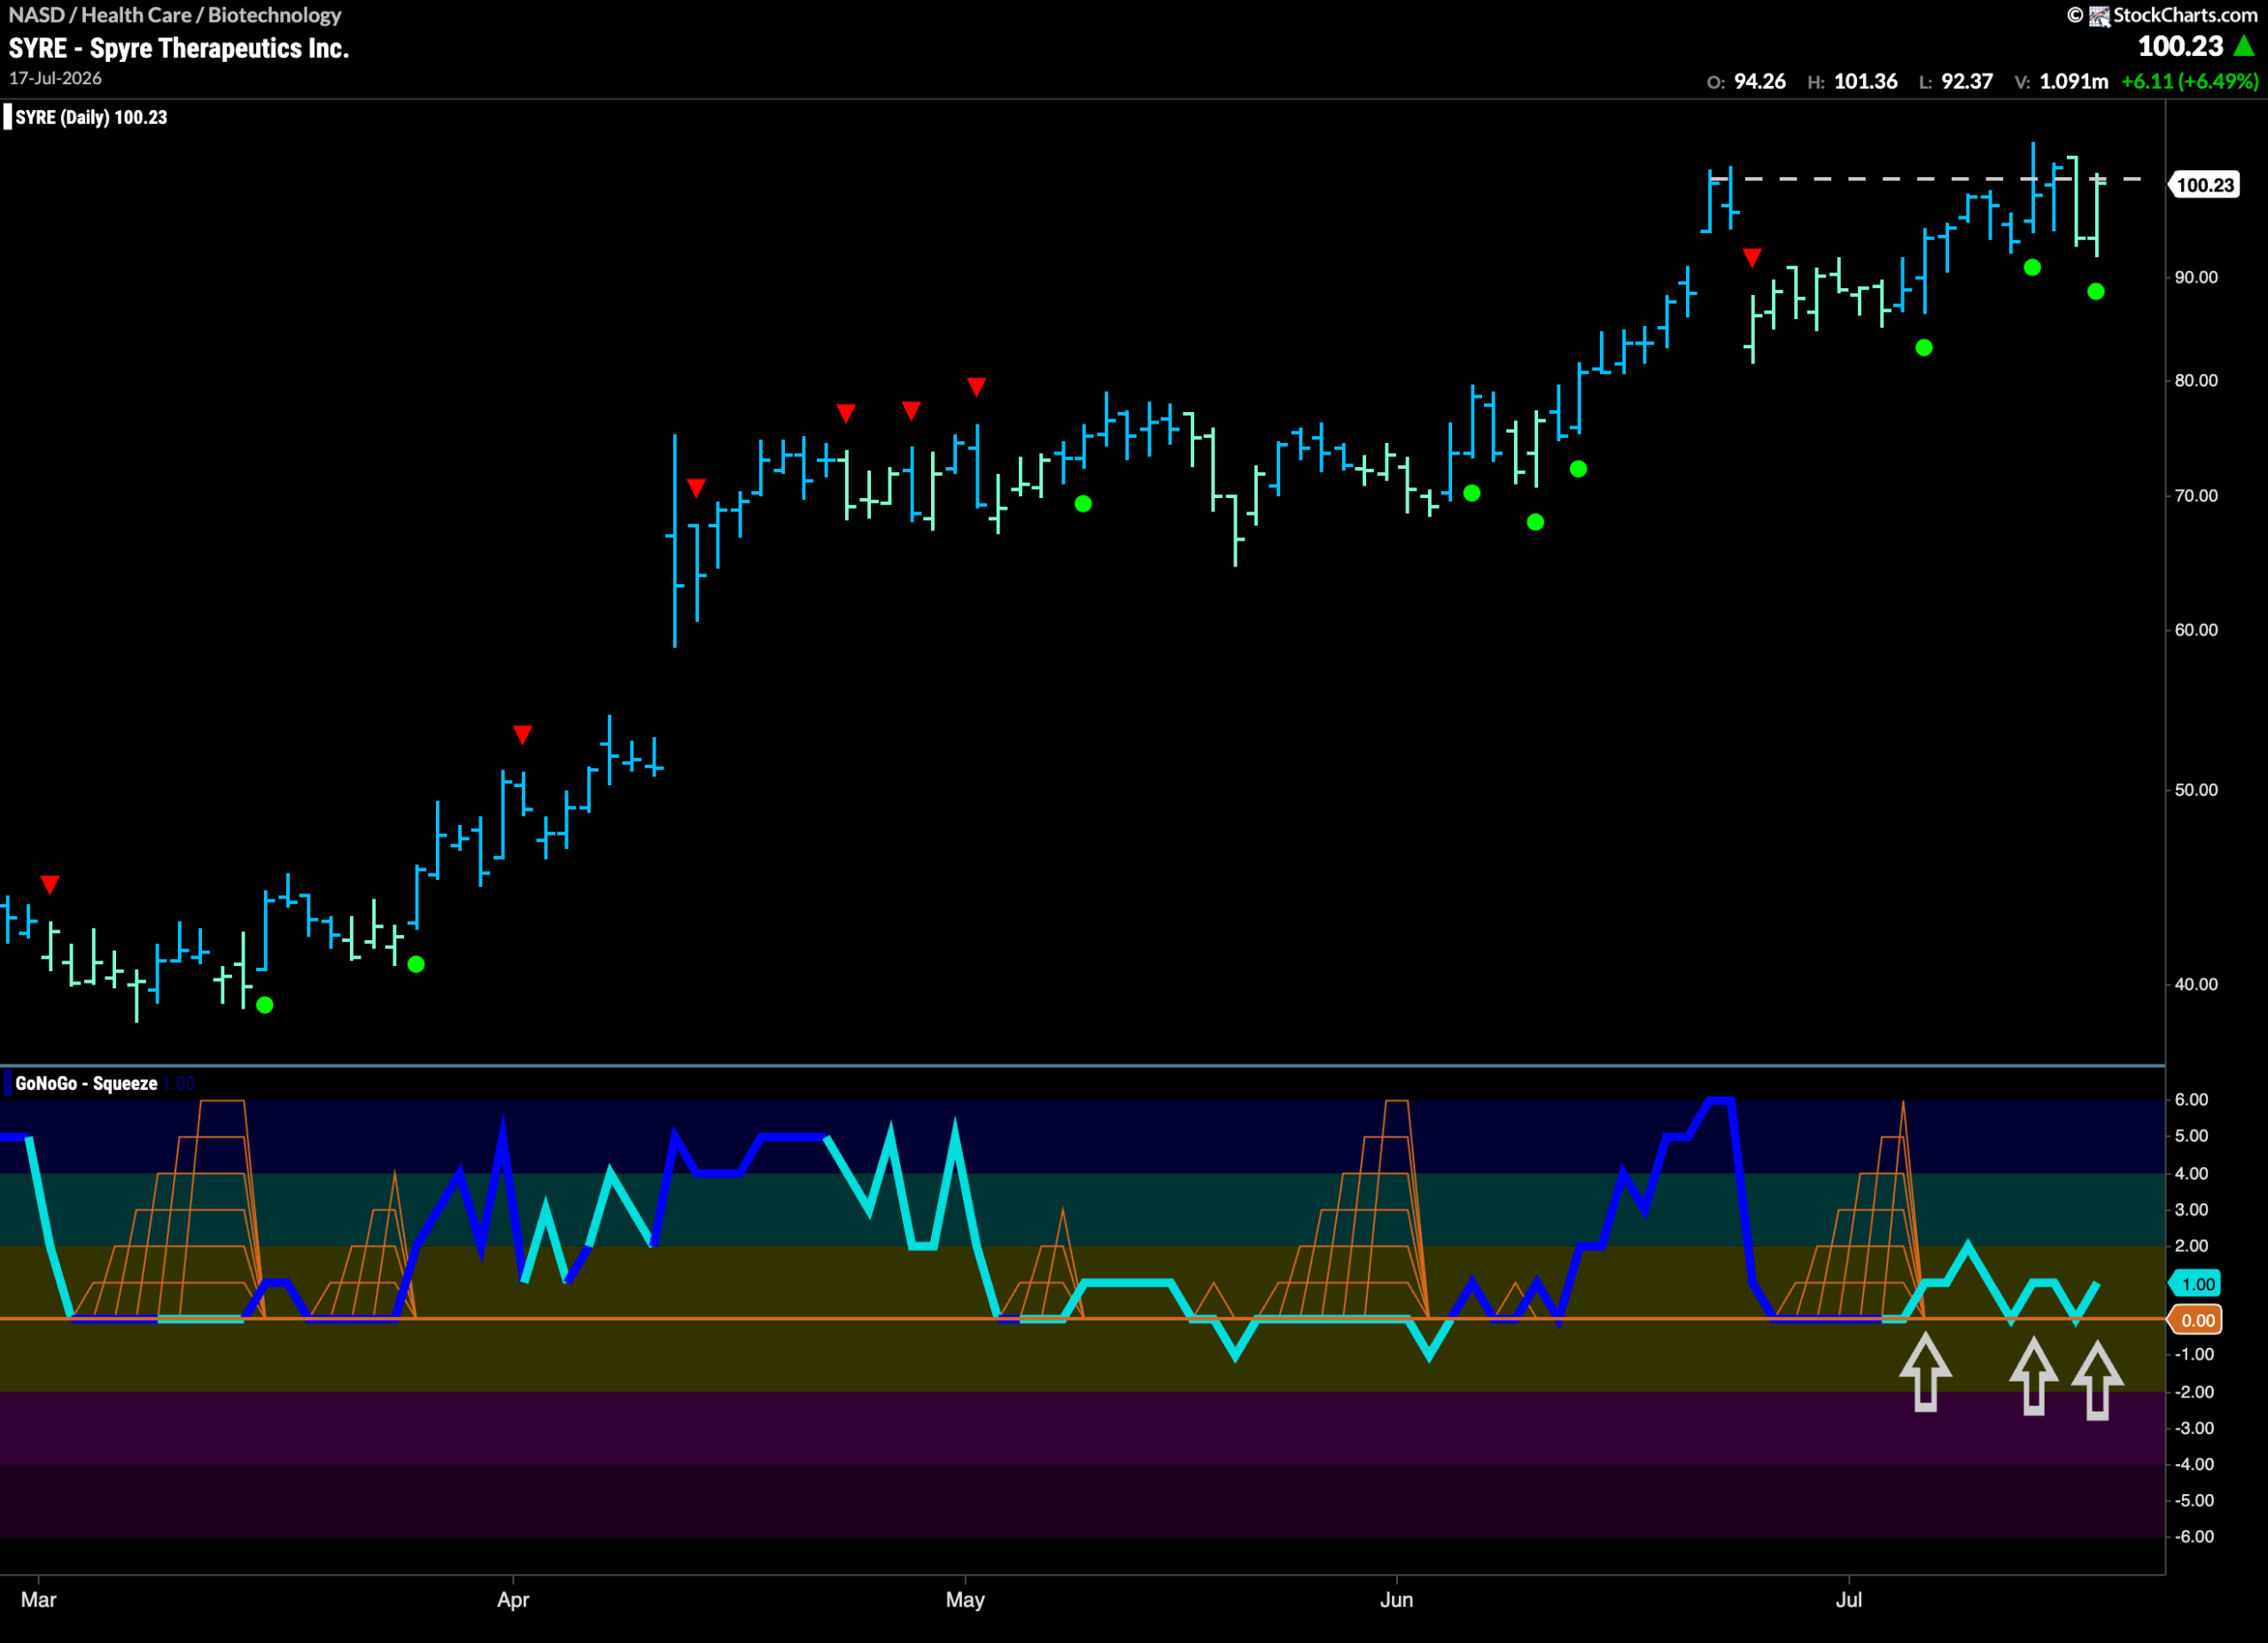
The chart below shows that $SYRE has been in a “Go” trend for several months. During this time, GoNoGo Oscillator has been primarily at or above the zero line, supporting the price trend. Now, as price works its way through overhead resistance, we see that GoNoGo Oscillator continues to test and find support at zero. This has triggered a clustering of Go Trend Continuation Icons (green circles) telling us that momentum remains firmly on the side of the “Go” trend. We will watch to see if this gives price the push it needs to climb higher this week.