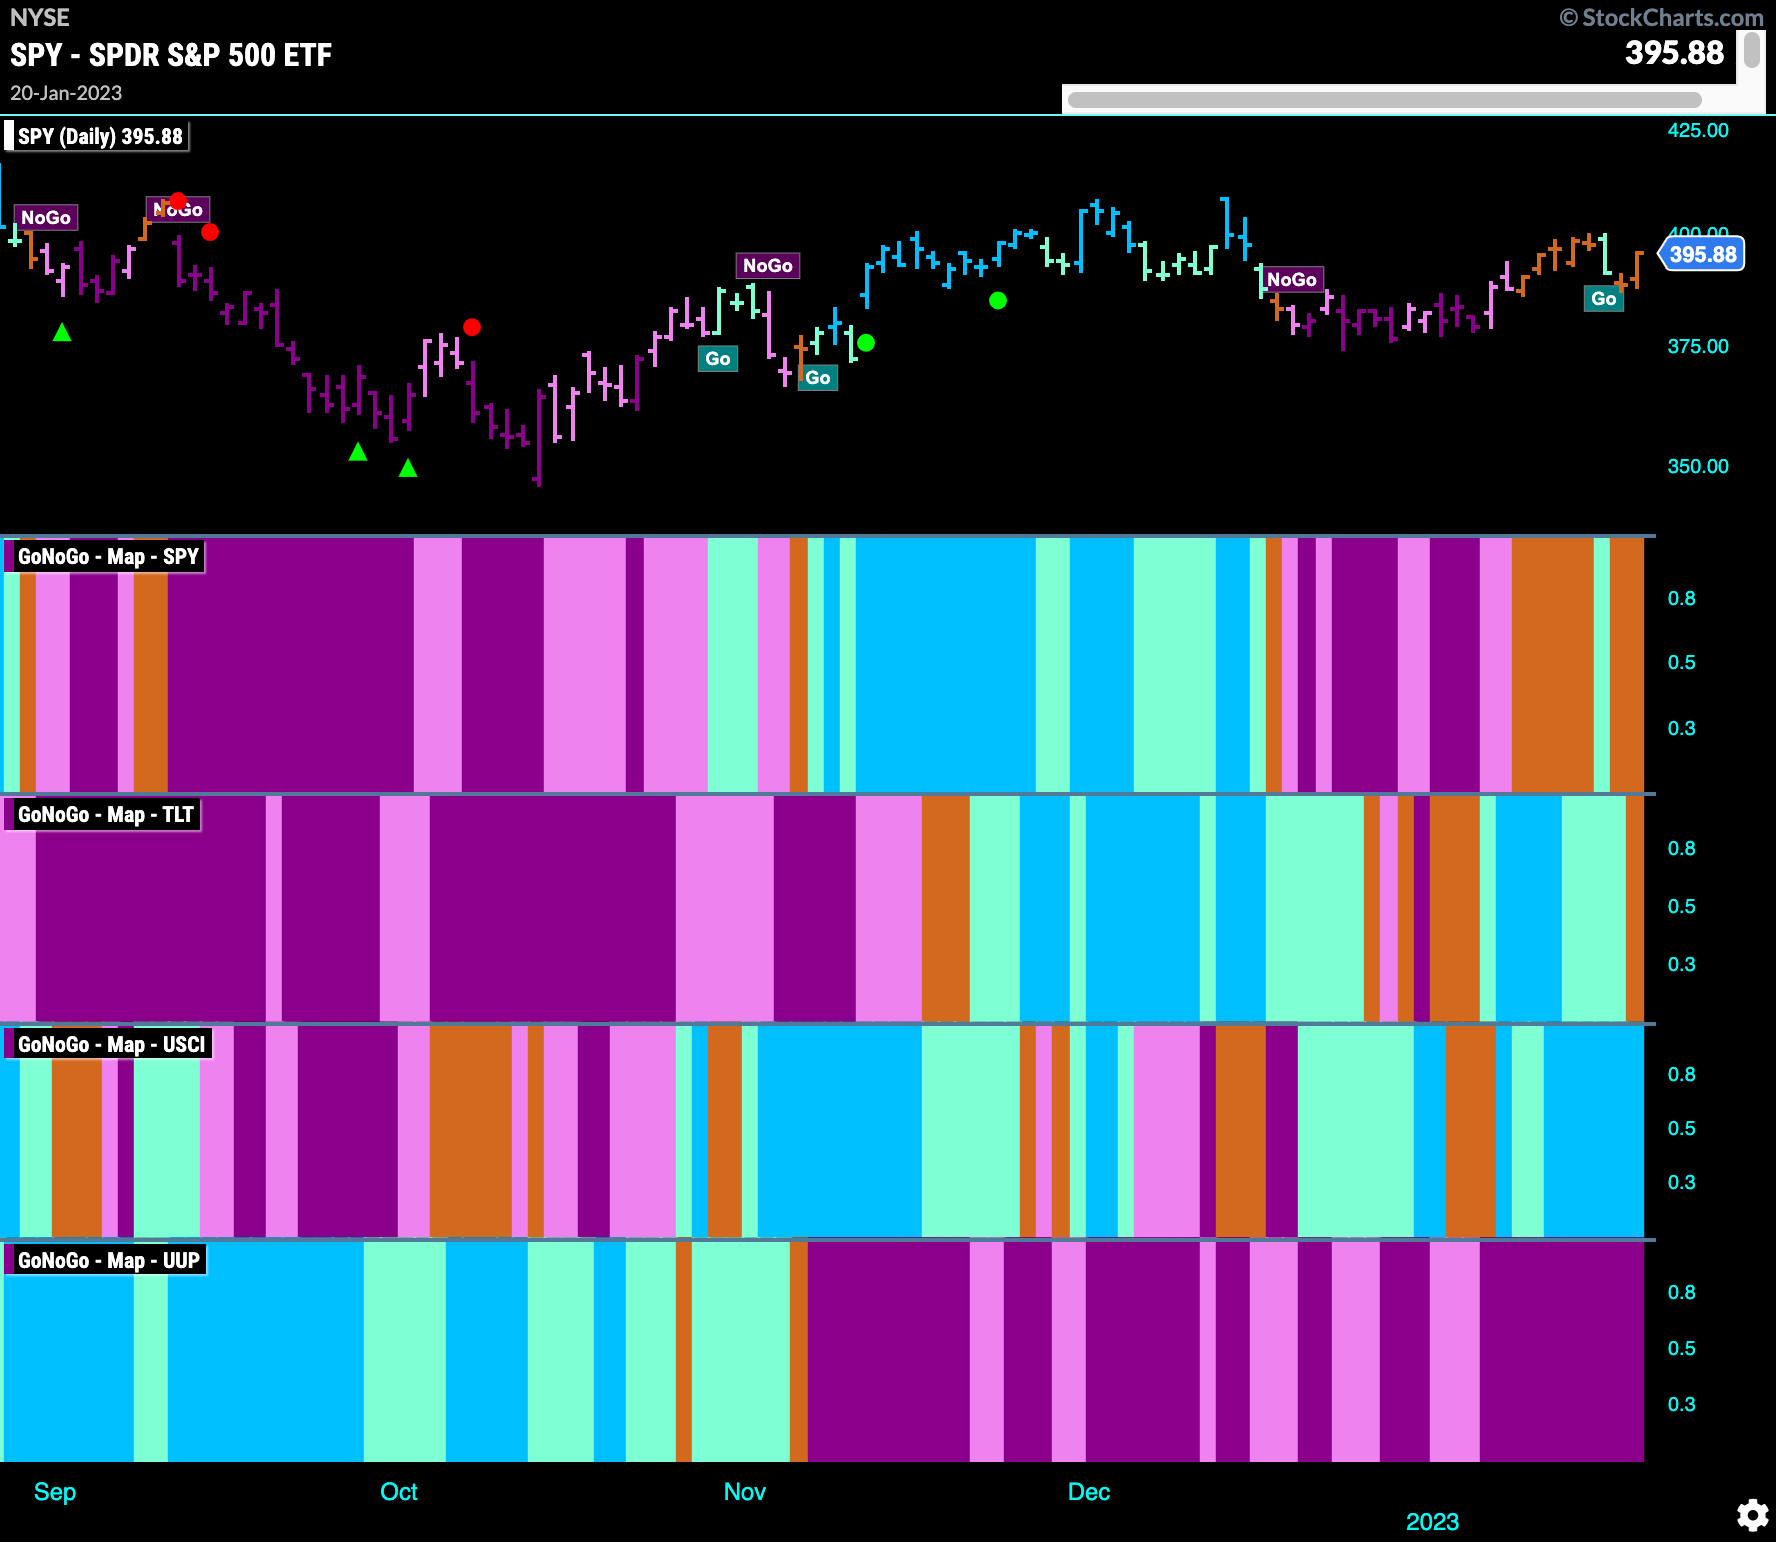
Good morning and welcome to this week’s Flight Path. Let’s take a look at the GoNoGo Asset map below. Equities flirted with a “Go” trend this week as we can see a lone aqua bar sandwiched between a sea of amber. Uncertainty prevails as the end of the week closes with a strong day but lower than where it opened on Monday. Treasury bond prices struggled to end the week with an amber “Go Fish” bar as well. No change for commodities and the dollar, painting strong “Go” and “NoGo” bars respectively.
Equities Revert to Amber “Go Fish” bars
GoNoGo Trend shows that while the index seems to be free from the pinks and purples of “NoGo” bars for now, a return to “Go” colors is not a foregone conclusion as we see more amber “Go Fish” bars at week’s end. GoNoGo Oscillator is in positive territory but has fallen close to zero. We will look to see if the oscillator can find support at this level going forward. 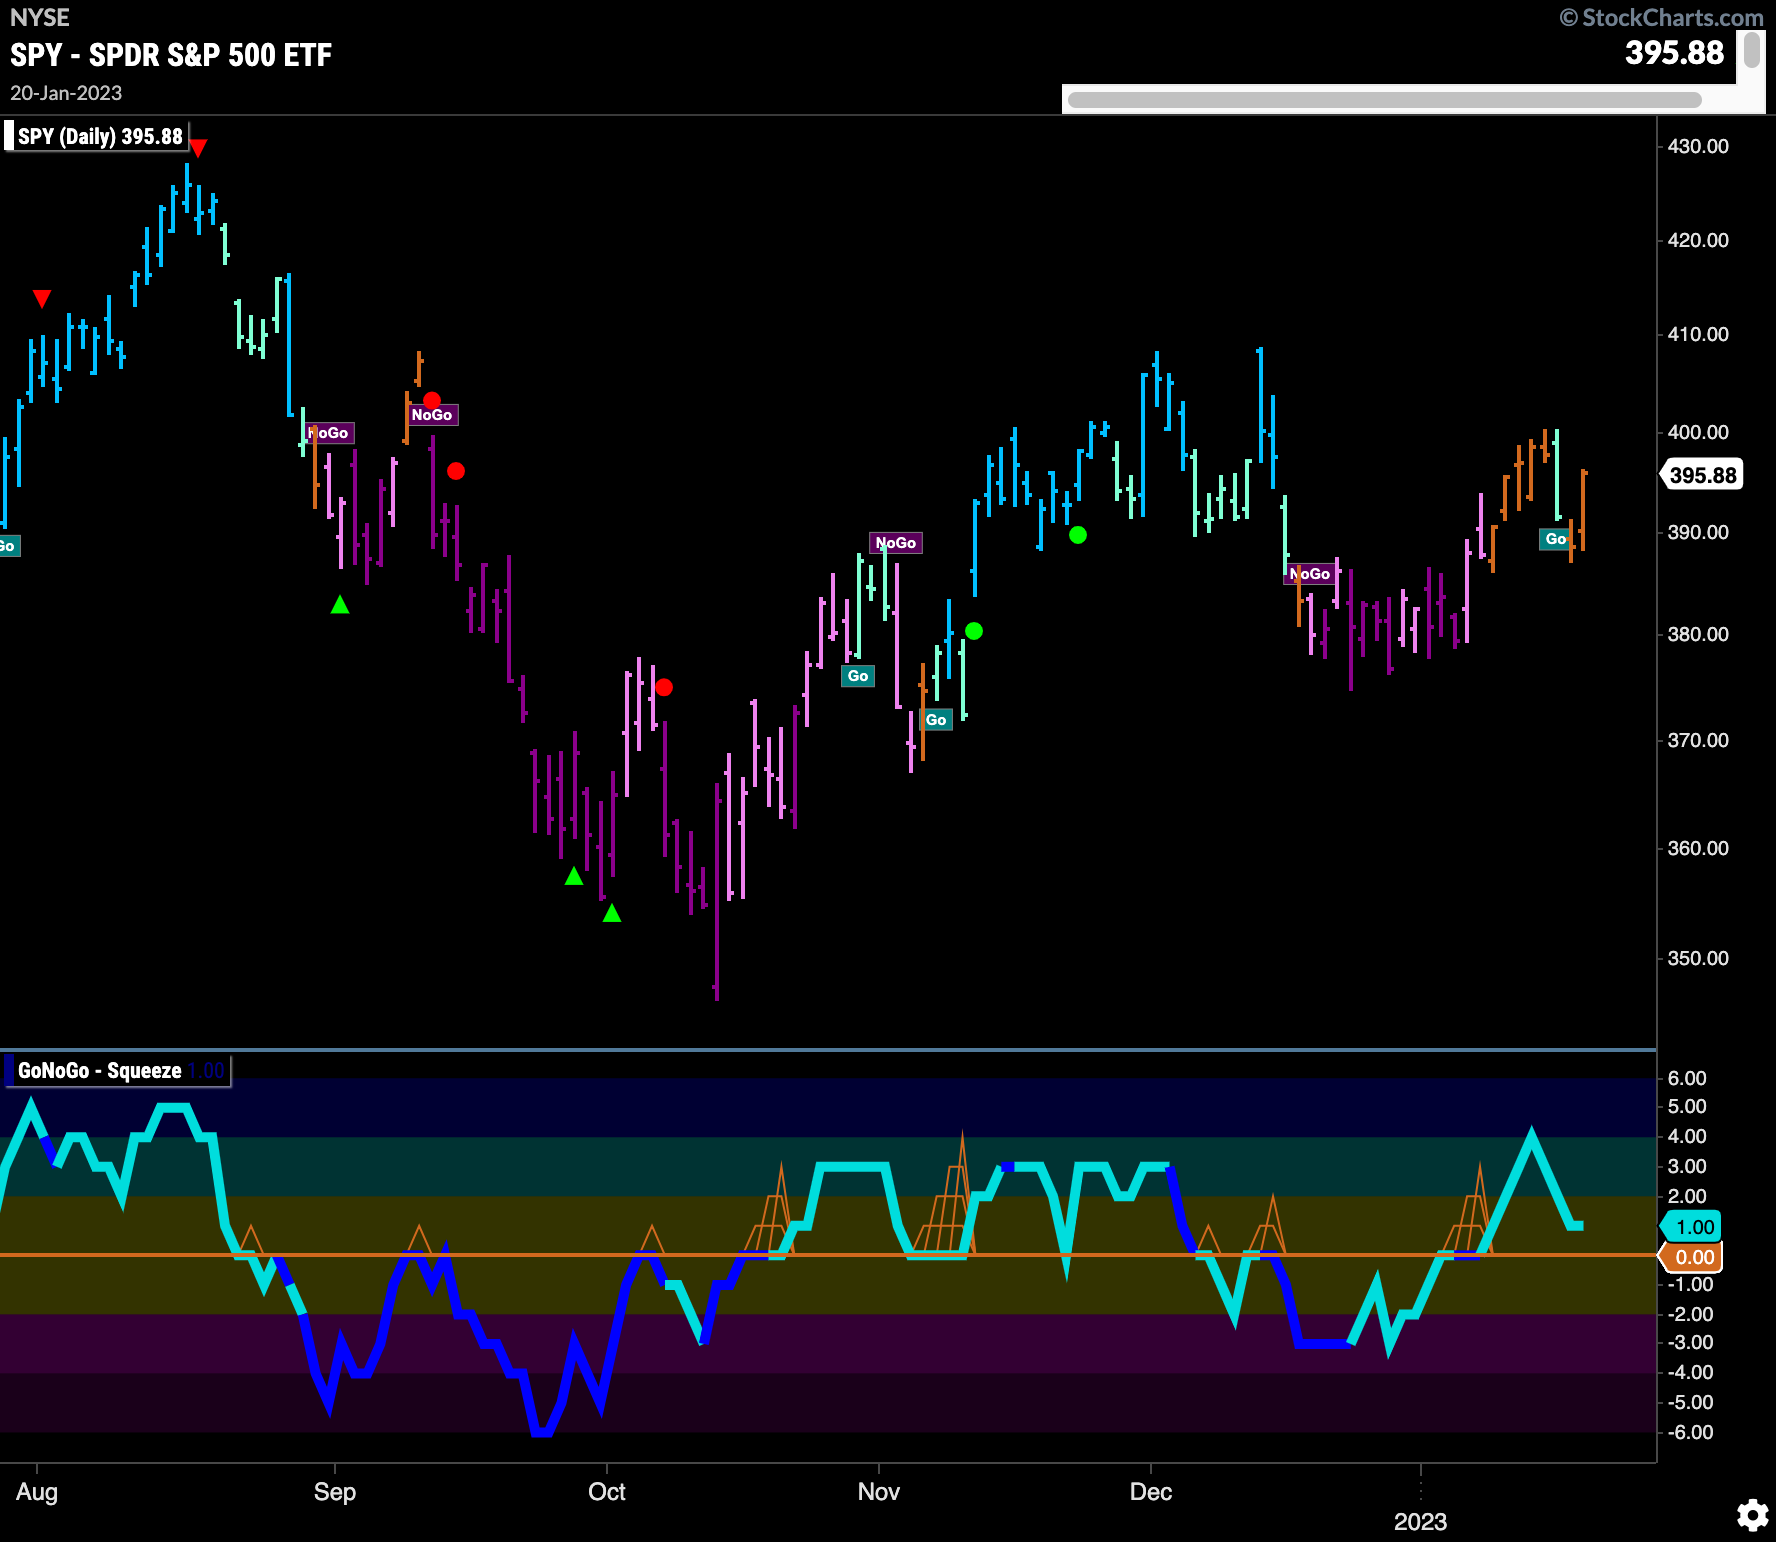
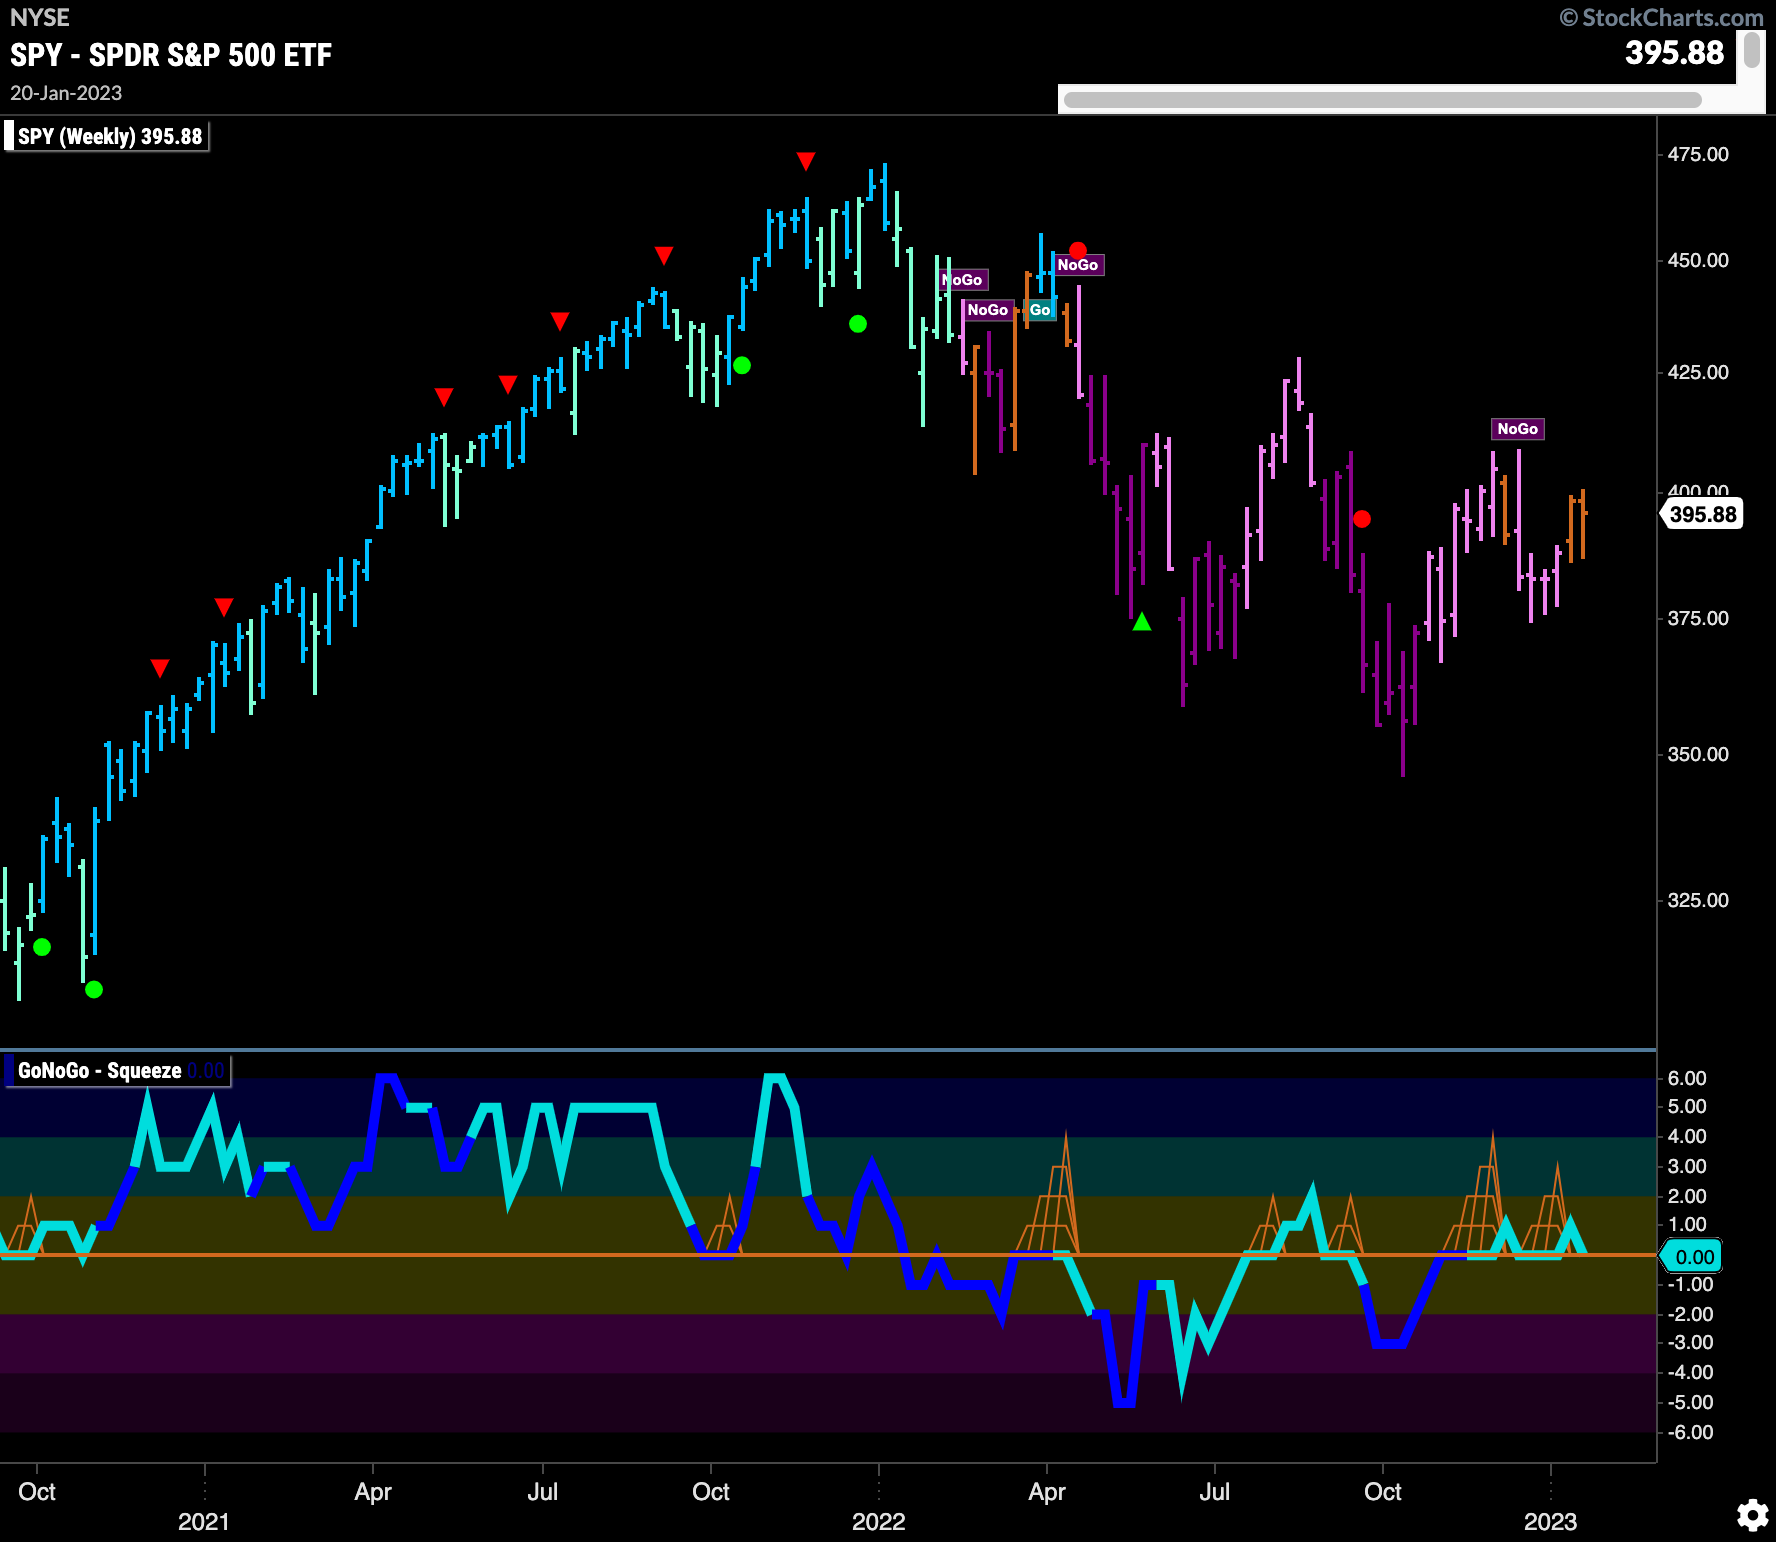
The longer term weekly chart shows a second successive amber “Go Fish” bar as price tries to climb out of the “NoGo” trend again this week. It appears that price has put in a higher low which is a positive but we will need to see a higher high for a “Go” trend to be established. GoNoGo Oscillator continues to struggle to tear itself away from zero. That will be important as we move forward. If the oscillator can move into positive territory that may give price the push it needs to enter a new “Go” trend.
Treasury Rates Continue to Paint Purple “NoGo” bars
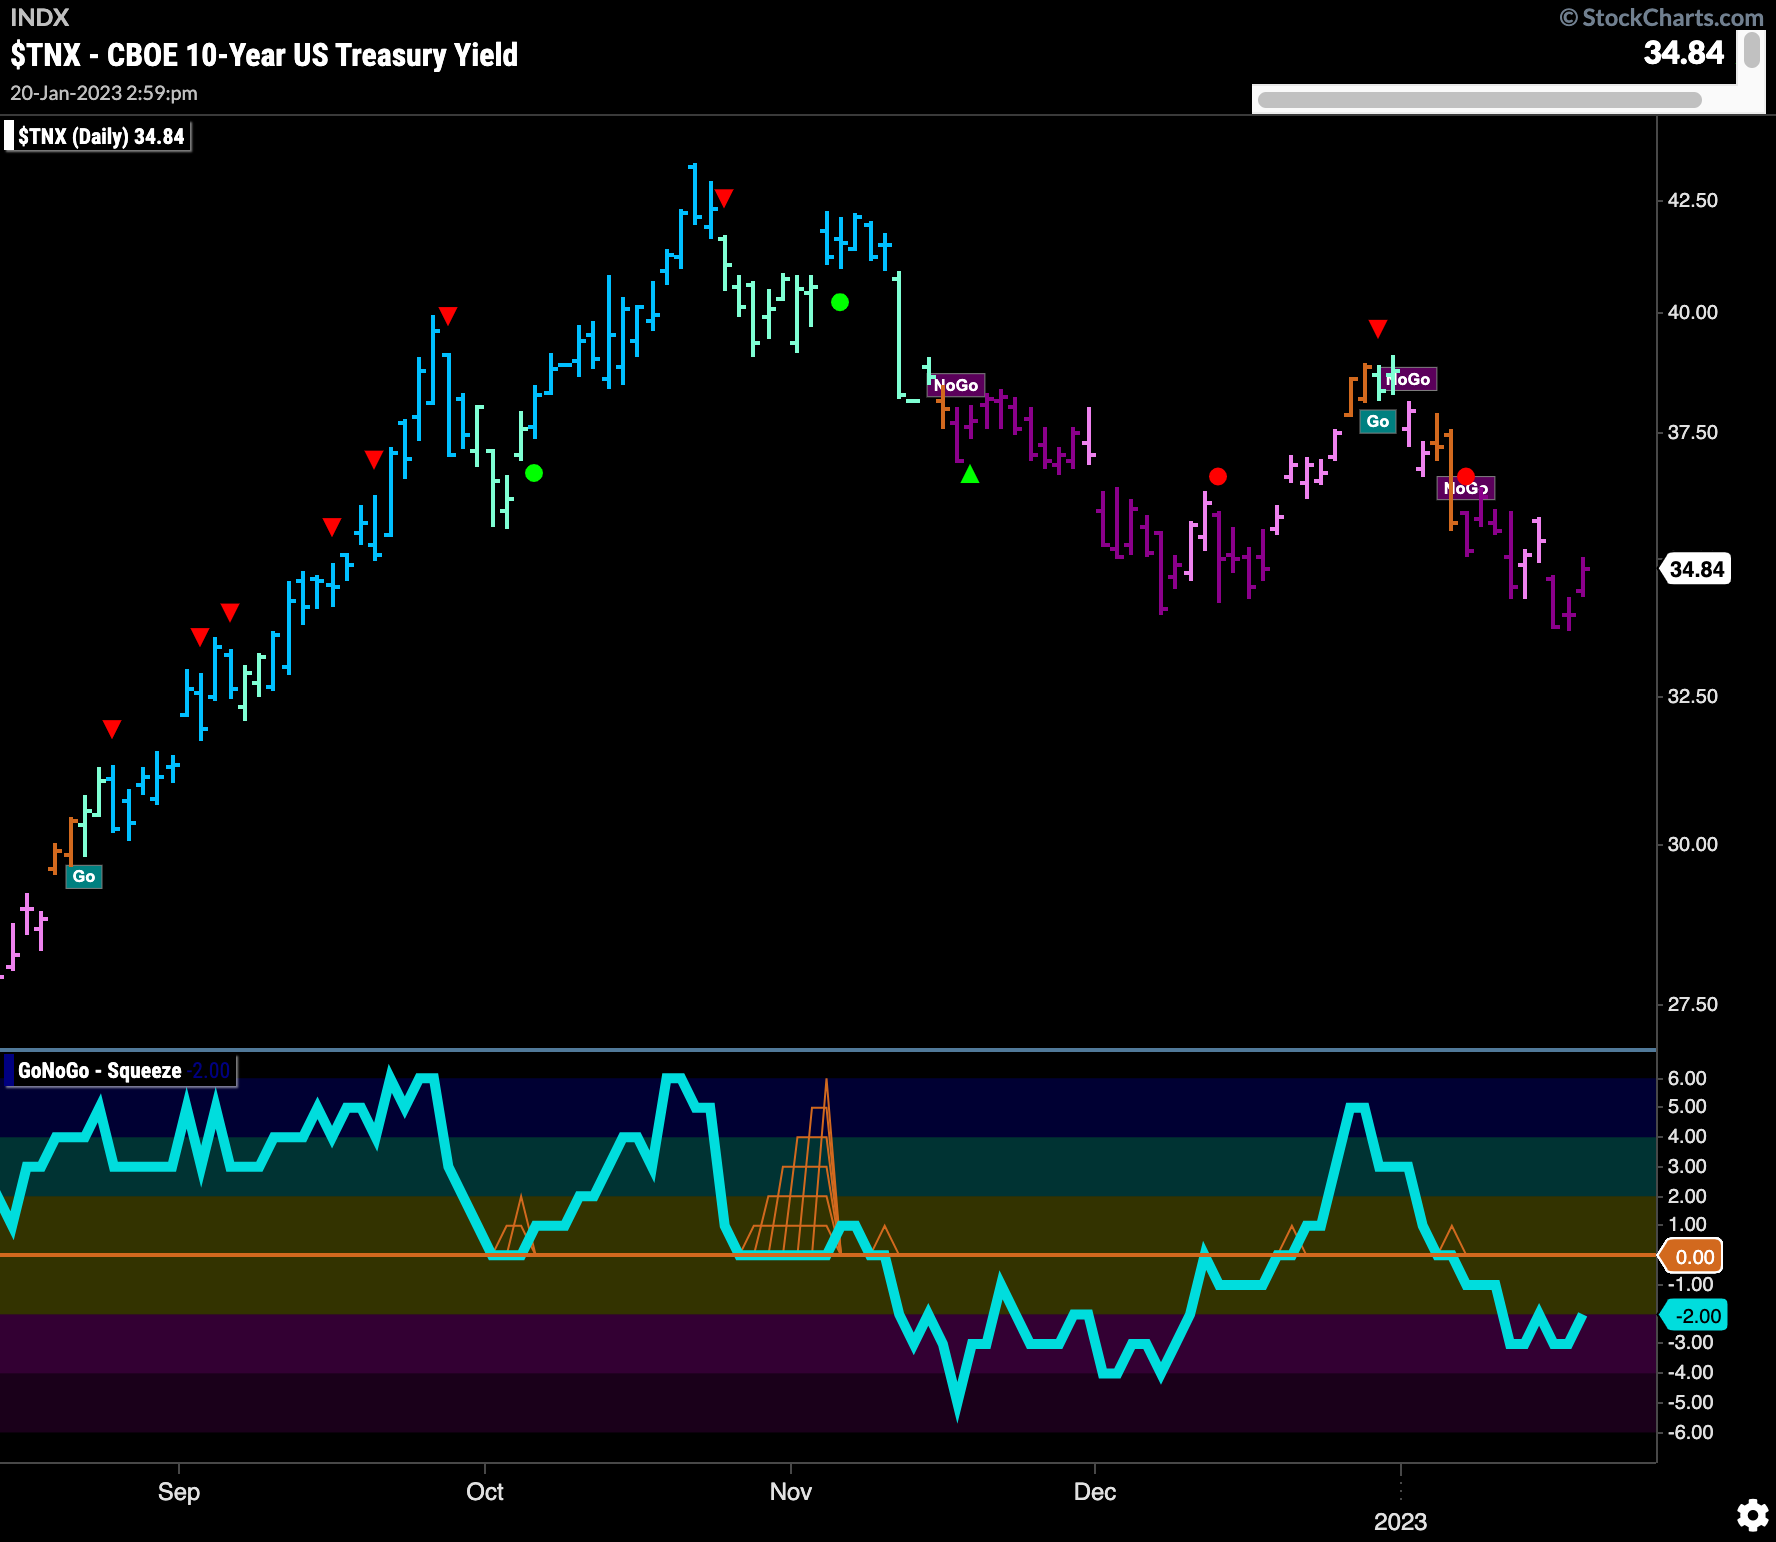
Treasury rates edged lower to a new low this week and spent the majority of the time painting purple “NoGo” bars. GoNoGo Oscillator is in negative territory but not yet oversold and this confirms the “NoGo” we are seeing in the price action. This continued move lower from the highs late year could continue to provide some relief for equities.
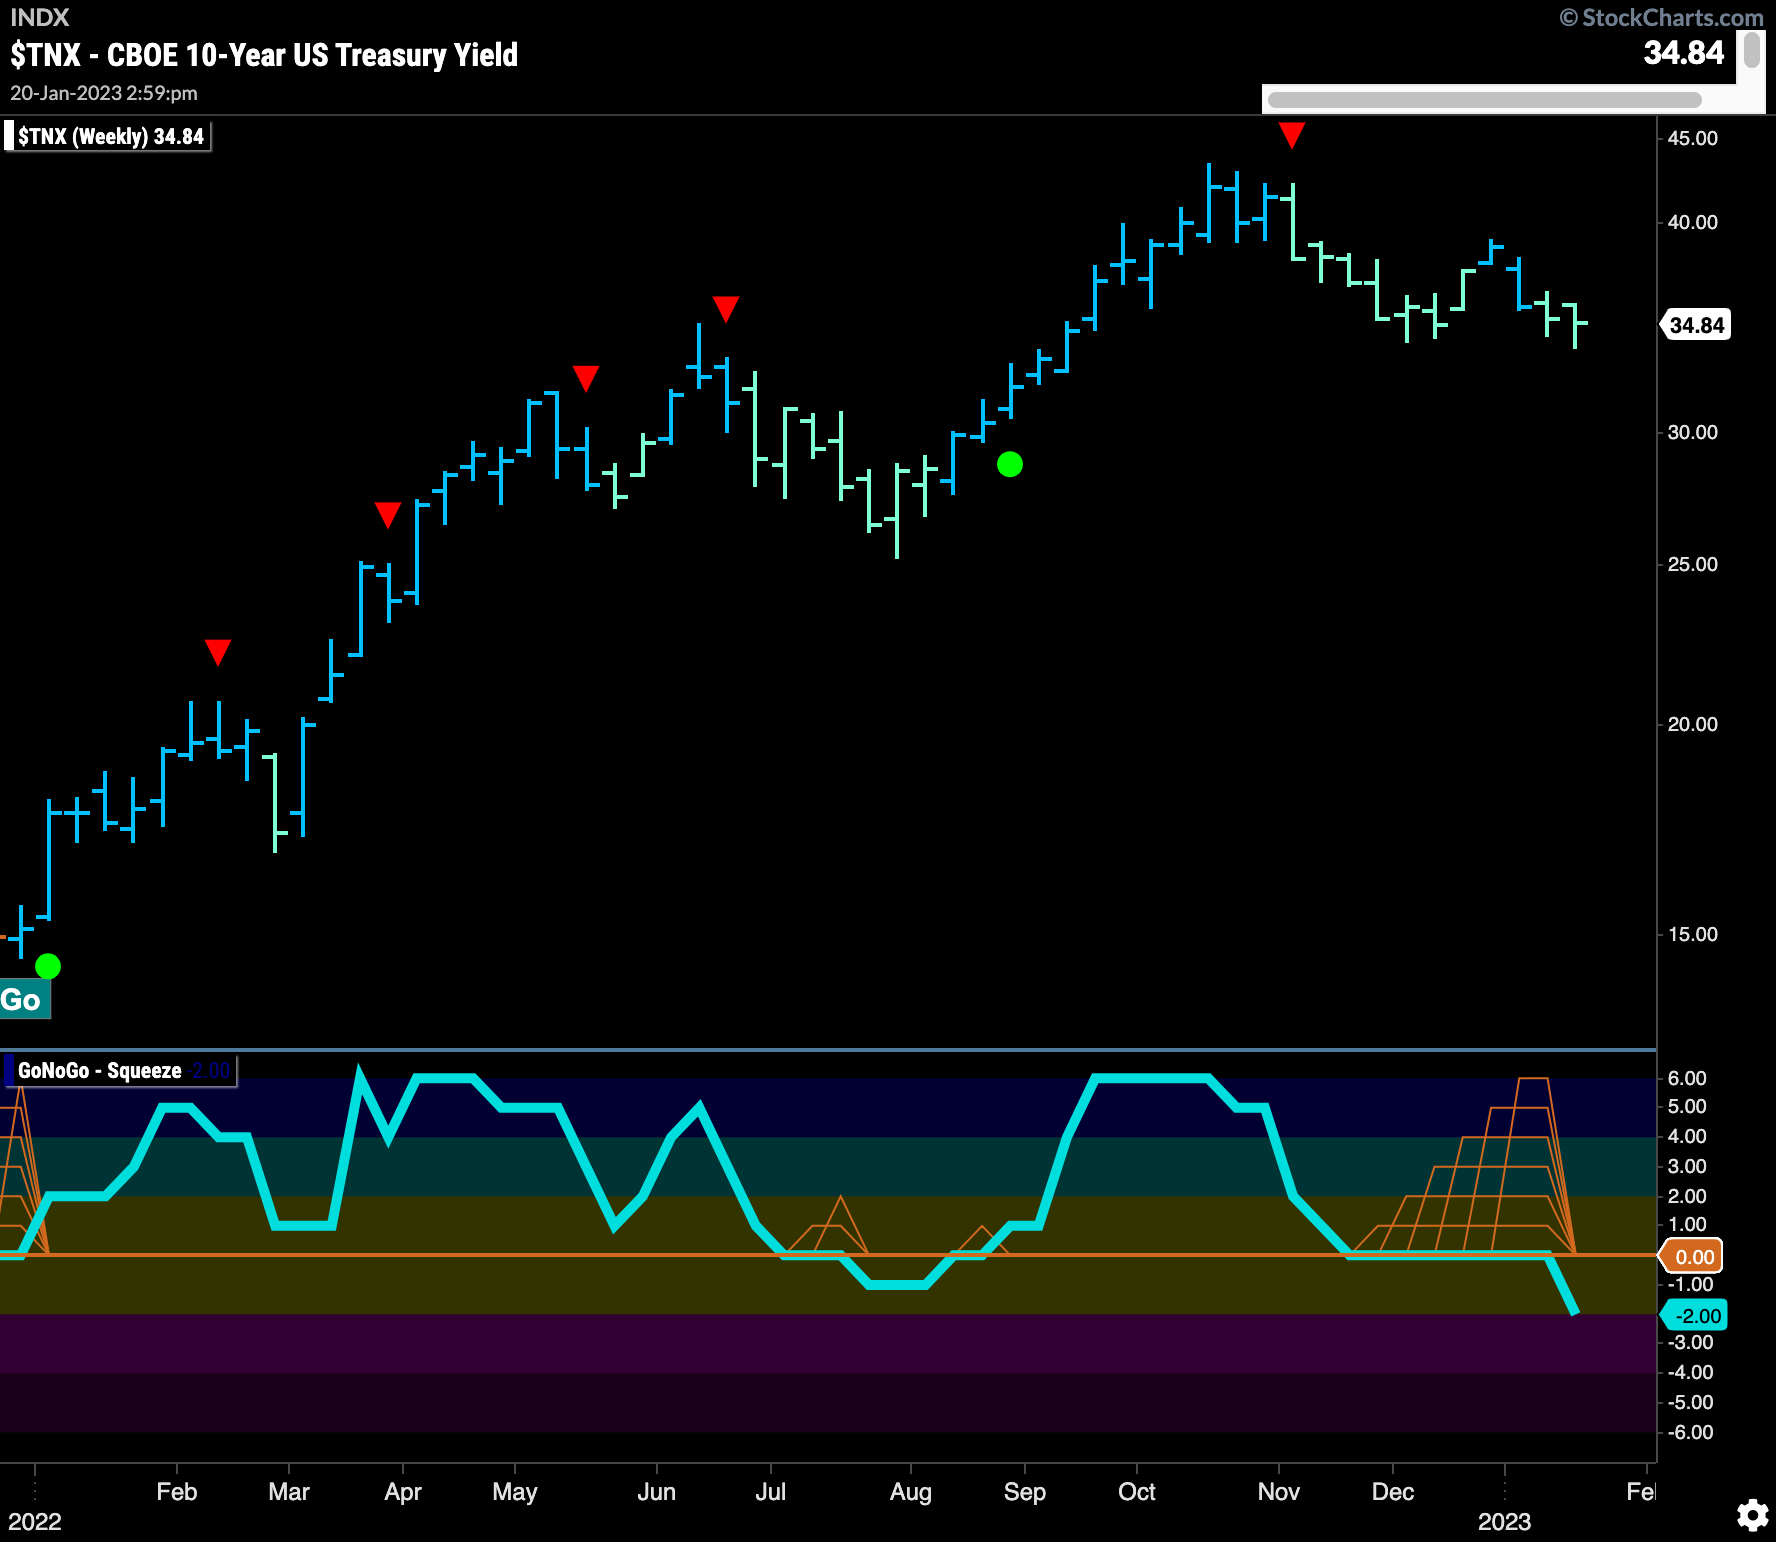
The longer term chart shows that the depressed prices from the daily are taking their toll on the persistent “Go” trend that has been in place on weekly bars. Since the high late last year we have seen a Go Countertrend Correction Icon (red arrow) which indicated that prices may struggle to go higher followed by predominantly weaker aqua “Go” bars. Most importantly, if we look to the lower panel we can see that GoNoGo Oscillator broke out of a Max GoNoGo Squeeze into negative territory last week and moved lower on this past bar. This tells us that momentum is no longer in the direction of the “Go” trend.
The Dollar Made Another Lower Low
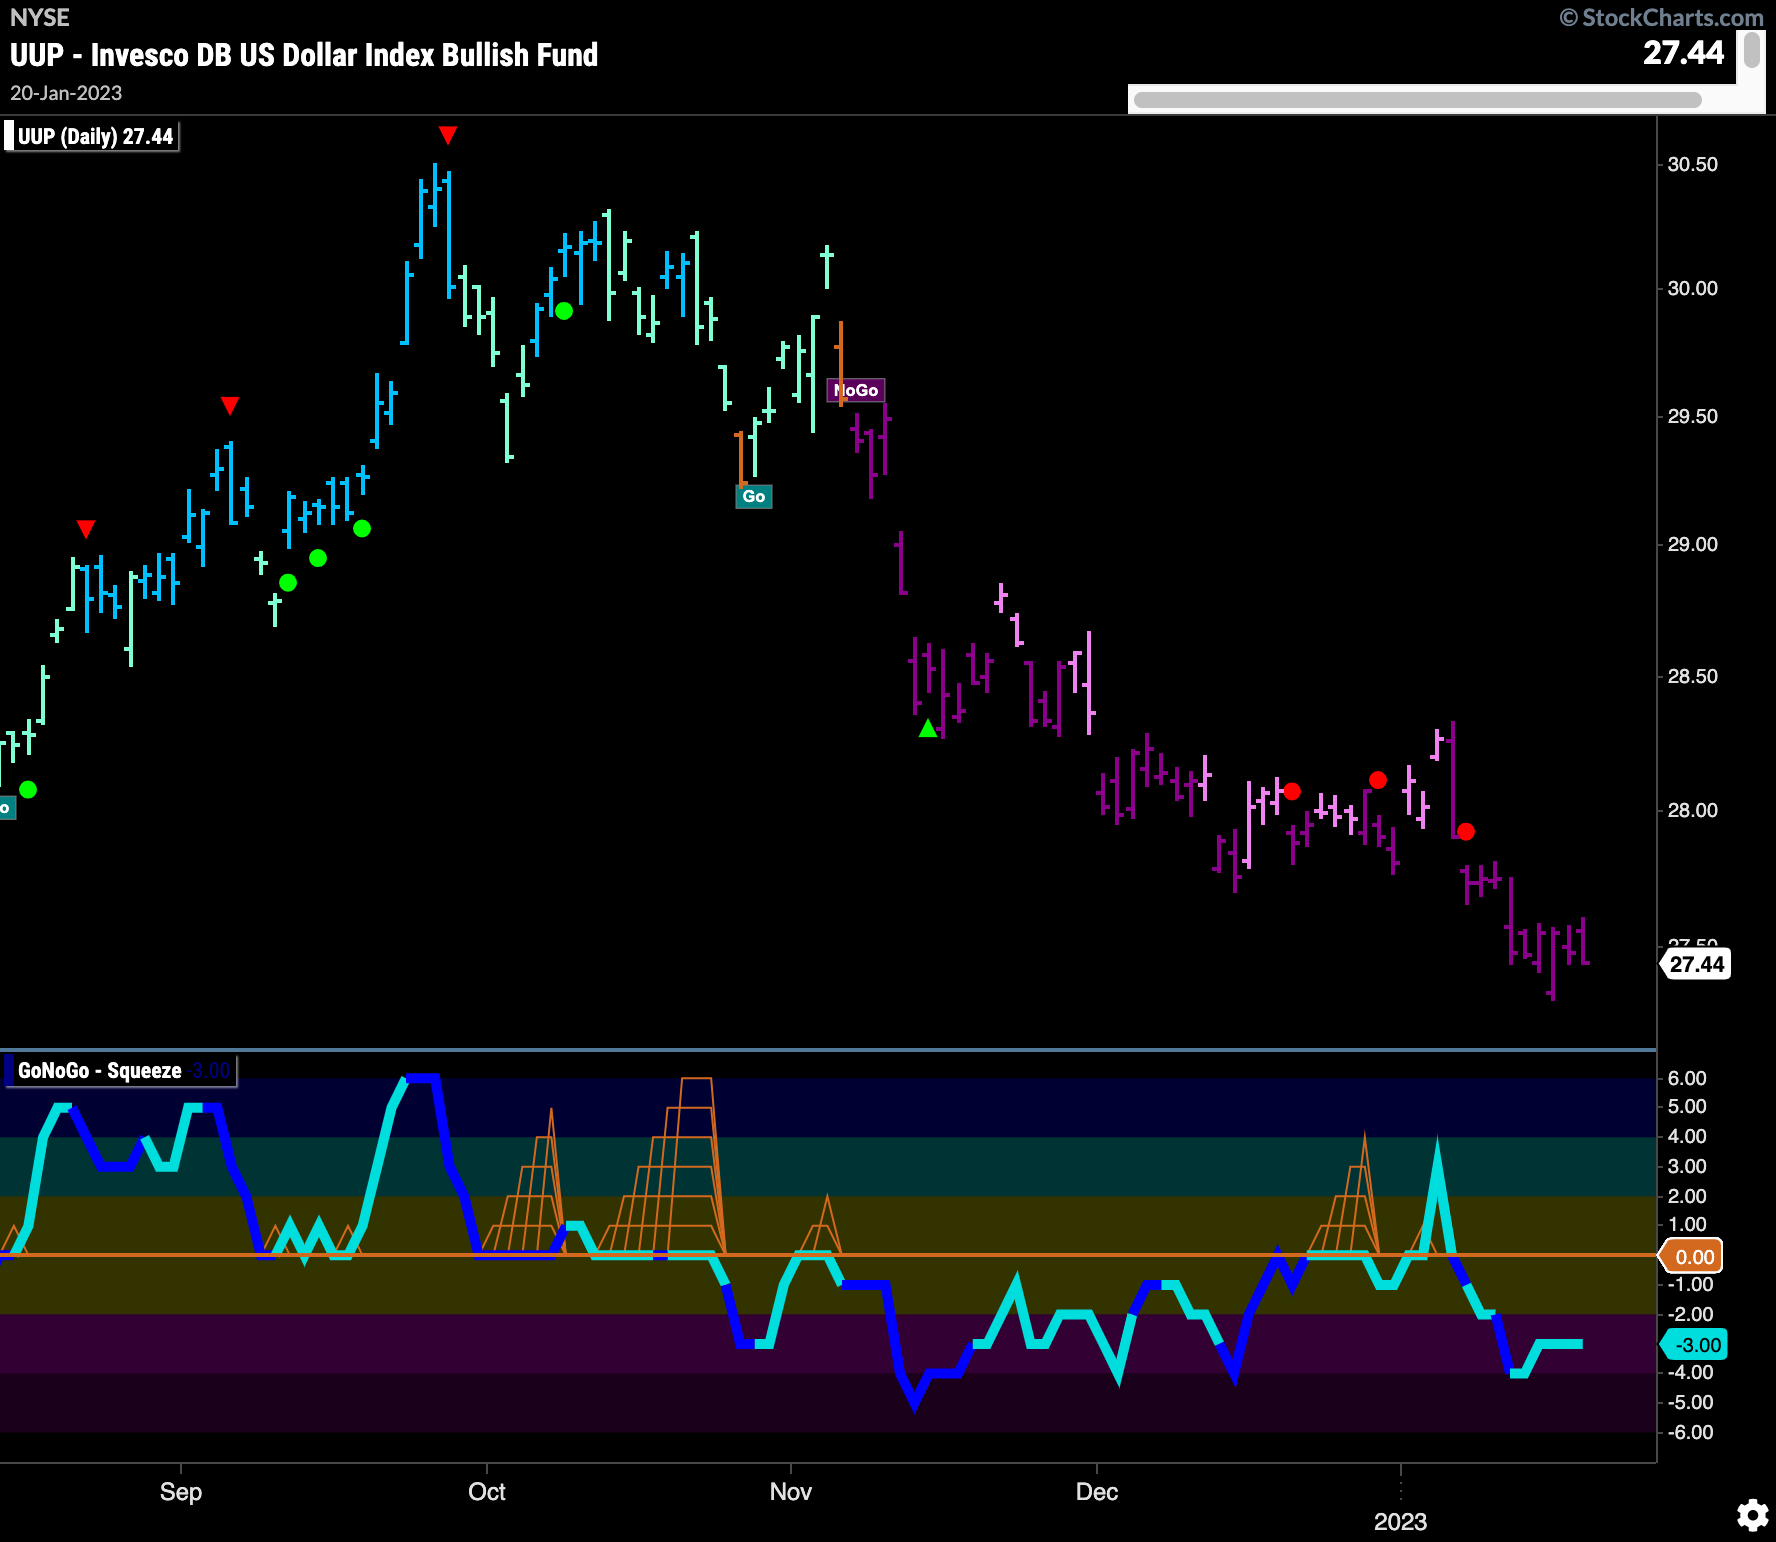
Price fell further this week as we saw a new low. GoNoGo Oscillator is in negative territory but not oversold and this tells us that momentum is on the side of the “NoGo” trend. GoNoGo Trend shows that we have painted strong “NoGo” bars all week as price moved lower once again. This chart continues to look bearish for the dollar.
$GLD is Finally Having its Day
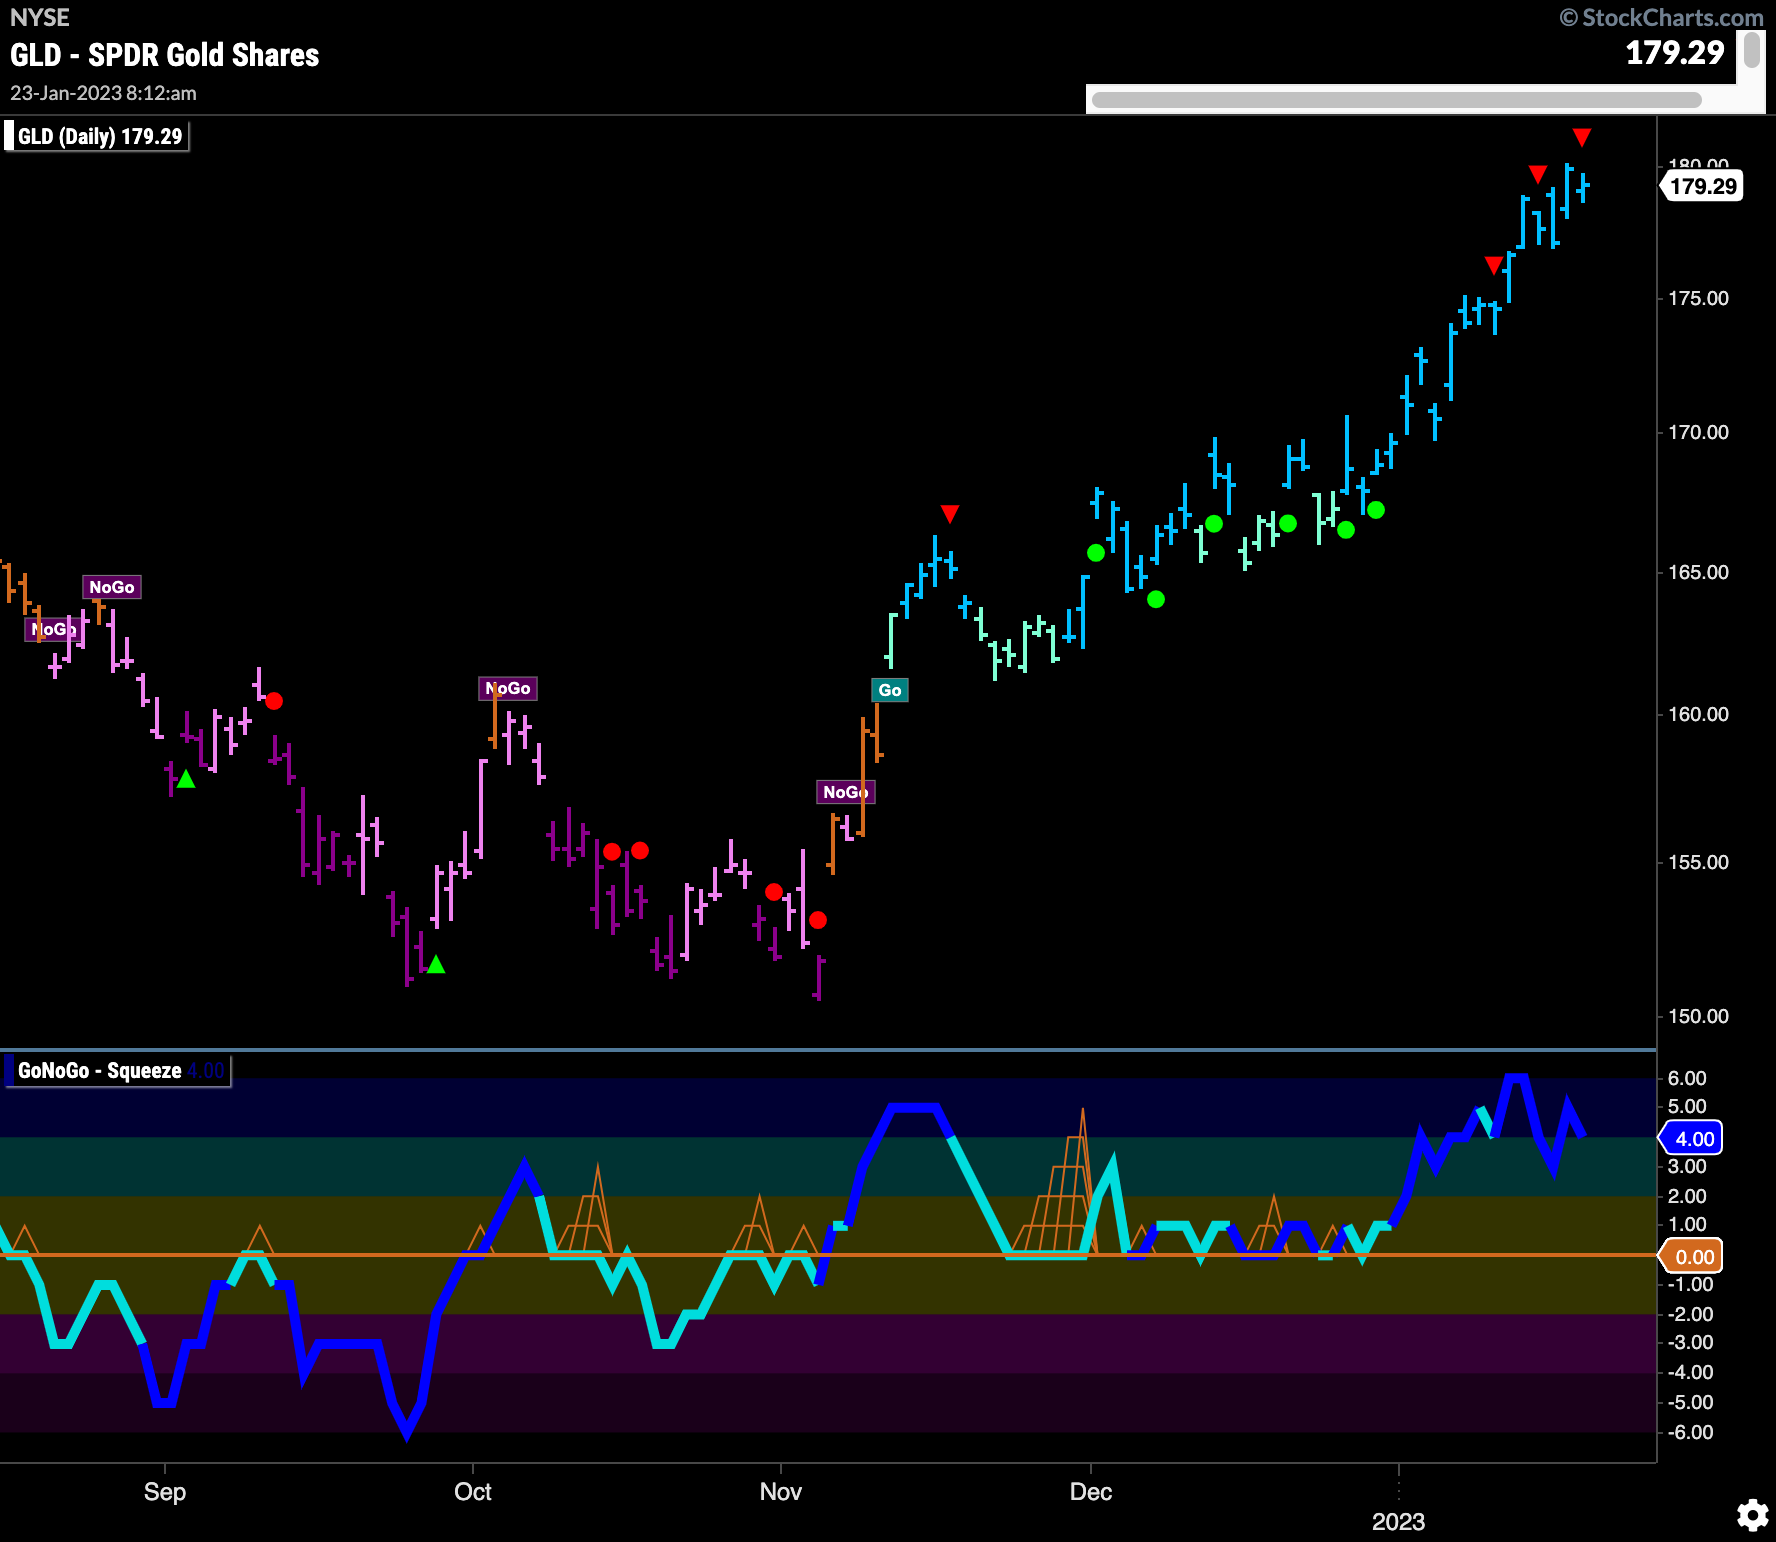
Analysts called for a rise in Gold prices for months and months in 2021 and 2022 and it never happened. Now, gold prices are soaring. The chart below shows that a “Go” trend has been in place since the end of 2022 and we have seen a string of uninterrupted strong blue “Go” bars as price has raced higher. Throughout this “Go” trend, GoNoGo Oscillator has found support at the zero line and so the chart has given us several Go Trend Continuation Icons (green circles) along the way to participate in the trend.
Gold Miners to Move Higher Still?
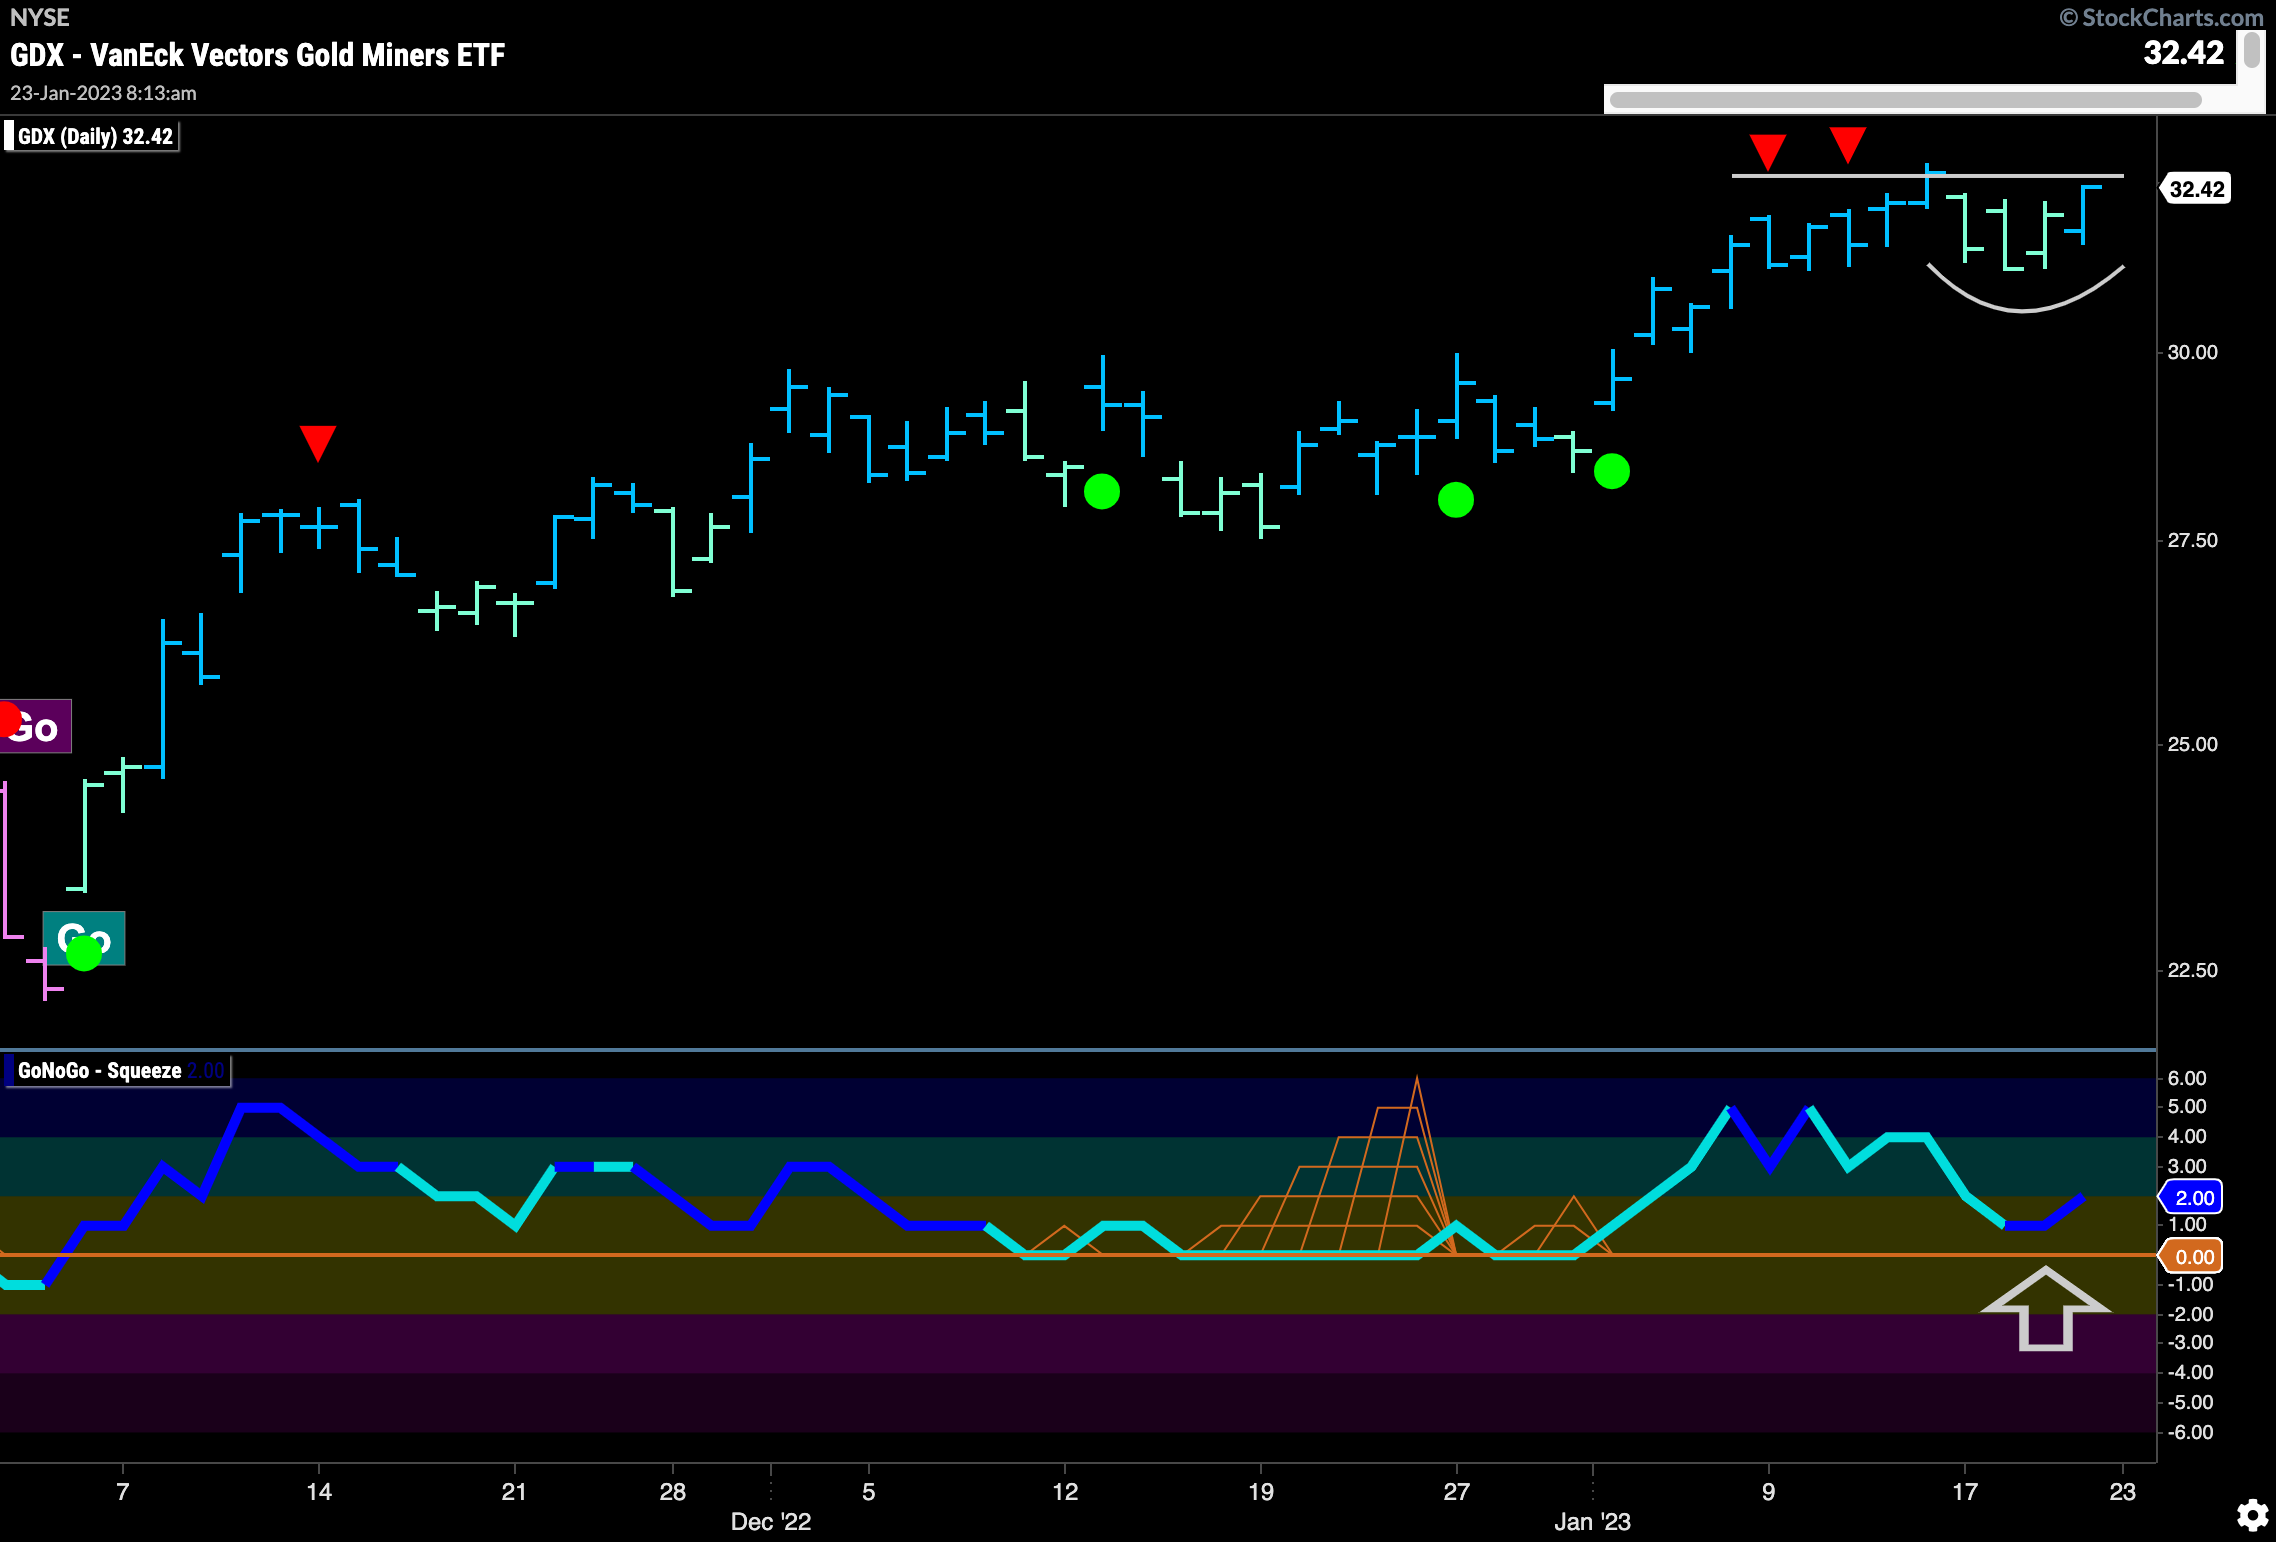
The chart below shows prices of $GDX, the gold miners ETF. With the rising prices in the precious metal, we have seen strength in miners as well. Perhaps though, after a week’s consolidation we are setting up for further price gains. After the “Go” was identified, GoNoGo Oscillator has stayed in positive territory and found support at the zero line throughout. Now, as price moves sideways consolidating against the trend the oscillator has moved close to zero and turned up. We will look to see if this fresh momentum helps price break to new highs.
Sector RelMap
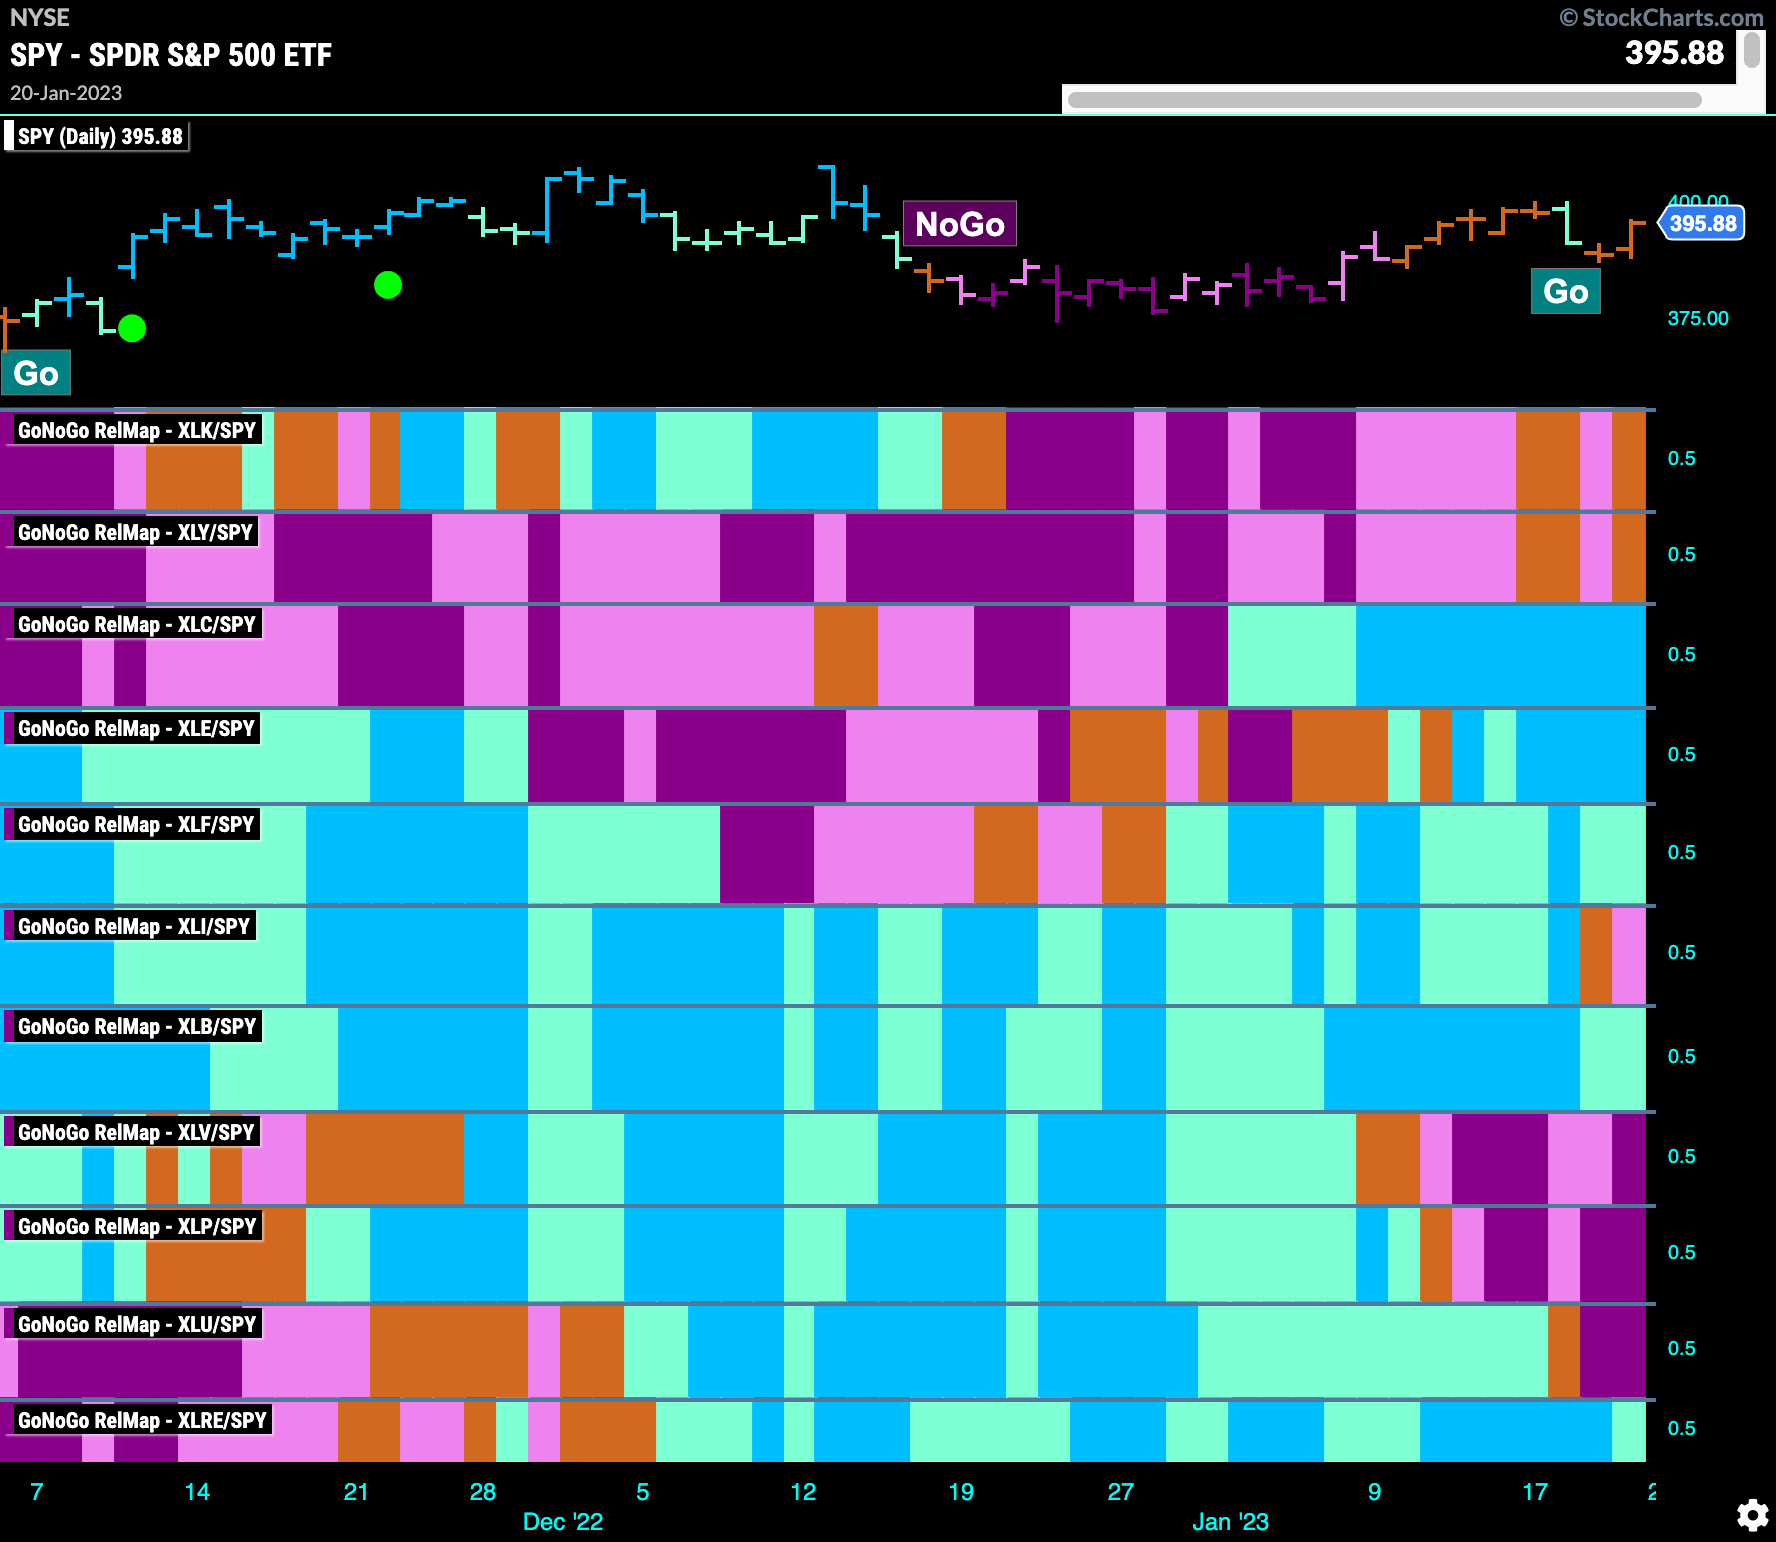
Below is the GoNoGo Sector RelMap. This GoNoGo RelMap applies the GoNoGo Trend to the relative strength ratios of the sectors to the base index. Looking at this map, we can quickly see where the relative outperformance is coming from as well as which sectors are lagging on a relative basis. 5 sectors are outperforming the base this week. $XLC, $XLE, $XLF, $XLB, and $XLRE, are painting “Go” bars.
Communications Sector Speaking to Us
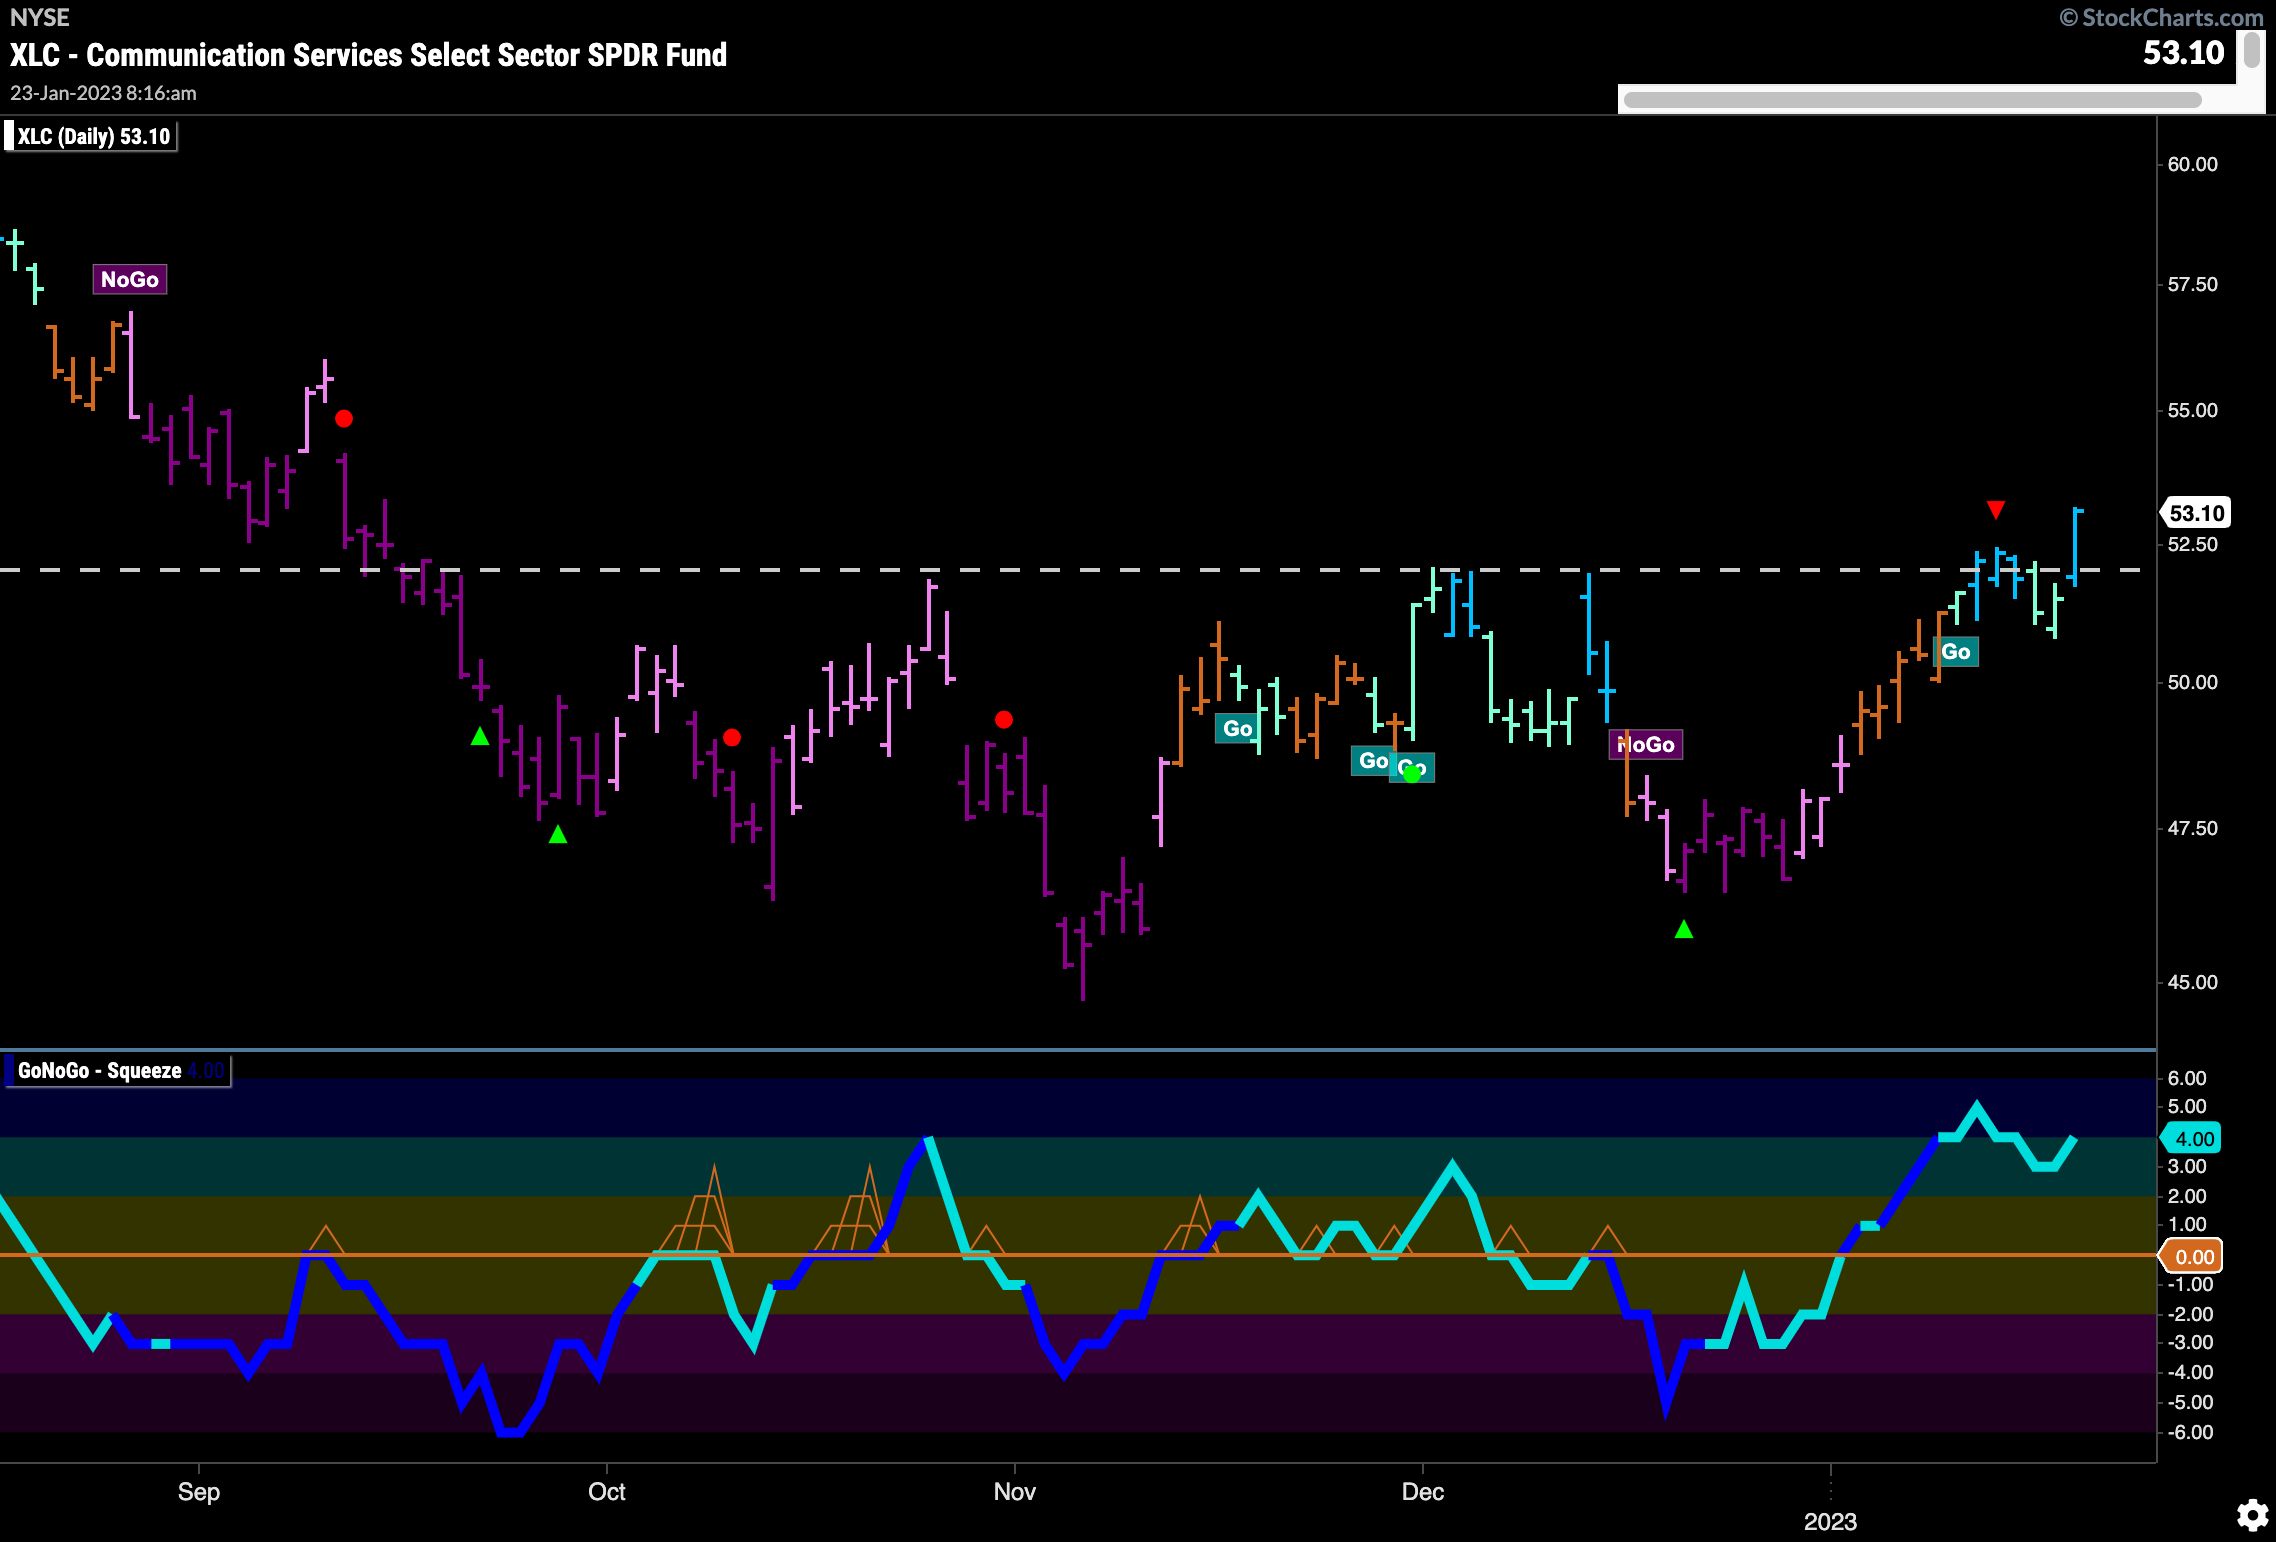
After a great deal of chop, $XLC has entered a “Go” trend just over a week ago and has managed to maintain “Go” bars. On top of this, Friday’s price action saw price rally above long term resistance on a strong blue “Go” bar. GoNoGo Oscillator is in positive territory but not overbought suggesting that there may be some more room to run.
Long Term Positive Signs Emerging in Communications
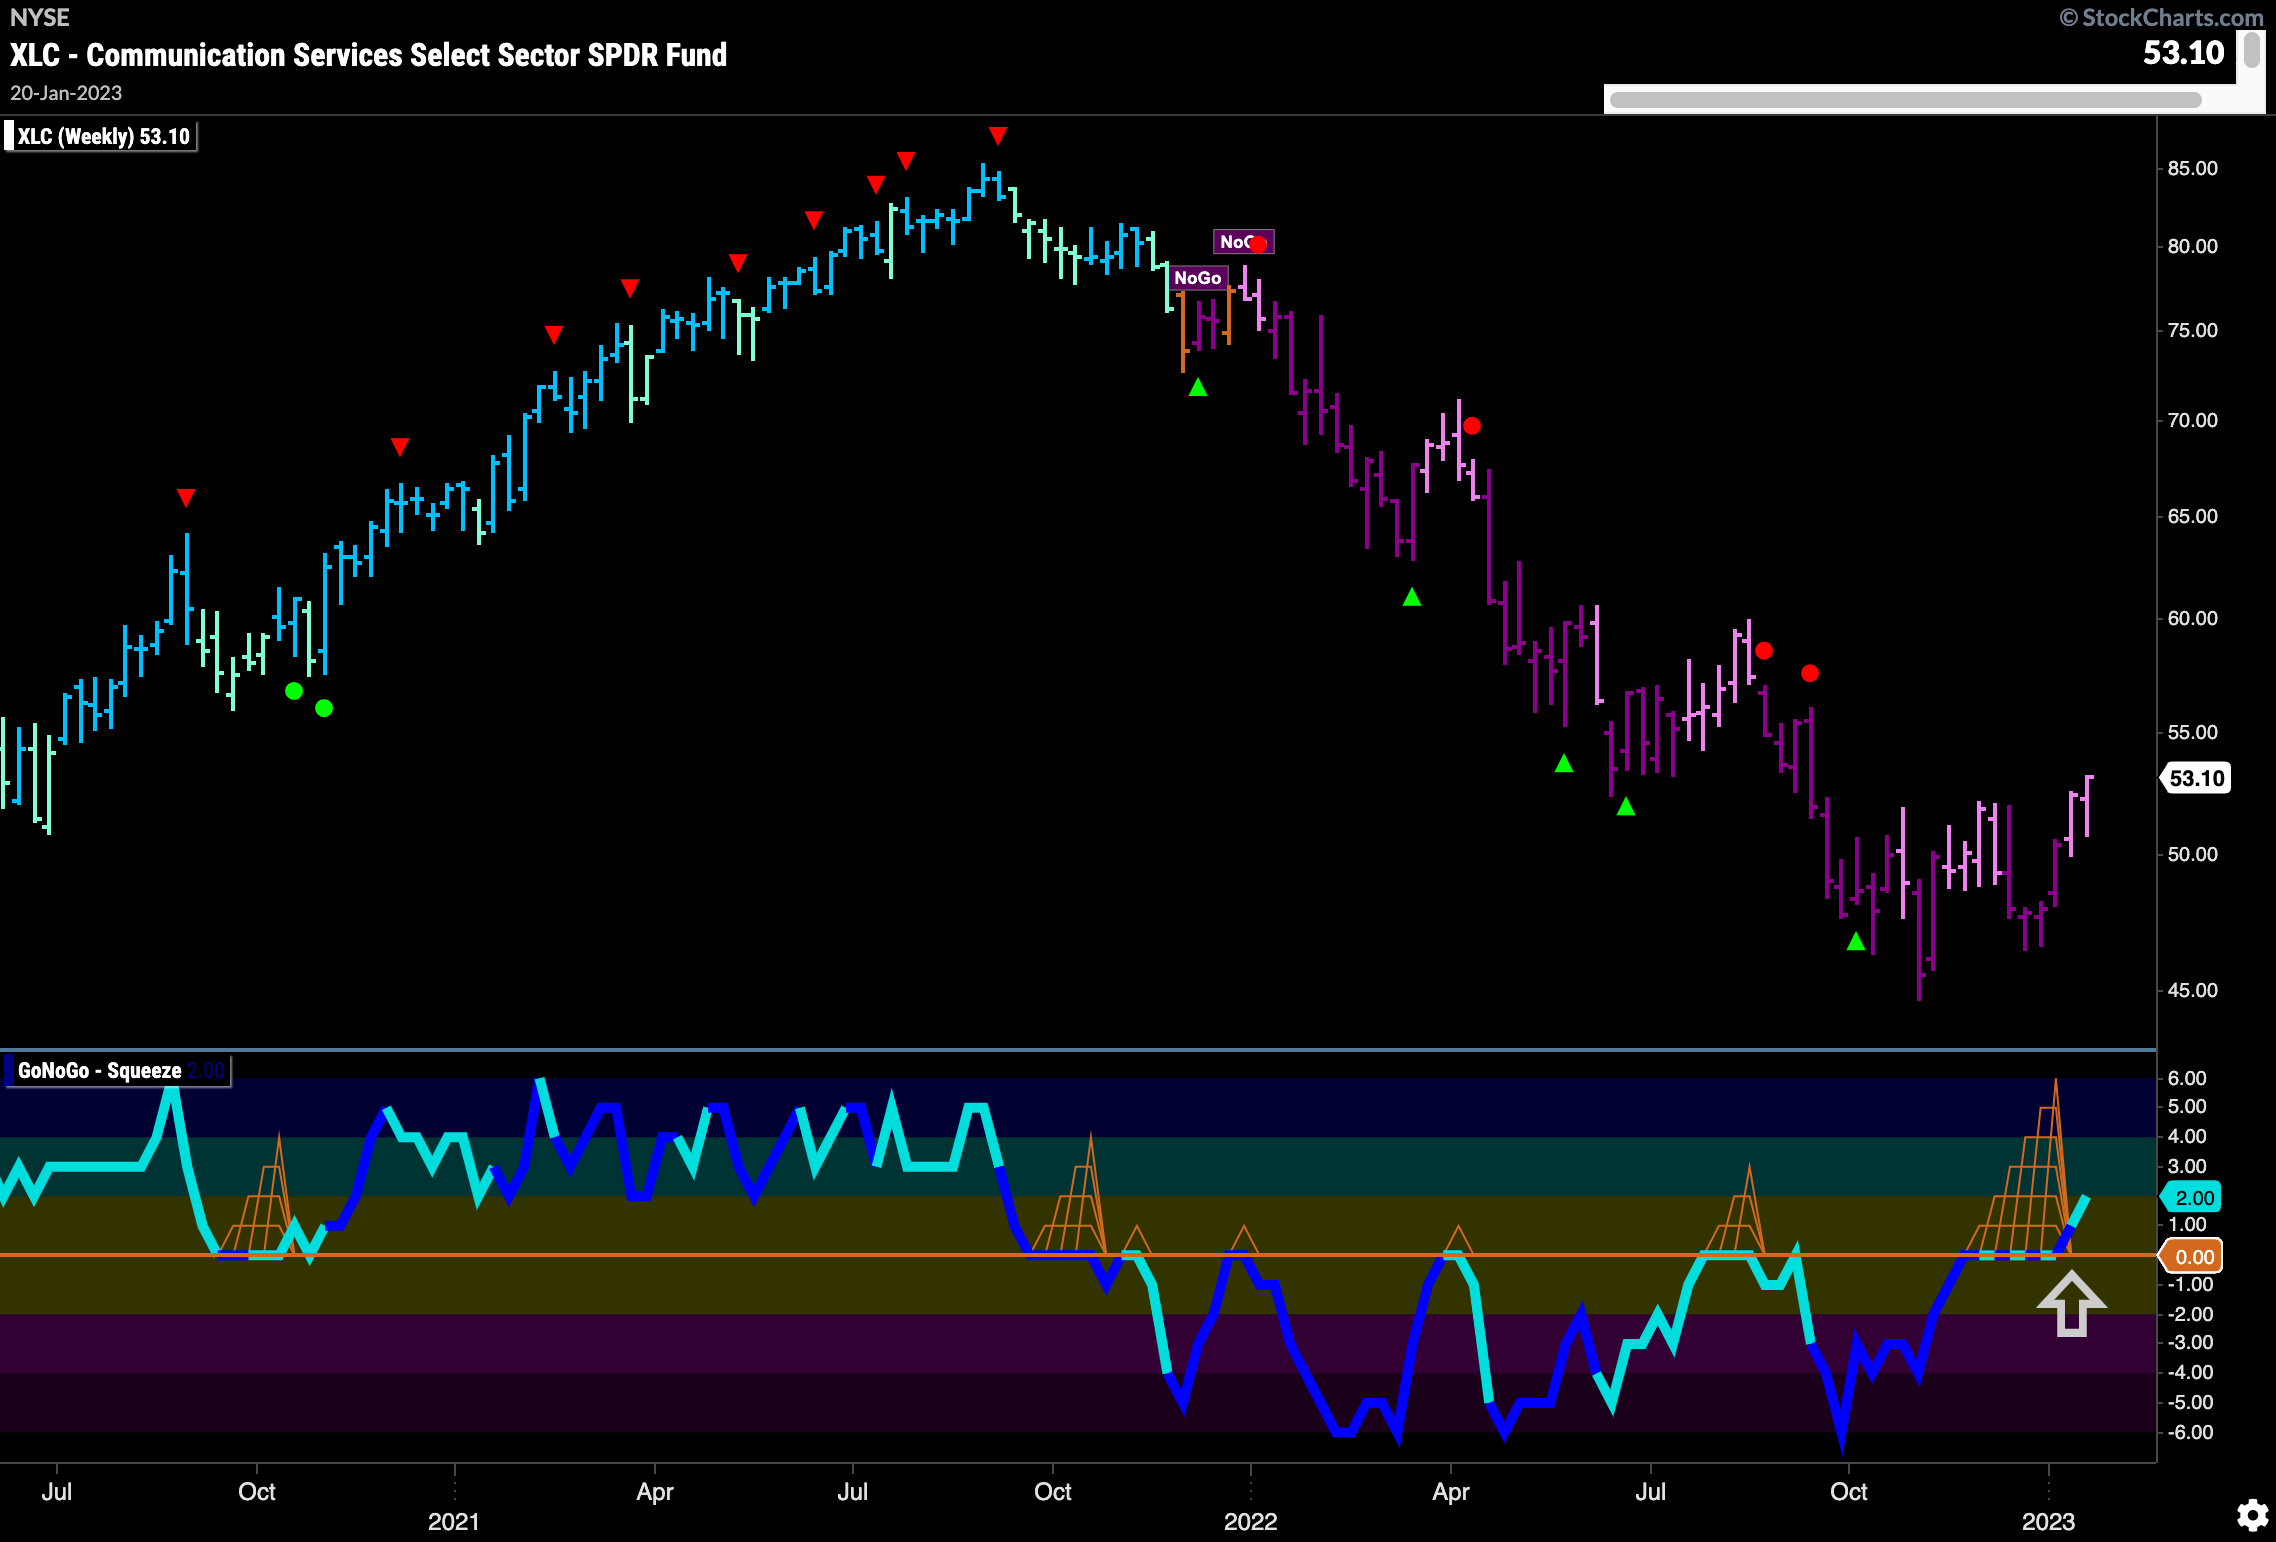
The weekly chart below shows just how bad it has been in this sector now for about a year. However, after a first higher low was set a month ago, we saw the GoNoGo Oscillator break out of a Max GoNoGo Squeeze into positive territory. This coincides with price setting a first higher high. These are signs of bullish activity. We will watch to see if the extra momentum will allow the GoNoGo Trend indicator to paint new “Go” bars soon.
$META Looks Strong
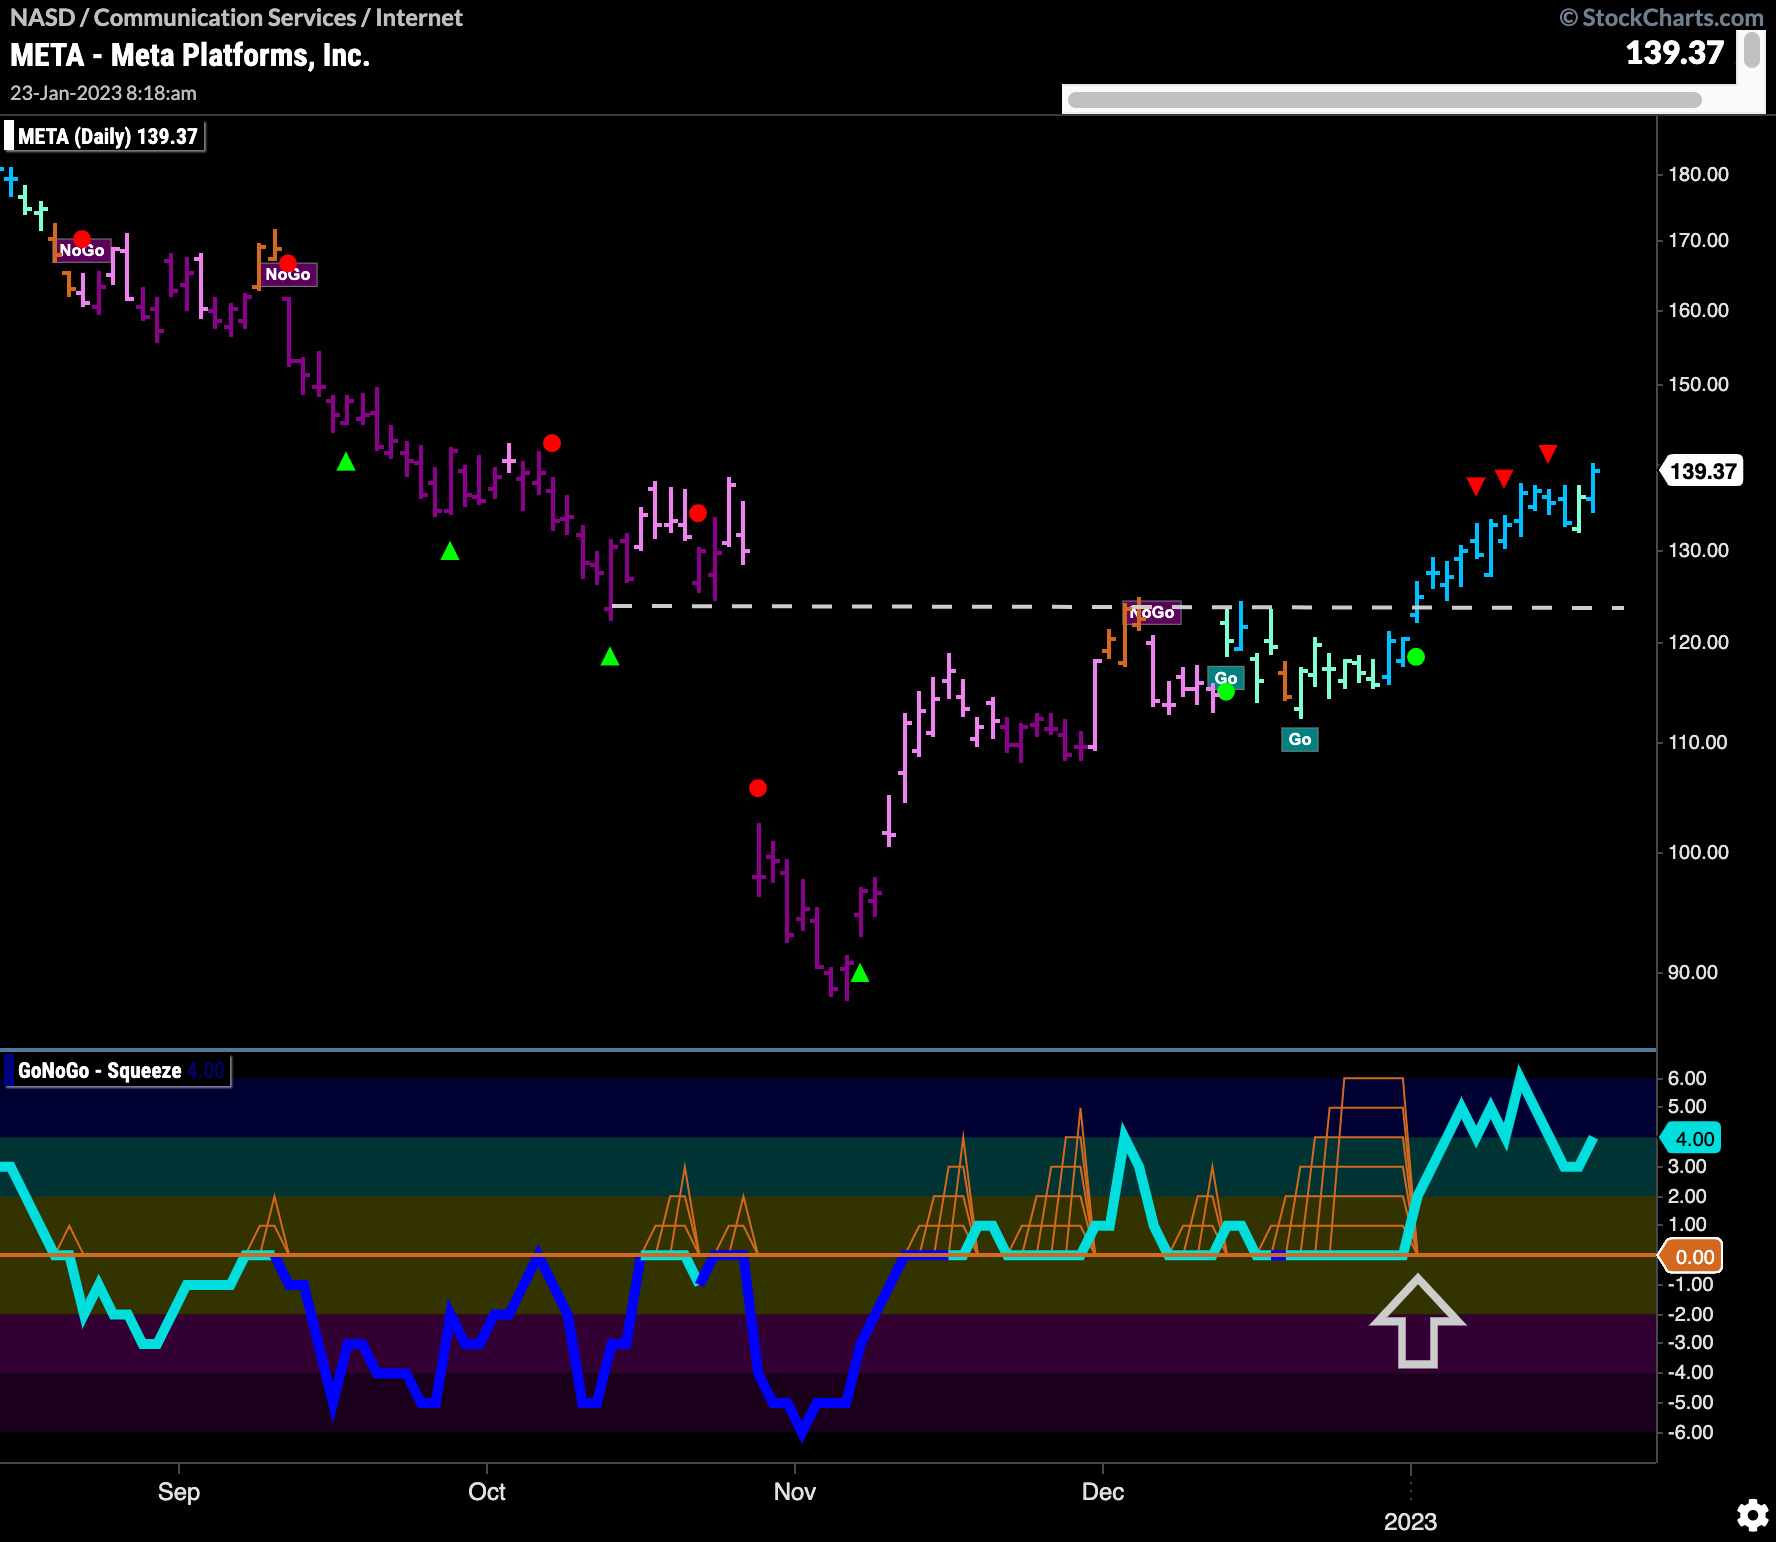
$Meta has been performing well over the last couple of months. GoNoGo Trend is painting strong blue “Go” bars and we have seen that price has been able to rally out of a basing pattern and climb above the resistance from the massive gap down late last year. Price made that break as GoNoGo Oscillator broke out of a Max GoNoGo Squeeze into positive territory. Momentum is now positive and therefore confirming the “Go” trend.
Altice USA Ready For New Highs
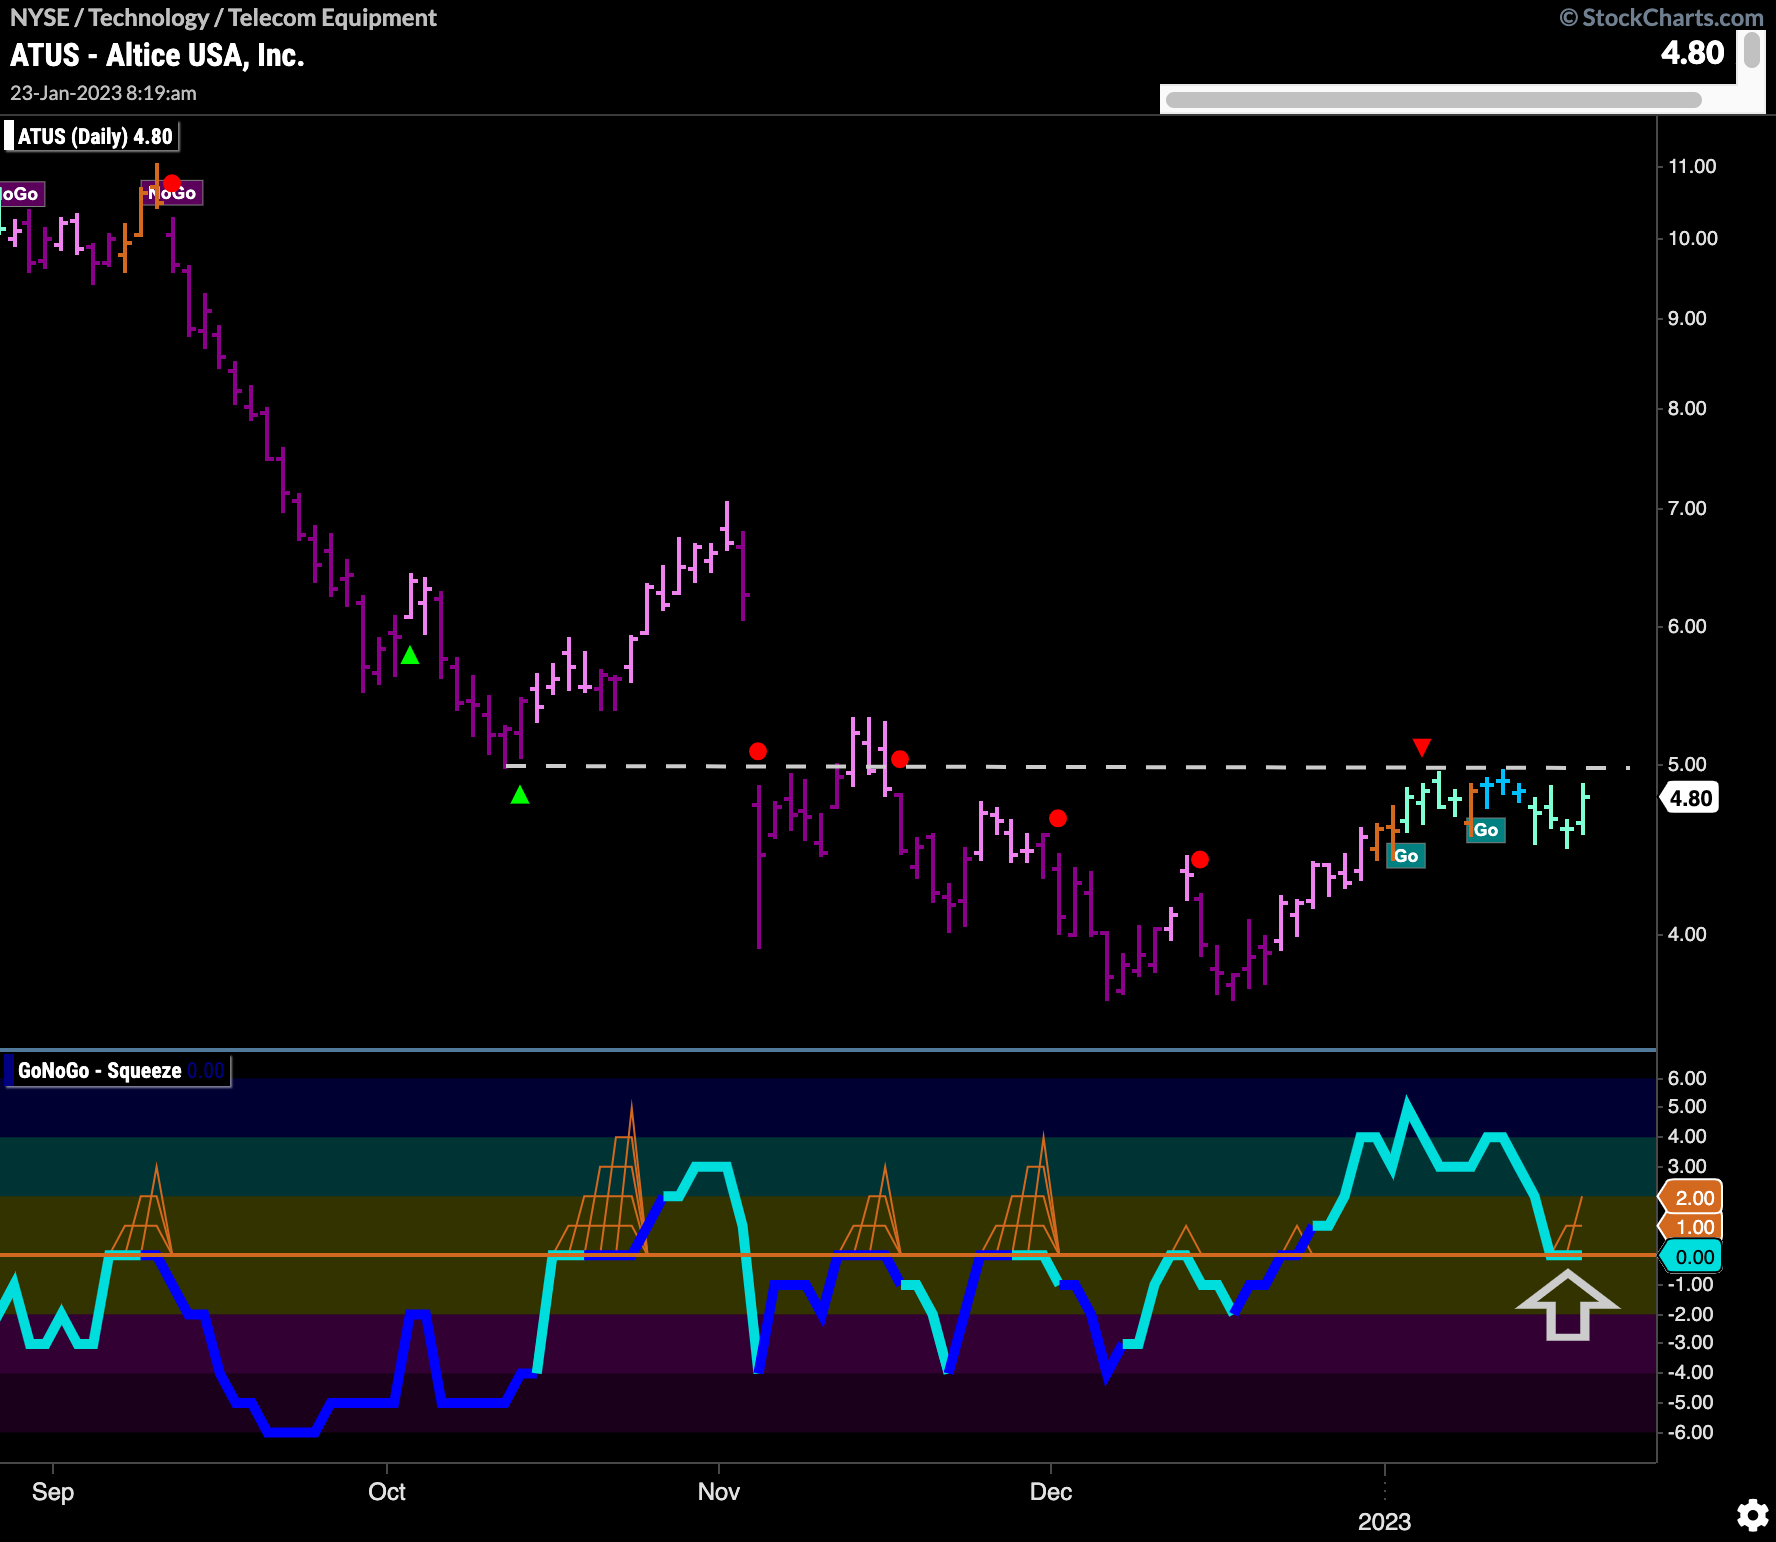
The chart below of $ATUS shows another major player that is in the technology sector but is a producer of telecommunications equipment. With the trend showing change in Technolgoy (refer to GoNoGo Sector Relmap where $XLK paints an amber “Go Fish” bar) and with the strong outperformance in communications, perhaps $ATUS is ready to break out. The chart shows that a “Go” trend is in place but that price is running up against resistance from the large gap down late last year. GoNoGo Oscillator is at zero and we will look to see if it can find support at this level. If GoNoGo Oscillator can rally back into positive territory we will see a Go Trend Continuation Icon (green circle) under the price bar which would suggest price can move above resistance to set a new high. 