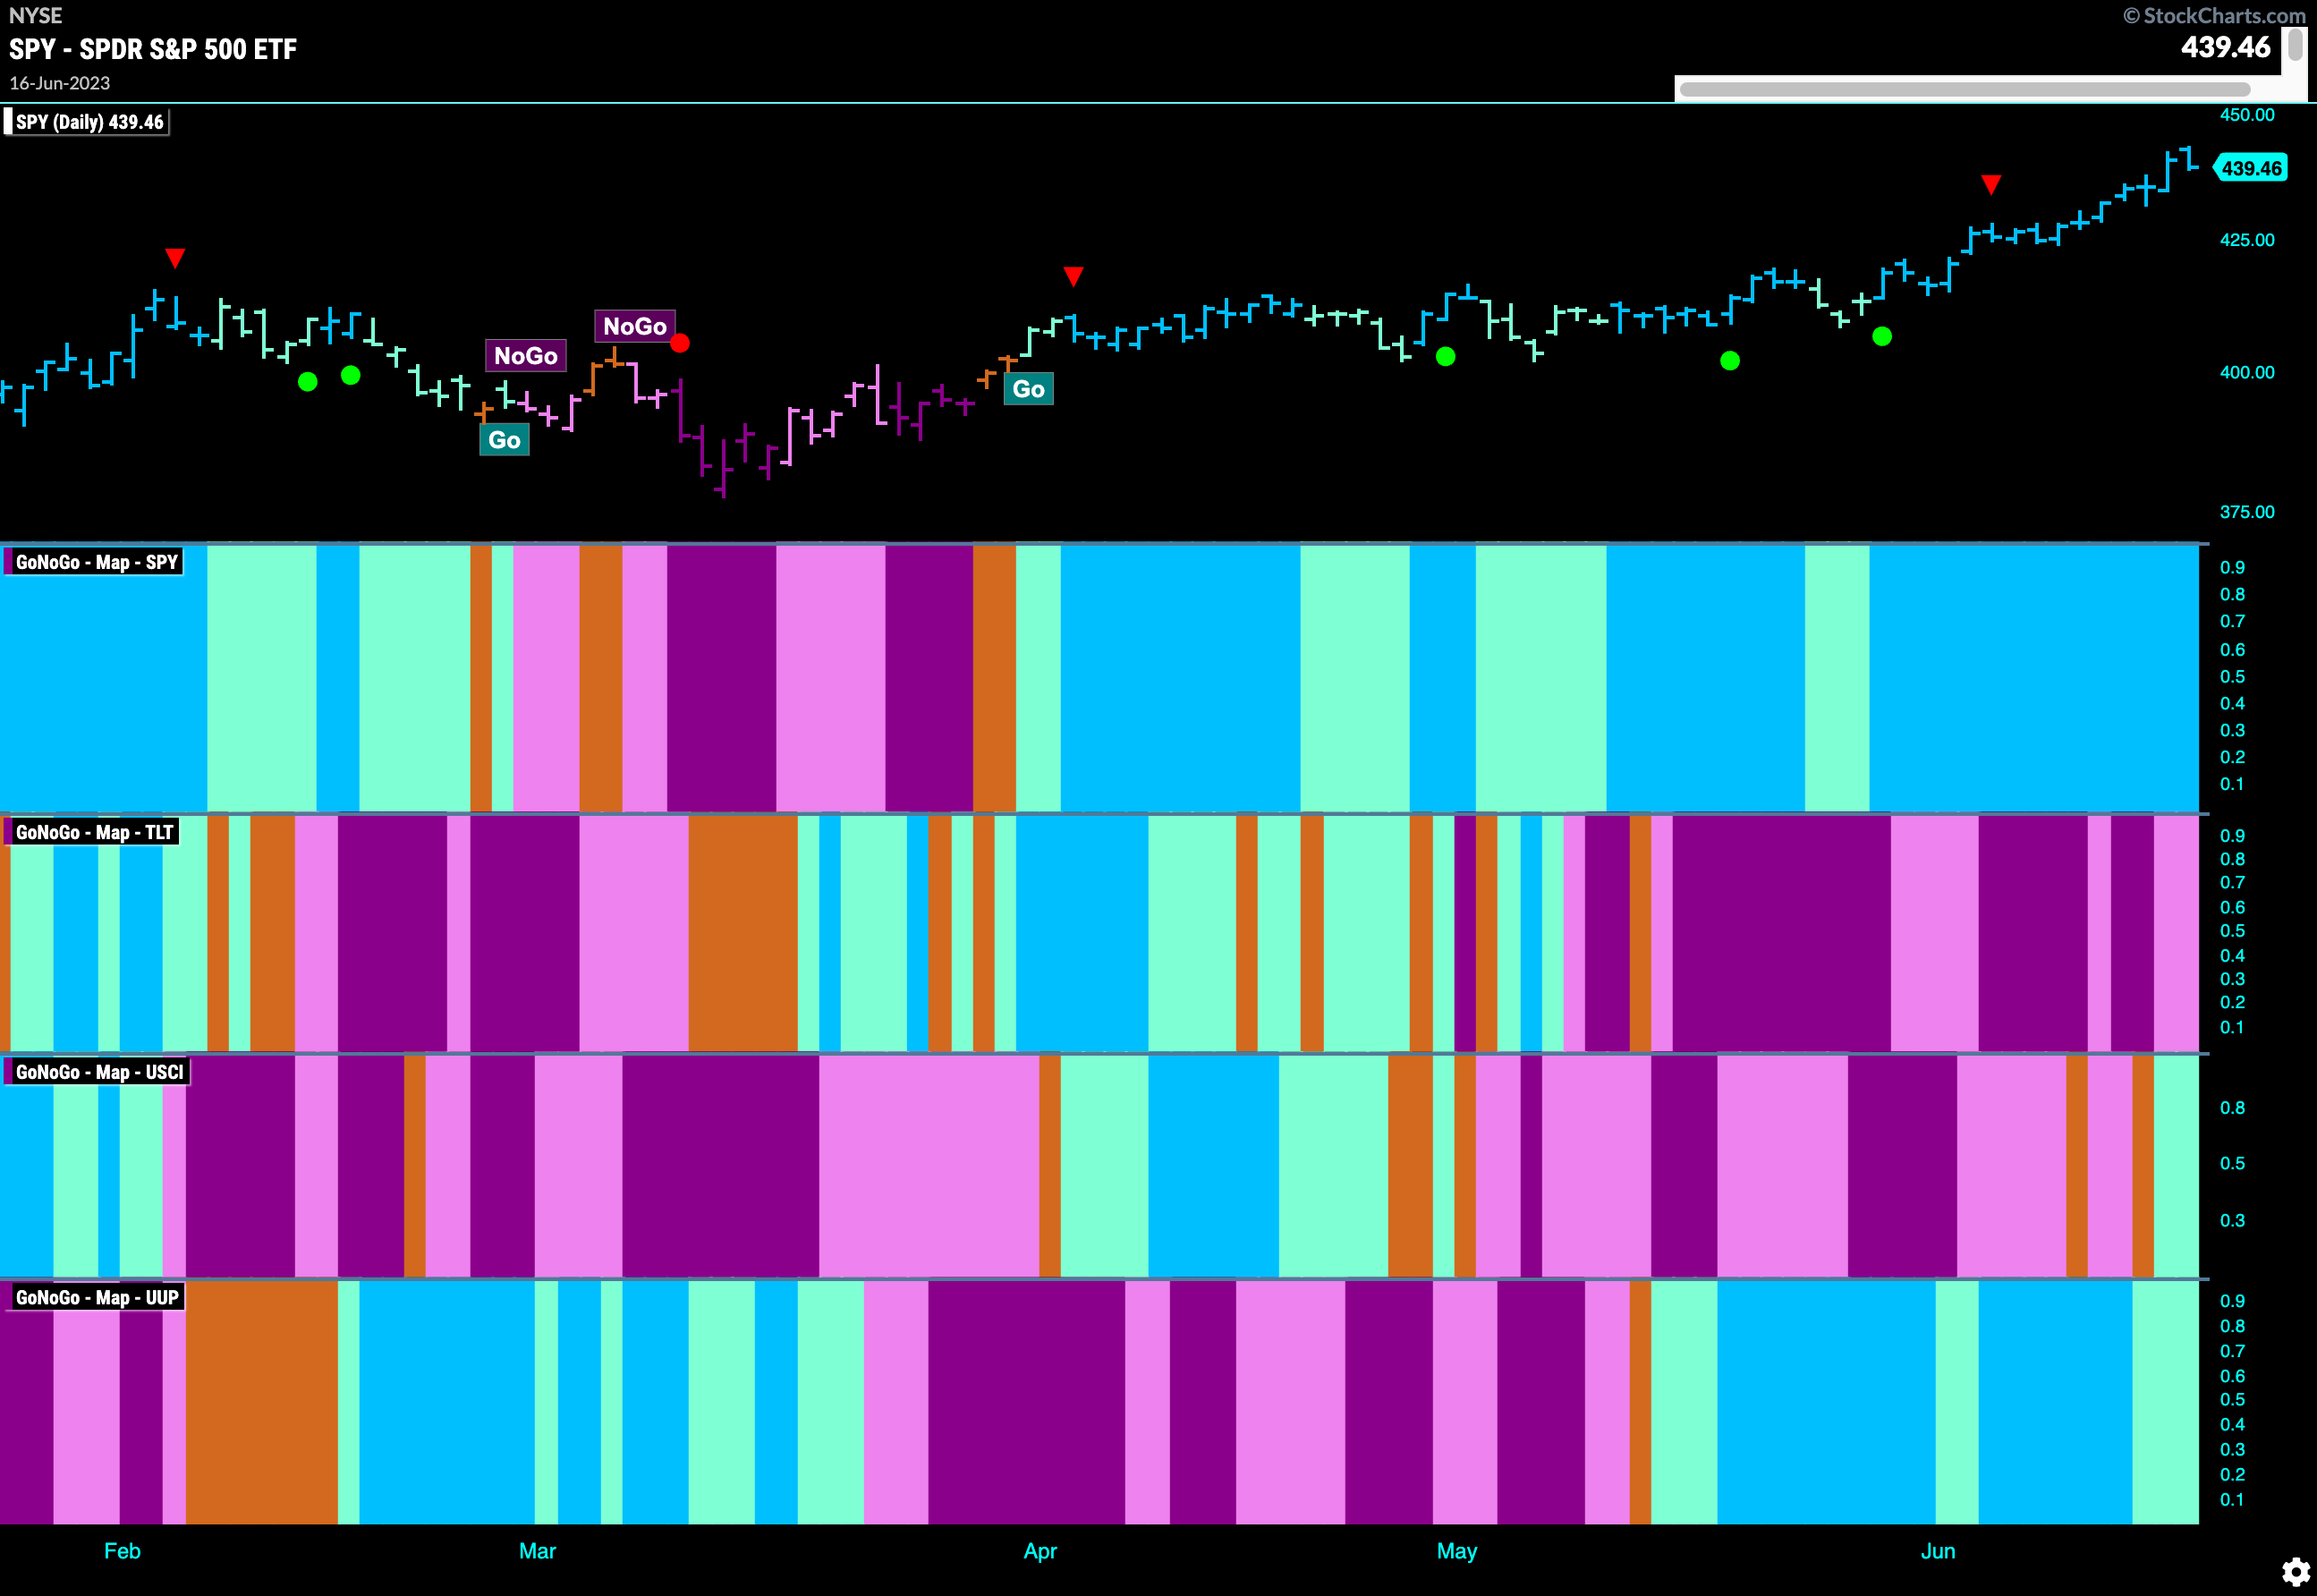
Good morning and welcome to this week’s Flight Path. I hope all Stateside enjoyed a good Father’s day weekend and the Juneteenth holiday yesterday. Markets are back today and we can see that the “Go” trend in U.S. Equities has gone from strength to strength these past few weeks as we now have a string of uninterrupted strong blue bars again this week. The only real change this week is in the commodities space where we see some effort for the U.S. Commodity Index to enter a new “Go” trend. These trends have not been sustainable lately though so we will watch to see if this one can hold. The dollar shows some weakness again as it paints aqua bars.
Equity Prices Continued Higher Last Week
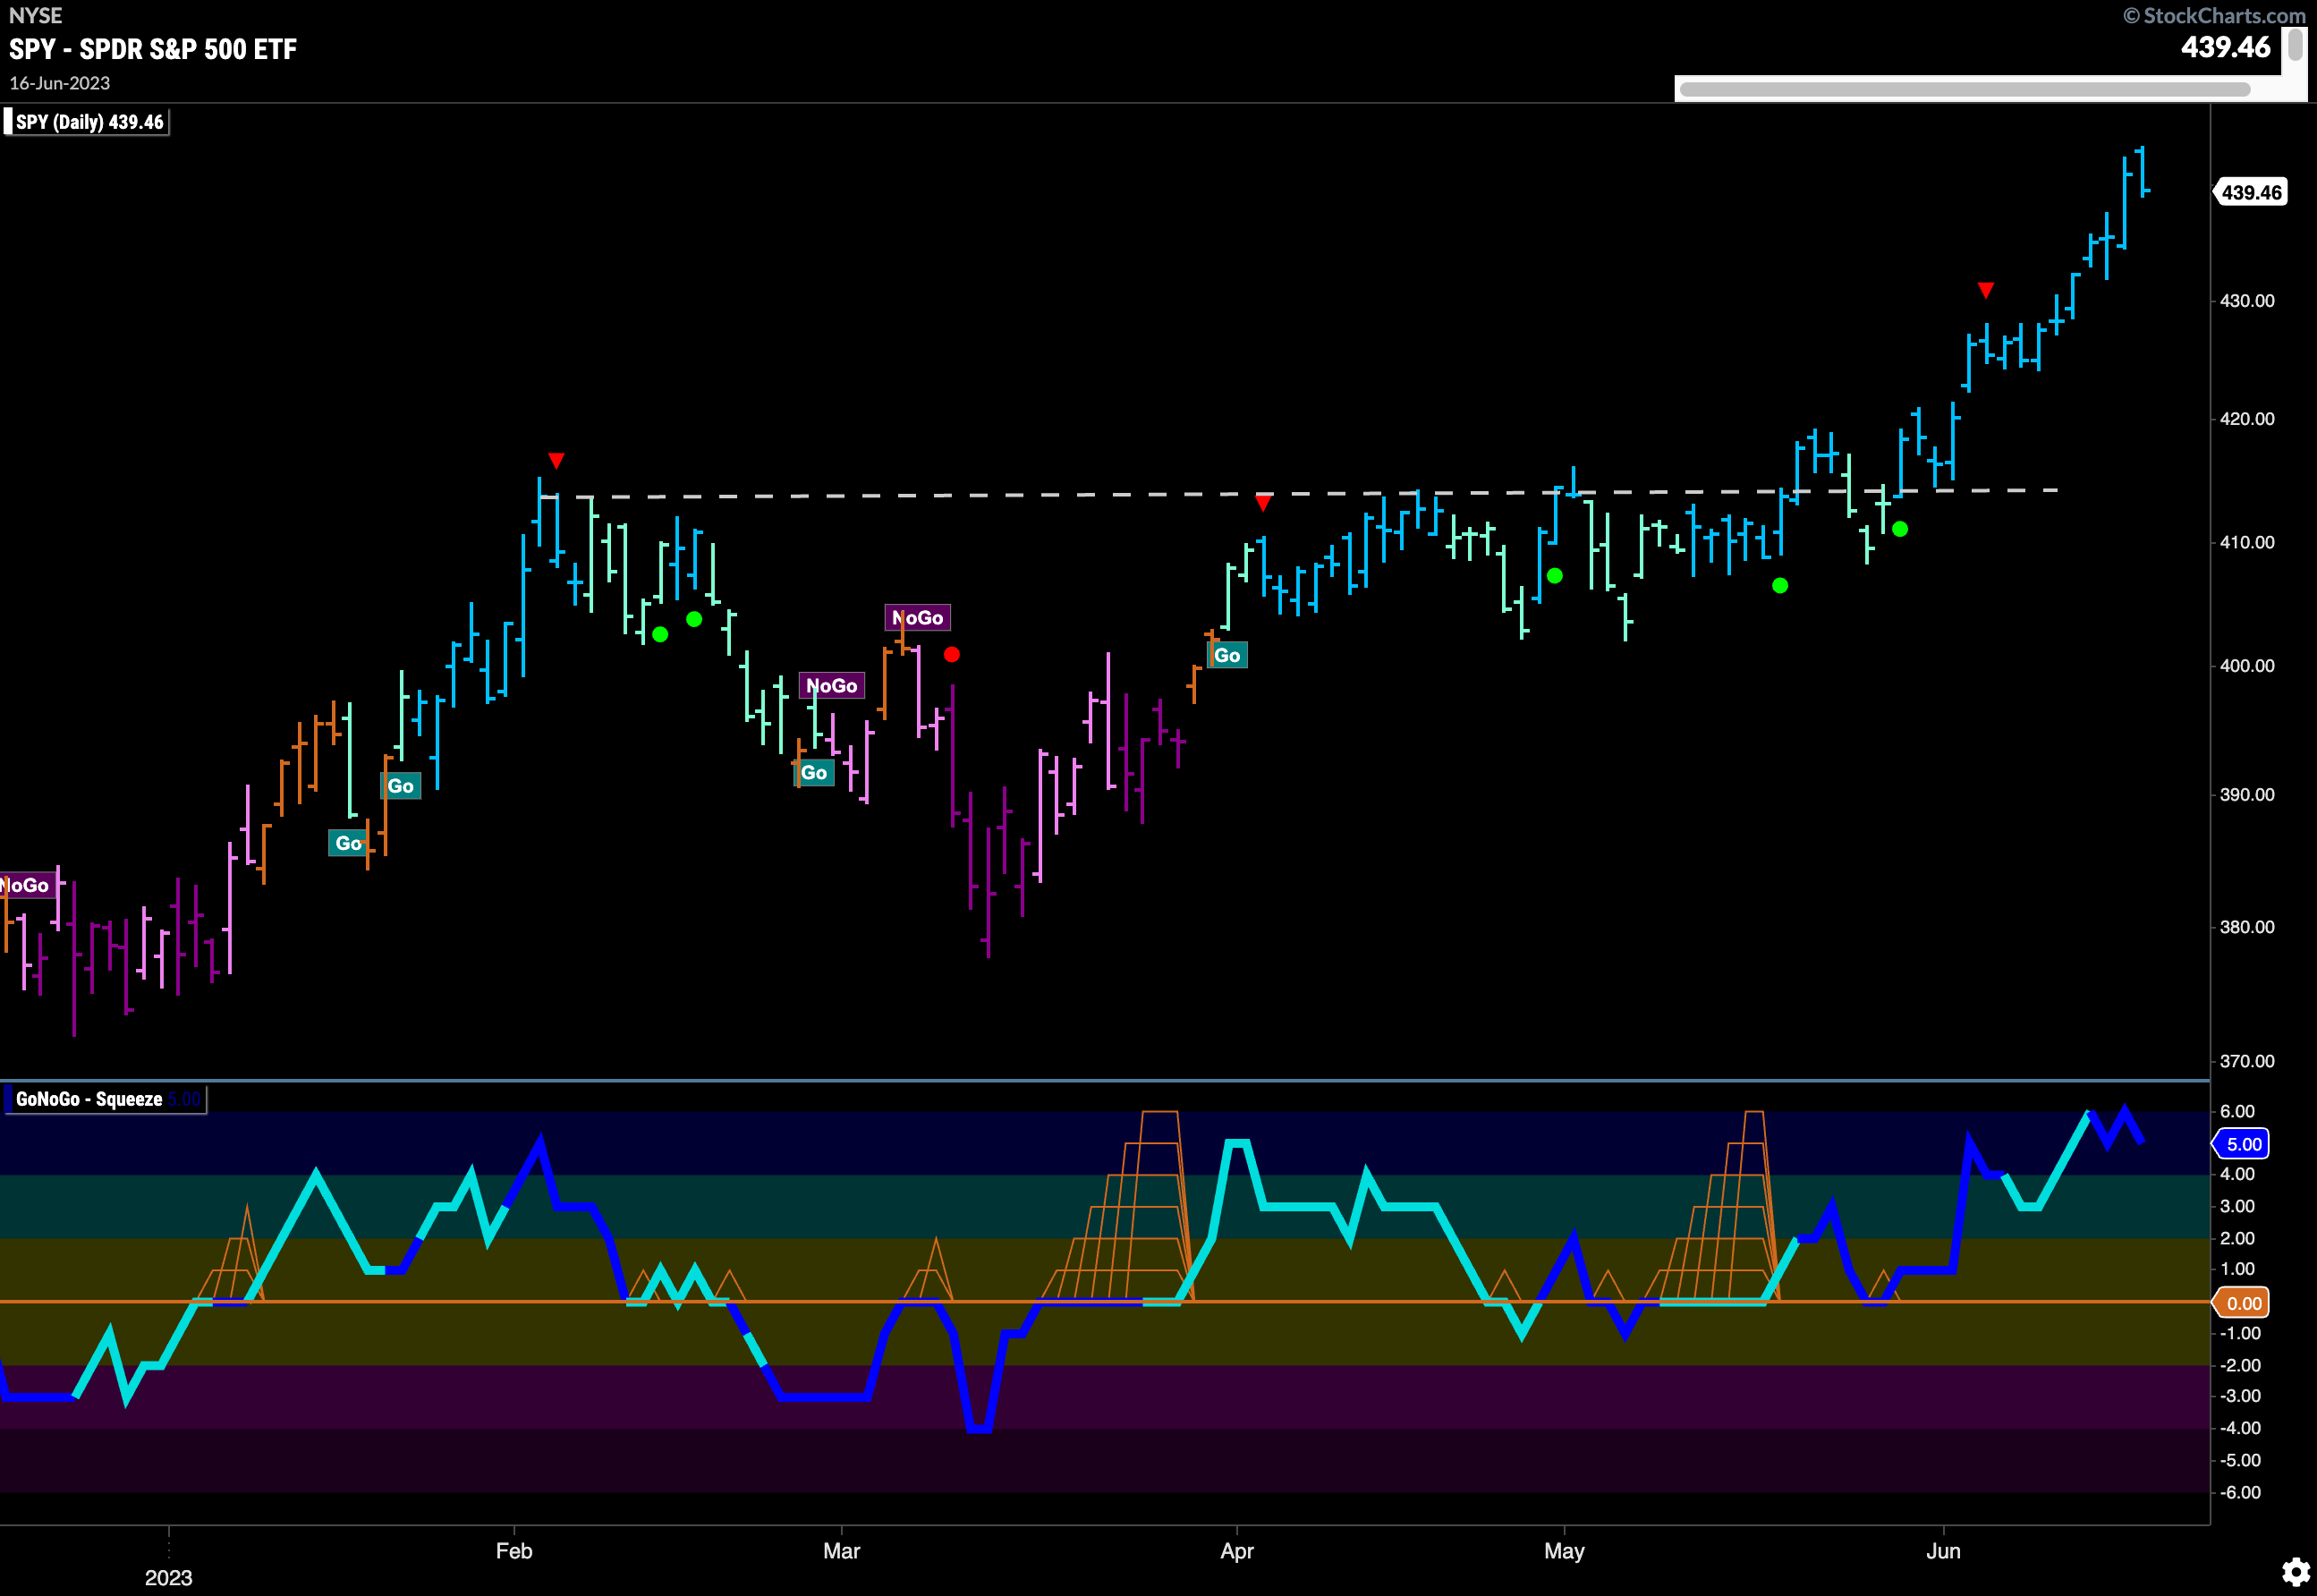
$SPY made consecutive gains last week as price closed higher for 5 sessions in a row at one point. We can see that we are clearly above the resistance from prior highs and GoNoGo Oscillator is now in overbought territory. Volume is once again heavy, telling us that there is plenty of market participation in this move higher.
The longer term weekly chart shows continued strength. Not only have we taken out the resistance from the February ’23 high but we can see on this chart how the August ’22 highs have been surpassed as well. Strong blue bars paint the “Go” trend and we are now looking at possible ultimate highs as the next target. GoNOGo Oscillator is moving into overbought territory on the weekly chart as well which shows enthusiasm. Volume is heavy. 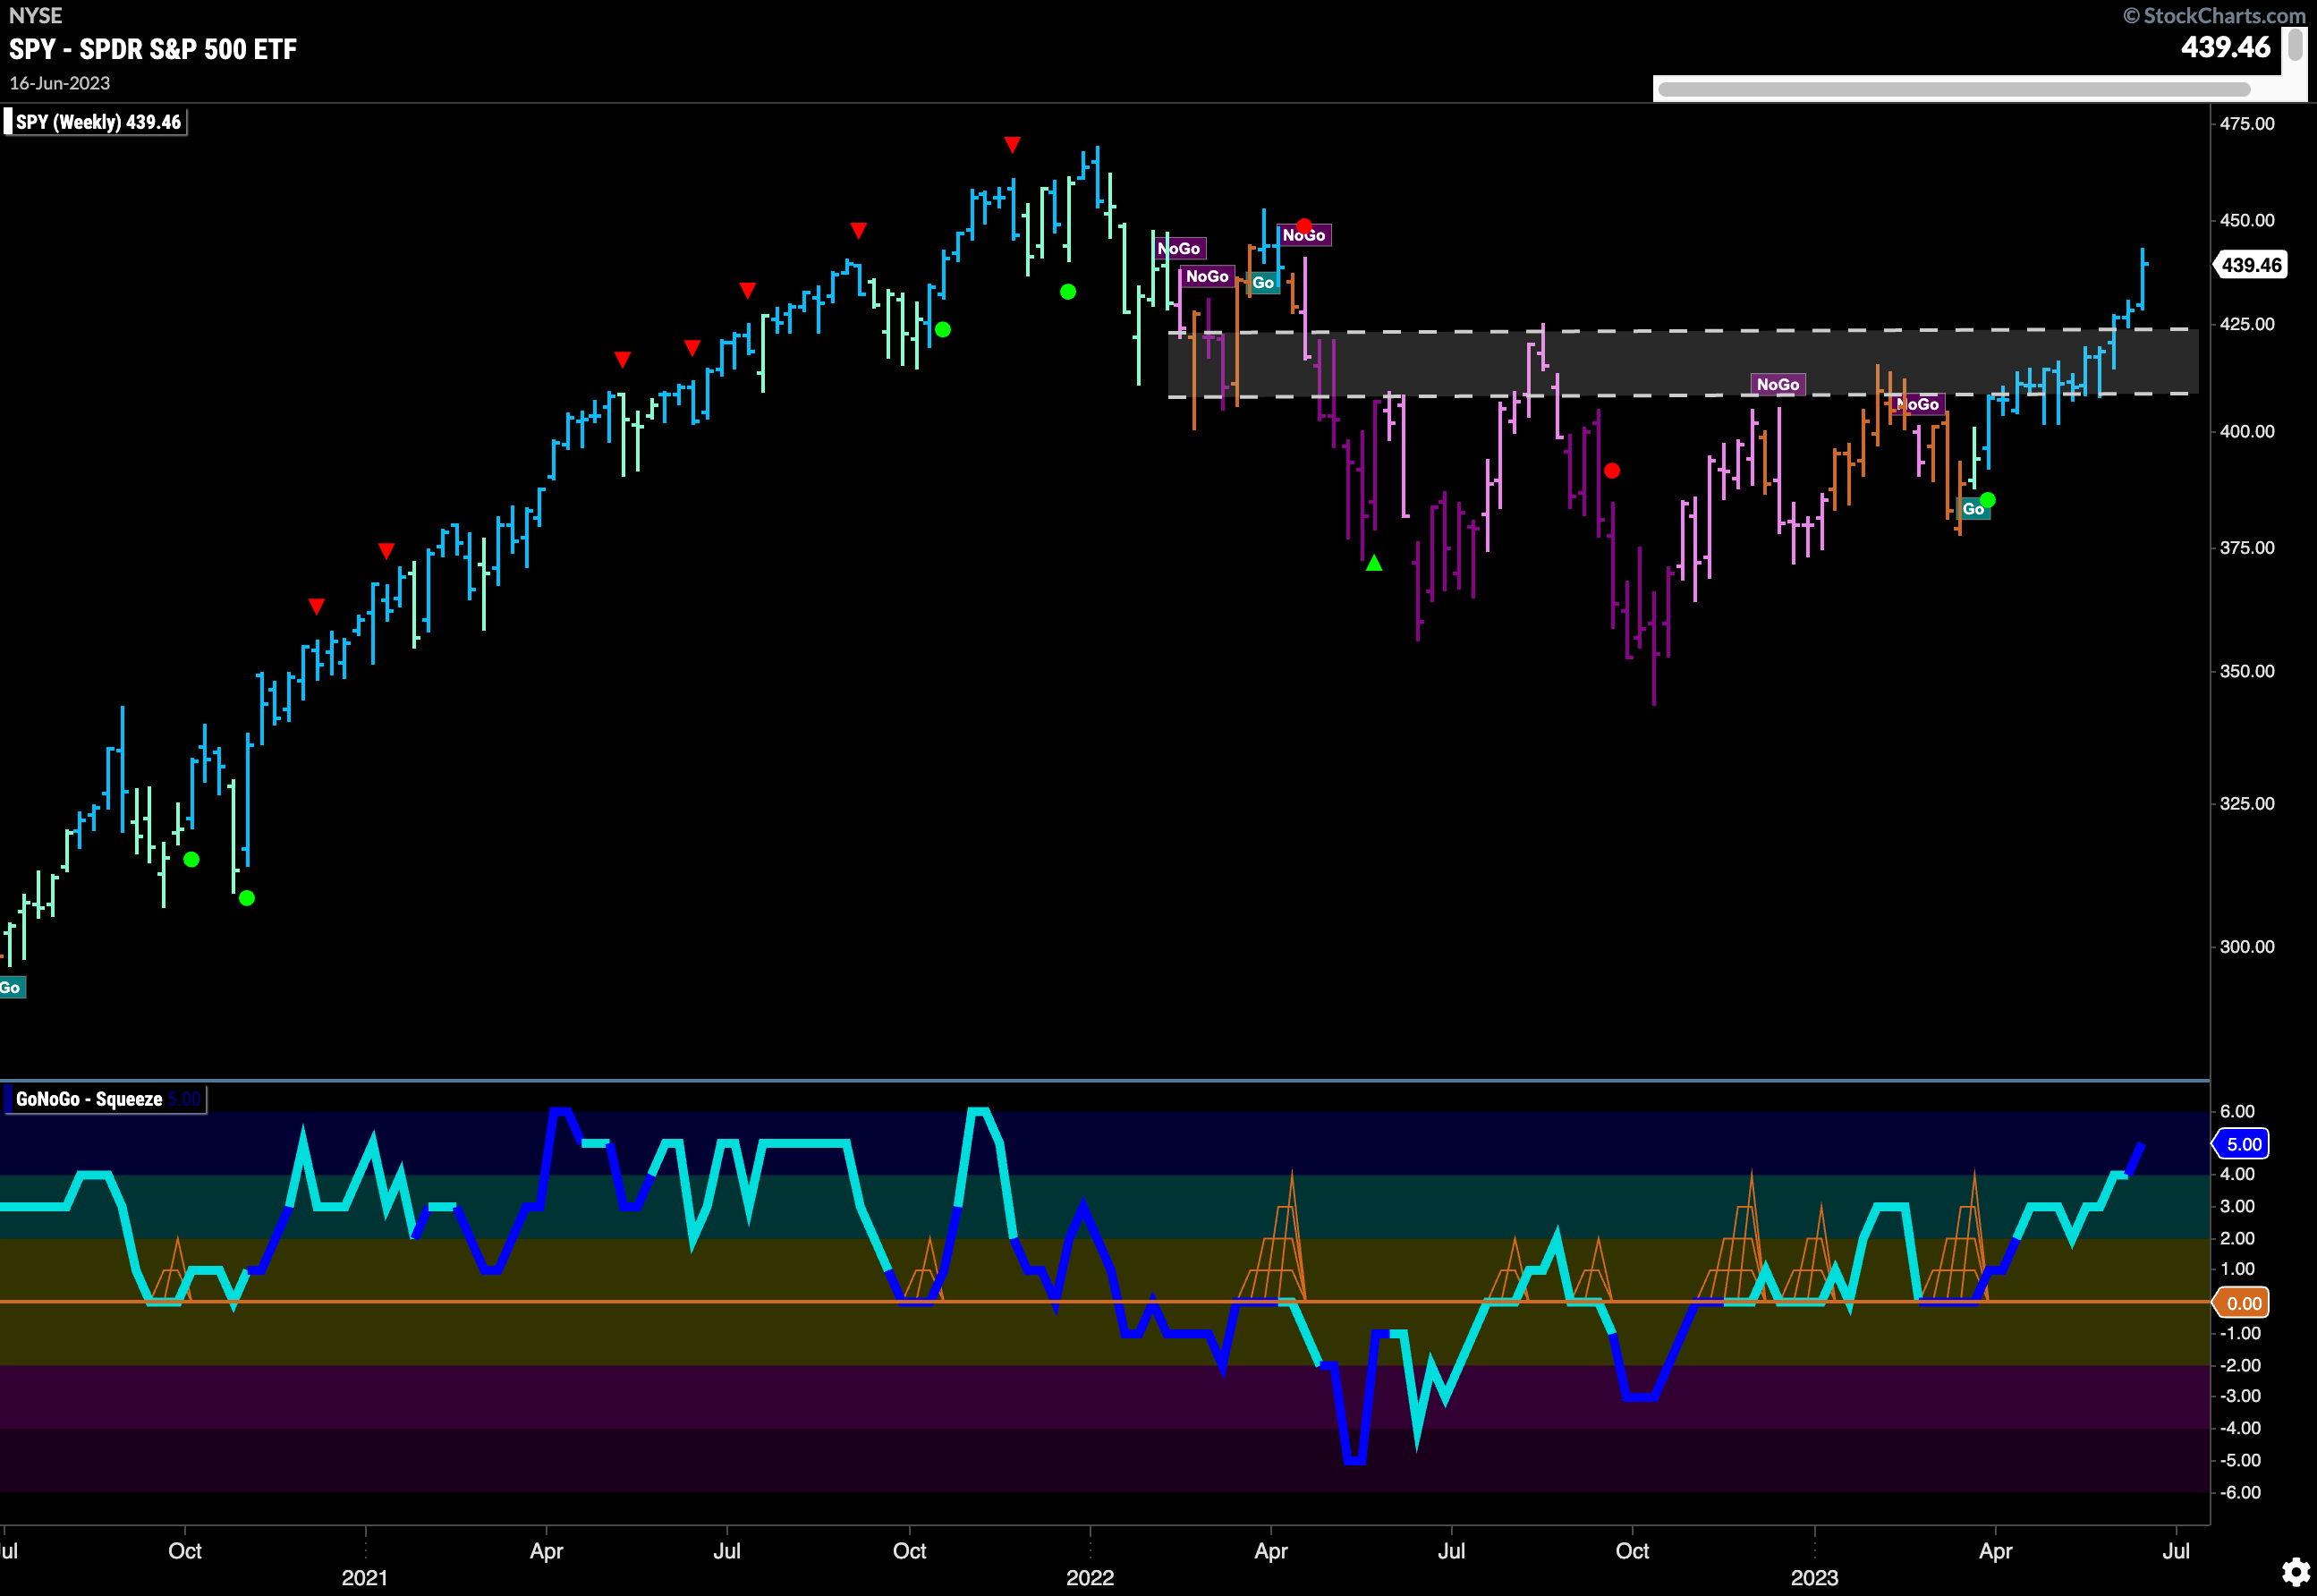
Treasury Prices Continue to Struggle With Resistance
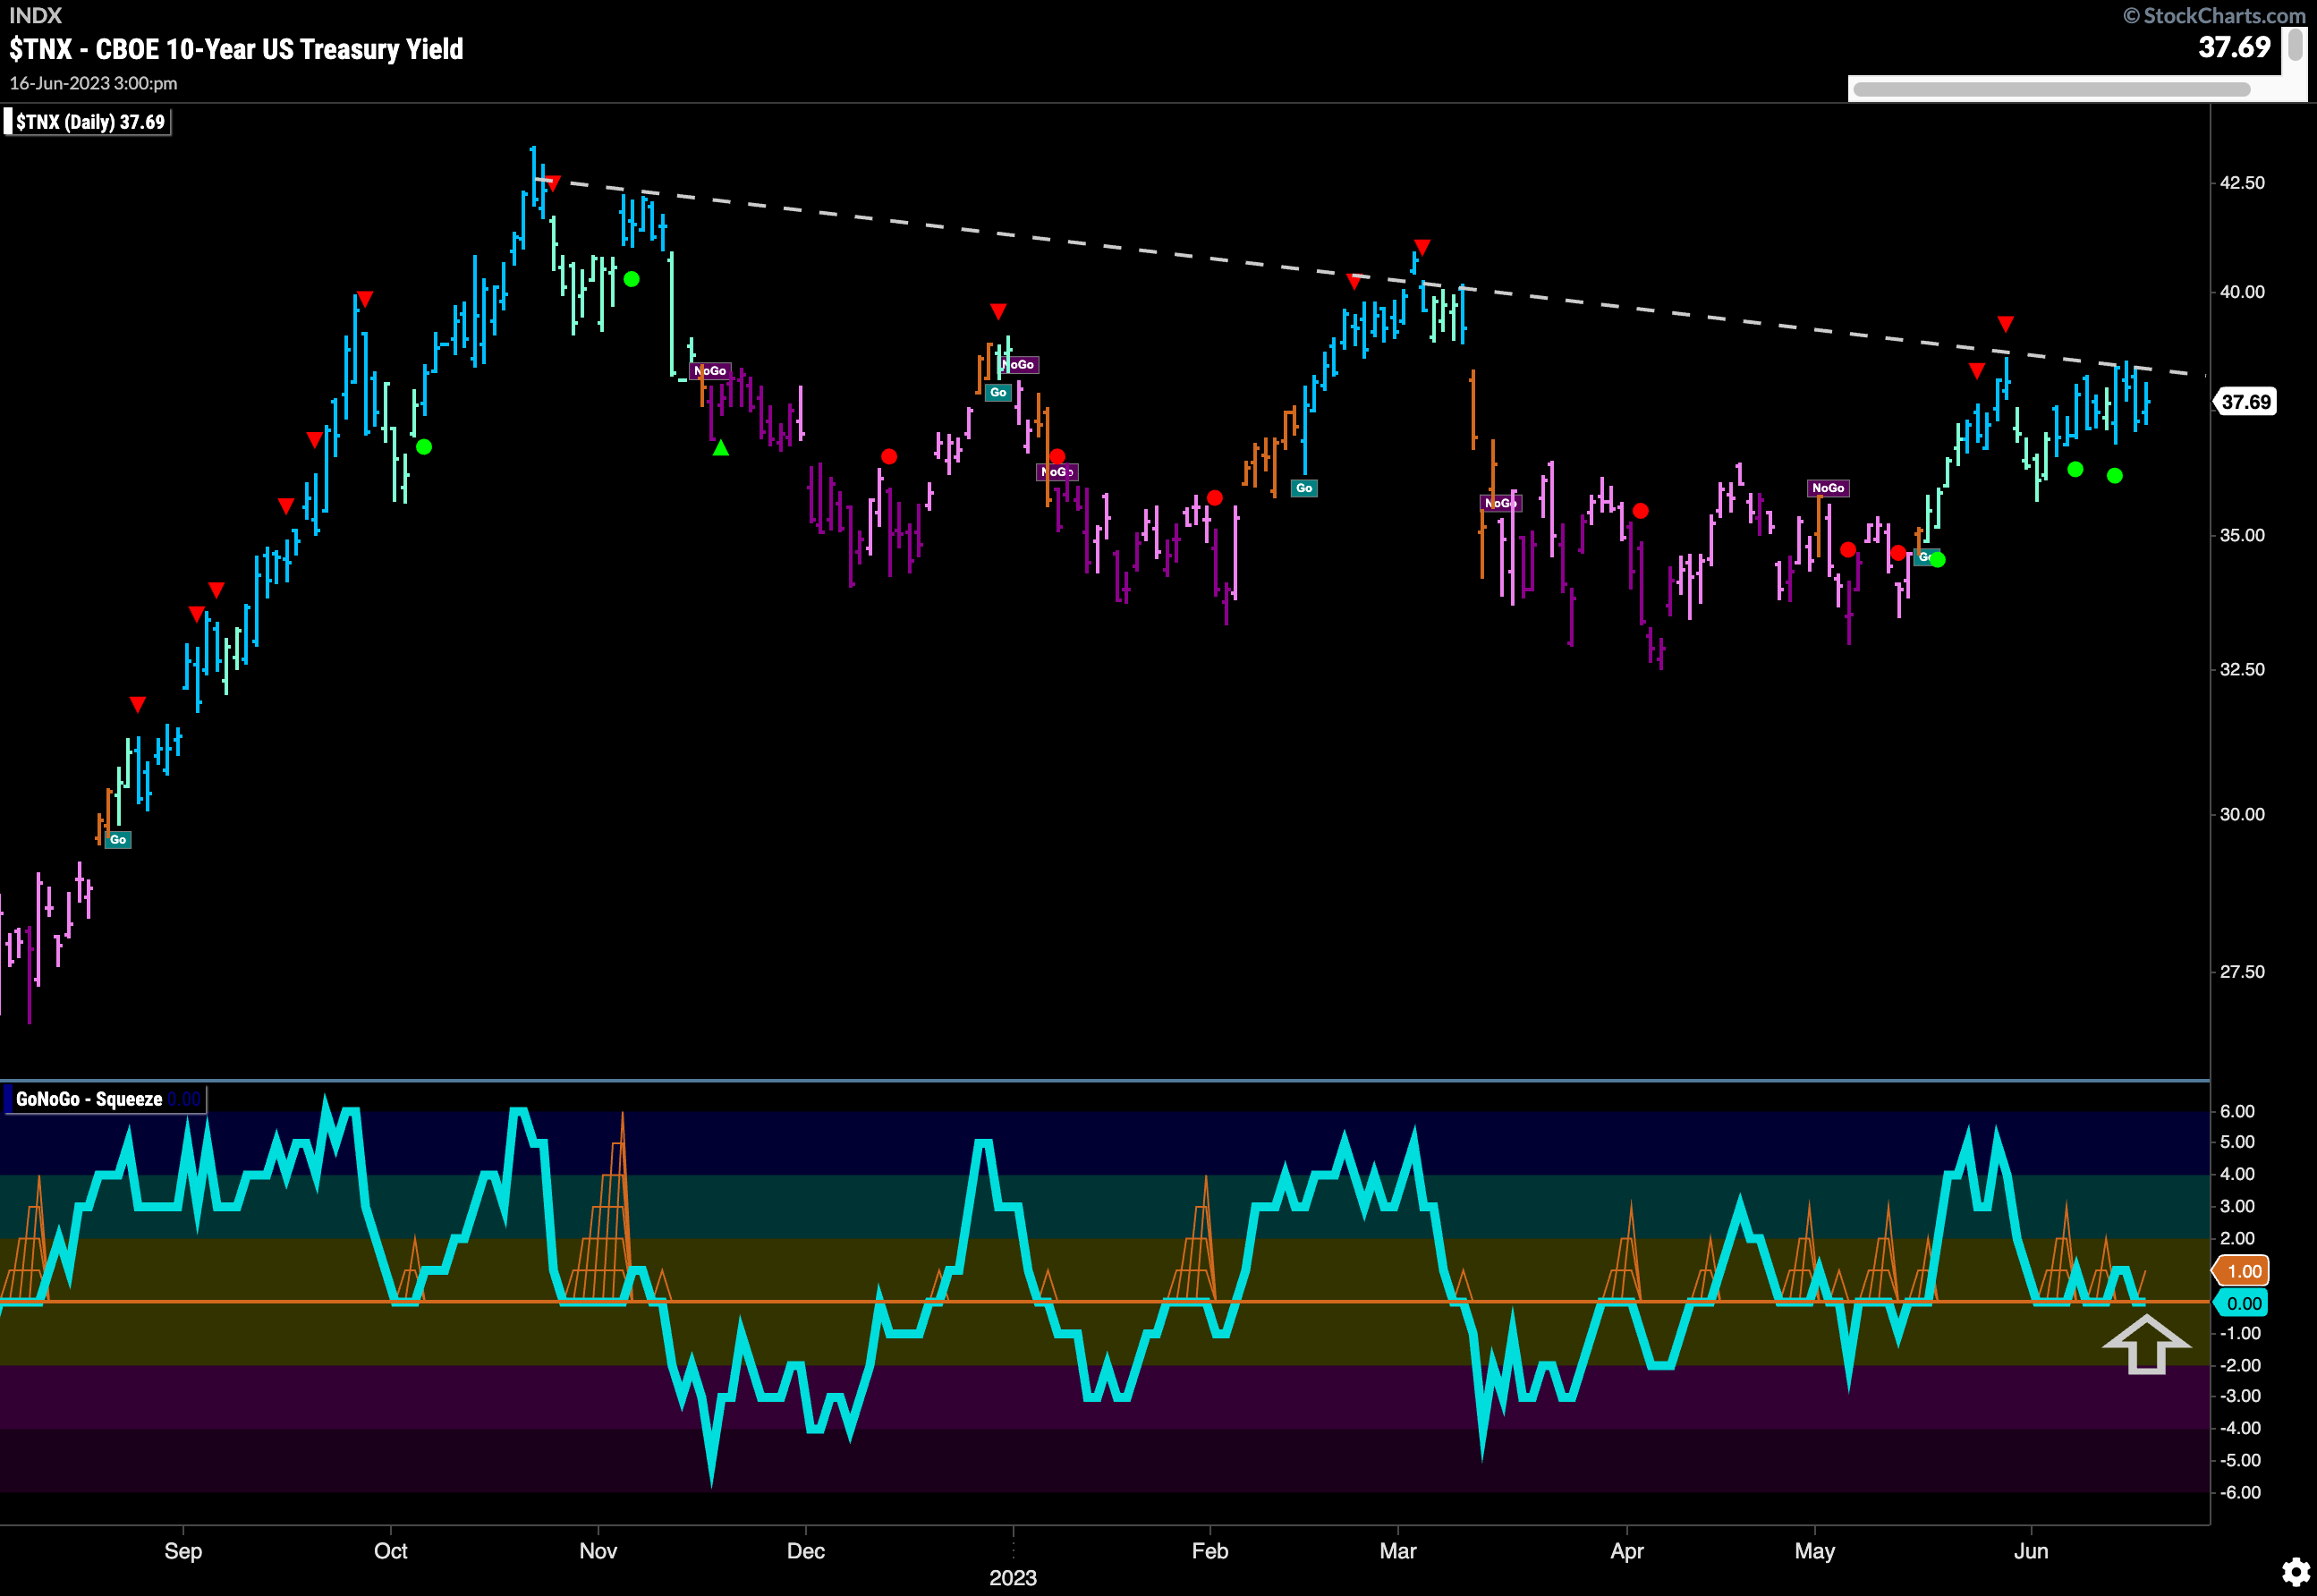
Much like last week, treasury prices remain in the “Go” trend painting several strong blue bars this week. However, also like last week, we can see that price is finding it hard to deal with the overhead resistance we see on the chart from the downward sloping trend line. GoNoGo Oscillator is also back quickly to test the zero line from above again, so we will watch to see if it finds support at this level or if it fails.
Dollar Found No Support
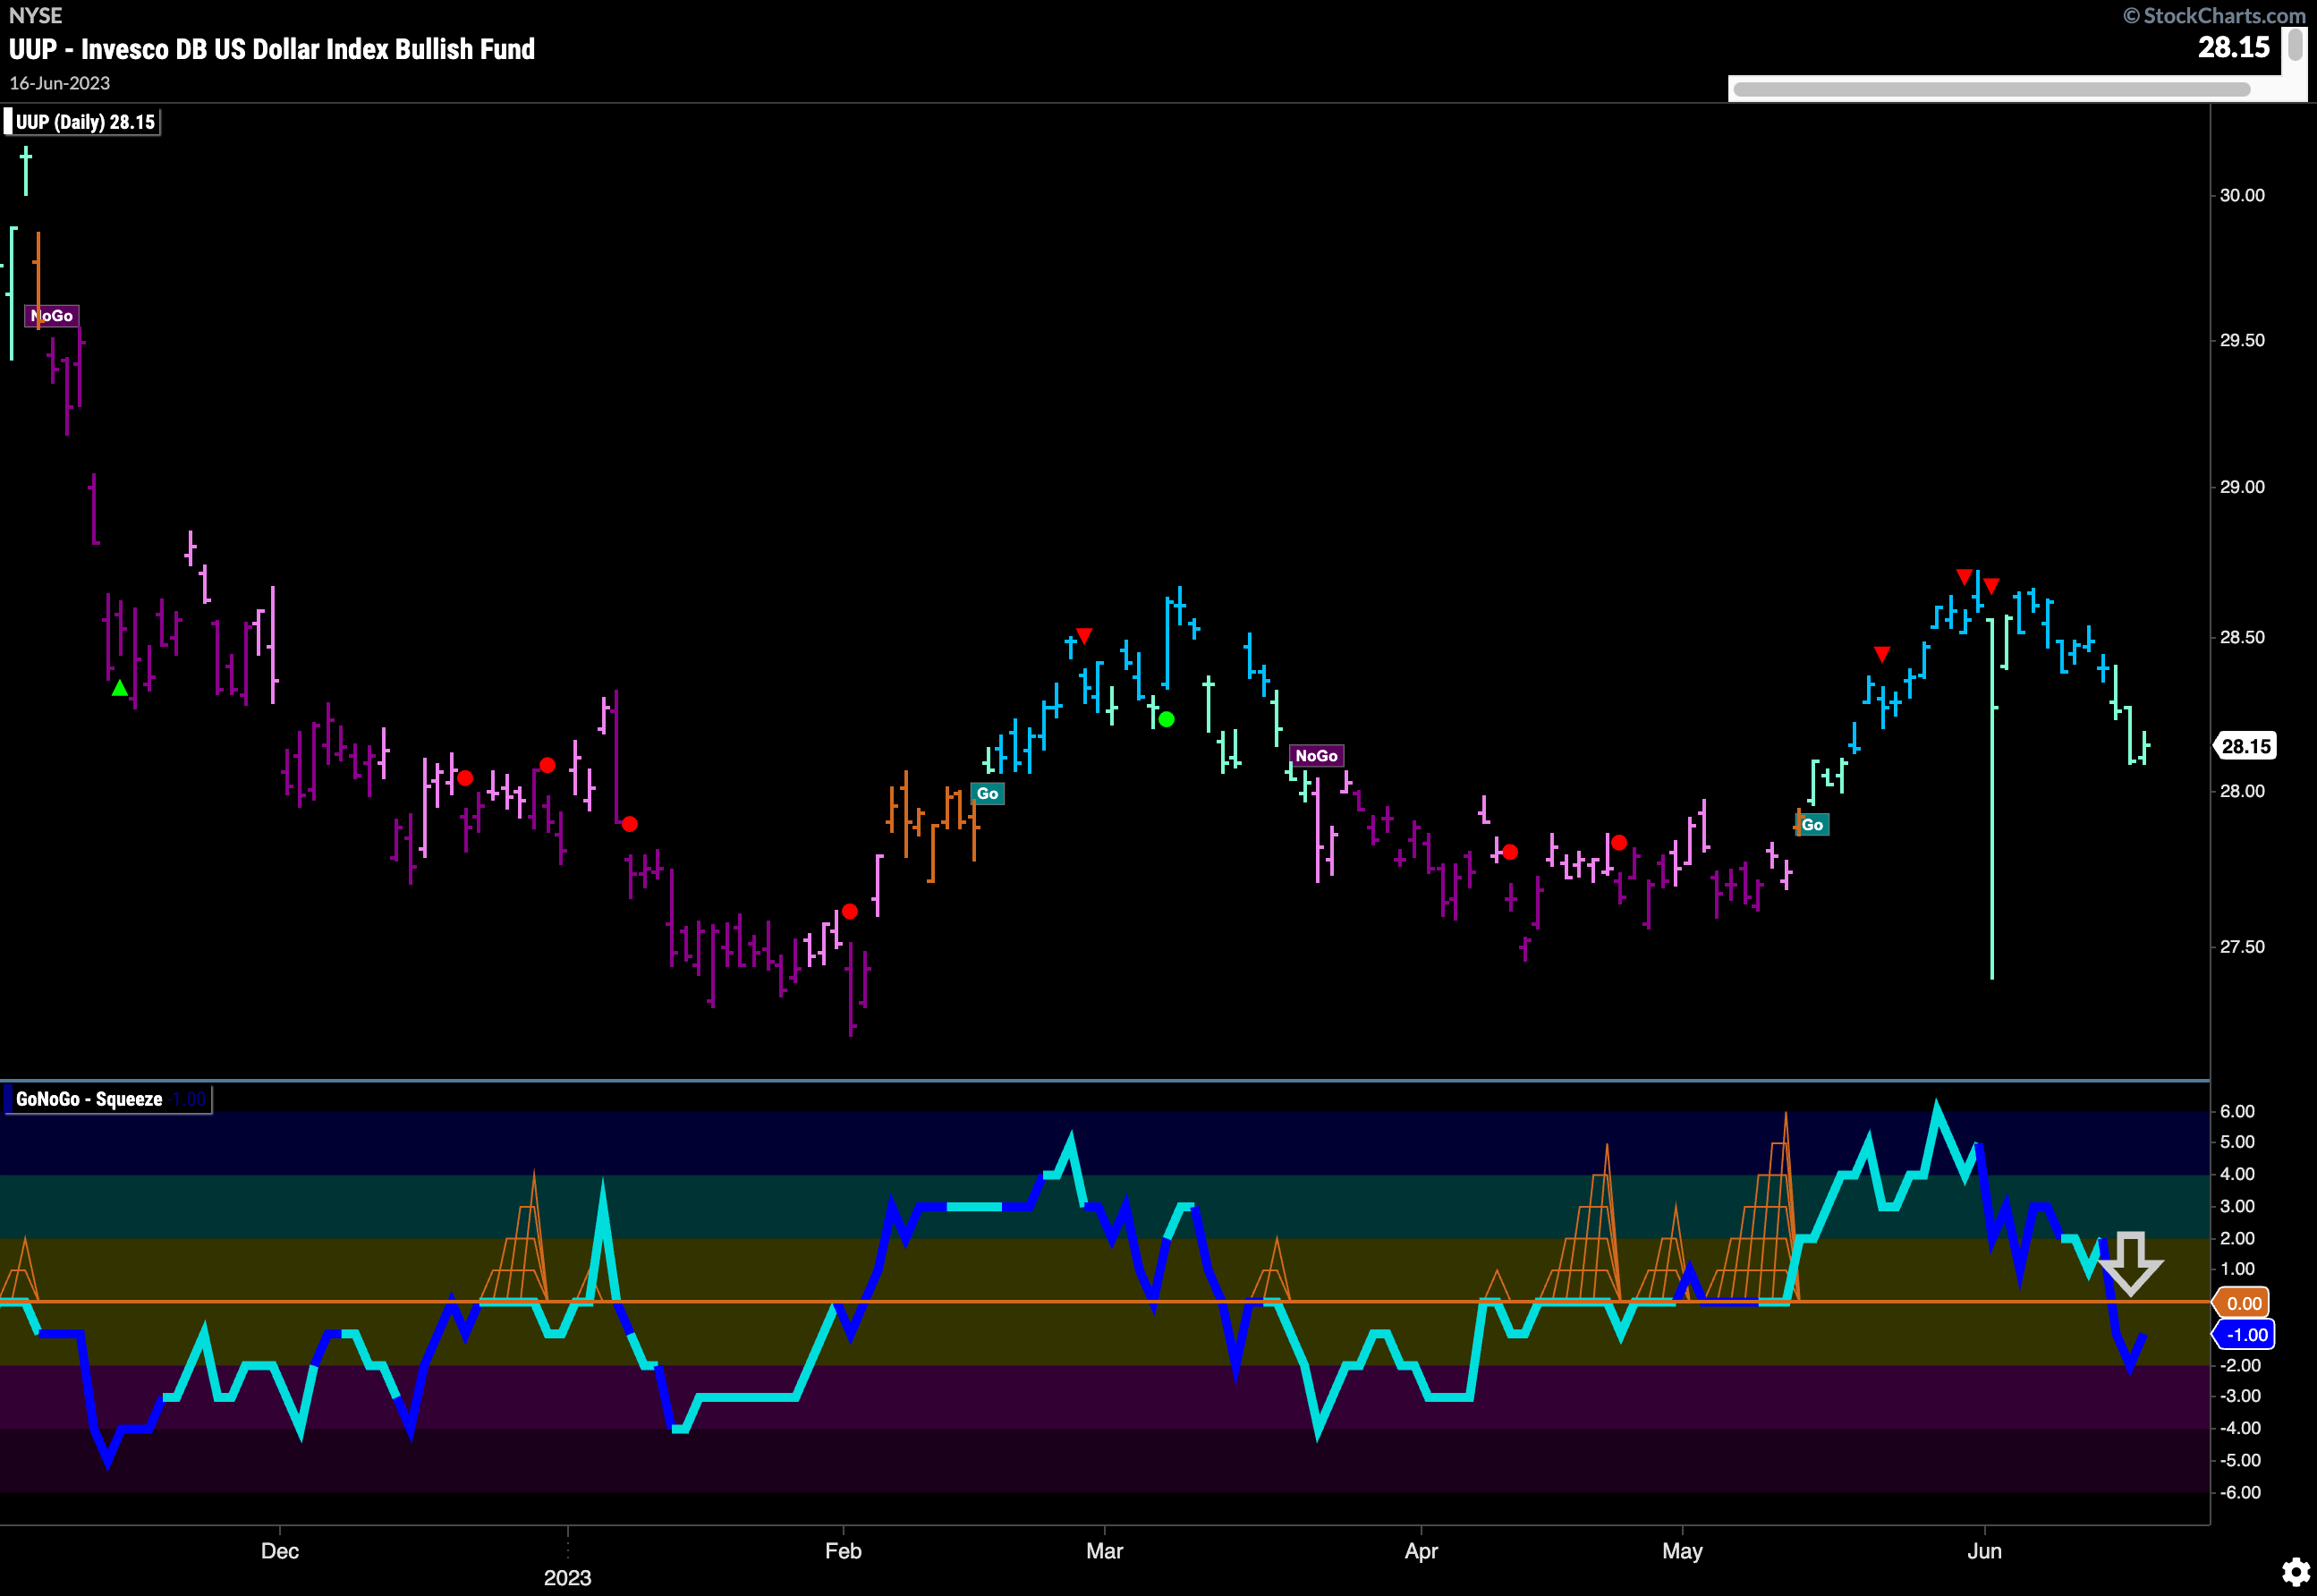
We can see that the support we were looking for on the dollar did not materialize. GoNoGo Oscillator fell through the zero line on heavy volume without even taking a pause. This does not bode well for price which for now (using the $UUP ticker), is holding on to its “Go” trend painting weaker aqua bars.
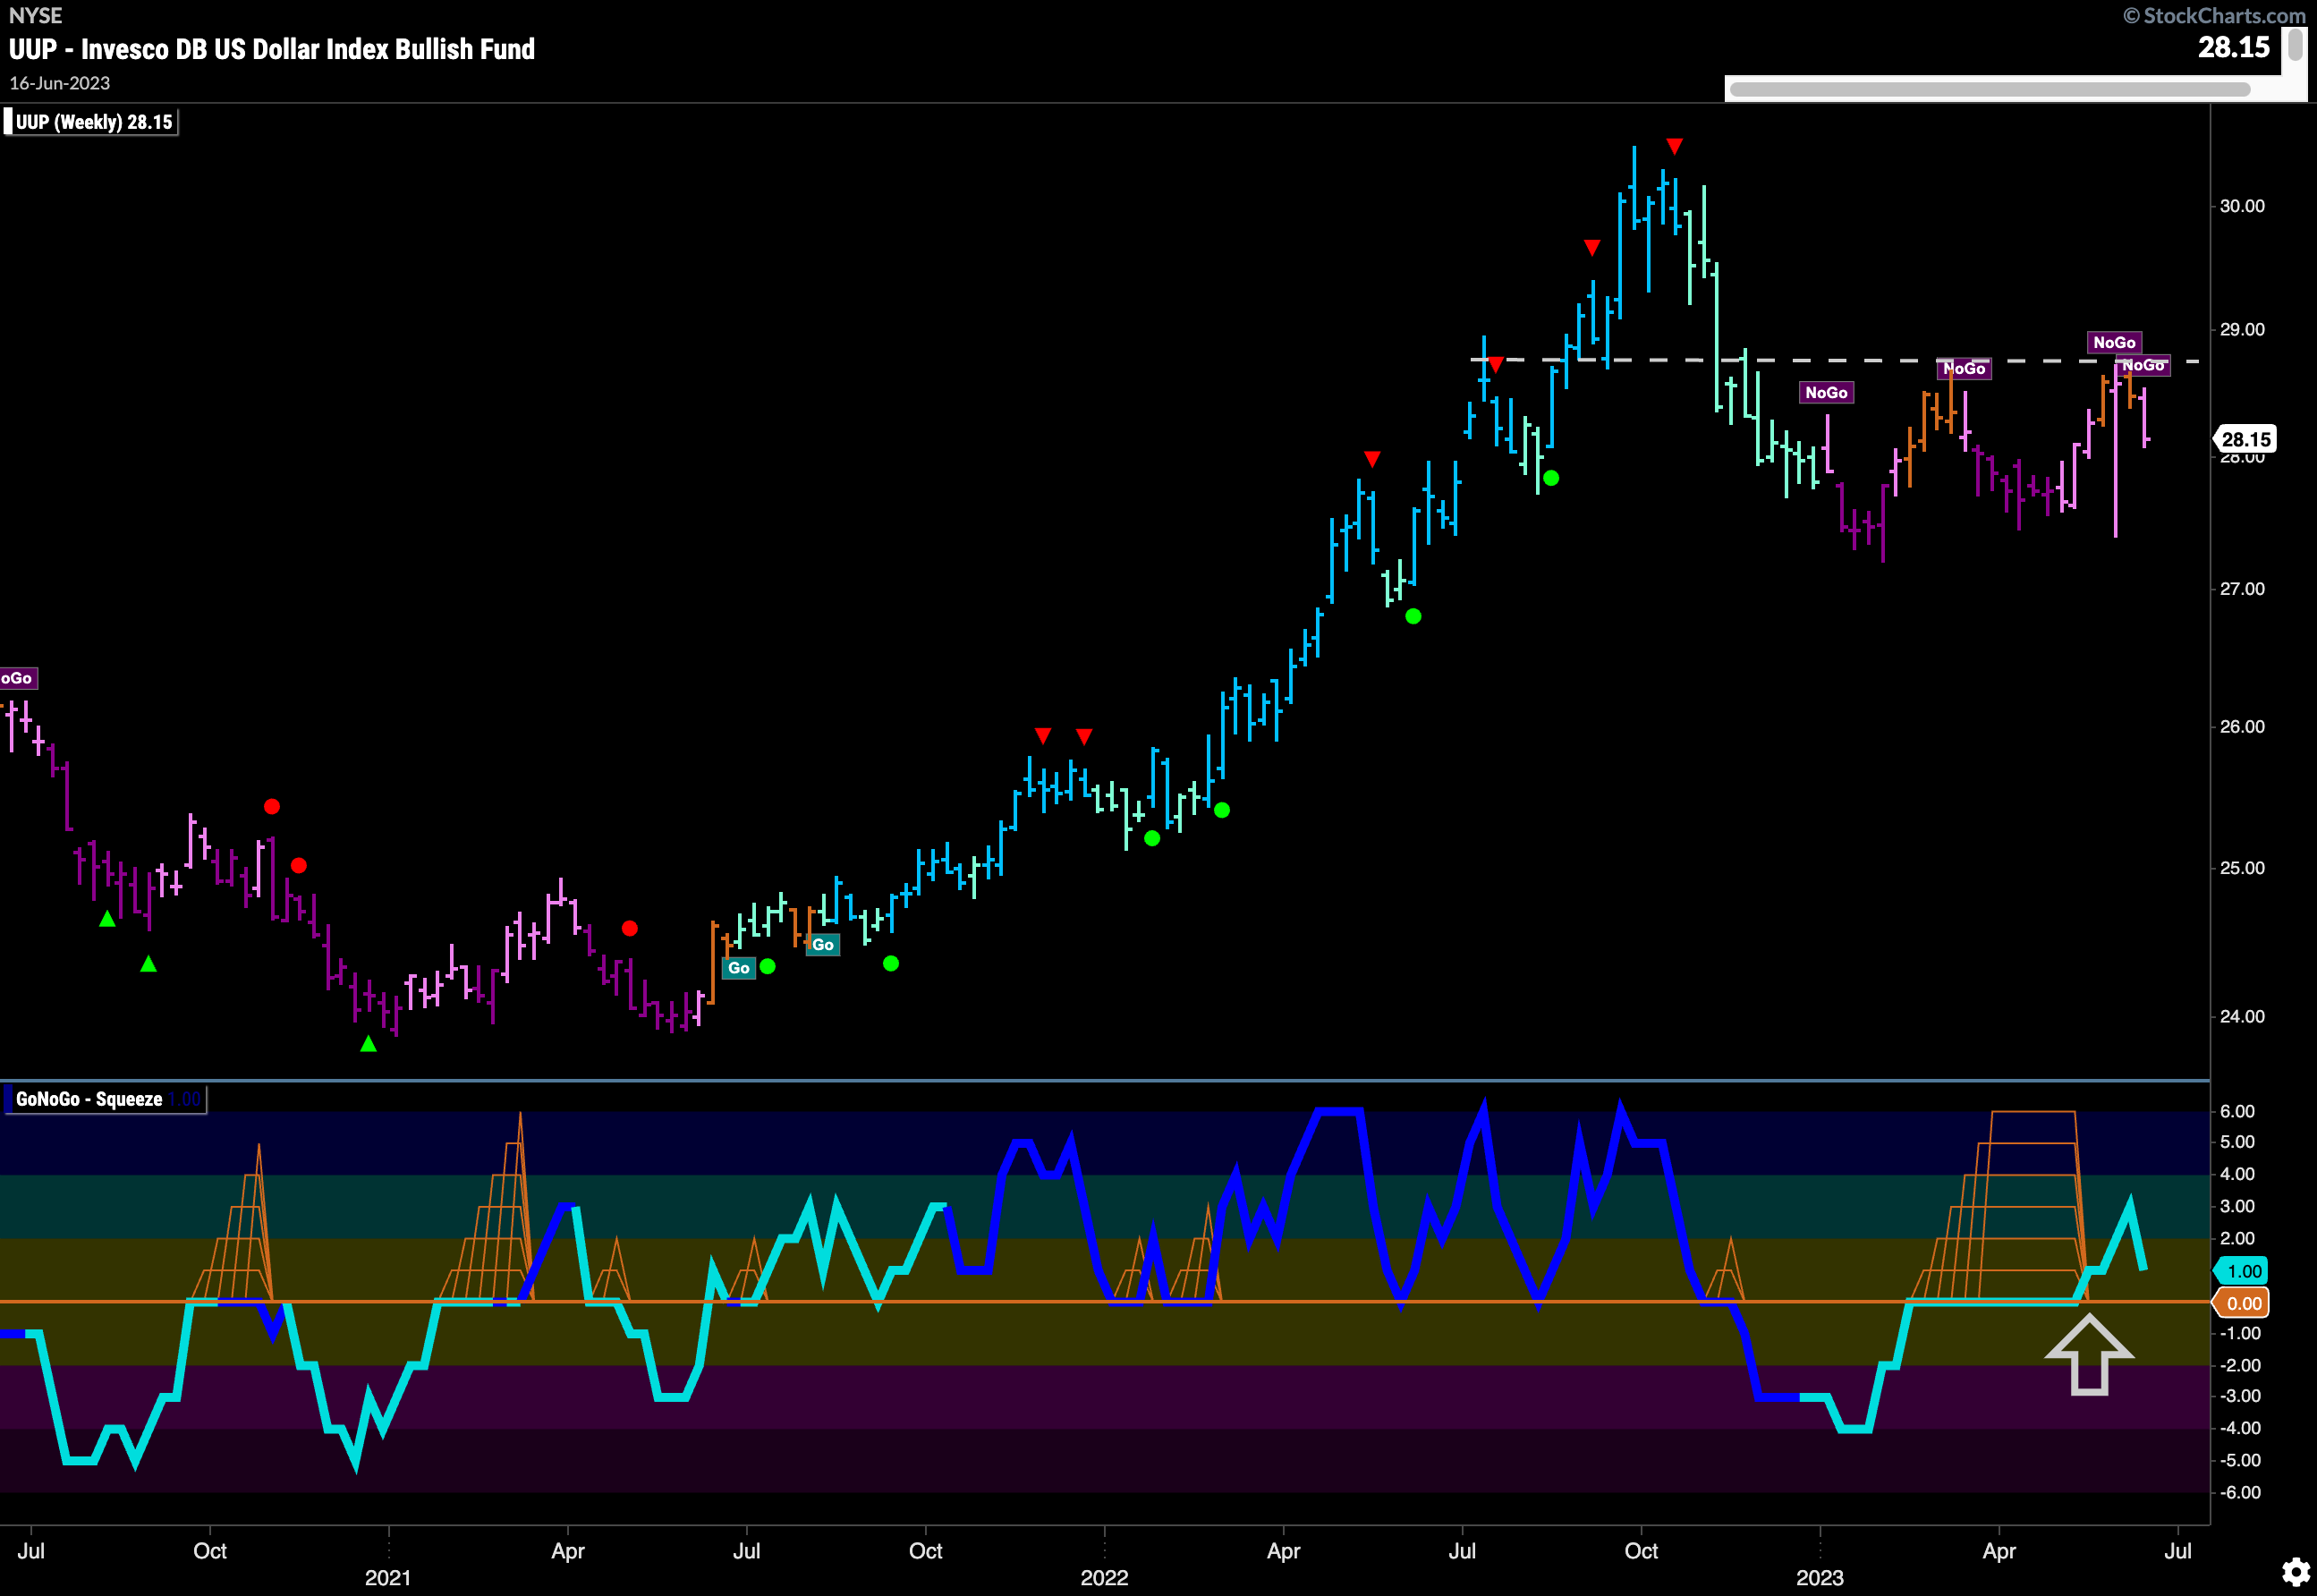
The longer term chart shows clearly the resistance that the dollar is struggling with and where it is coming from. For now, GoNoGo Trend therefore is telling us that the dollar remains in a “NoGo” trend as it paints another pink bar last week. GoNoGo Oscillator however is in positive territory after breaking out of a Max GoNoGo Squeeze into positive territory. Price will need all the positive momentum it can get if it is to mount another attack on the overhead resistance.
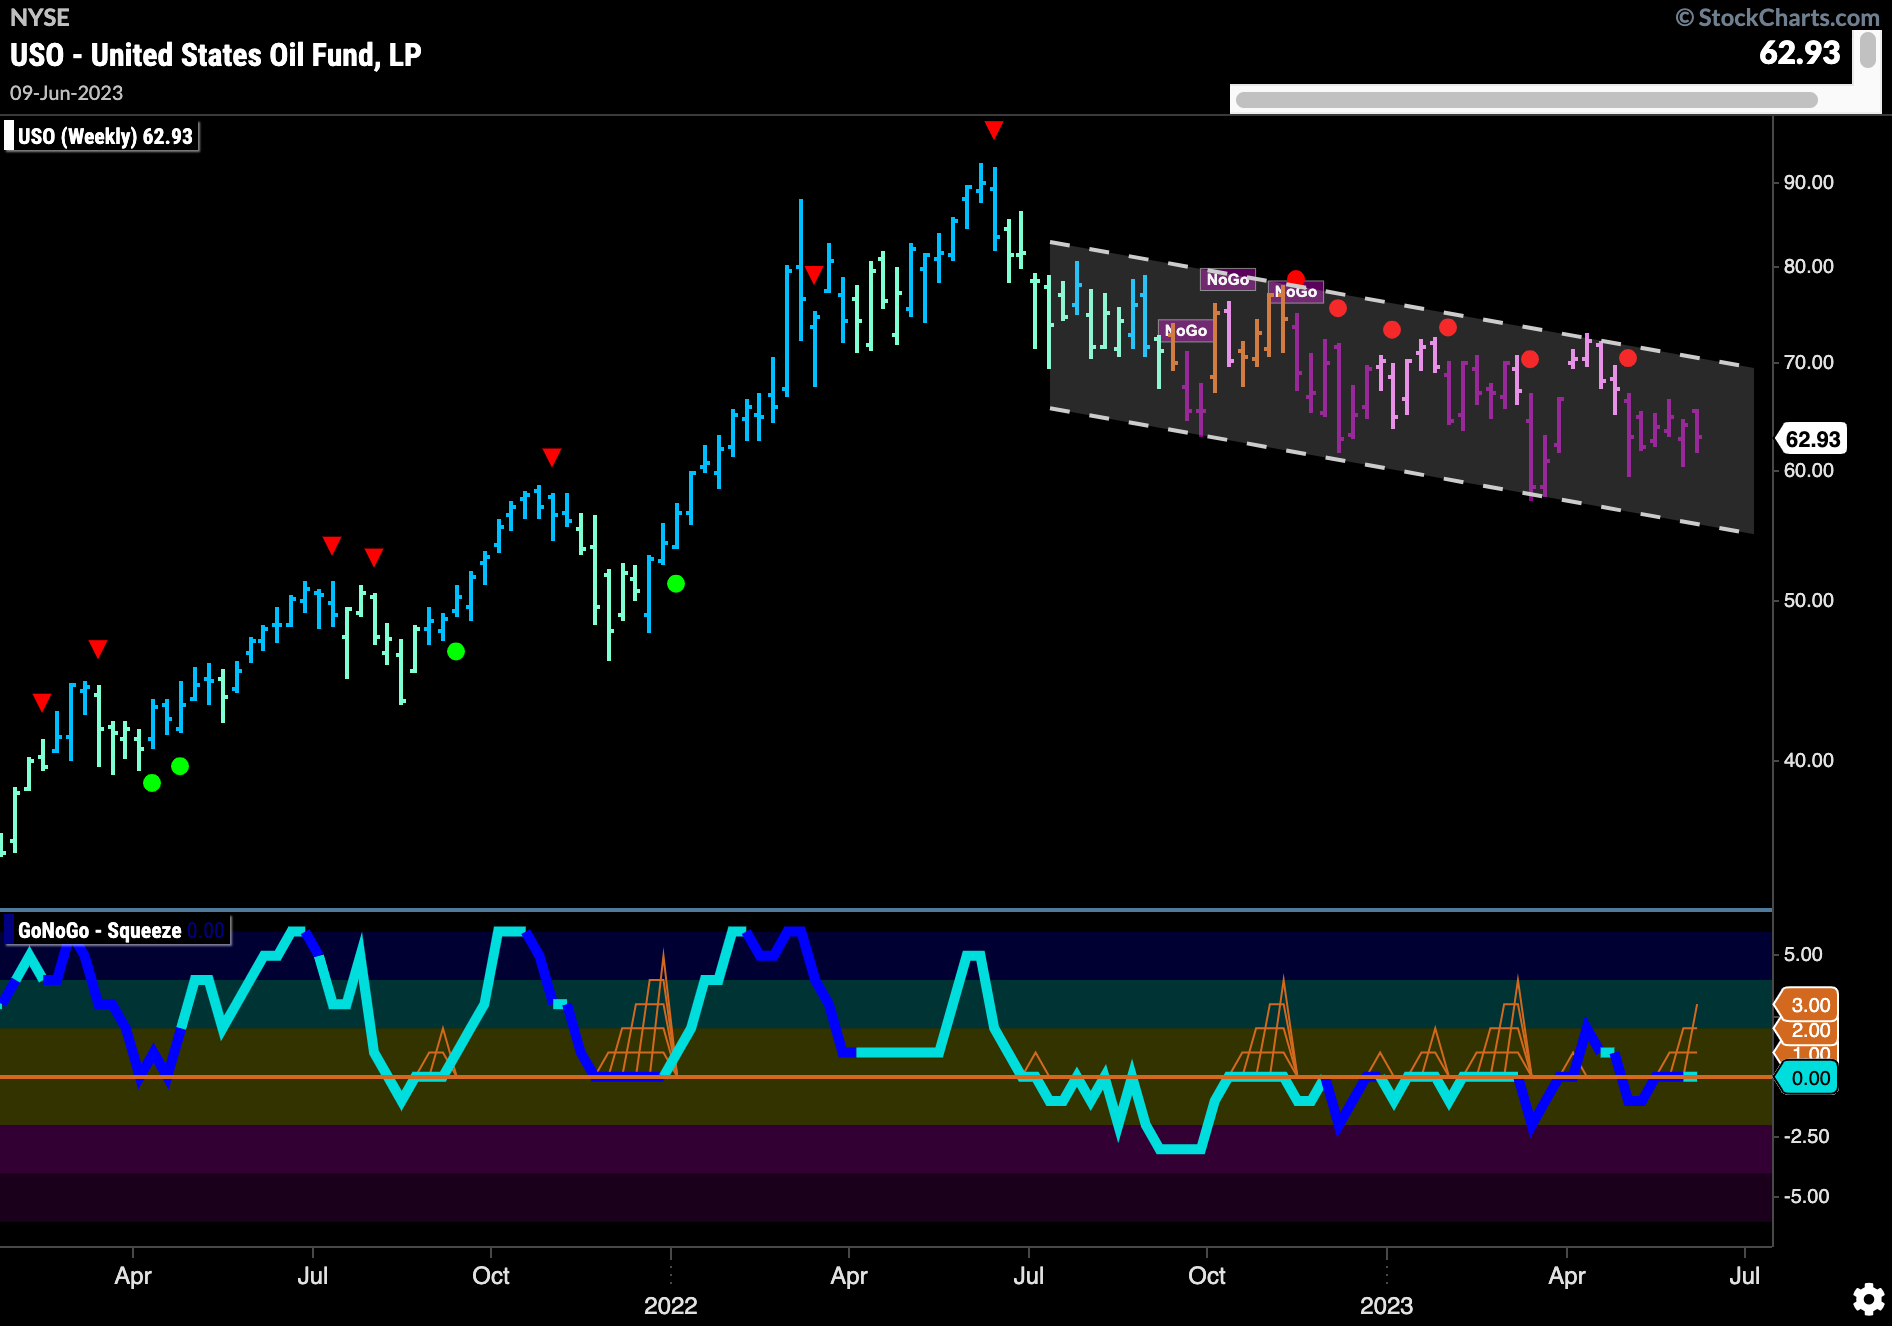
Oil Does Nothing Still
The trend is a “NoGo” as price remains stagnant in the middle of the downward sloping trend channel. GoNoGo Oscillator is back riding the zero line once more as it proves there is little directional momentum to pull price higher or lower. We will watch to see in which direction the oscillator moves next to give us a clue as to whether price will test the upper or lower bound of the channel.
Gold Prices Meandering Lower
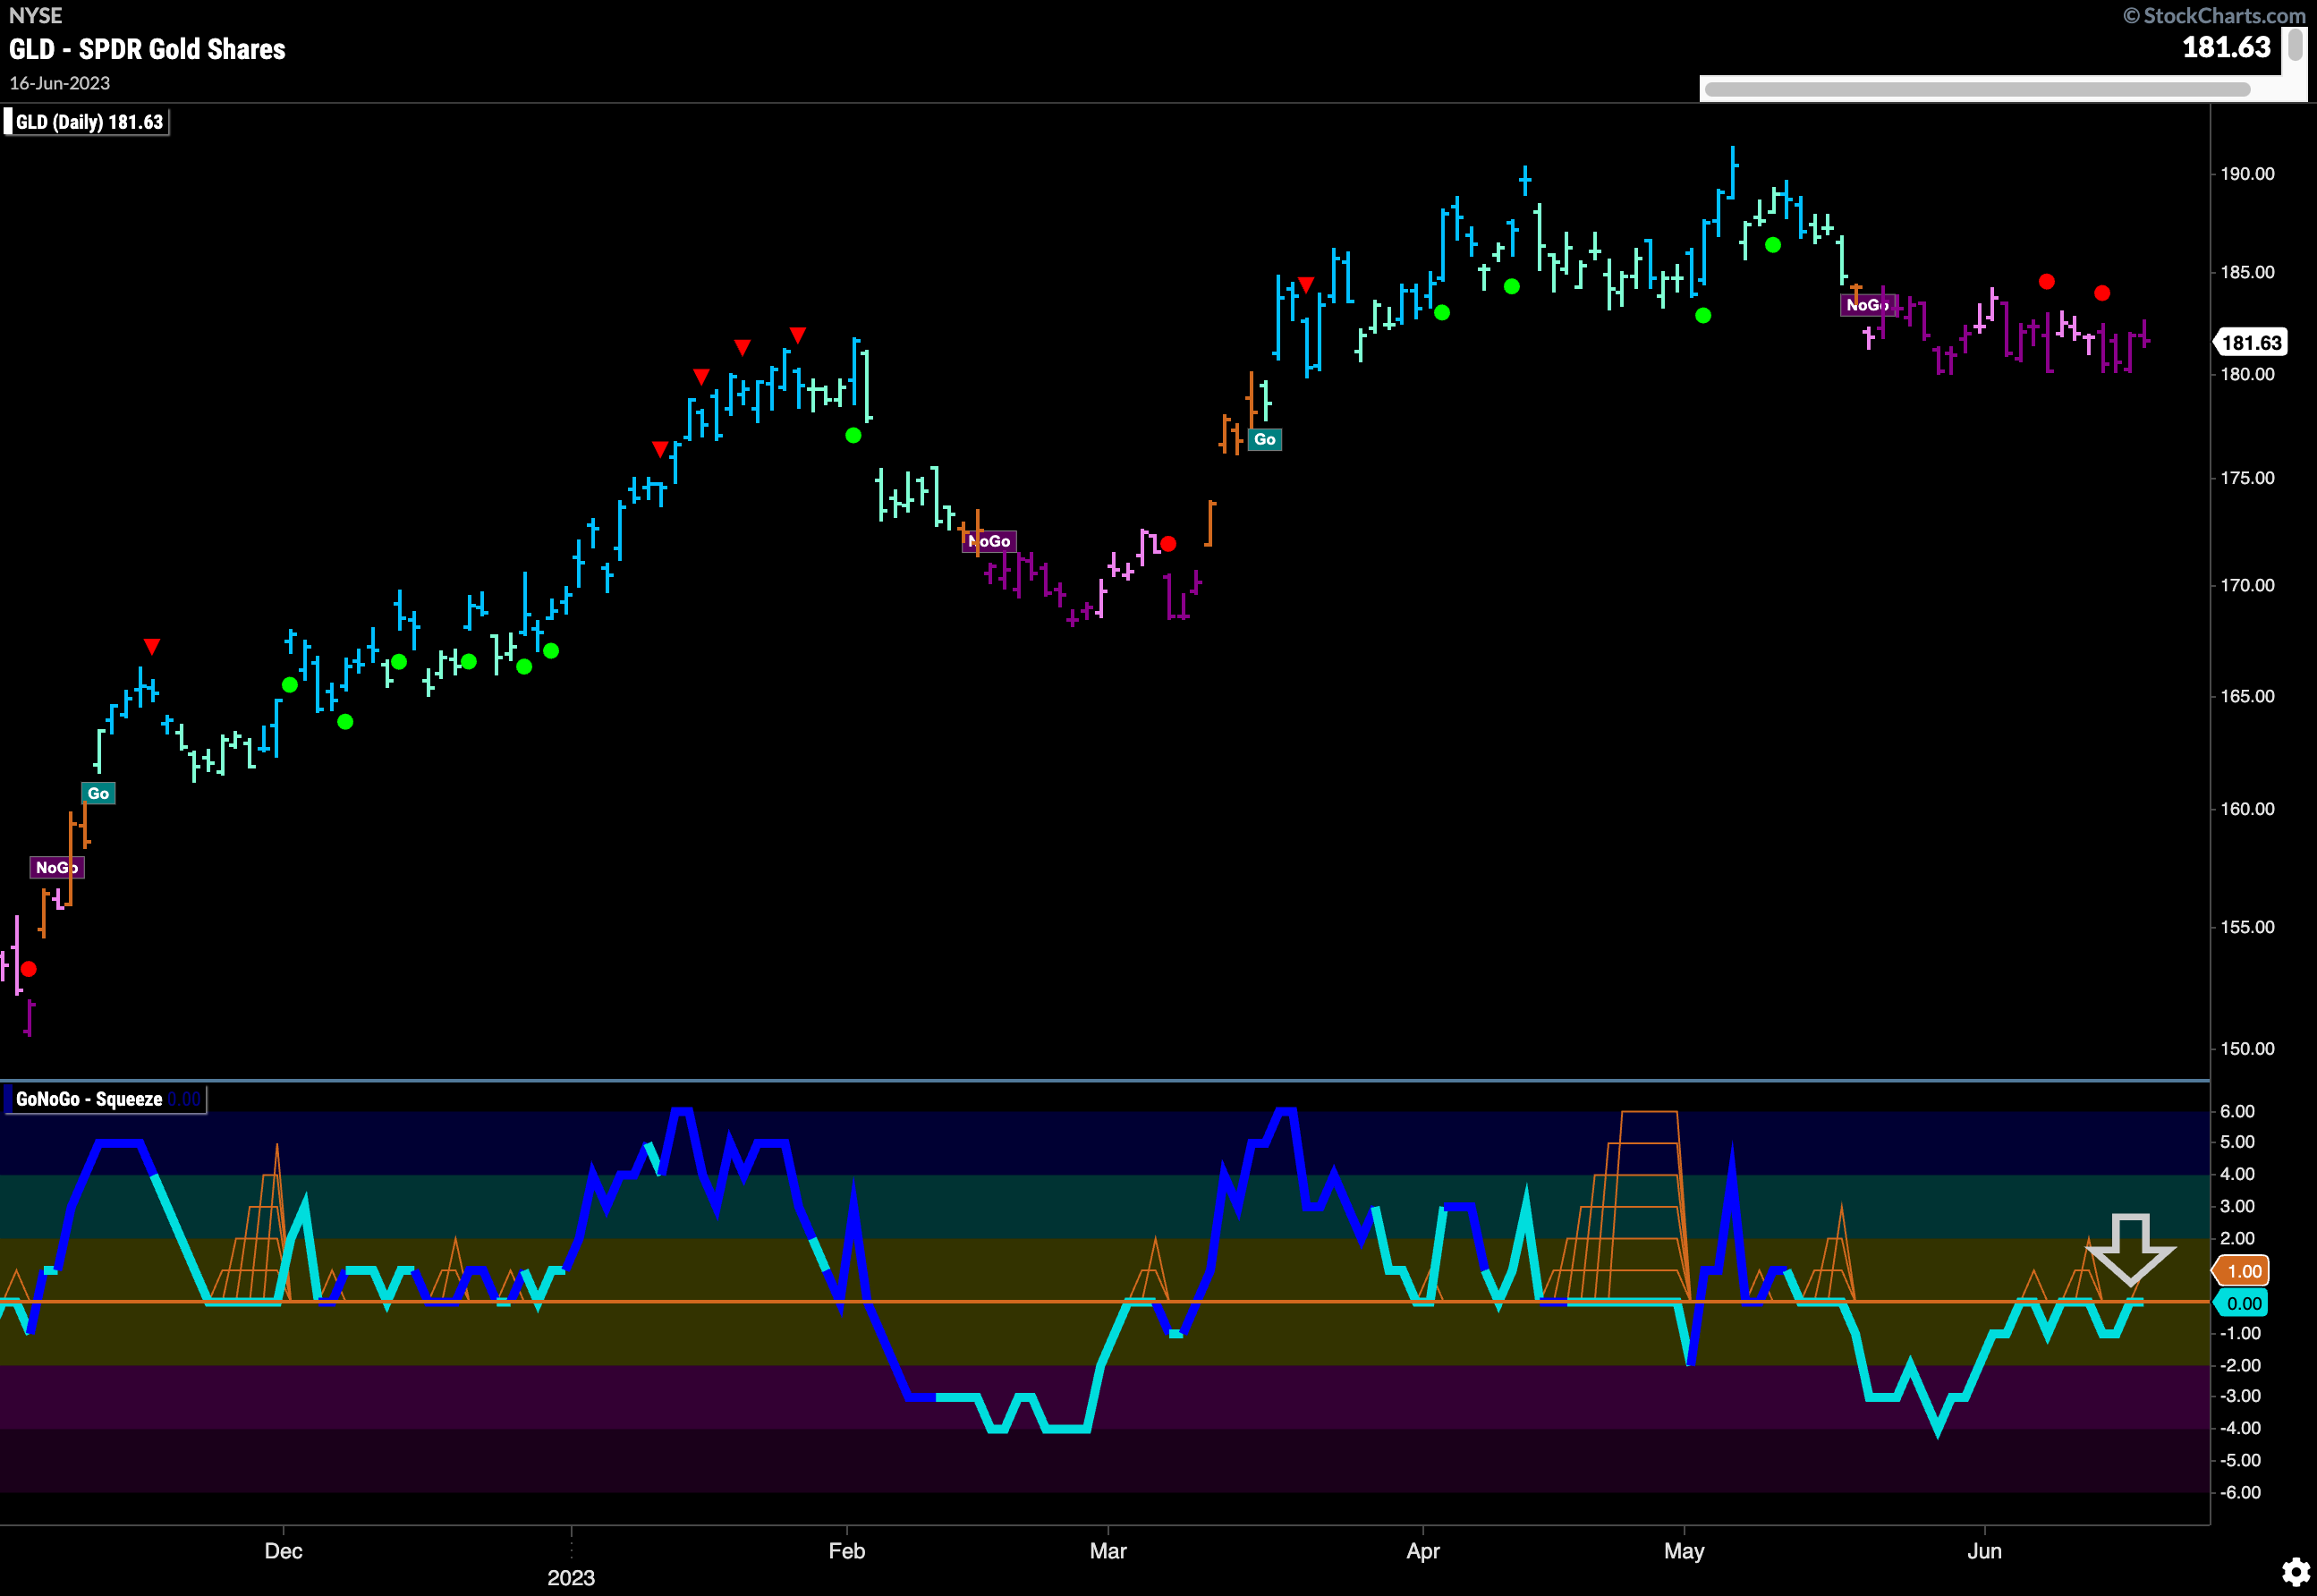
Price is in a “NoGo” trend and we can see that the GoNoGo Trend indicator is painting strong purple bars. This tells us that the weight of the evidence still points to downside pressure on gold prices. However, GoNoGo Oscillator has been hanging around the zero line for several trading sessions, unable to move significantly into negative territory which would help price make new lows. Back at zero again, we will watch to see if the oscillator gets turned away by the zero line one more time and if so we can look for new lows.
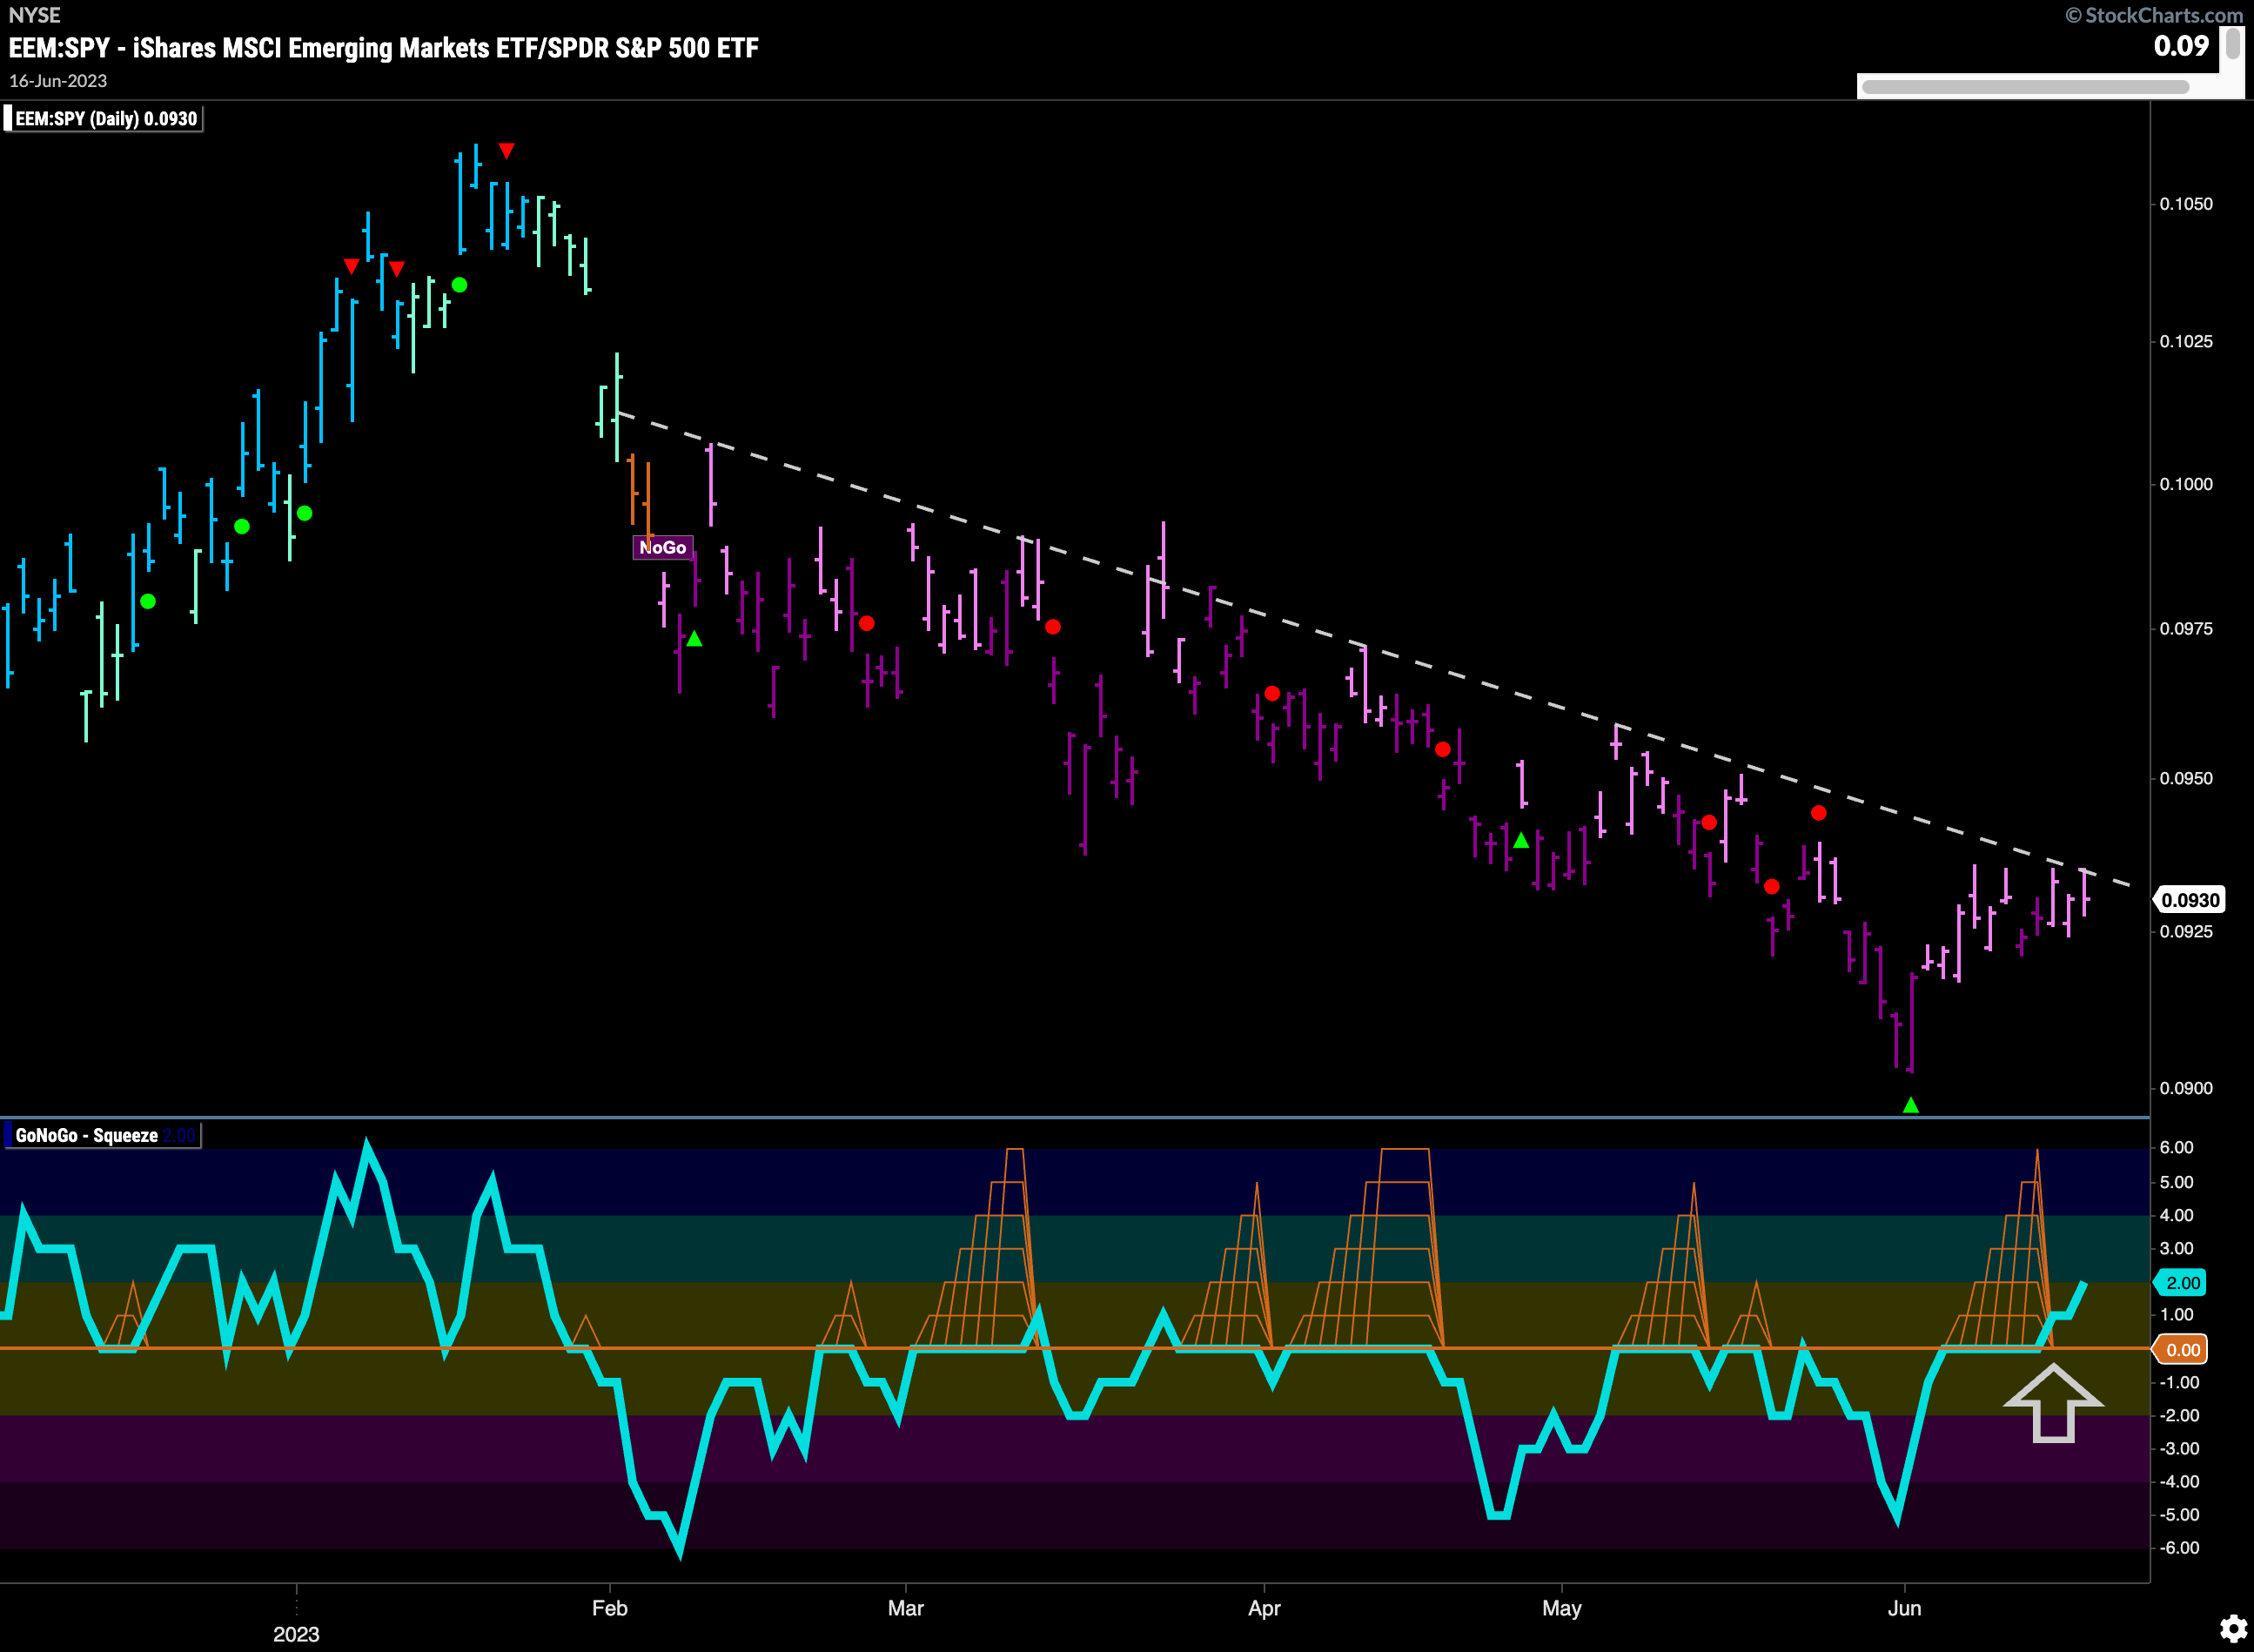
Emerging Markets Trying to Create a Base
How are the macro charts we looked at above impacting equity indexes globally? Long an under-performer relative to the S&P 500, $EEM (Emerging Markets ETF) could be showing signs of life. Early days yet, as GoNoGo Trend remains painting “NoGo” bars. However, the trend is weakening (pink bars) as price tests the resistance from downward sloping trend line. Of note, the GoNoGo Oscillator has broken out of a Max GoNoGo Squeeze into positive territory and this has moved momentum counter to the trend. We will watch to see if this positive momentum will be enough to help price set a new high and perhaps push GoNoGo Trend to reverse colors.
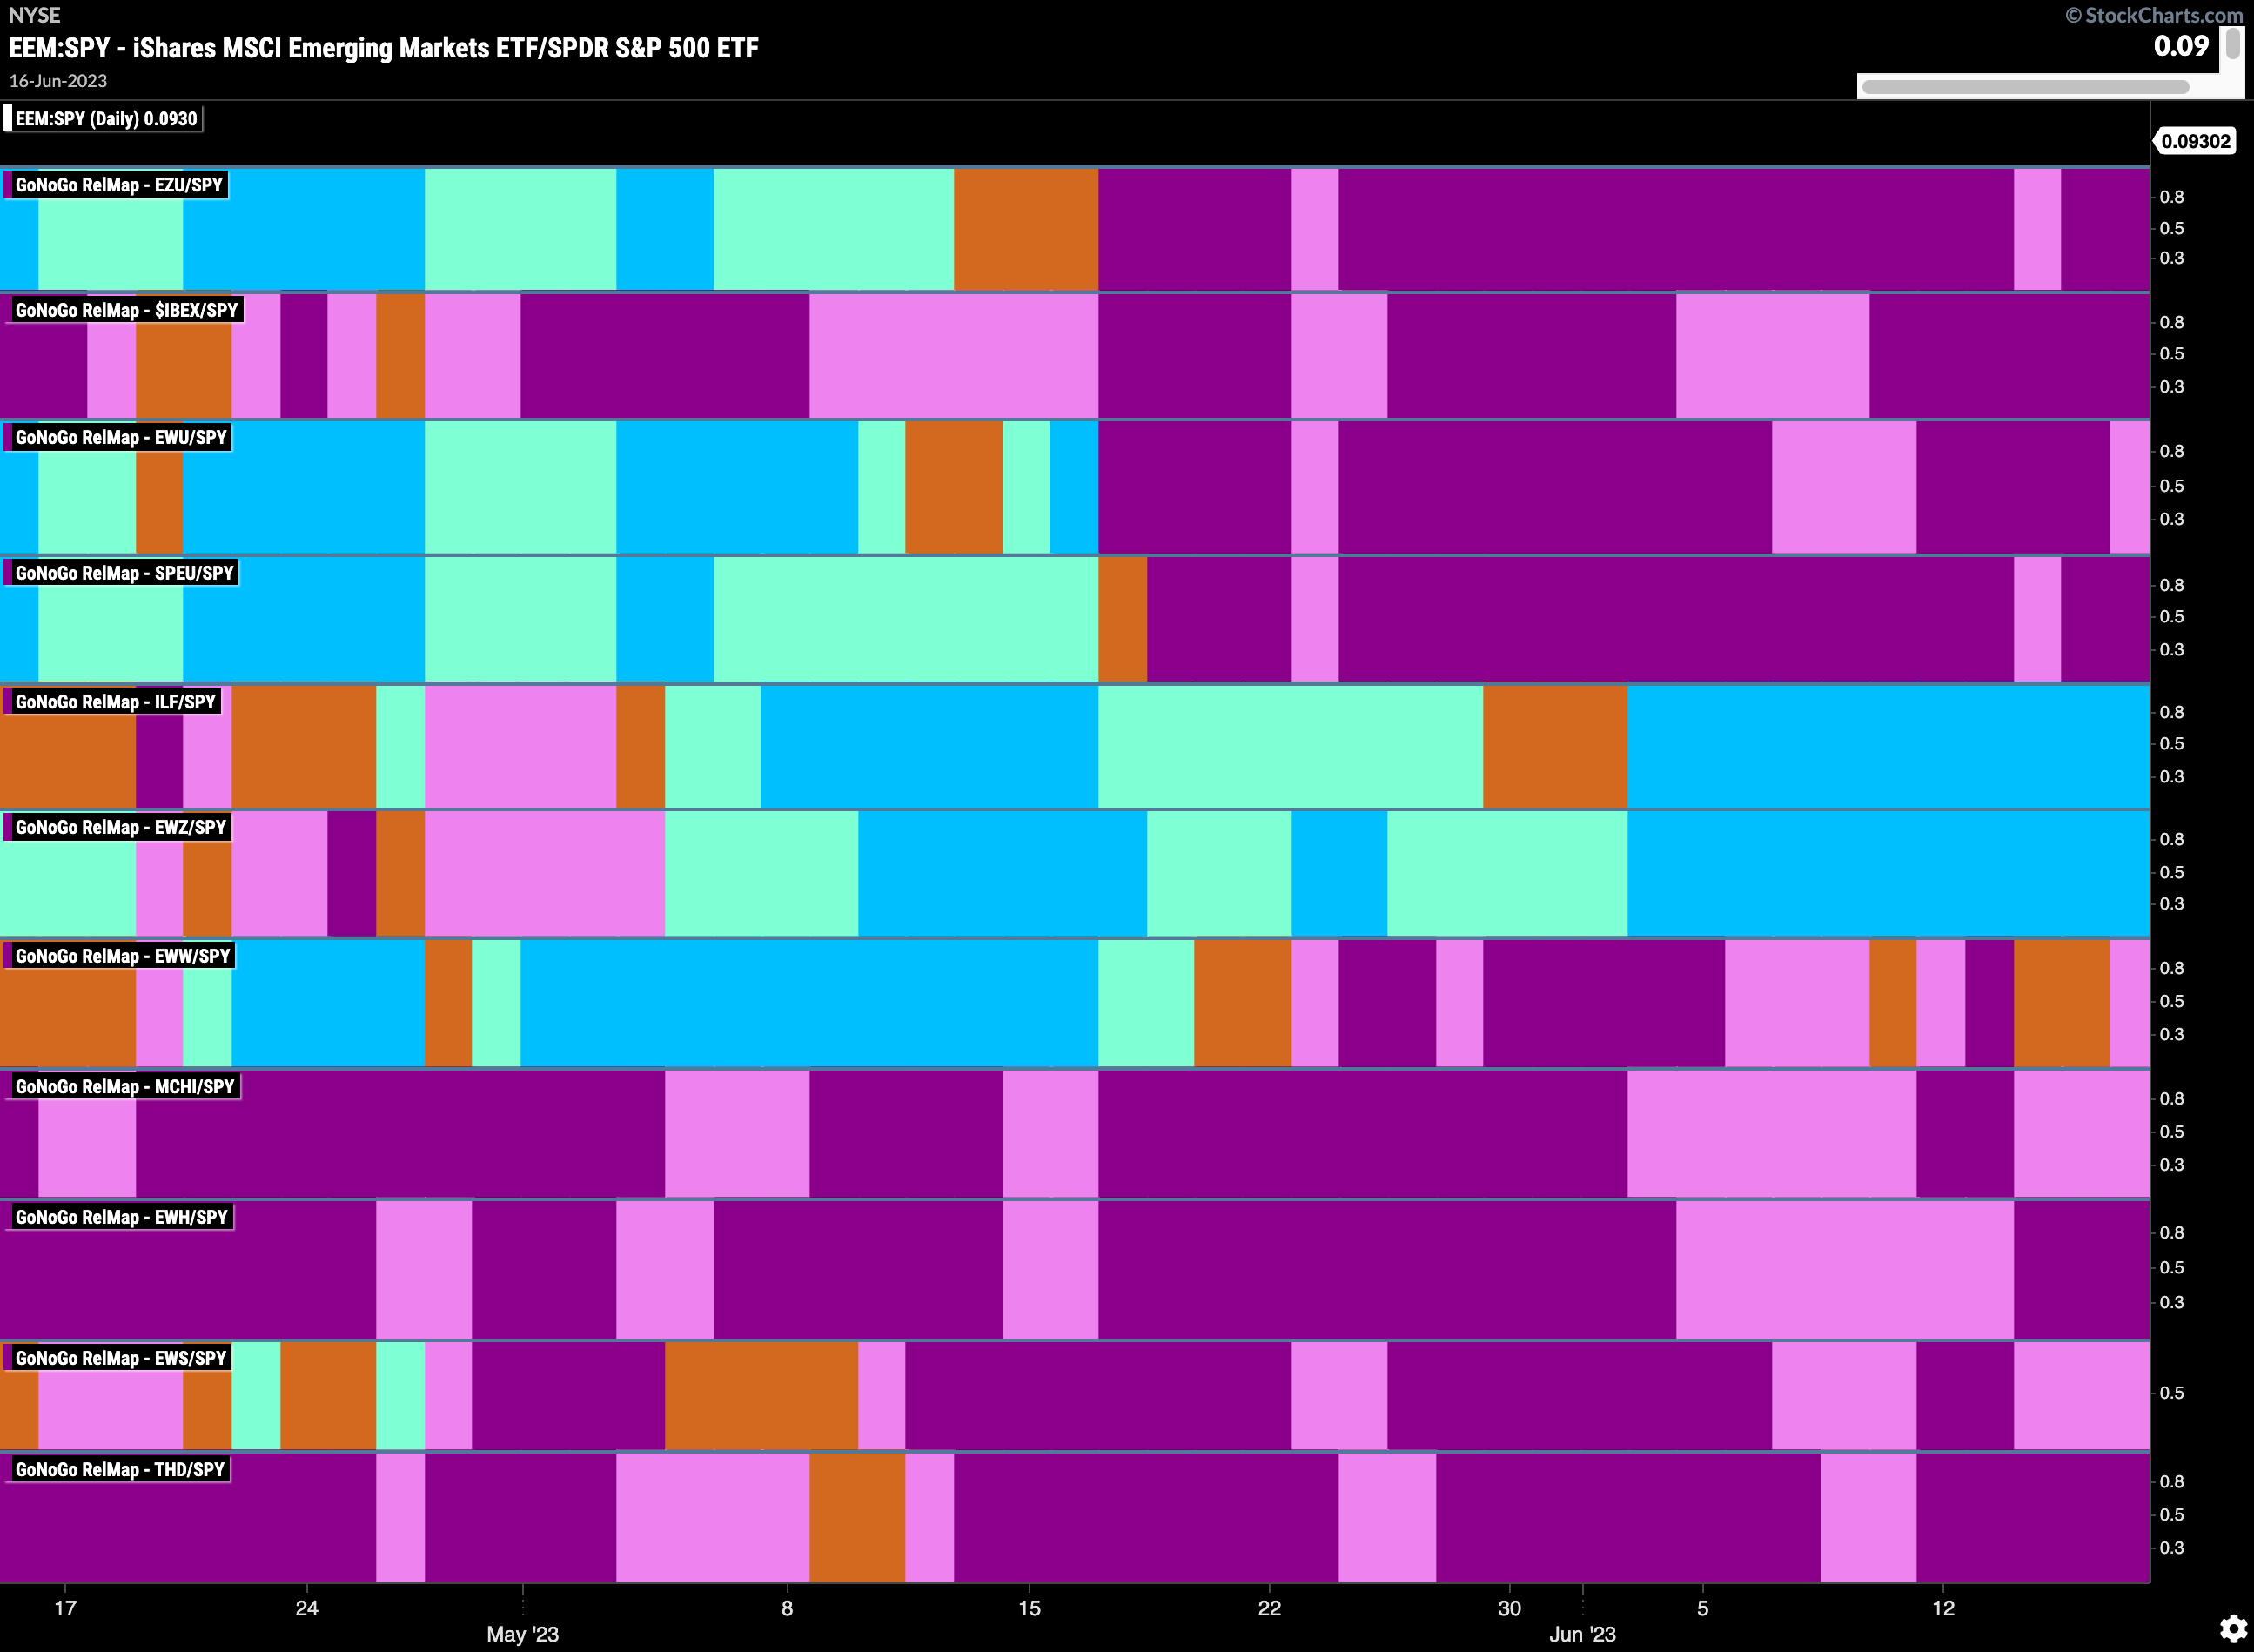
Countries RelMap
Below is the GoNoGo Country RelMap. Given what we saw above with $EEM, we can look at this map to get a sense of where the outperformance could come from. Interestingly, it is clear from this map that the outperformance is in Latin America and Brazil (panels 5 and 6). Continued strength here could help $EEM change trend.
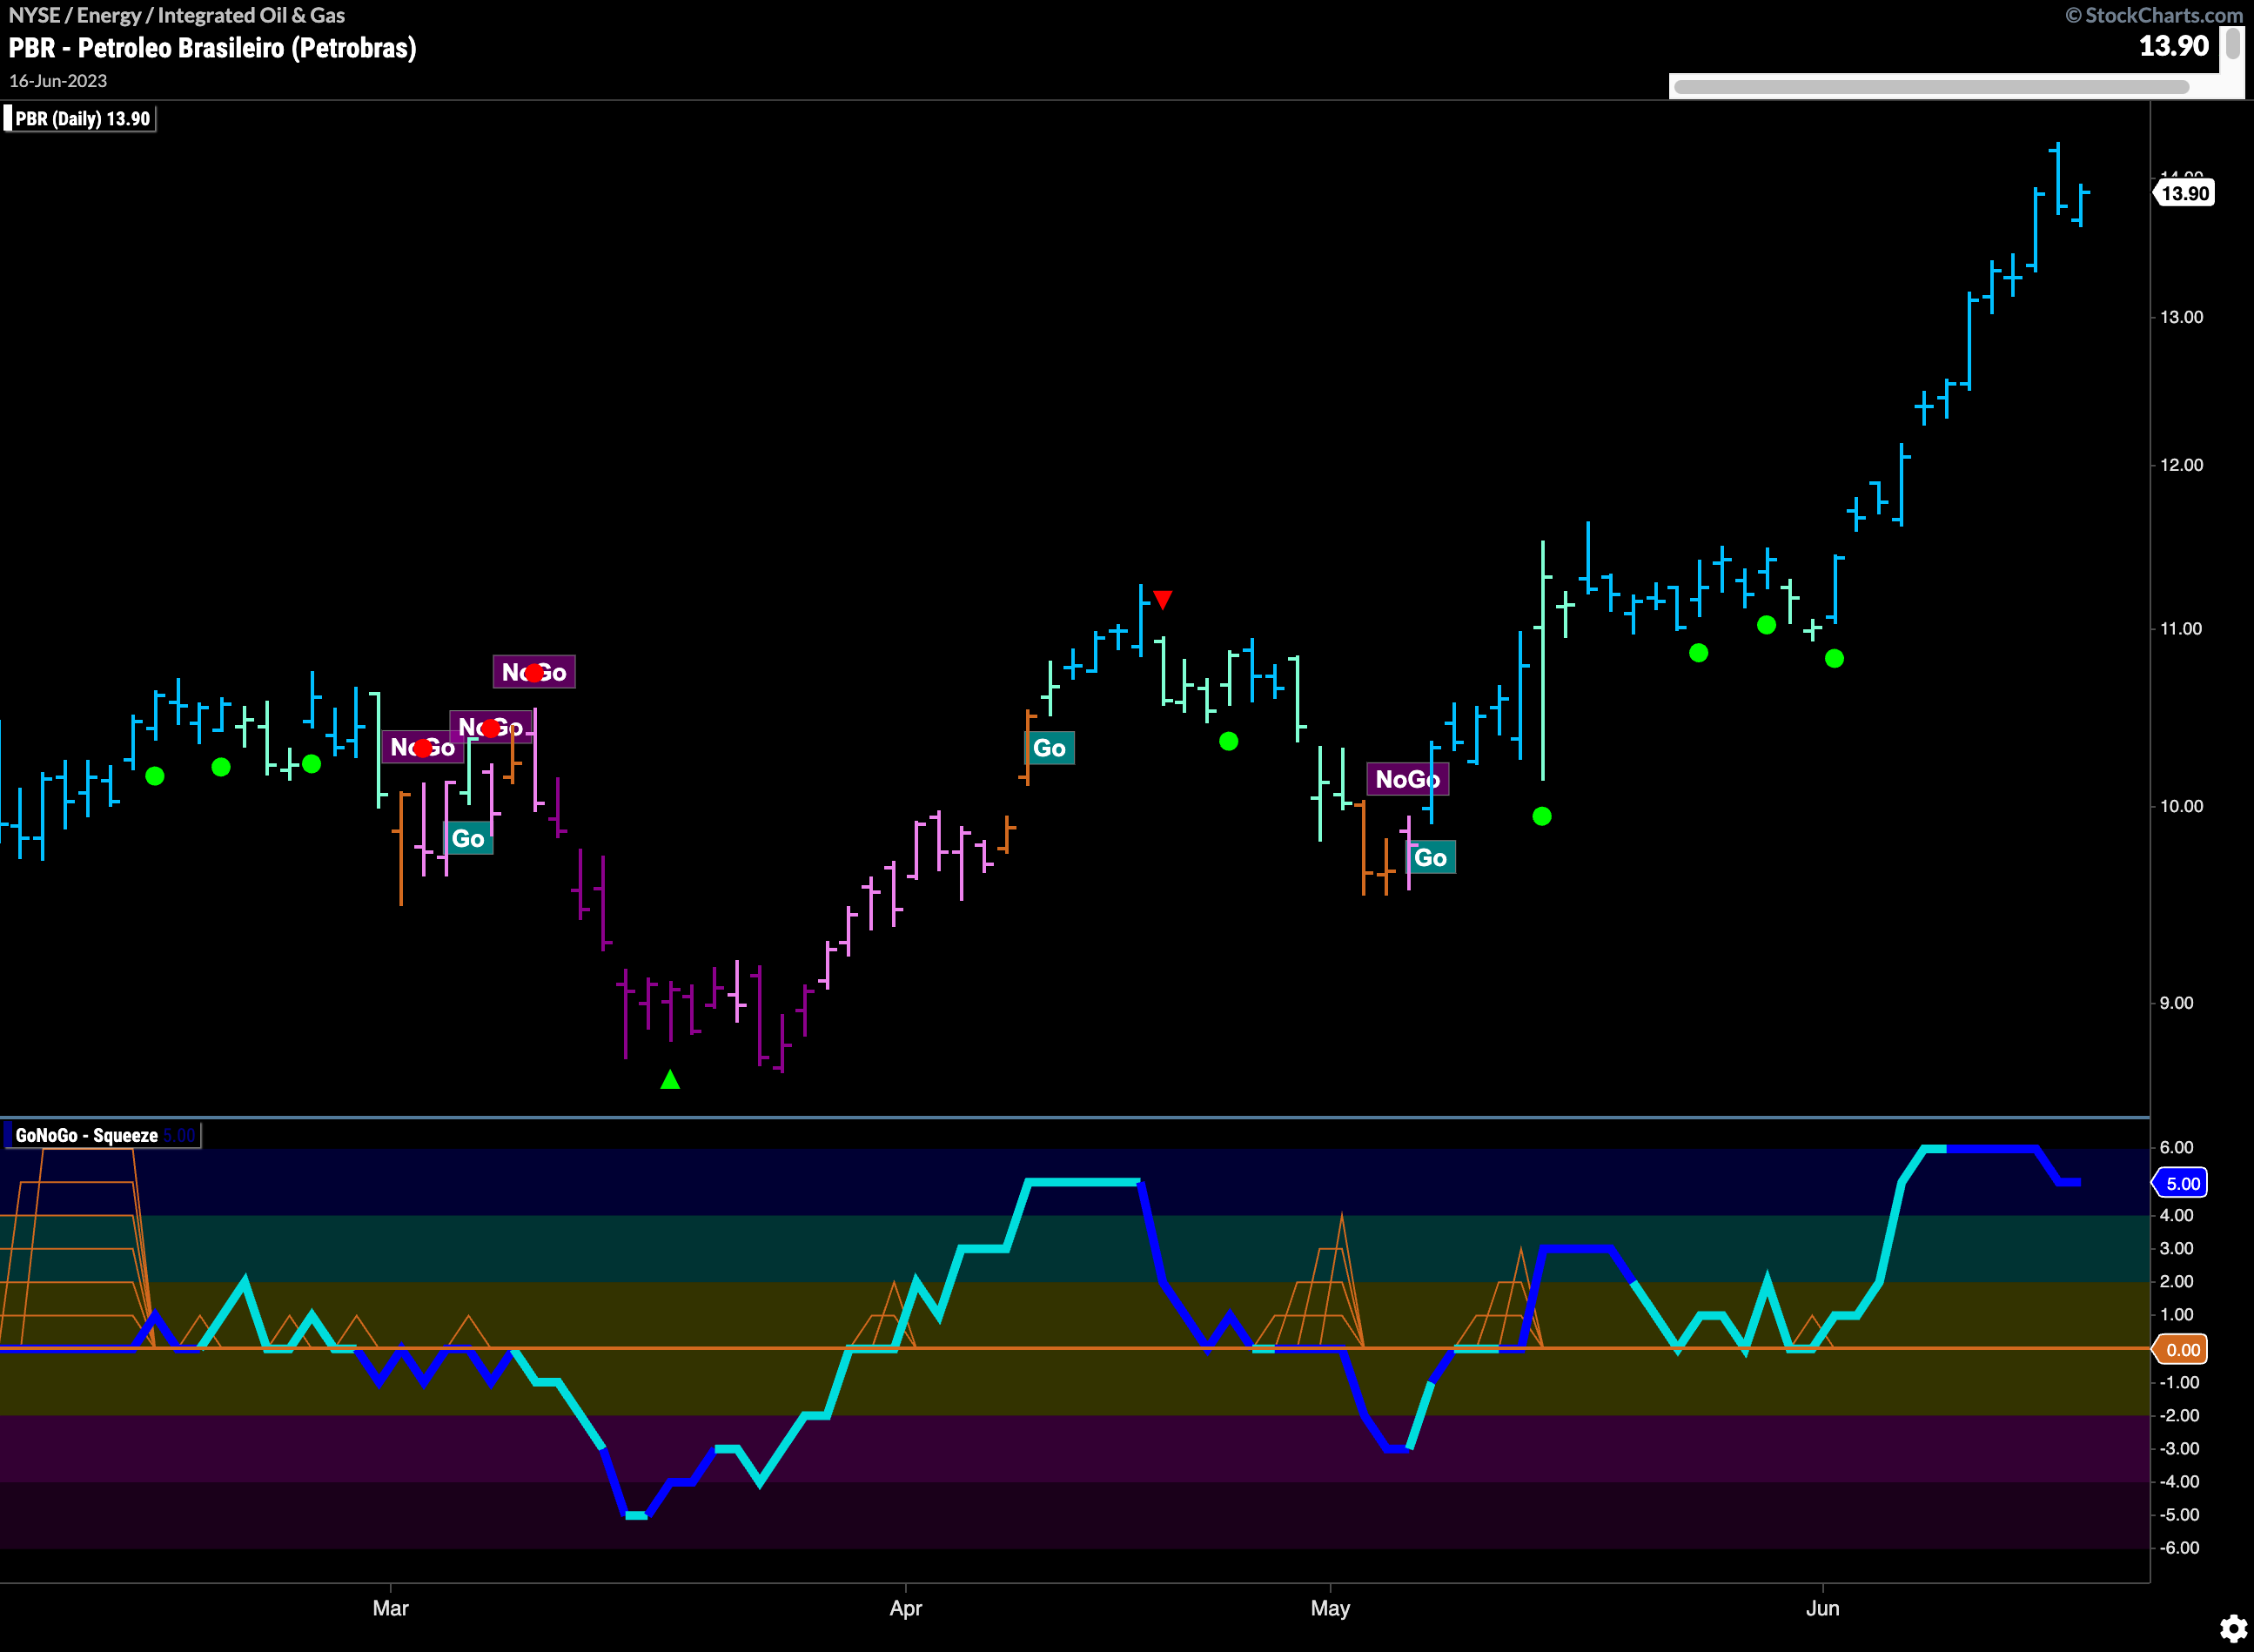
Petrobras Stands Tall in “Go” Trend
Given the strength in Brazilian equities, it is no surprise that $PBR is racing higher. Headquartered in Rio de Janeiro, is a multi national corporation in the petroleum industry. The chart below shows that GoNoGo Trend is painting strong blue “Go” bars as prices race higher. GoNoGo Oscillator is coming off overbought extremes and volume is heavy. If we see momentum cool any further we will see a Go Countertrend Correction Icon (red arrow) above price telling us that in the short term prices could struggle to go higher. An investor could be looking for pull backs to participate in this strong trend.
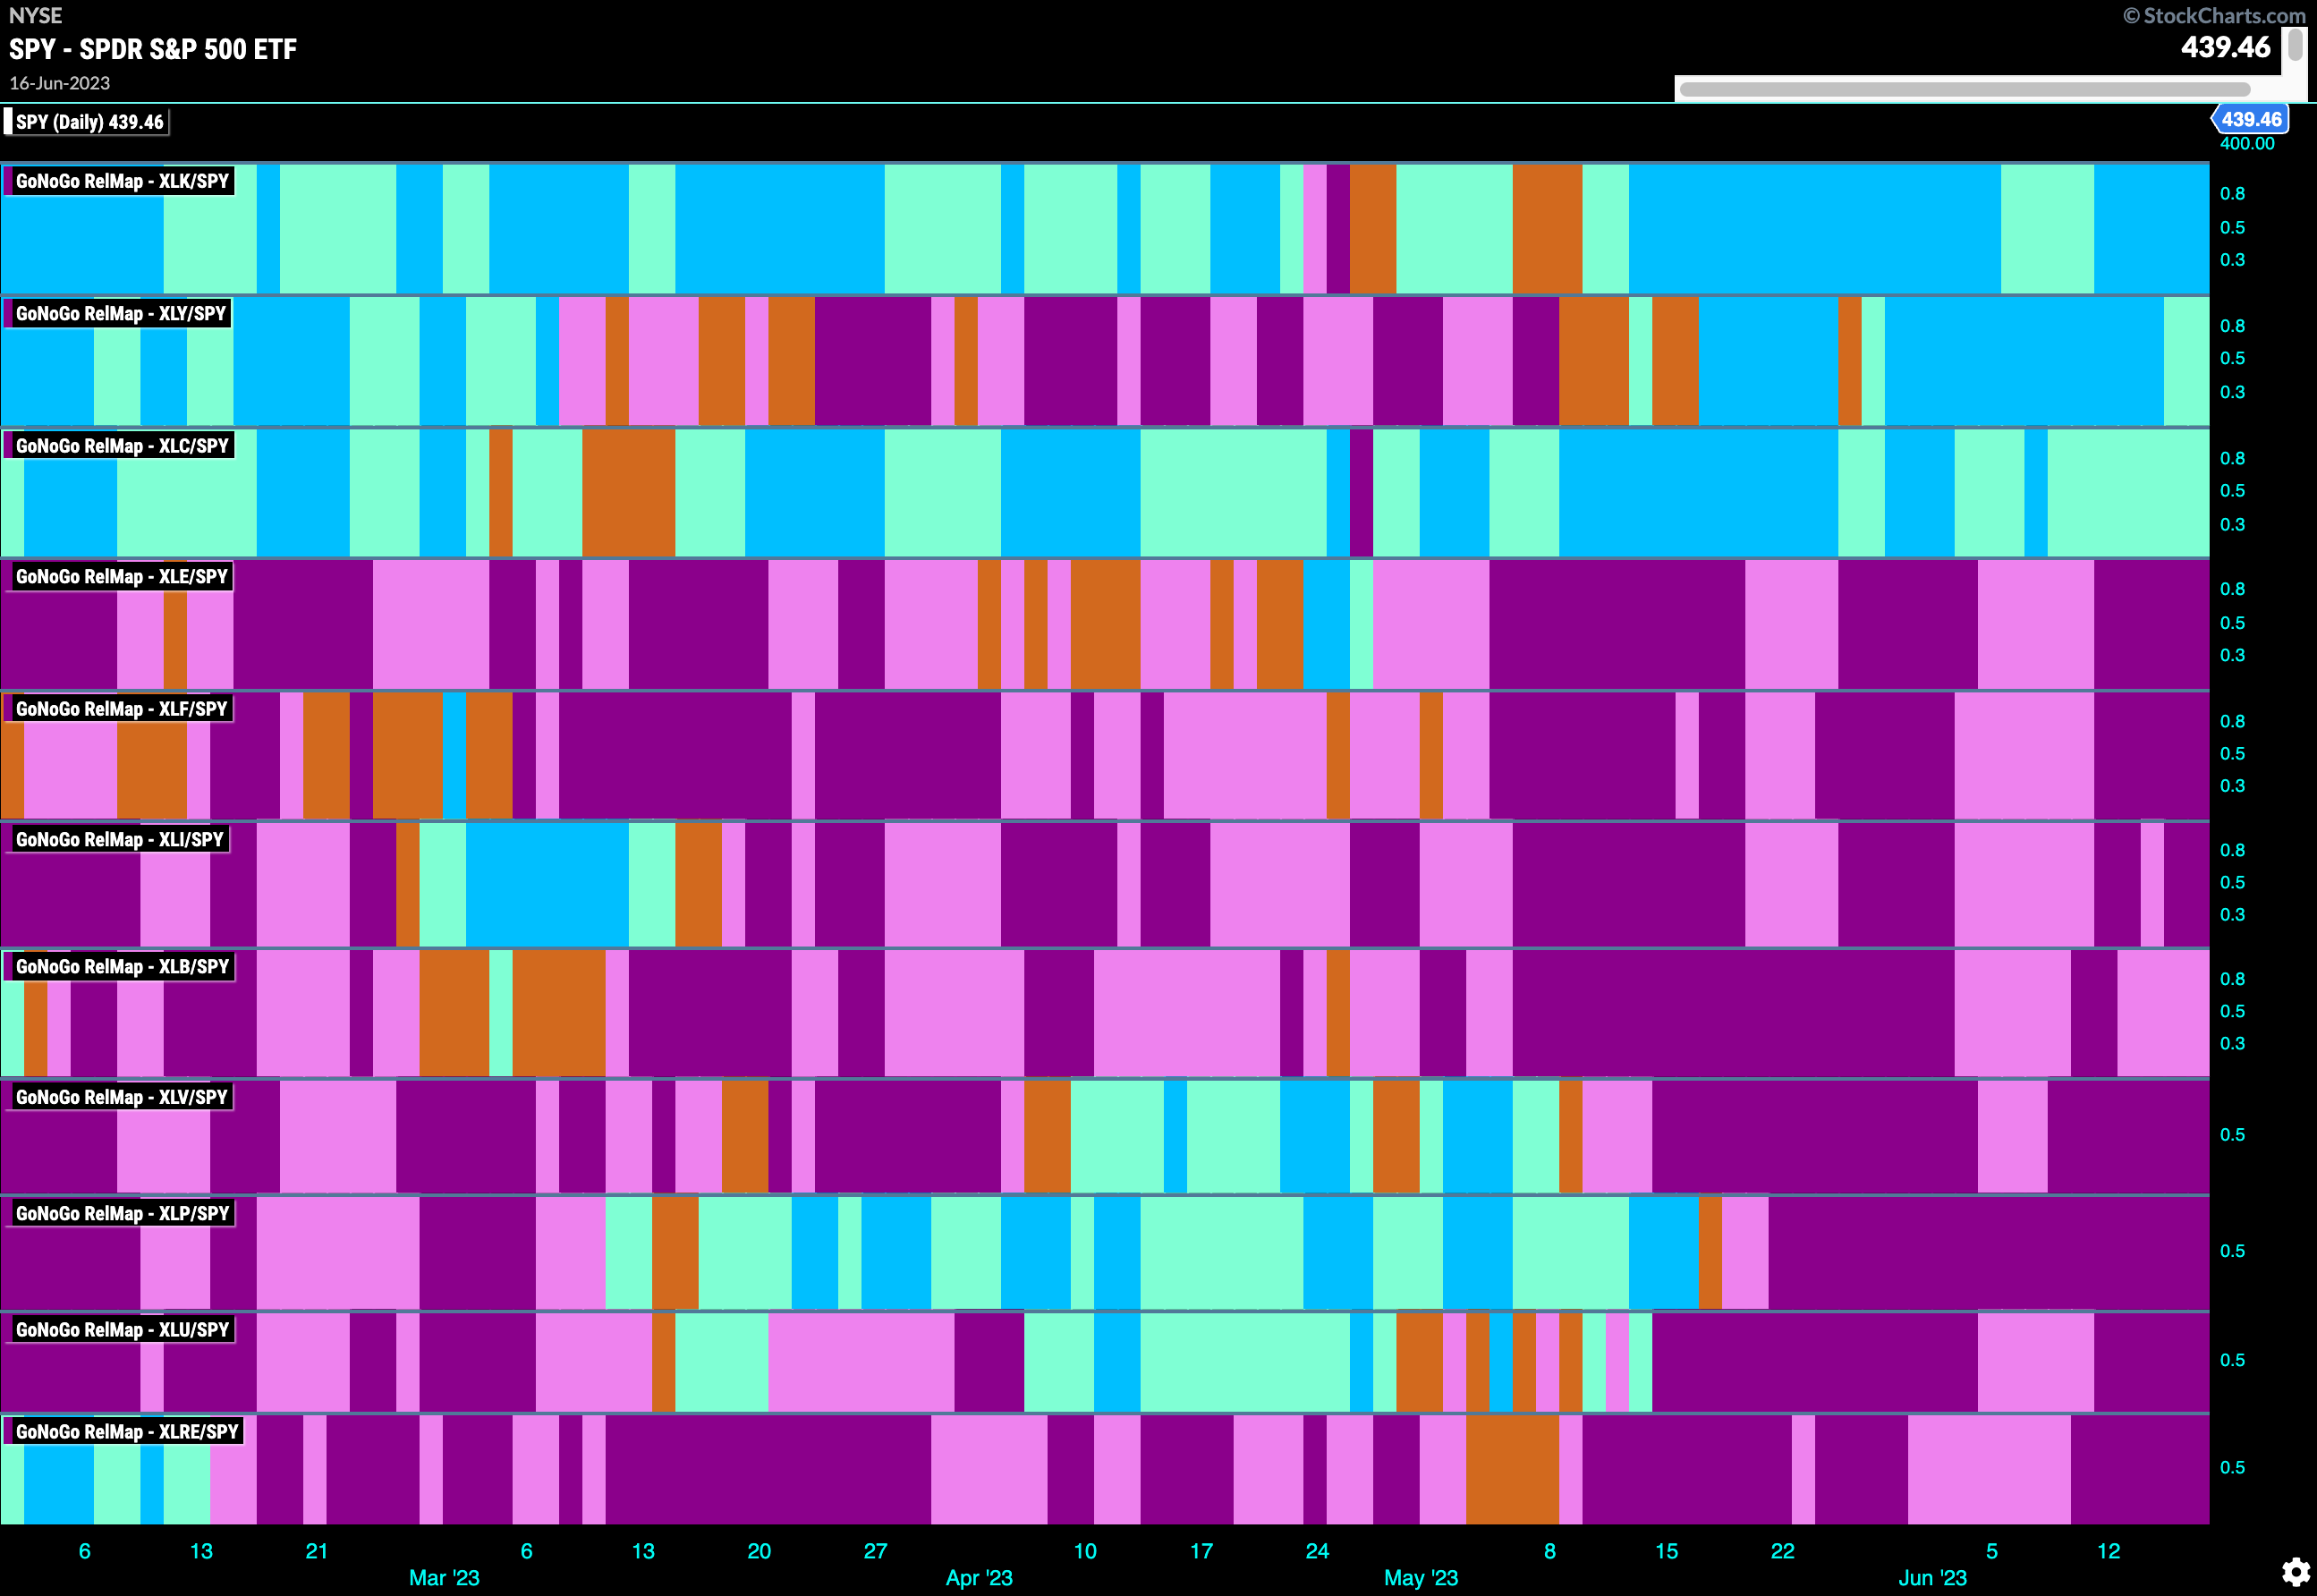
Sector RelMap
Below is the GoNoGo Sector RelMap. This GoNoGo RelMap applies the GoNoGo Trend to the relative strength ratios of the sectors to the base index. Looking at this map, we can quickly see where the relative outperformance is coming from as well as which sectors are lagging on a relative basis. 3 sectors are outperforming the base index this week. $XLK, $XLY, and $XLC are painting “Go” bars.
Grupo Televis S A to Take Advantage of Sector and Regional Strength?
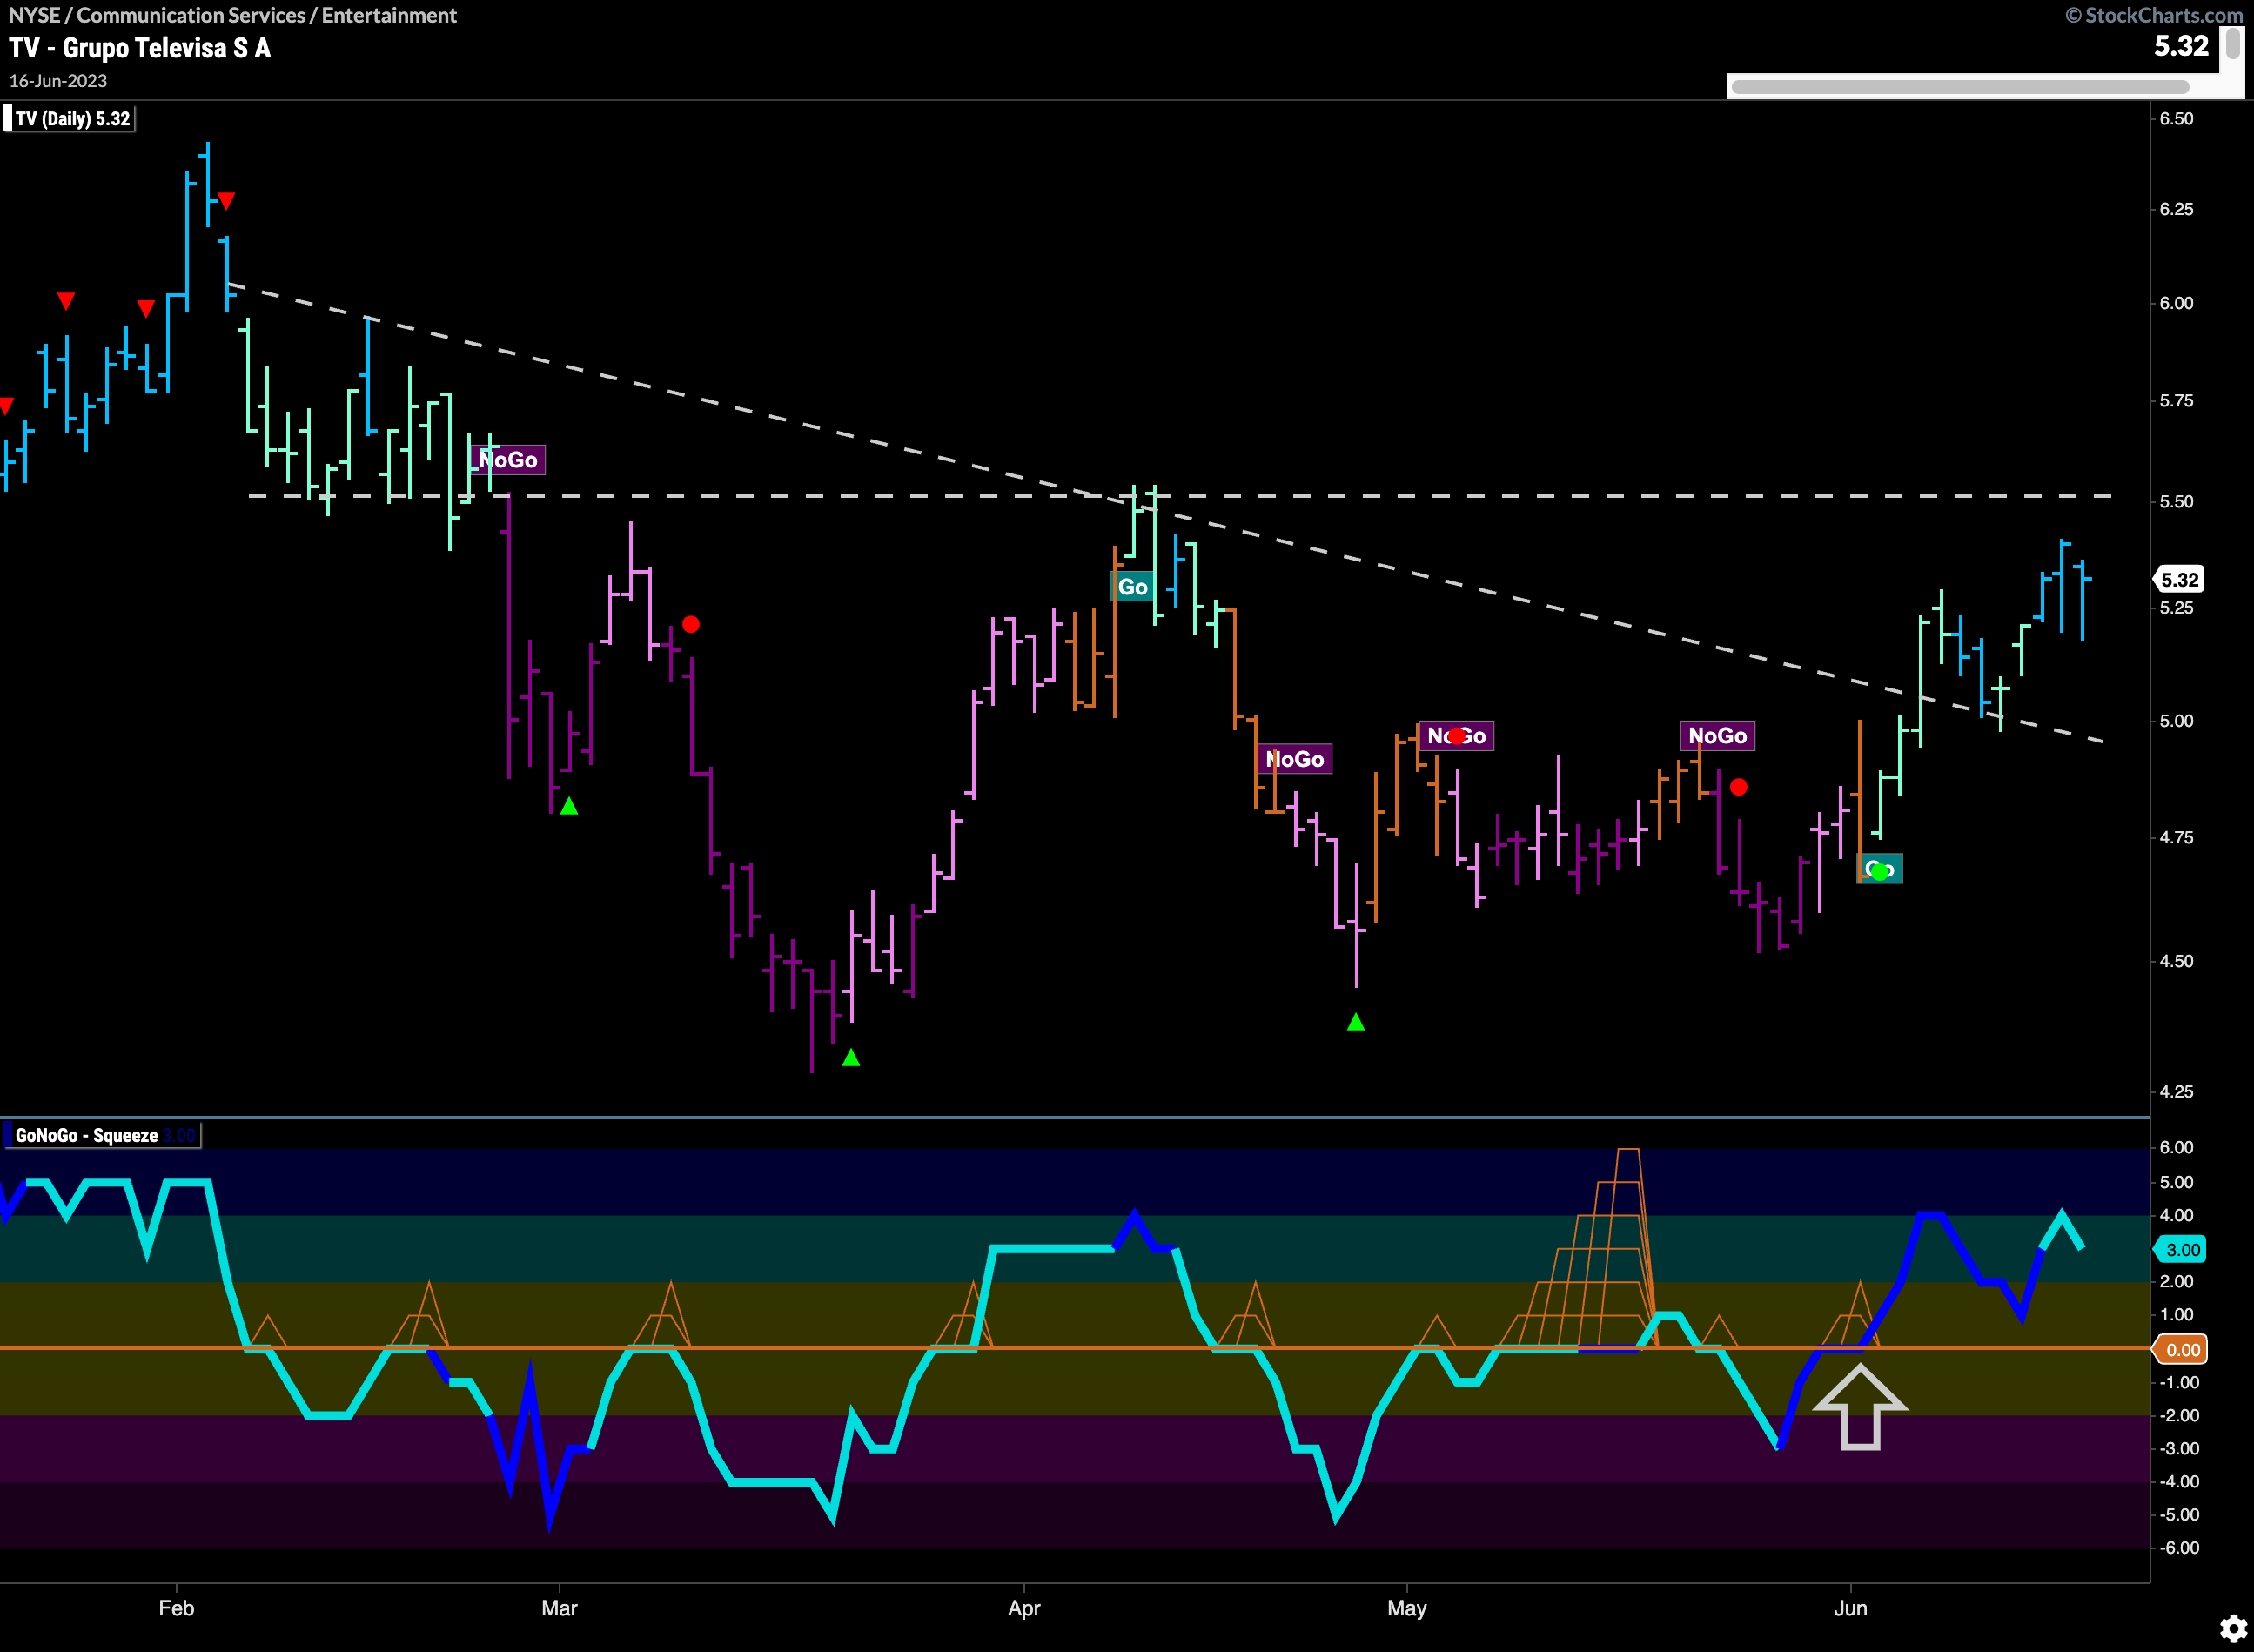
$TV is a major Latin American mass media corporation, and therefore could be well positioned to take advantage of the Latin American outperformance we saw above as well as the outperformance that we have noted over the past several weeks in the growth sectors. In this case, $TV is in the communication Services sector and the chart below shows that it has entered a “Go” trend and is above downward sloping resistance. GoNoGo Trend is now painting strong blue “Go” bars and GoNoGo Oscillator has found support above the zero line after breaking into positive territory on heavy volume.
