
As we mentioned in this weekend’s Launch Conditions note, Treasury Yields have been a central indicator for US equity markets last week. See the GoNoGo Chart below of $TBF, the ProShares Short treasury ETF which acts as a proxy for yield.
US 10-year yields had a very unsurprising consolidation in April and May after the sharp run-up in February. A classical read of the tug of war between supply and demand would have suggested a continuation of the upward trend in yields after the markets “digested” the jump up. However, GoNoGo Charts showed further deterioration of the trend conditions in early May and deep intraday depreciation of yields on May 7th before breaking out of the GoNoGo Squeeze to the upside.
After a second break of the GoNoGo Squeeze, this time to the downside, markets witnessed a solid week of bond-buying last week driving prices up/yields down the charts show the strongest purple “NoGo” while GoNoGo Oscillator sits at extreme oversold readings. Interestingly, the 10-yr yield closed in a tight range on Friday, right at the intraday low of May 7th. Trend conditions being where they are, the path of least resistance is lower. Markets will confirm or deny this week.

Looking at this another way, there is a significant rally in bonds underway across the quality spectrum. Investors looking to add fixed income to their portfolios at this juncture will appreciate the “Go” trend conditions at present.
Here is a GoNoGo Chart of the investment-grade corporate bonds ($LQD) showing a massive price rally Thursday and an Oscillator at overbought extremes on heavy volume:

The only contrary signal from this chart is that $LQD closed at the open on Friday, signaling a stalemate between bulls and bears at this level.
Risk appetite for High Yield “Junk” bonds was also pronounced last week. Quickly approaching the Feb highs, we’ll look to the GoNoGo Oscillator for a momentum thrust if $HYG is going to break above resistance:

↓Yields = ↑ Growth
If yields follow the path of least resistance lower this week, continued rotation back into growth sectors would be logical. Last week’s sharp decrease in longer-term bond yields favors growth stocks by reducing the implied discount on future earnings.
The attractiveness of growth equities helped the Nasdaq outperform the other major indices last week. Perhaps more important than the relative performance, the GoNoGo chart below shows that the $QQQ closed above its February highs on a fresh “Go” trend that appears in position to test all-time highs.

\
Furthermore, we can see that $XLK is not just trending, but also outperforming the index. And (stay with me here…) the trend of the tech sector’s relative performance against the S&P 500 has gained strength. GoNoGo Trend indicates that the relative outperformance of tech to the S&P strengthened enough to signal a new “Go” on Friday, confirmed by a positive Oscillator reading:

Notably, a 4% gain in Amazon.com ($AMZN) propped up the consumer discretionary sector as well last week. Amazon has done nothing since Sept 2020 but returned nearly 120% between Mar and Sept. If the “flag flies at half mast,” this would be a wonderful trend to capture, but at a minimum, there is a 7% return just to the top of the range. See the weekly GoNoGo Chart below of $AMZN:

Alphabet ($GOOG) is in a strong “Go”:

Microsoft is fast approaching all-time highs:

Falling Rates, bad for banks…
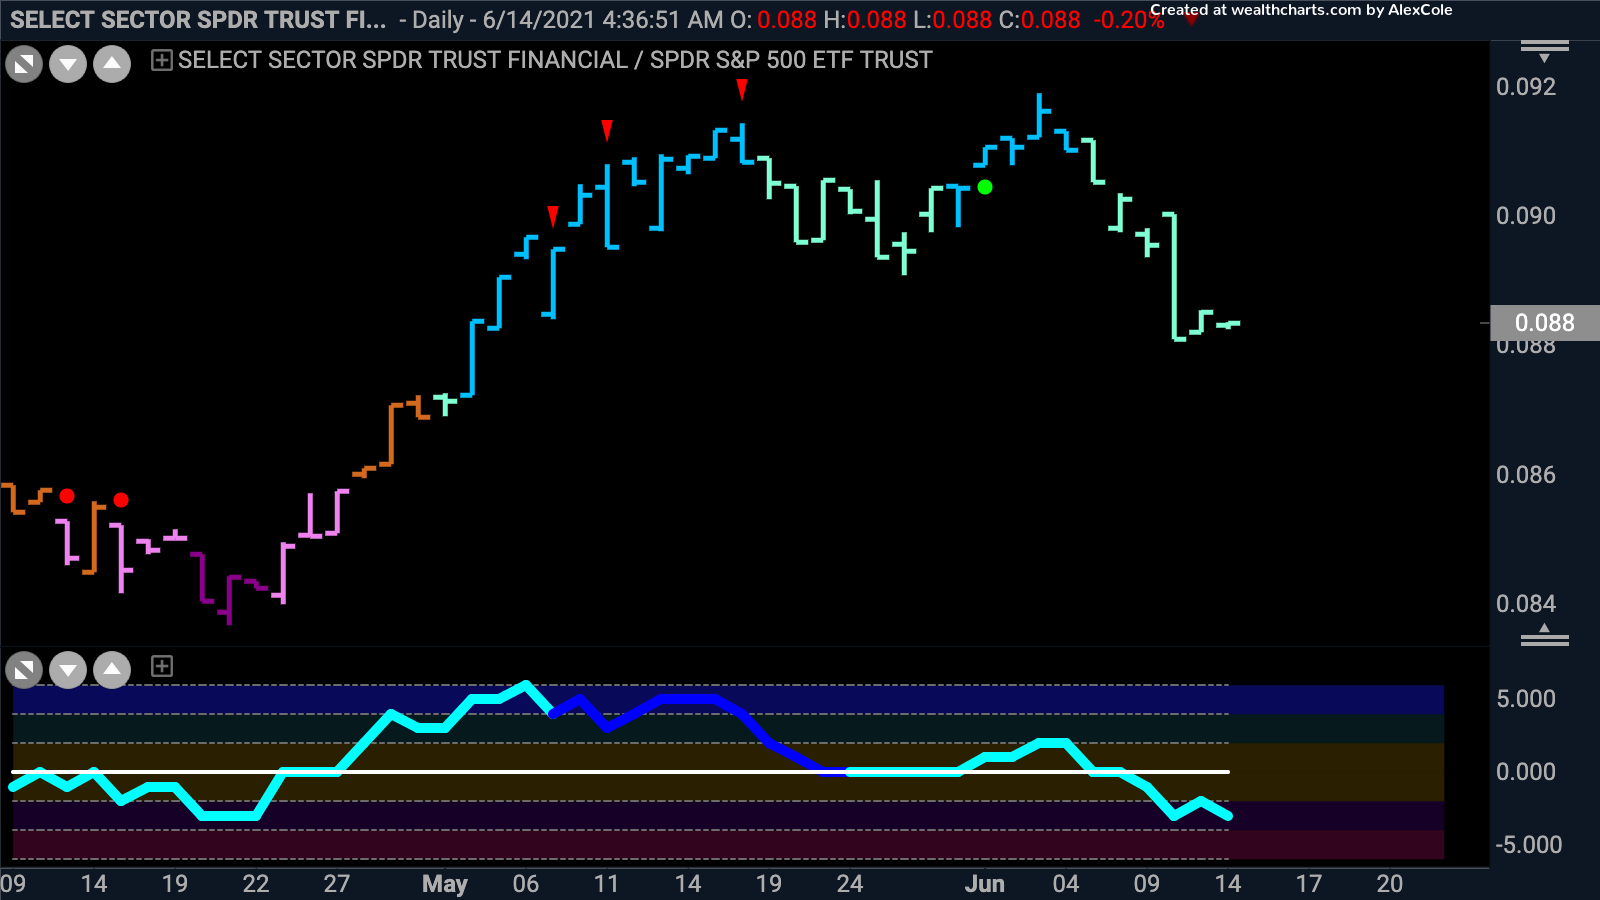
Conversely, falling yields are weighing on financials by threatening bank lending margins. Last week, cyclical sectors declined around 2.0% including: financials (-2.4%), materials (-2.0%), and industrials (-1.7%). Here is the daily GoNoGo Chart of the financials sector relative to the S&P 500, $XLF/SPY showing the glide path of a brick on Thursday’s session:

While the reopening theme trade has worked well the past few months, there is clearly some healthy consolidation at play. But please note, these trends are not fully reversed, just producing less return on a relative basis. We need to watch Treasury yields to see if the “NoGo” trend will persist or not.
Take a look at the daily GoNoGo Trend charts below for the cyclical sectors which lagged last week. NOT DOWNTRENDS, yet:
Financials:

Industrials – pre-market data shows the possibility of an amber “Go Fish” bar.

Materials – most concerning with the Oscillator below zero, but still a “Go” trend in consolidation:

Closing Thought:
Cathie Wood has been under the spotlight – both for the incredible performance of the ARKK ETFs in 2020, but also for the severe underperformance of the same funds in 2021. If Yields are starting their next leg down, perhaps Cathie’s Innovation ETF is trading at a discount? We will receive a clear sign of returning health for this “Go” trend when the high-volume Oscillator breaks back to the upside on the weekly basis:


