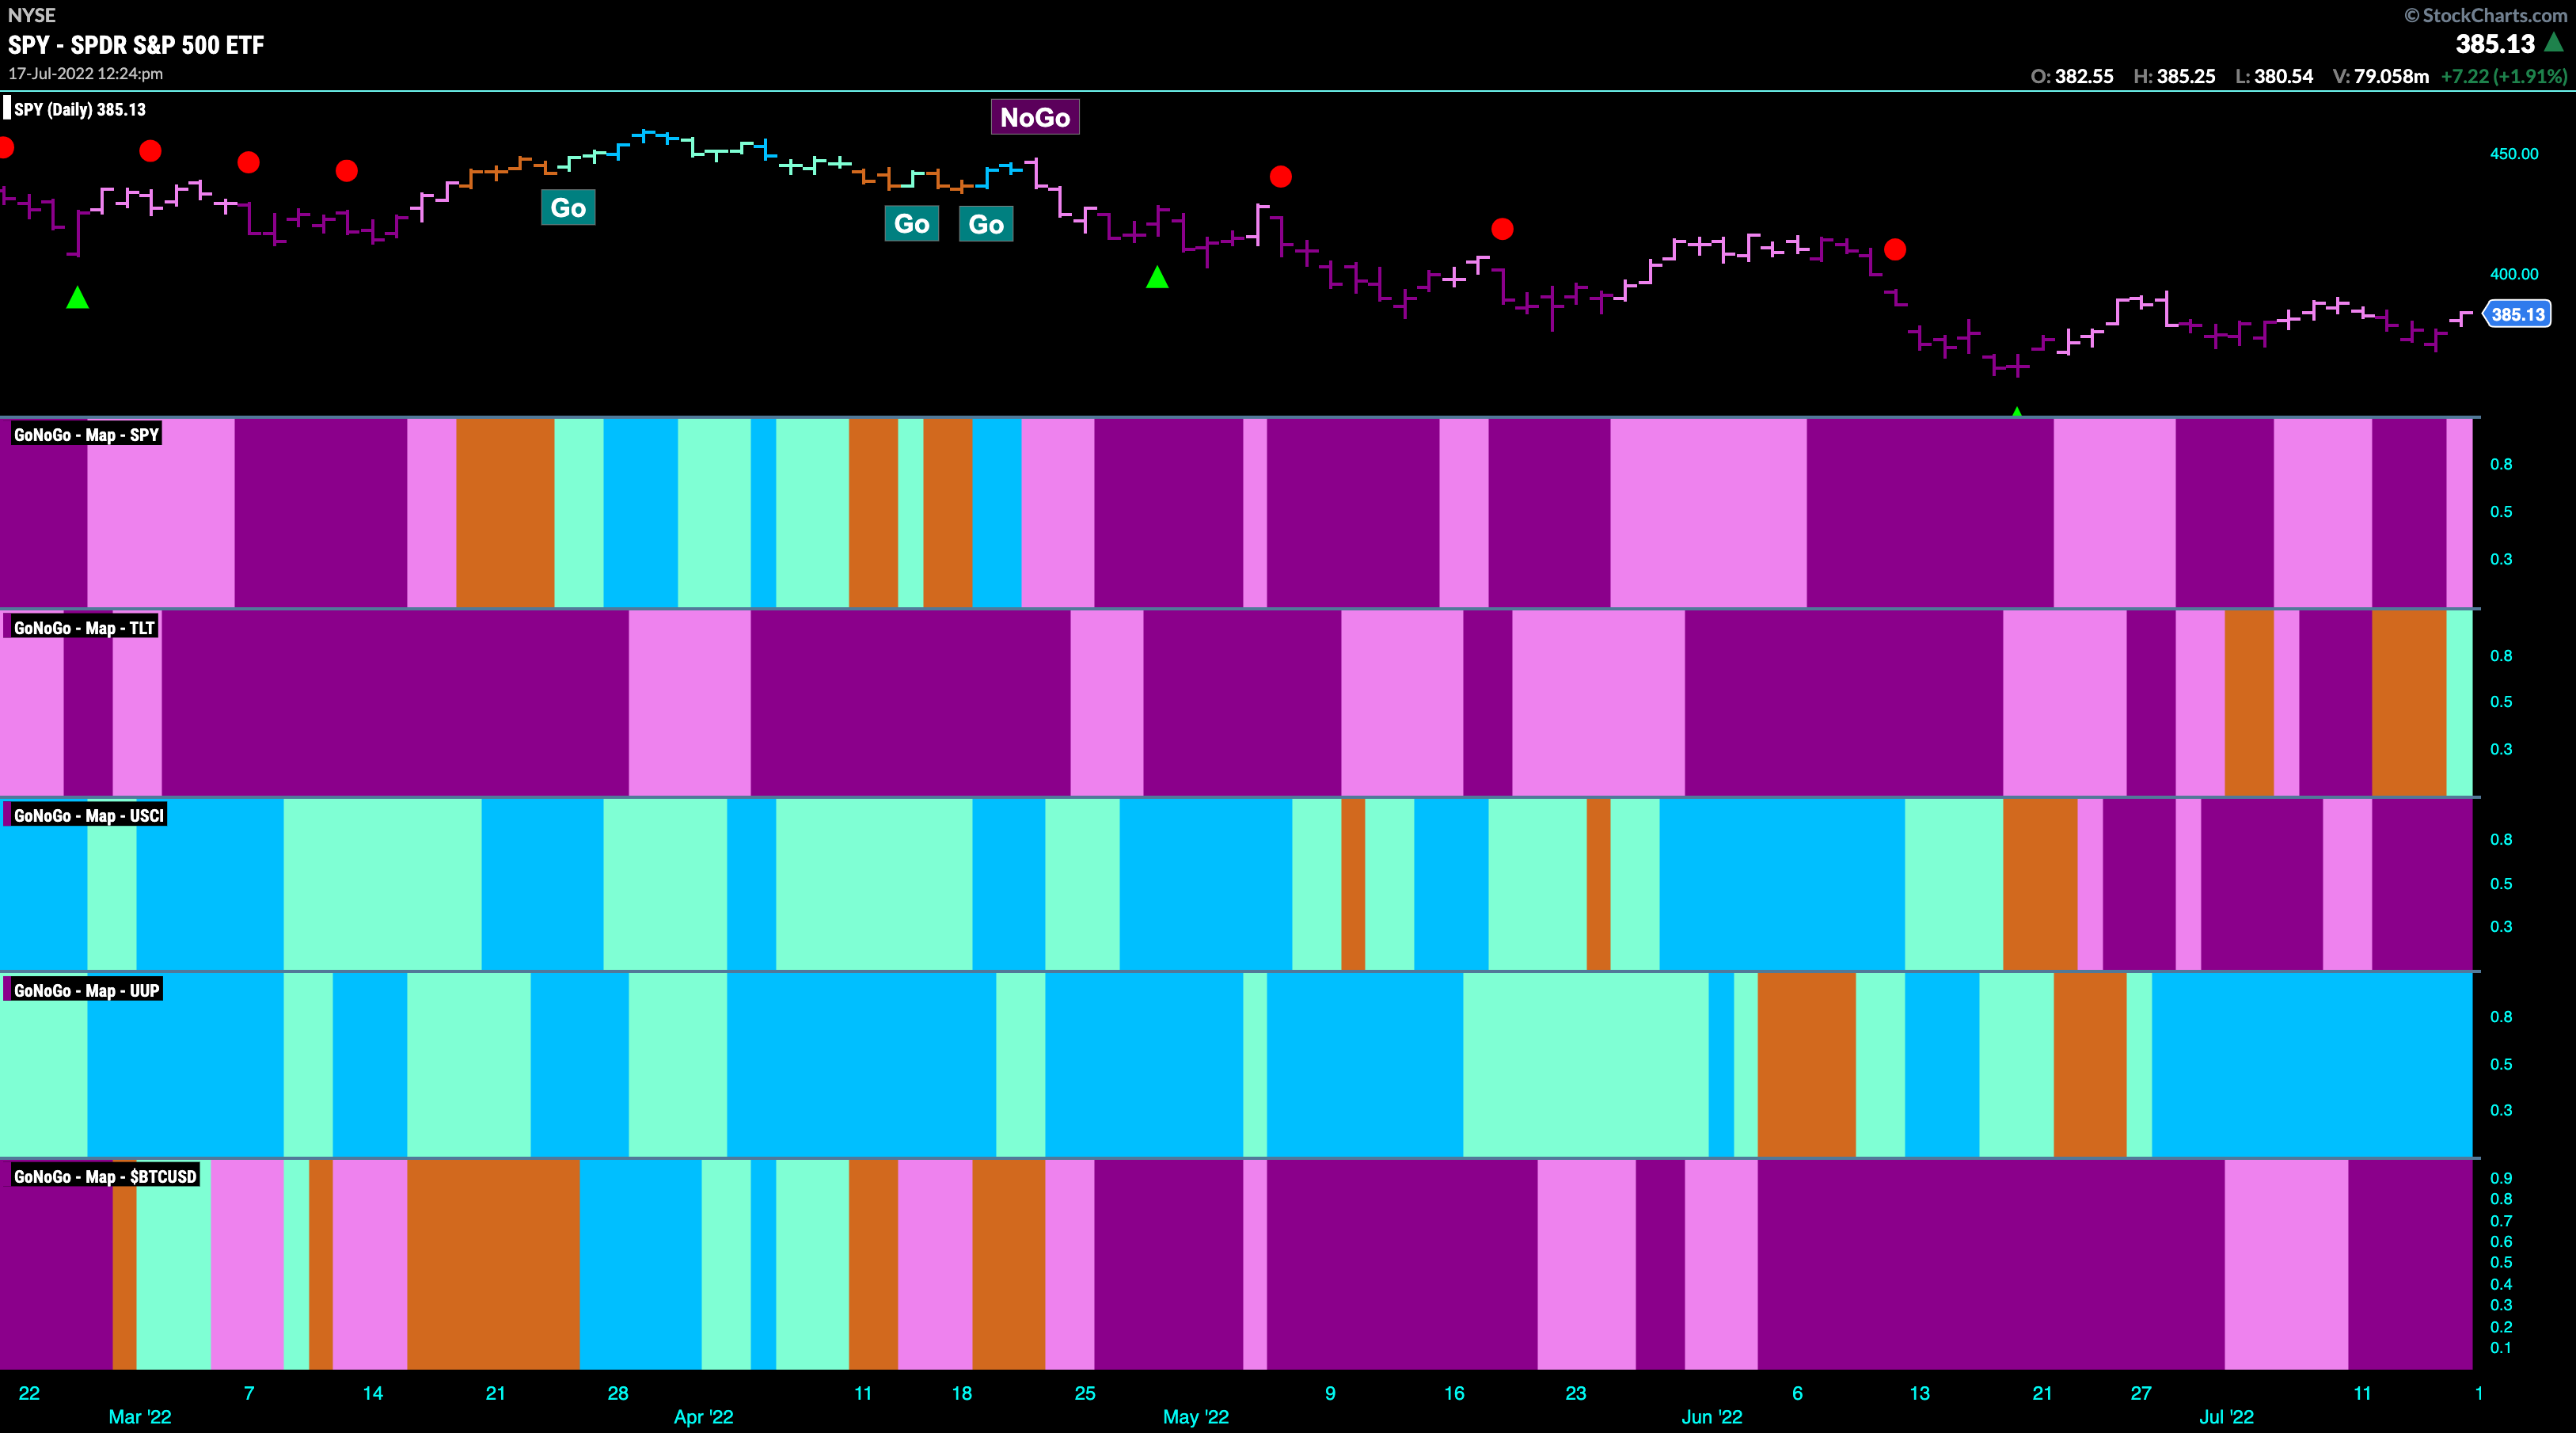
Good morning and welcome to this week’s Flight Path. Let’s take a look at the GoNoGo Asset map below. Equities in the top panel are painting a weaker pink “NoGo” bar as treasury bond prices emerge out of the “NoGo” to paint an aqua “Go” bar. Commodities remain in a strong “NoGo” bar and as the dollar continues to go from strength to strength.
Sector RelMap
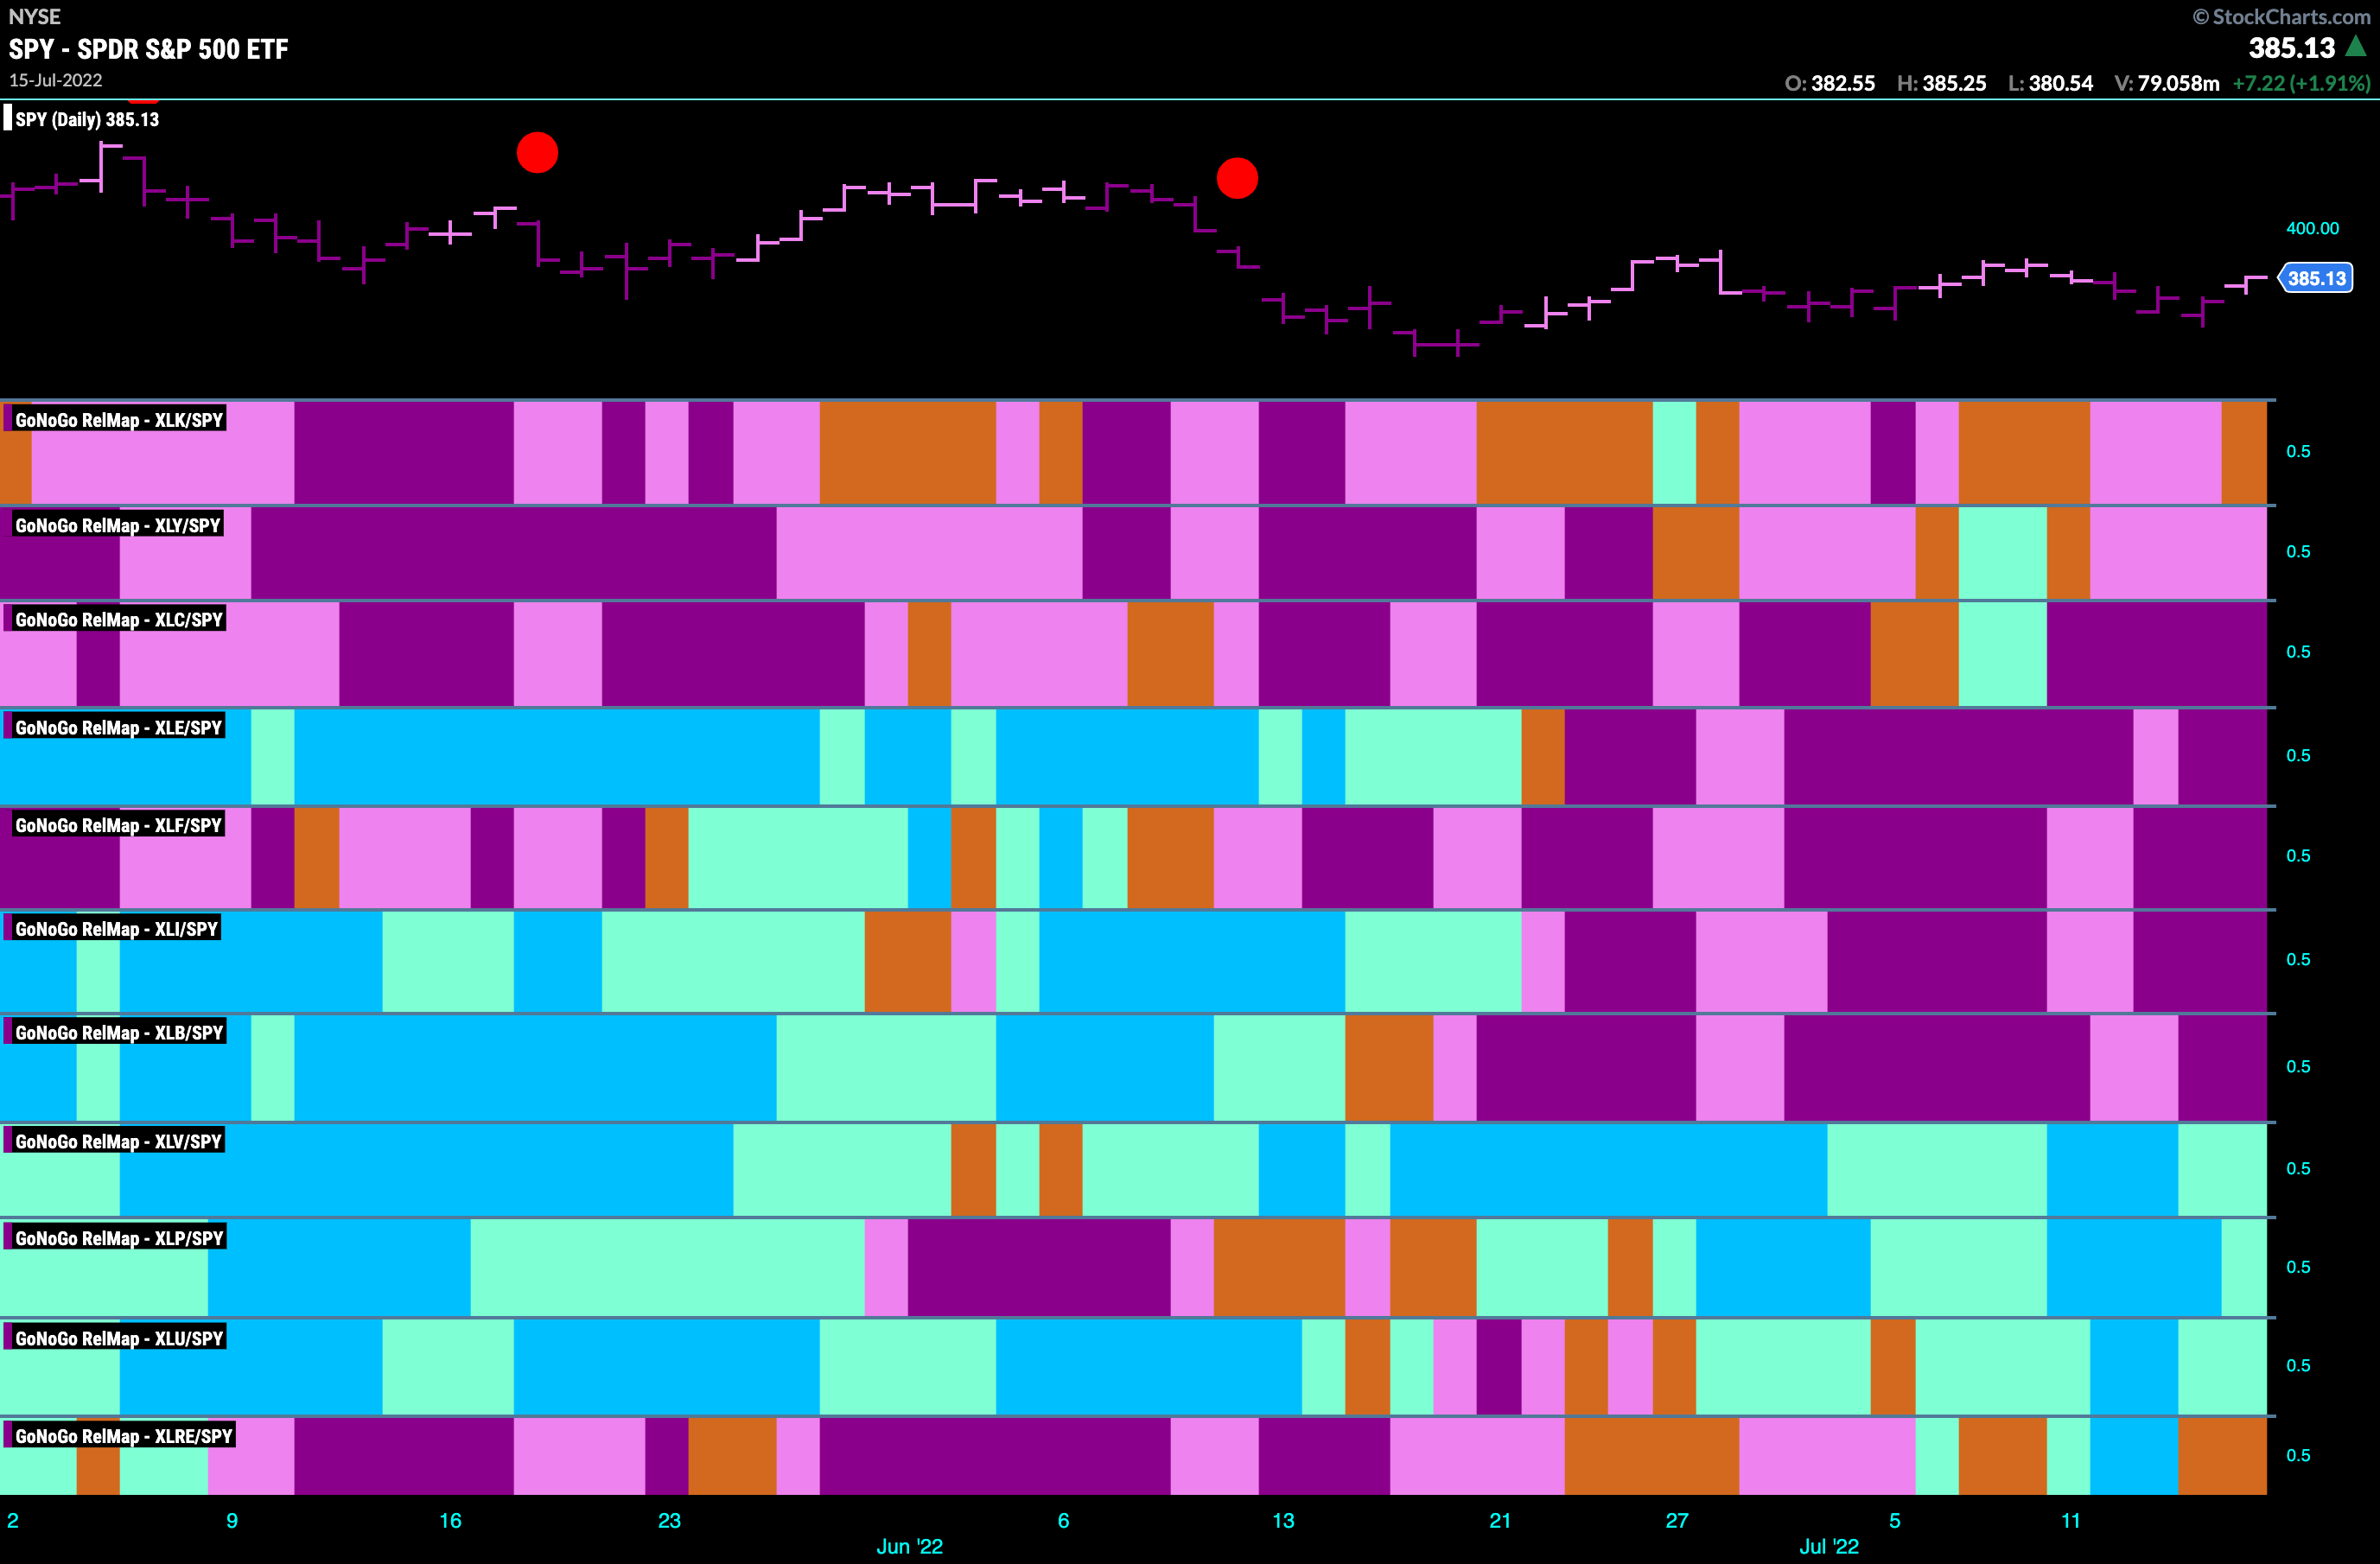
Below is the GoNoGo Sector Relmap. This GoNoGo Relmap applies the GoNoGo Trend to the relative strength ratios of the sectors to the base index. Looking at this map, we can quickly see where the relative outperformance is coming from as well as which sectors are lagging on a relative basis. The GoNoGo RelMap this week reverts to paint a defensive picture. The growth sectors resumed their struggles painting mostly “NoGo” bars while the only “Go” trends remain in healthcare, staples and utilities. Financials and energy continue to paint strong “NoGo” bars along with industrials and materials.
Rates Testing Resistance at the Zero Line
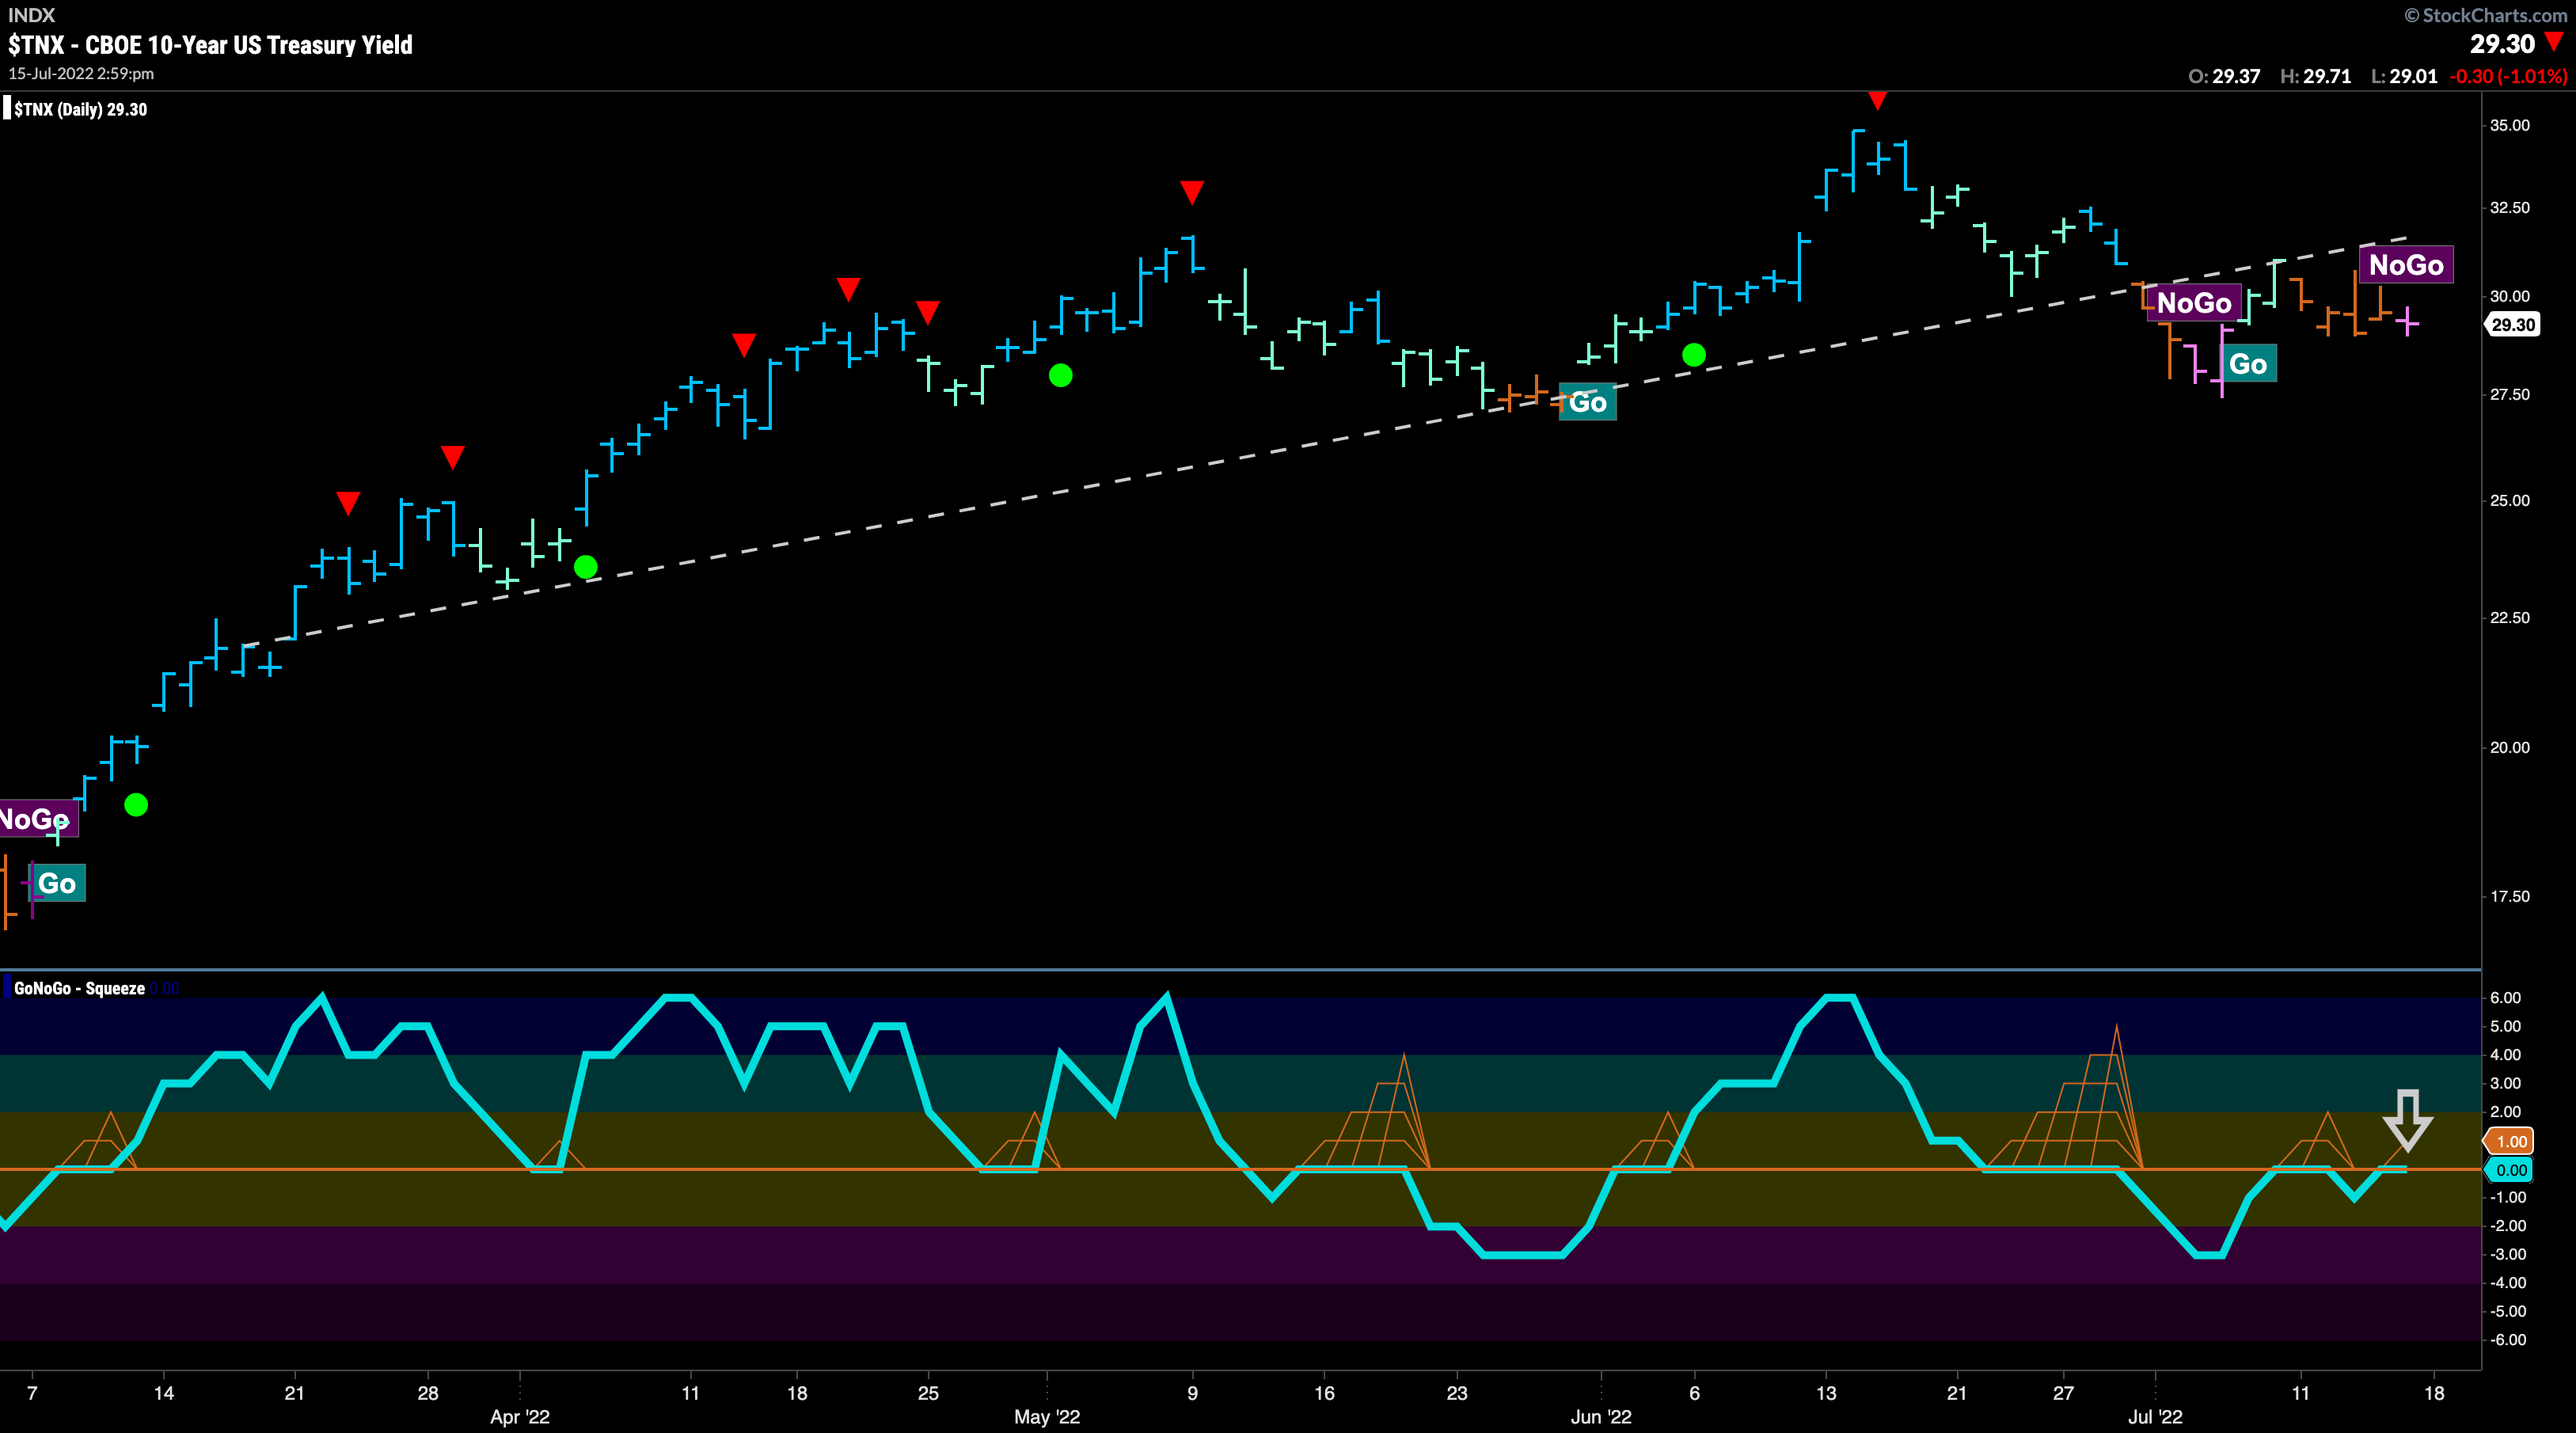
The fast rising rate environment that we have experienced this year seems to have taken a pause, as we see prices come off their recent high, outlined by a red Go CounterTrend correction arrow and have broken below upward sloping trend line as the Trend indicator starts to paint a few “NoGo” bars. We are at an important moment as the GoNoGo Oscillator tests the zero line from below where we will look to see if it finds resistance.
Oil Continues to Look Bearish
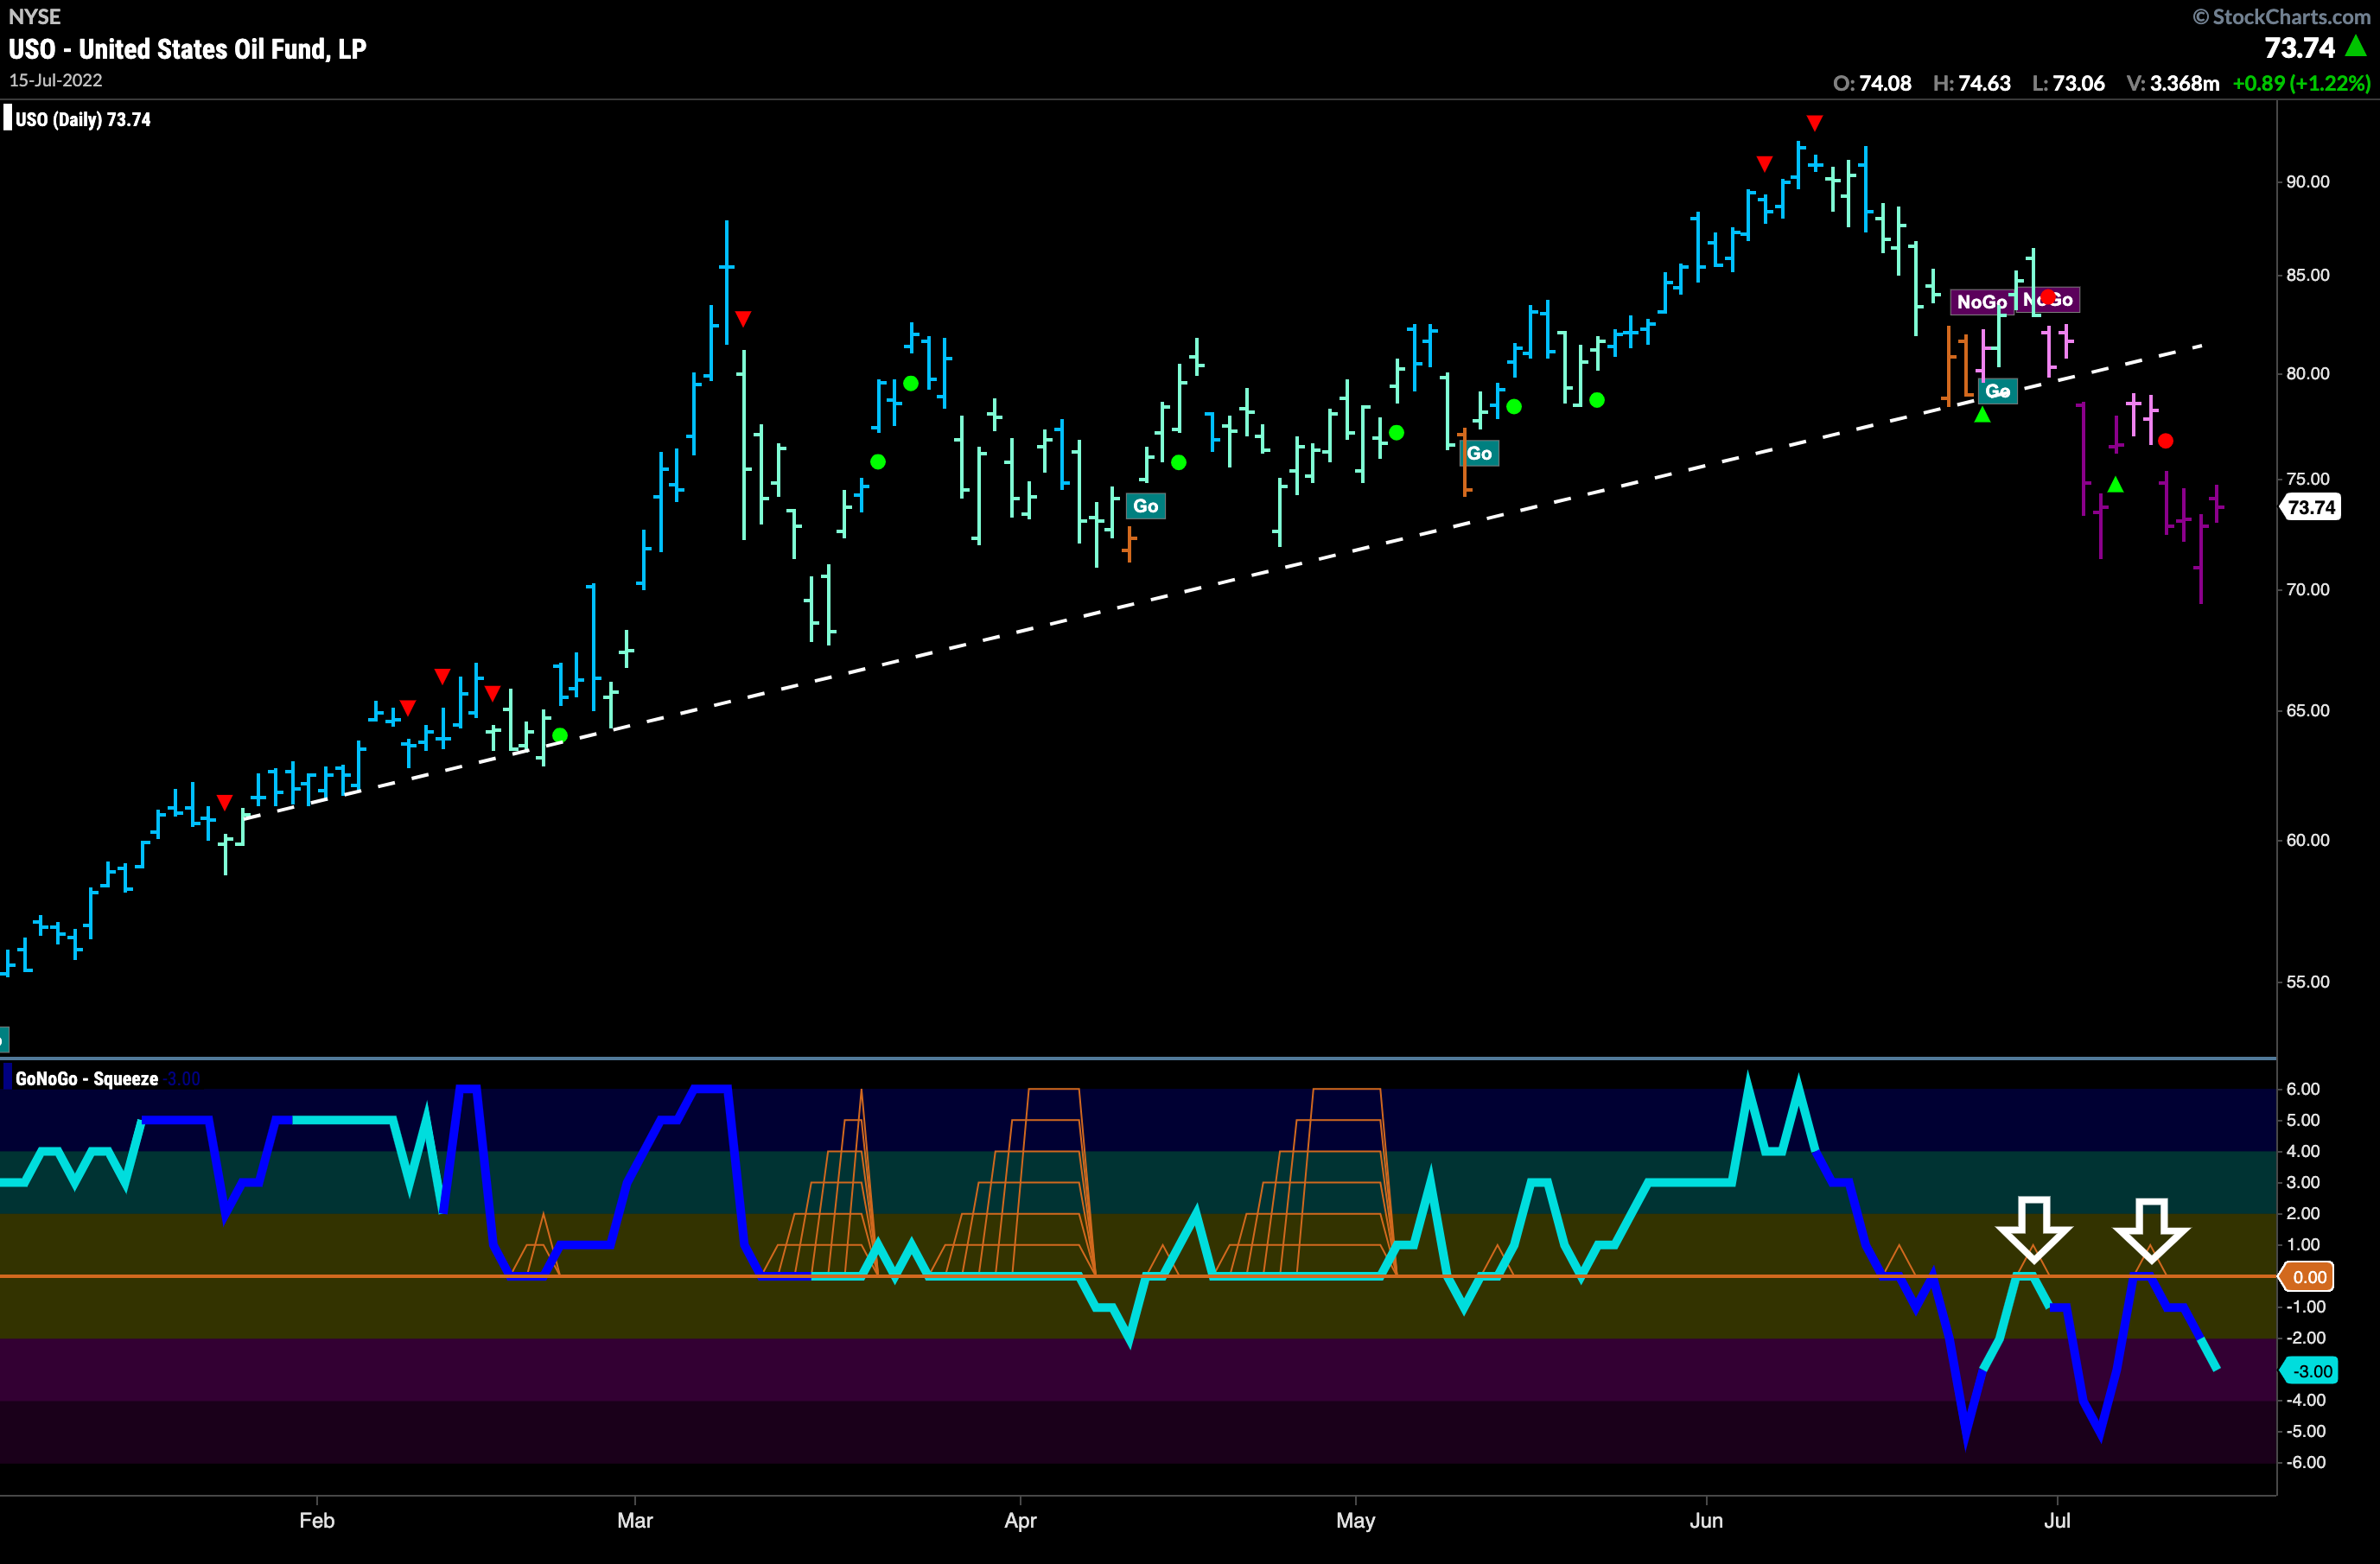
The GoNoGo Sector RelMap above showed us that the energy sector is underperforming the base index. Oil has been a driver of this recent under performance. Let’s look at the chart below. As the “NoGo” continues we look to the oscillator to see if it can get back above the zero and so far we see that it has been twice turned away, indicating that there is negative momentum, in the direction of the “NoGo”. This “NoGo” now looks established and it would take quite an upward movement in price to change that.
Valero Testing Strength of “NoGo”
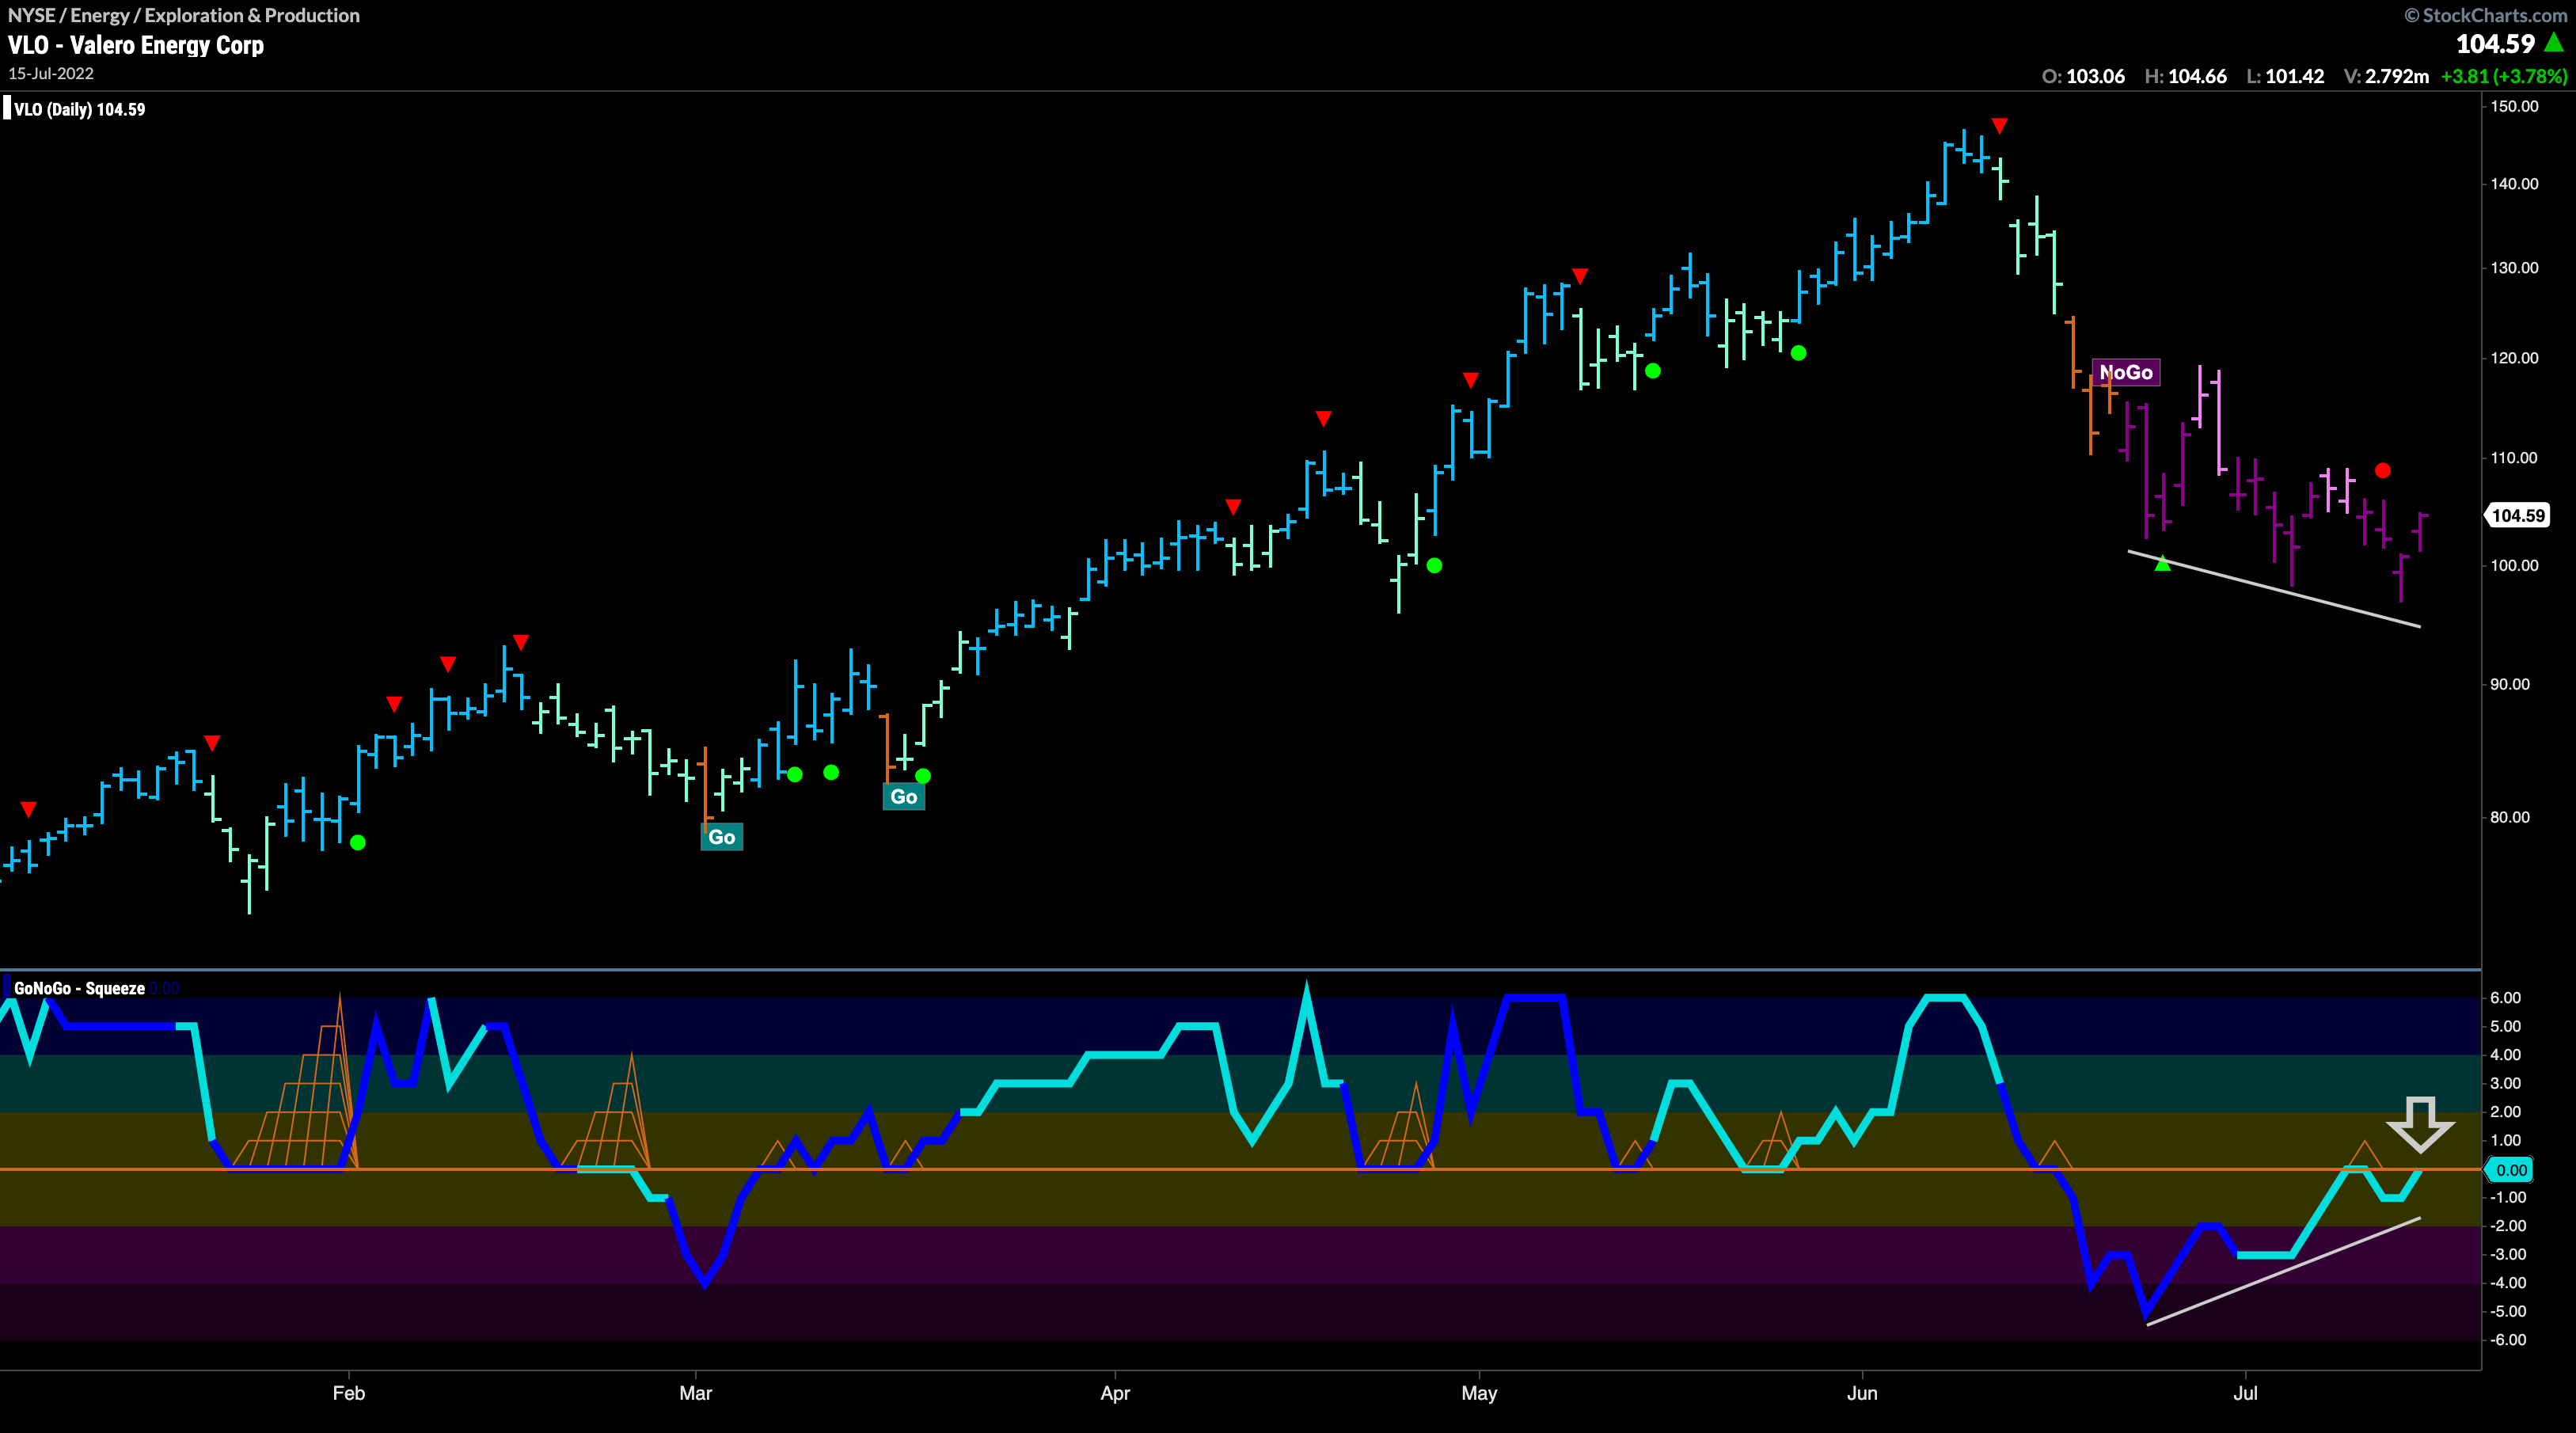
Above we saw the strength of the ‘NoGo” trend in oil. Let’s turn our eye to the chart of $VLO below. If the “NoGo” in oil is to persist, we could look for an opportunity to participate on the short side. As we can see, GoNoGo Trend is painting strong purple “NoGo” bars as price makes lower lows. GoNoGo Oscillator however, has been making higher lows as it rises to test the zero line from below. This is bullish divergence. We can see this going one of two ways. either the GoNoGo Oscillator will again get turned away by the zero line, signaling renewed downside momentum in the direction of the “NoGo” trend. If this happens we can expect price to move lower. In the other scenario, it will break above zero, threatening the strength of the “NoGo” we see in price.
Financials to Fall Further?
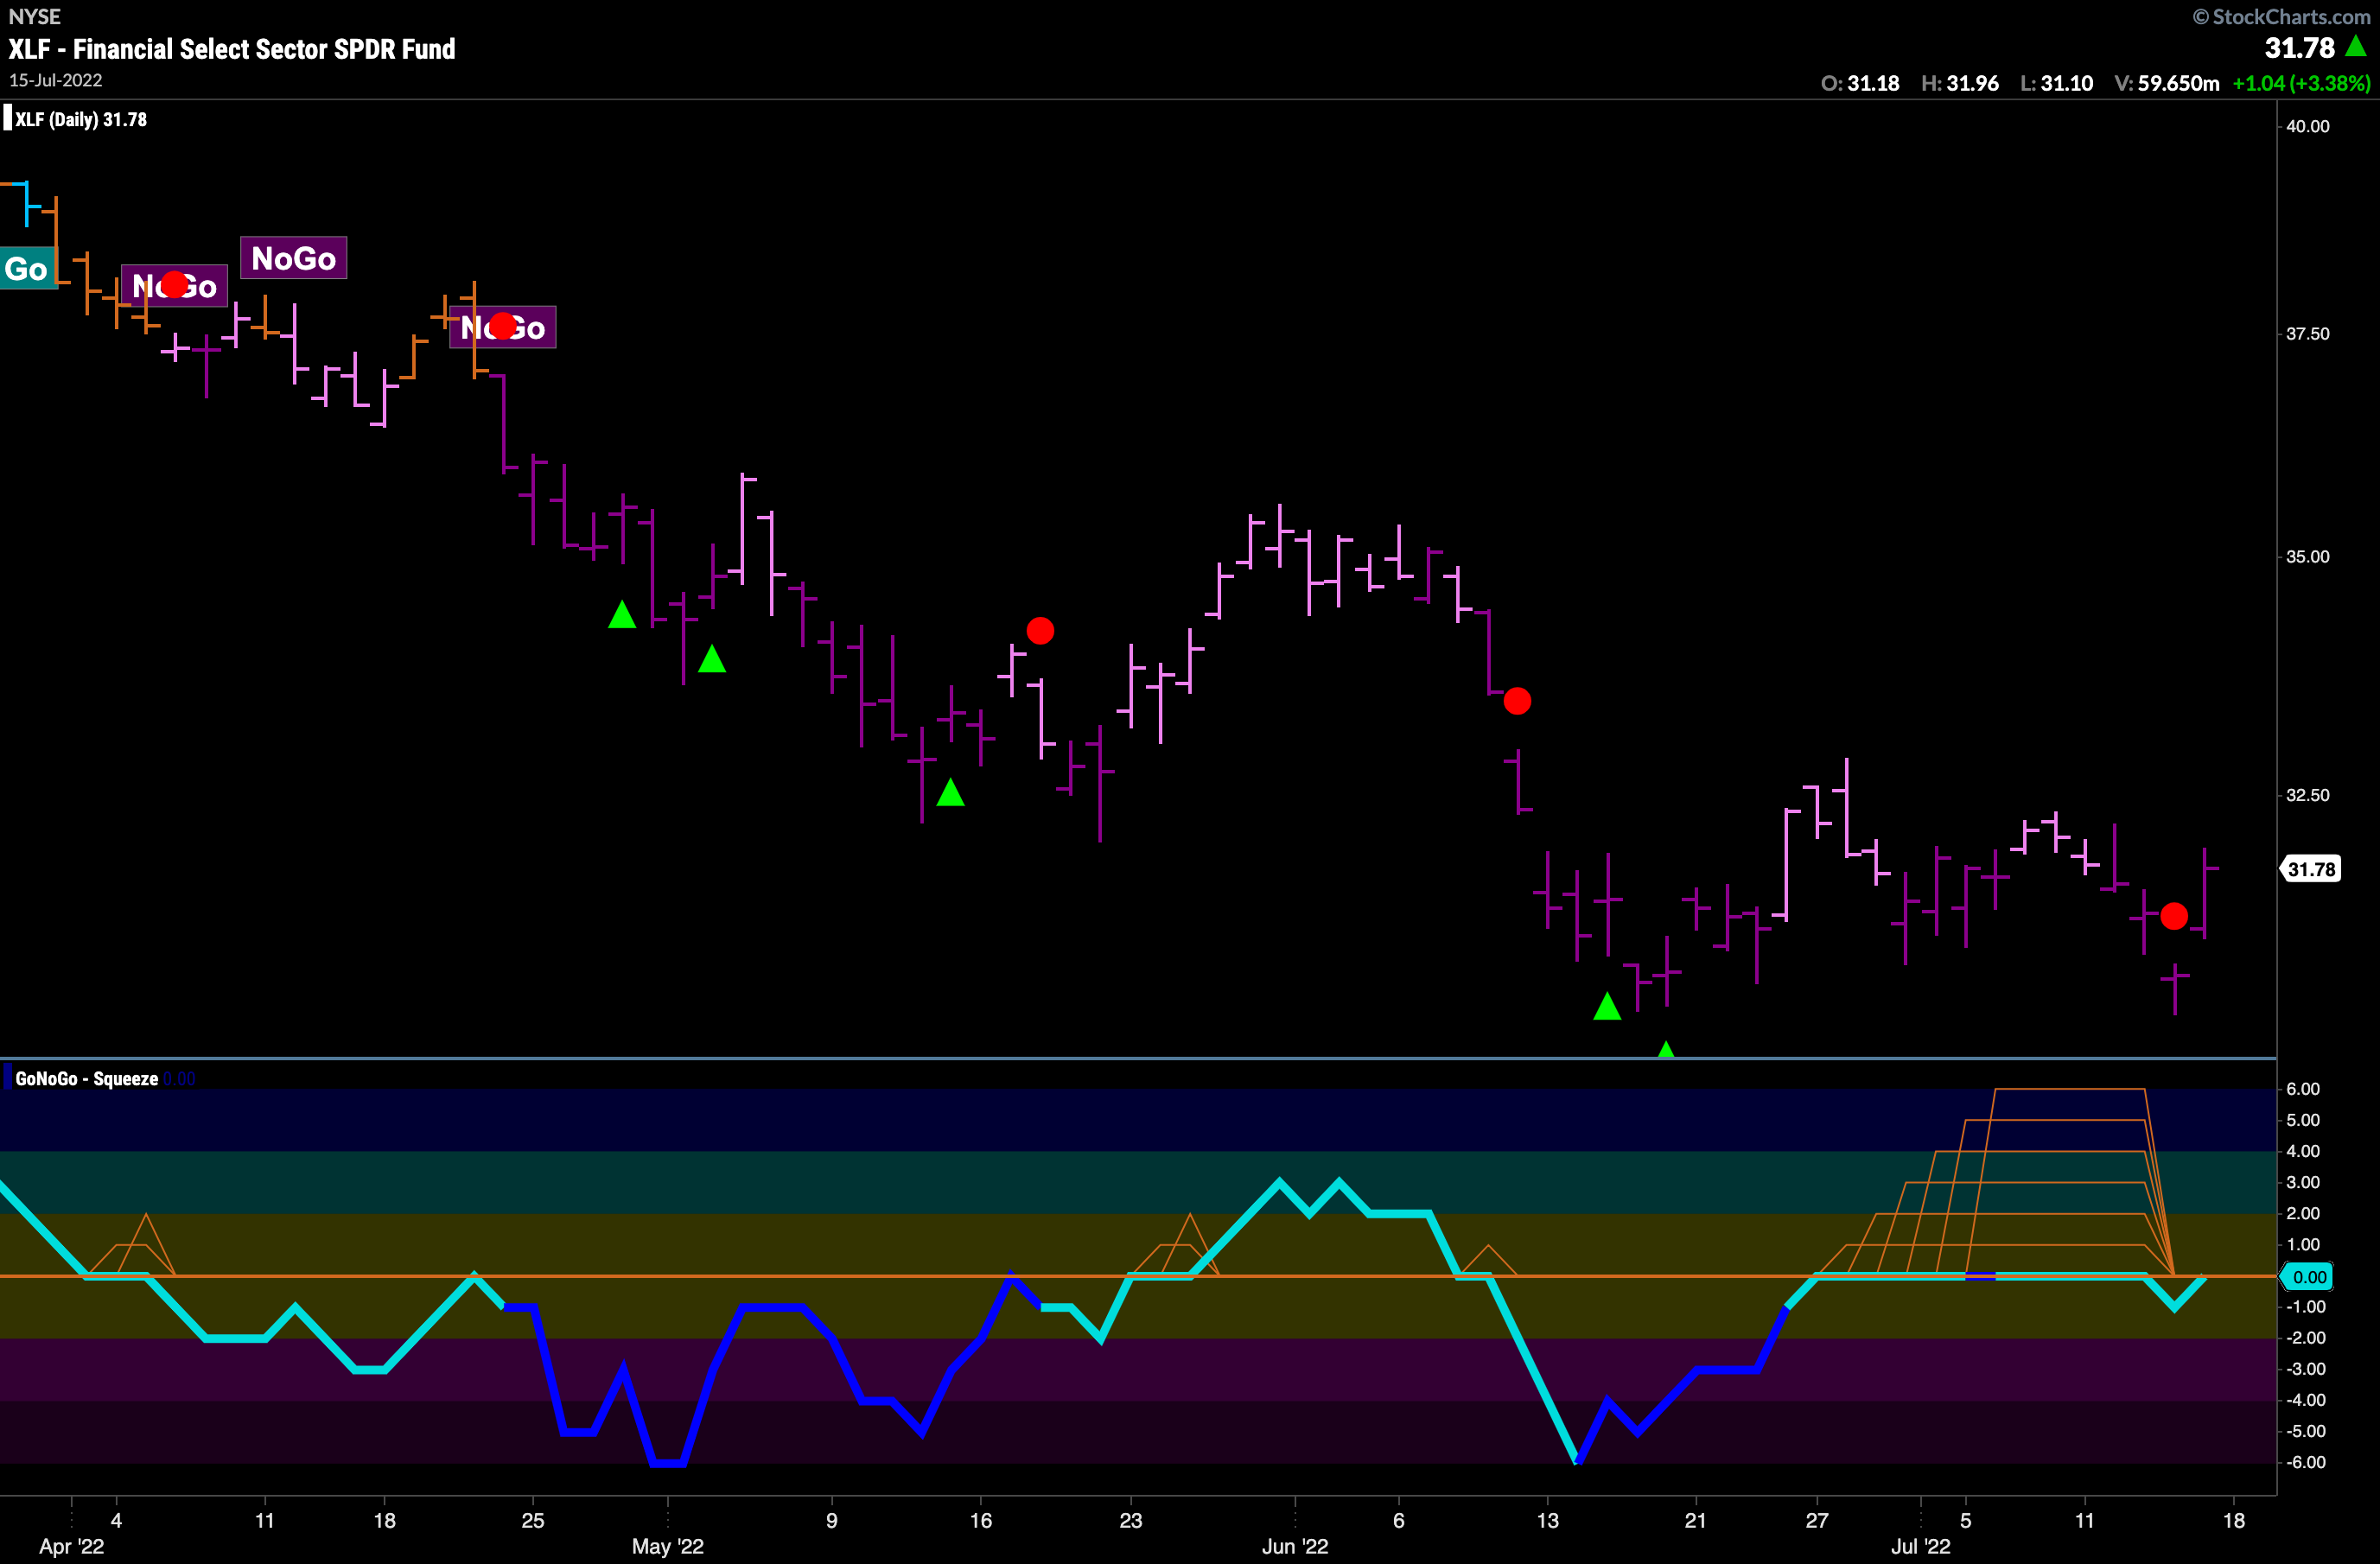
Another sector underperforming the base index is the financials sector. The chart below visualizes the tug of war between the bulls and the bears. With a strong “NoGo” in place we are seeing a max GoNoGo Squeeze broken to the downside during price consolidation. All else being equal, we would expect price to make a run at prior lows even as Friday’s price bar rallied enough to push the oscillator right back to zero.
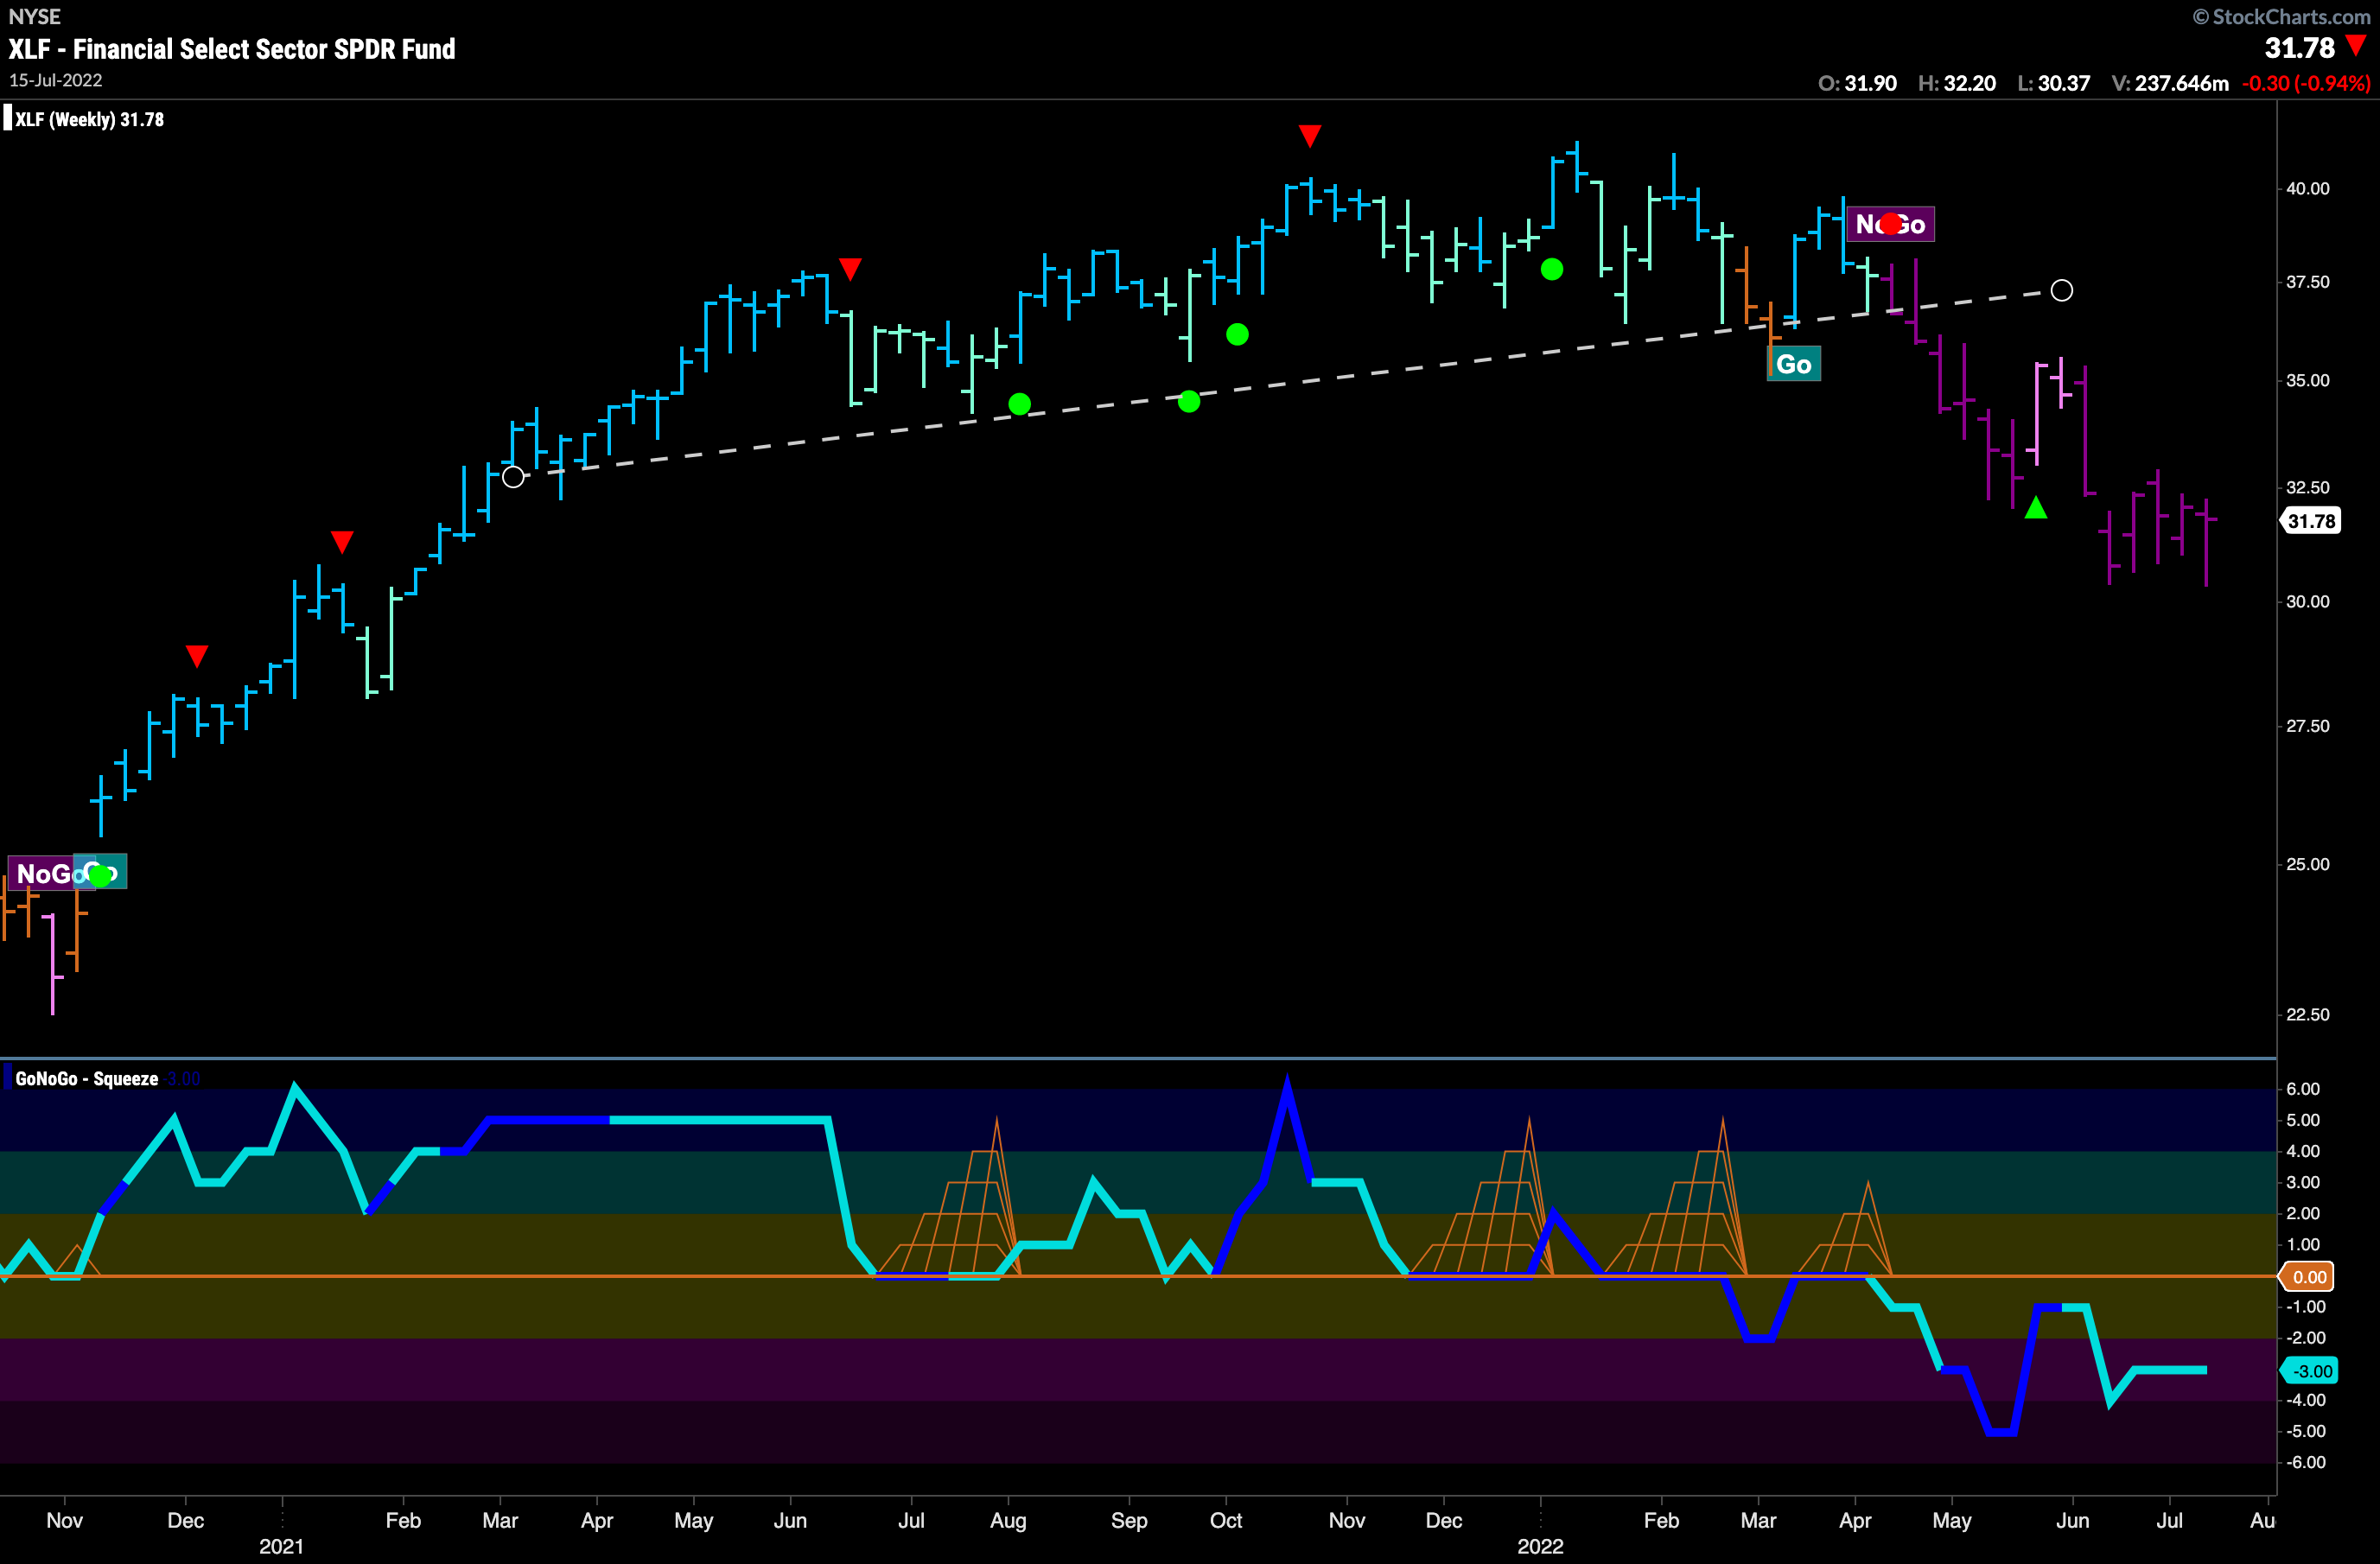
The weekly chart shows the strength of the “NoGo” trend that is in place. having broken through the upward sloping trend line a few months ago, we see mostly uninterrupted purple “NoGo” bars and GoNoGo Oscillator below zero the entire time. Currently it is in negative territory but not oversold. This larger time frame perspective suggests any relief in the short term could be temporary.
Bank of America Testing Resistance
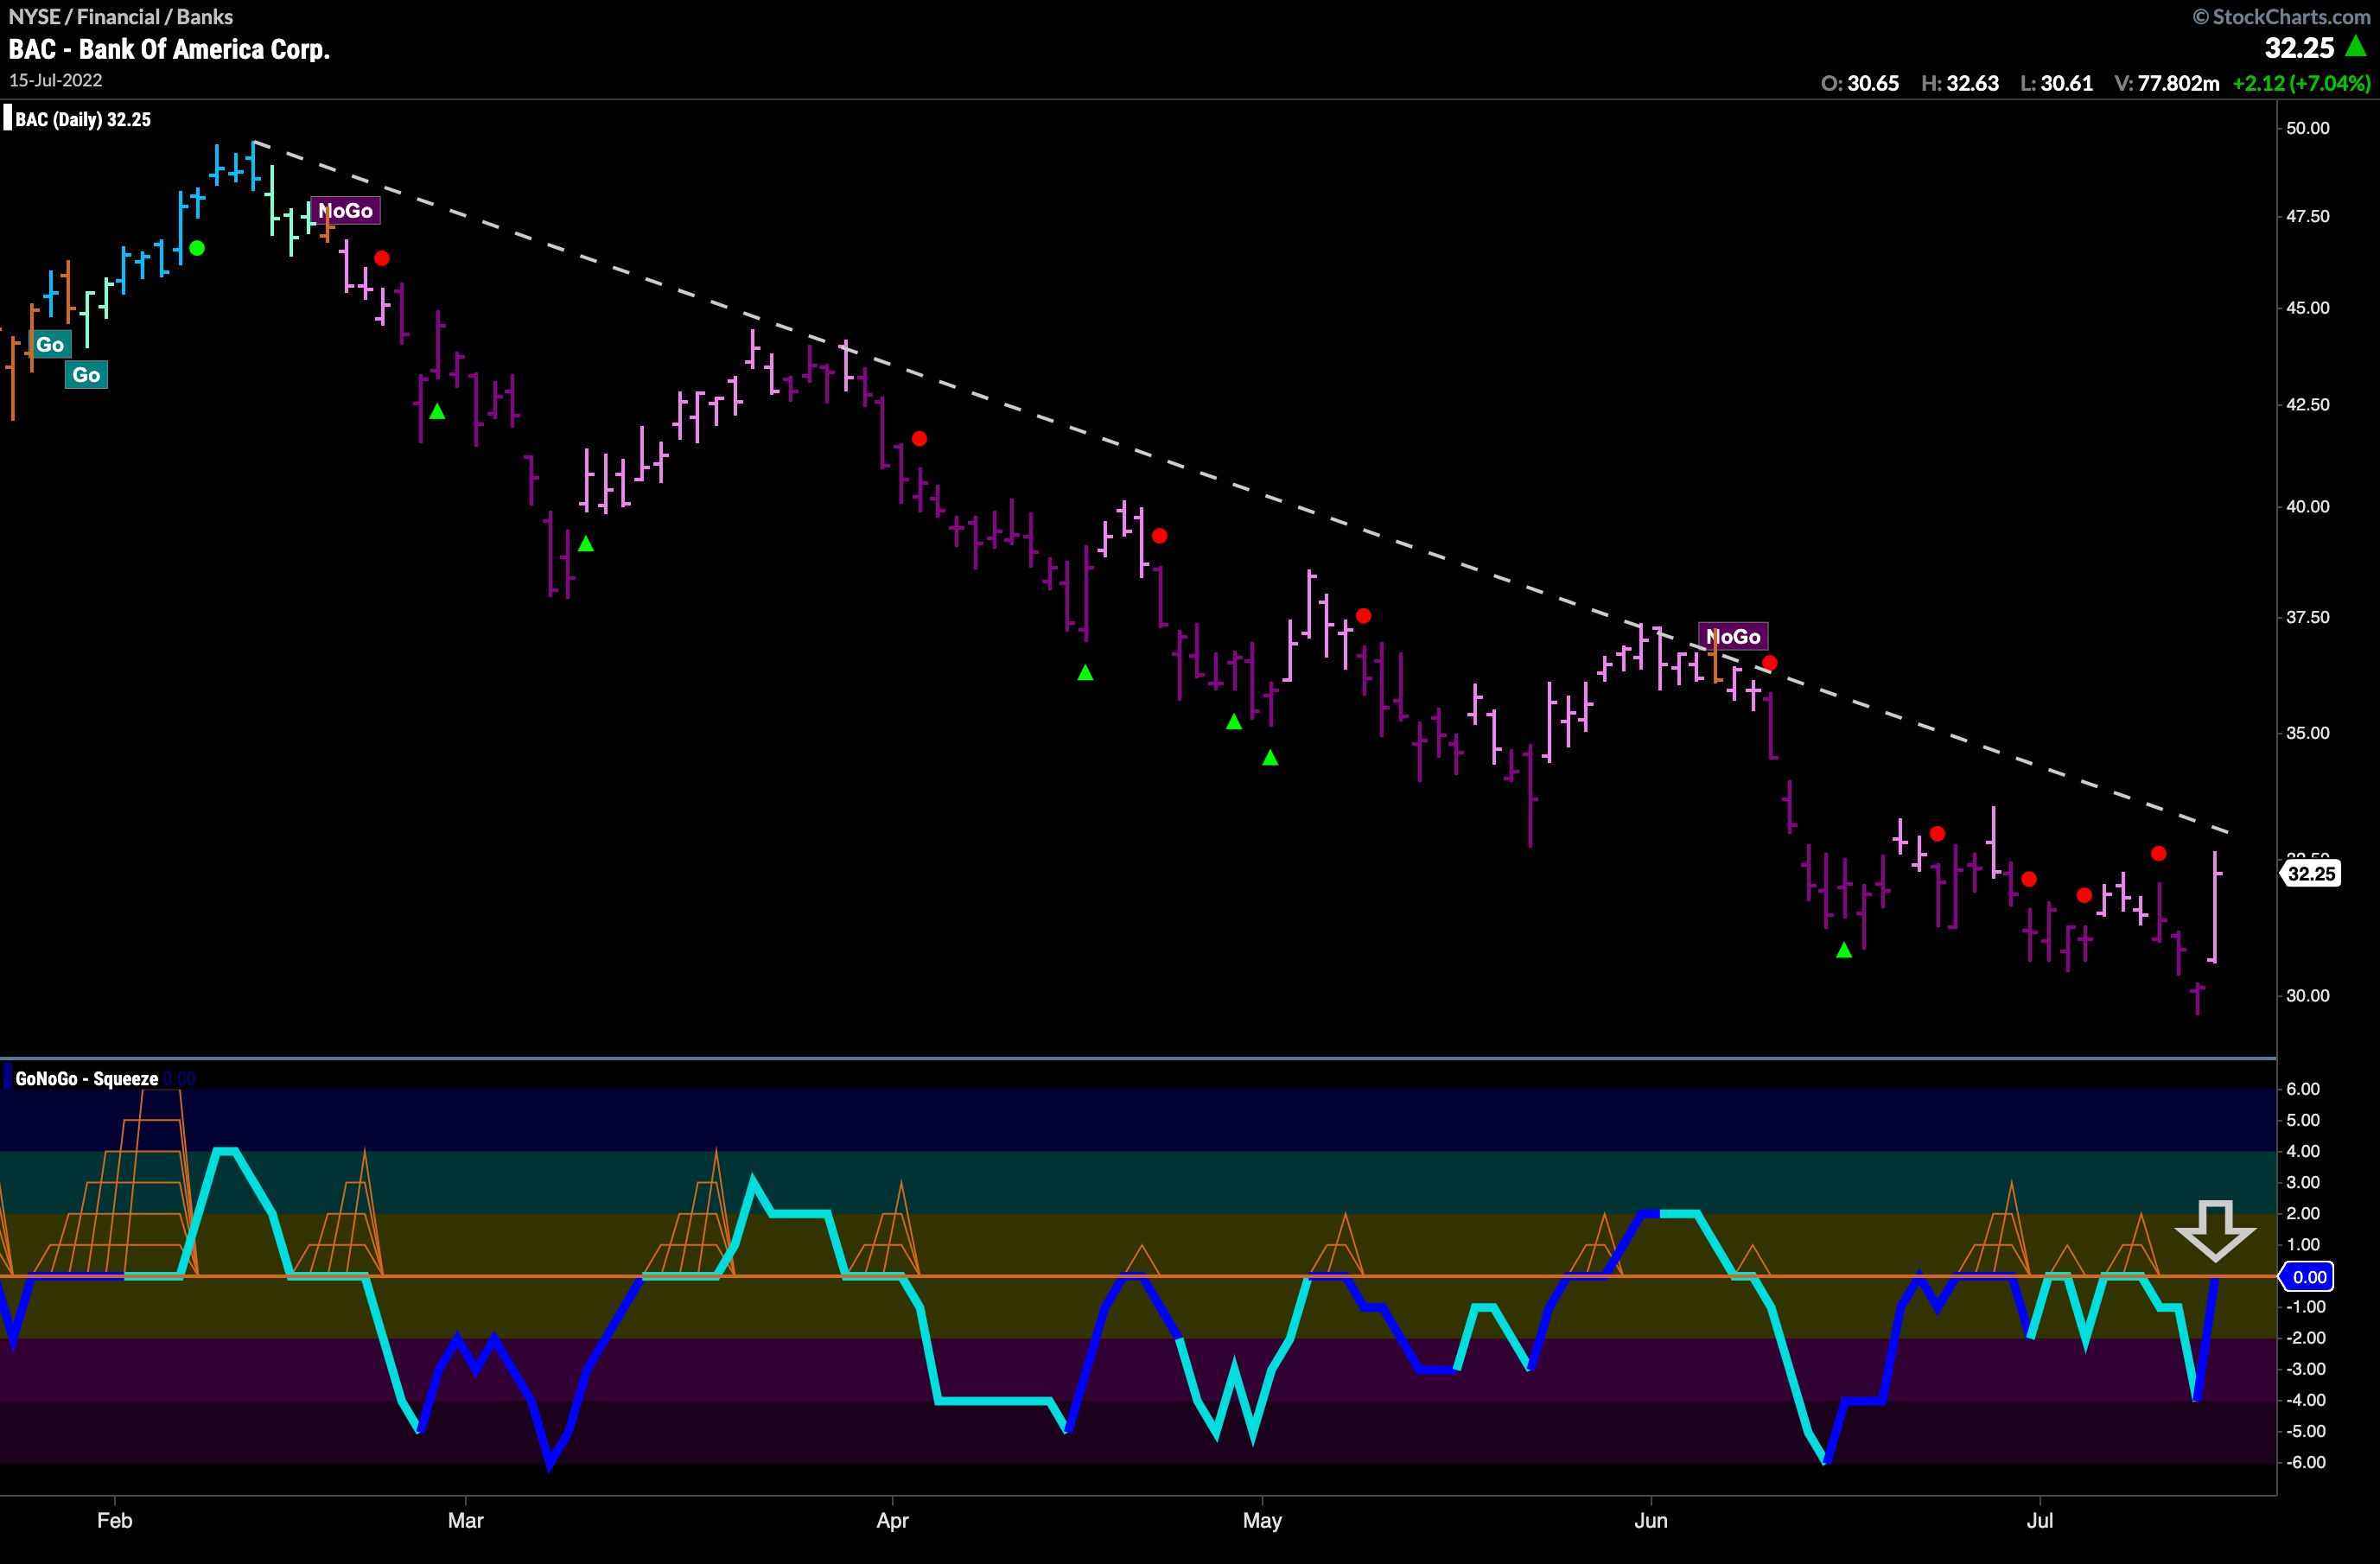
Given what we see from the trends in the financial sector, we can look at an individual security for an opportunity to participate in the “NoGo” trend. Bank of America is in a “NoGo” but painted a weaker pink bar on Friday. This rally has brought price close to the downward sloping resistance line and caused GoNoGo Oscillator to rise to test the zero line from below. If we see a failure at this level, we will see a NoGo Trend continuation red circle, offering a relative low risk entry into the down trend.
Johnson and Johnson Just Holding On
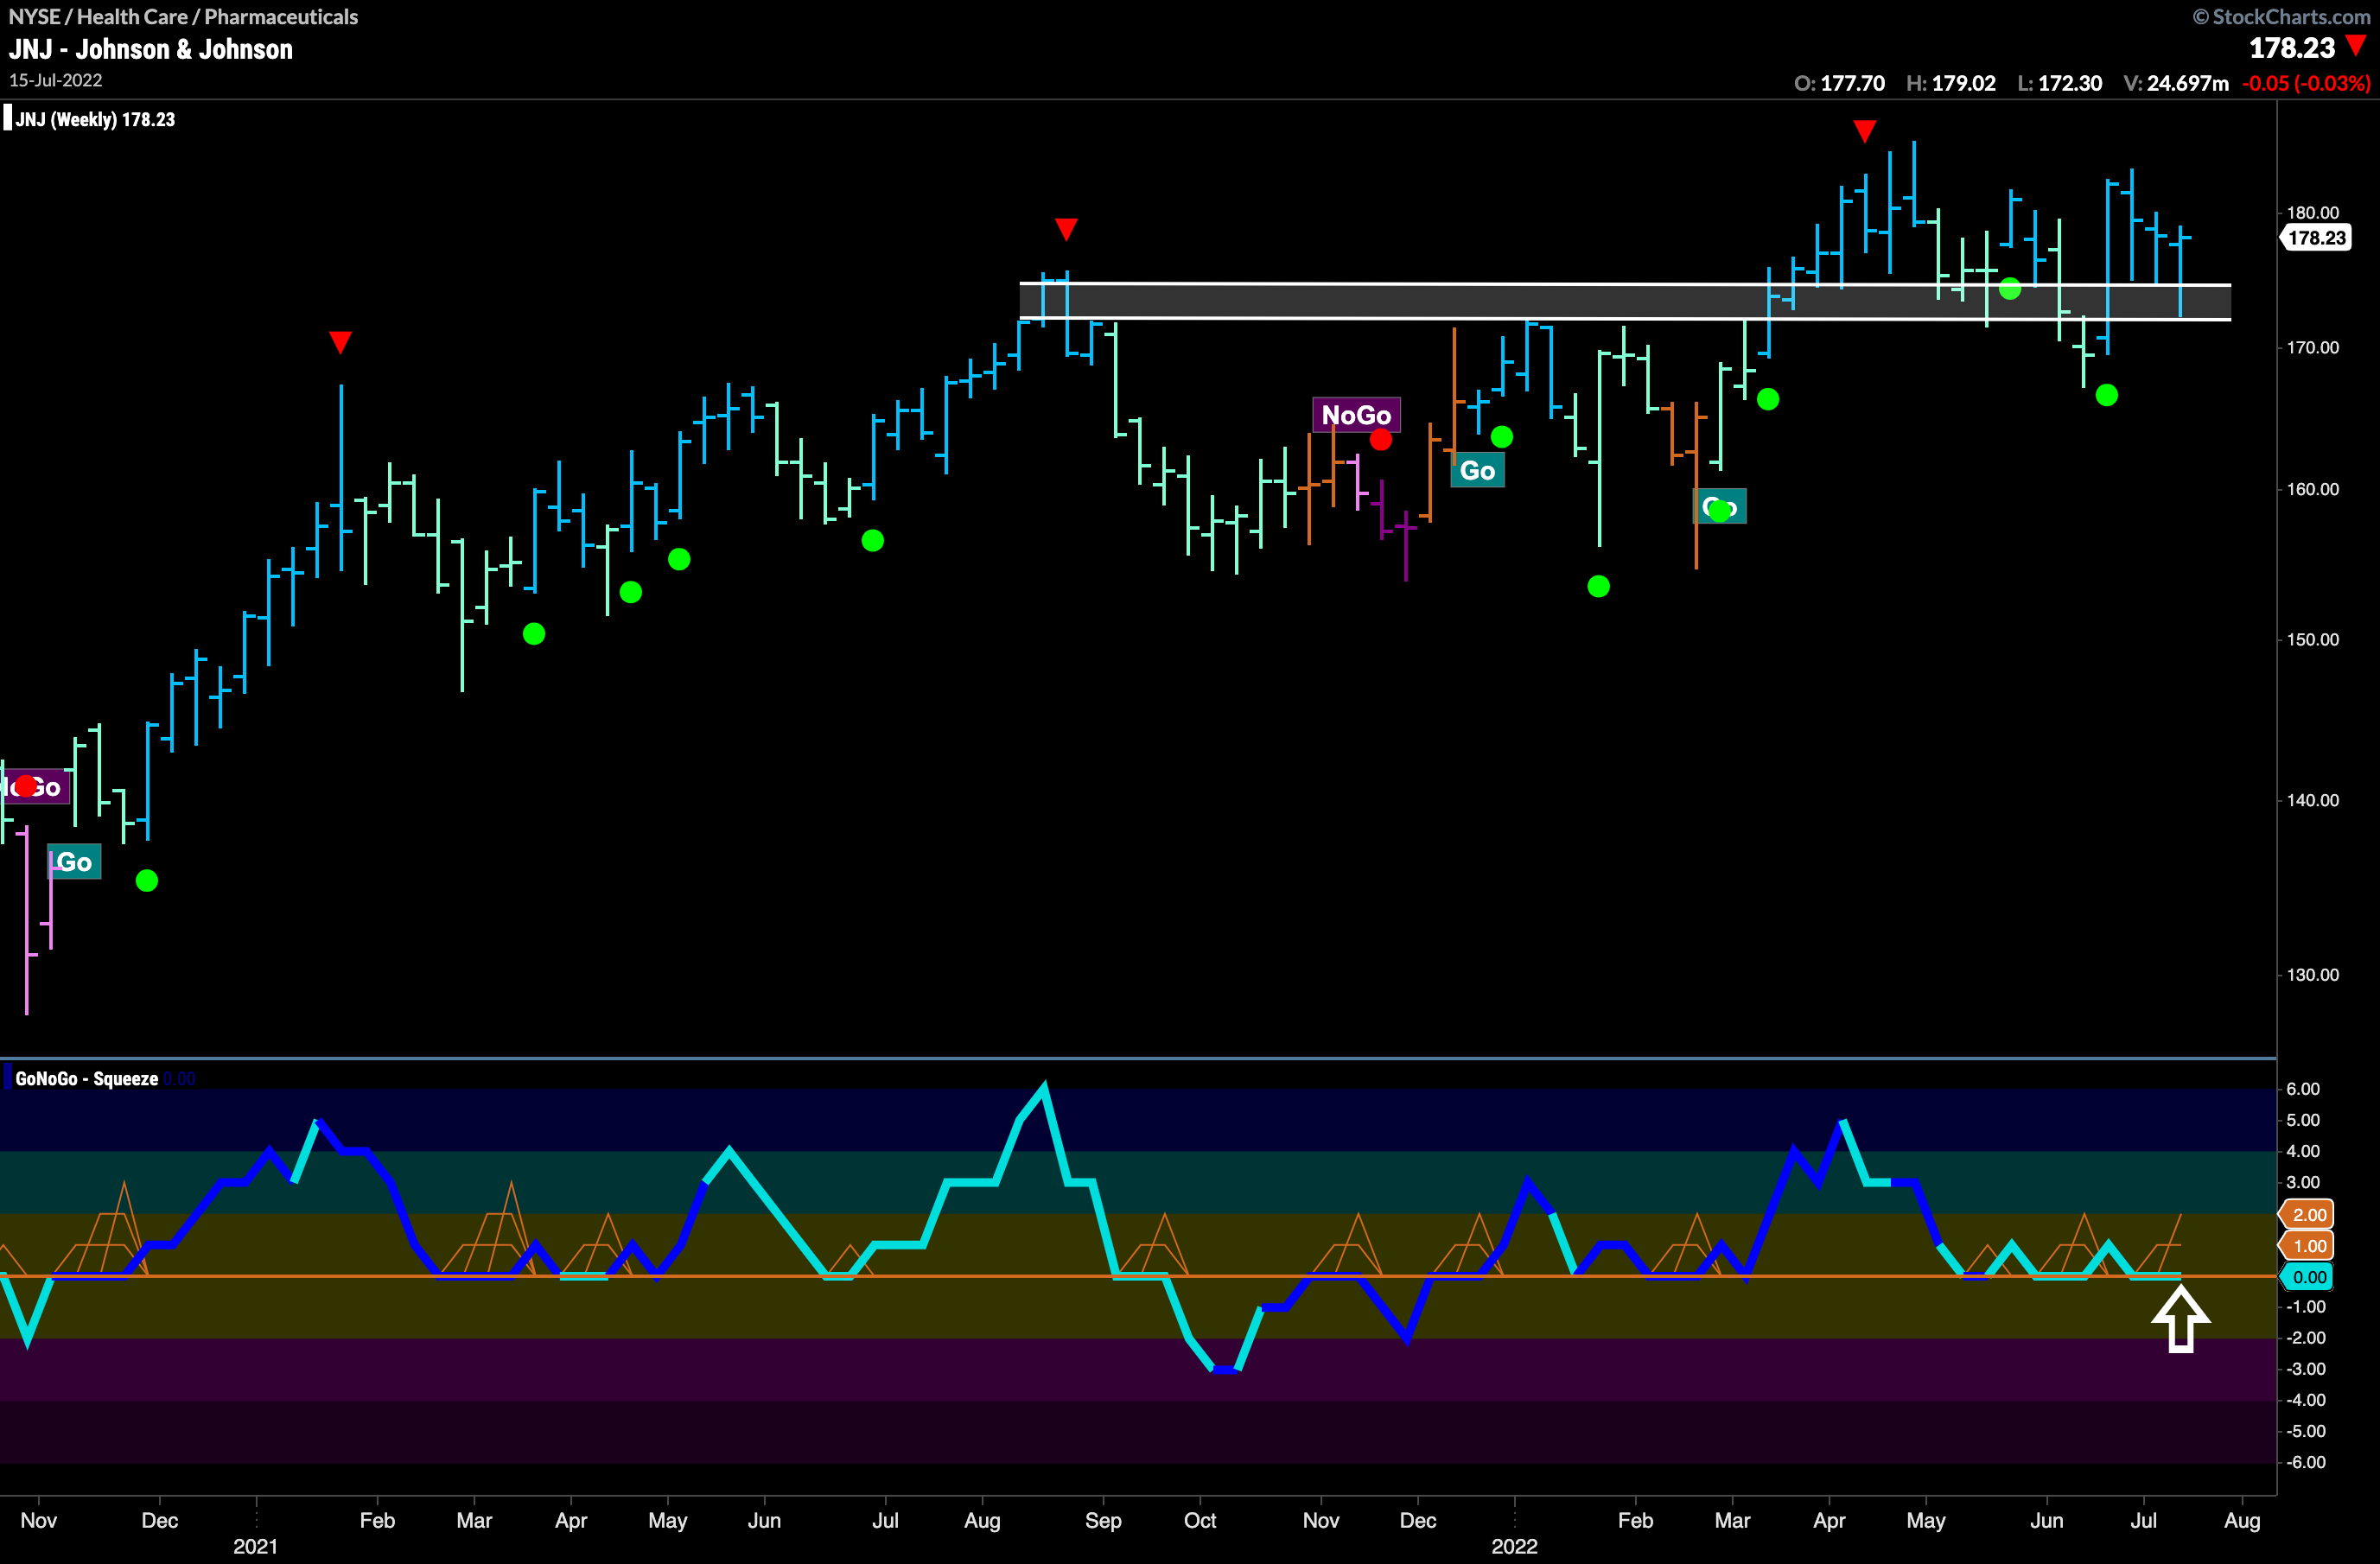
Anything to be bullish about? We saw from the Sector Relmap that healthcare is an outperforming sector. The chart below shows the GoNoGo Chart of $JNJ. With price above support from prior congestion highs, and GoNoGo Oscillator finding support at the zero line we can be bullish until this is no longer the case. Watch the oscillator and if it rallies once again into positive territory we will see a Go Trend Continuation green circle under price suggesting momentum resuming in the direction of the “Go” trend and we would look for price to make an attempt at a new high.
Brave Enough to be Bullish on Bitcoin?
The GoNoGo Chart below shows the world’s largest cryptocurrency with the GoNoGo suite of tools applied. We see price basing as it moves mostly sideways since the low from mid June. GoNoGo Trend is painting a string of amber “Go Fish” bars as the indicator is unable to continue to paint “NoGo” bars. As the trend shows uncertainty, we see price approaching resistance from the highs of the range. GoNoGo Oscillator has been making higher lows as it struggles to stay on one side of the zero line. Currently above zero, we’ll need to see the oscillator remain in positive territory if the price trend is going to reverse.
