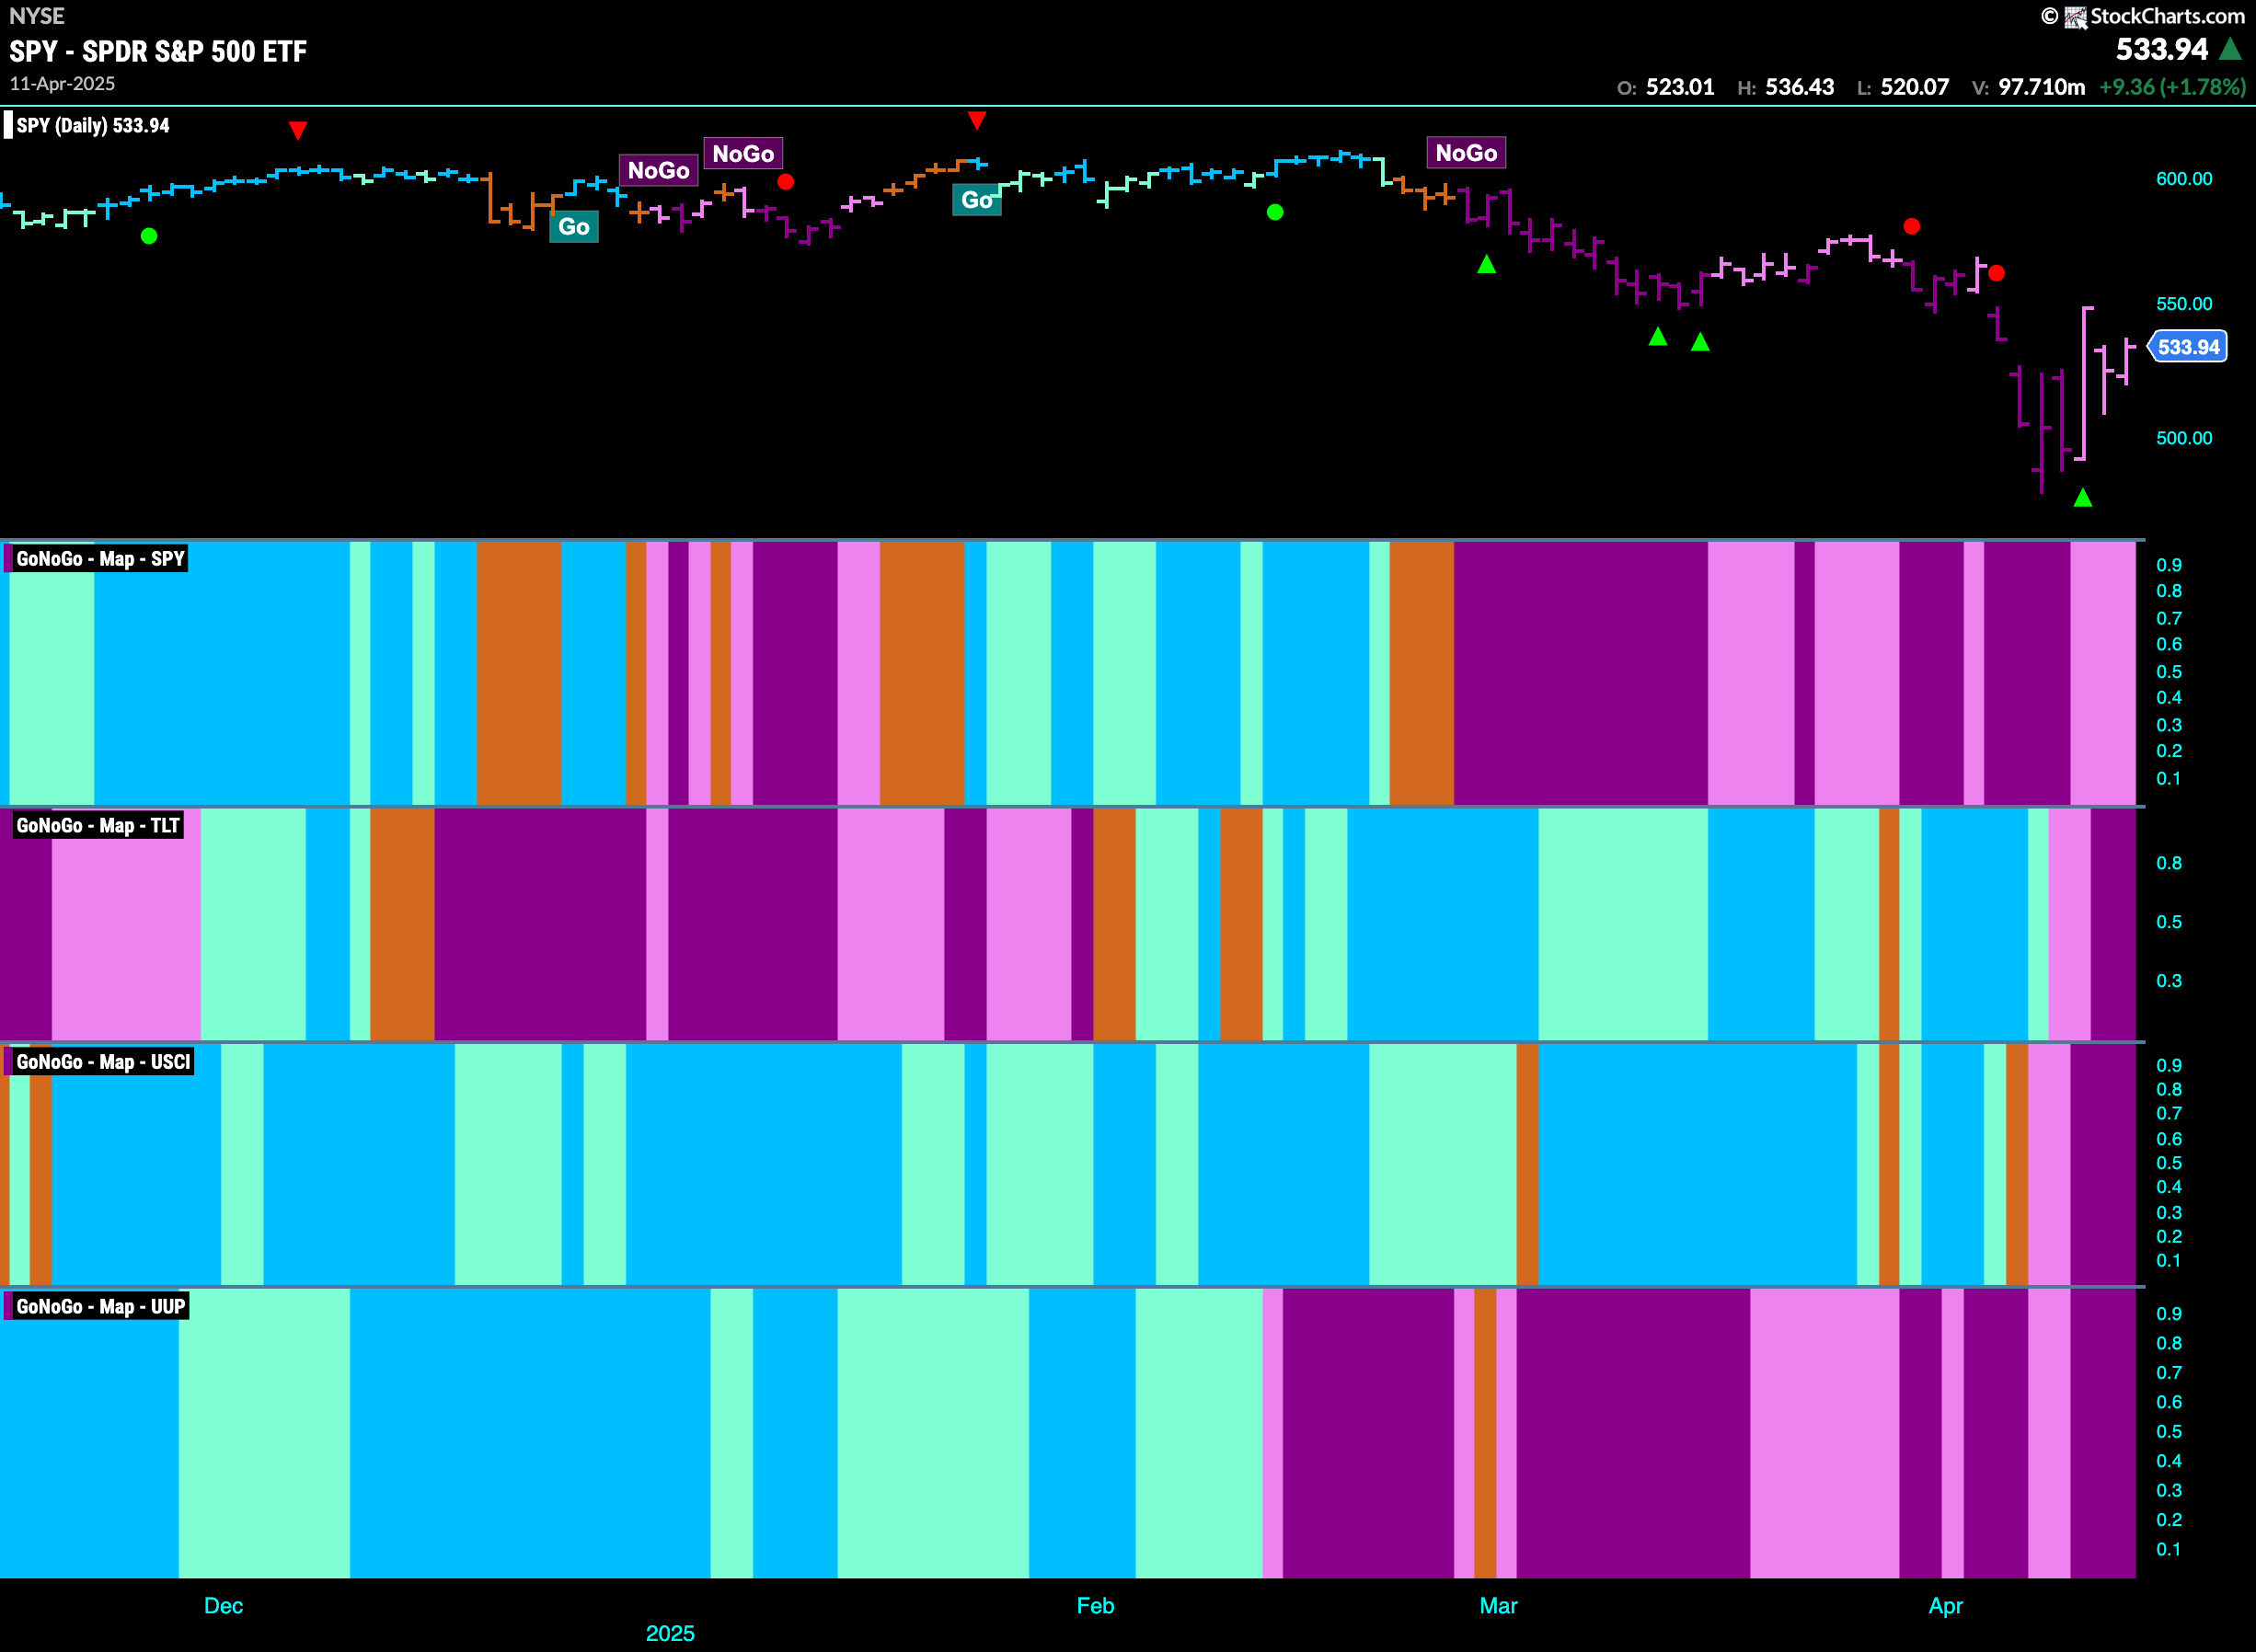
Good morning and welcome to this week’s Flight Path. The equity trend is a “NoGo” again this week and we saw price try to rally but ultimately the indicator remained in trend painting weaker pink bars. Treasury bond prices showed “NoGo” strength as the week ended with strong purple bars. U.S. commodities painted strong “NoGo” bars as well and so did the dollar as the greenback remained in a “NoGo” trend.
$SPY Remains in “NoGo” as Price Tries to Rally
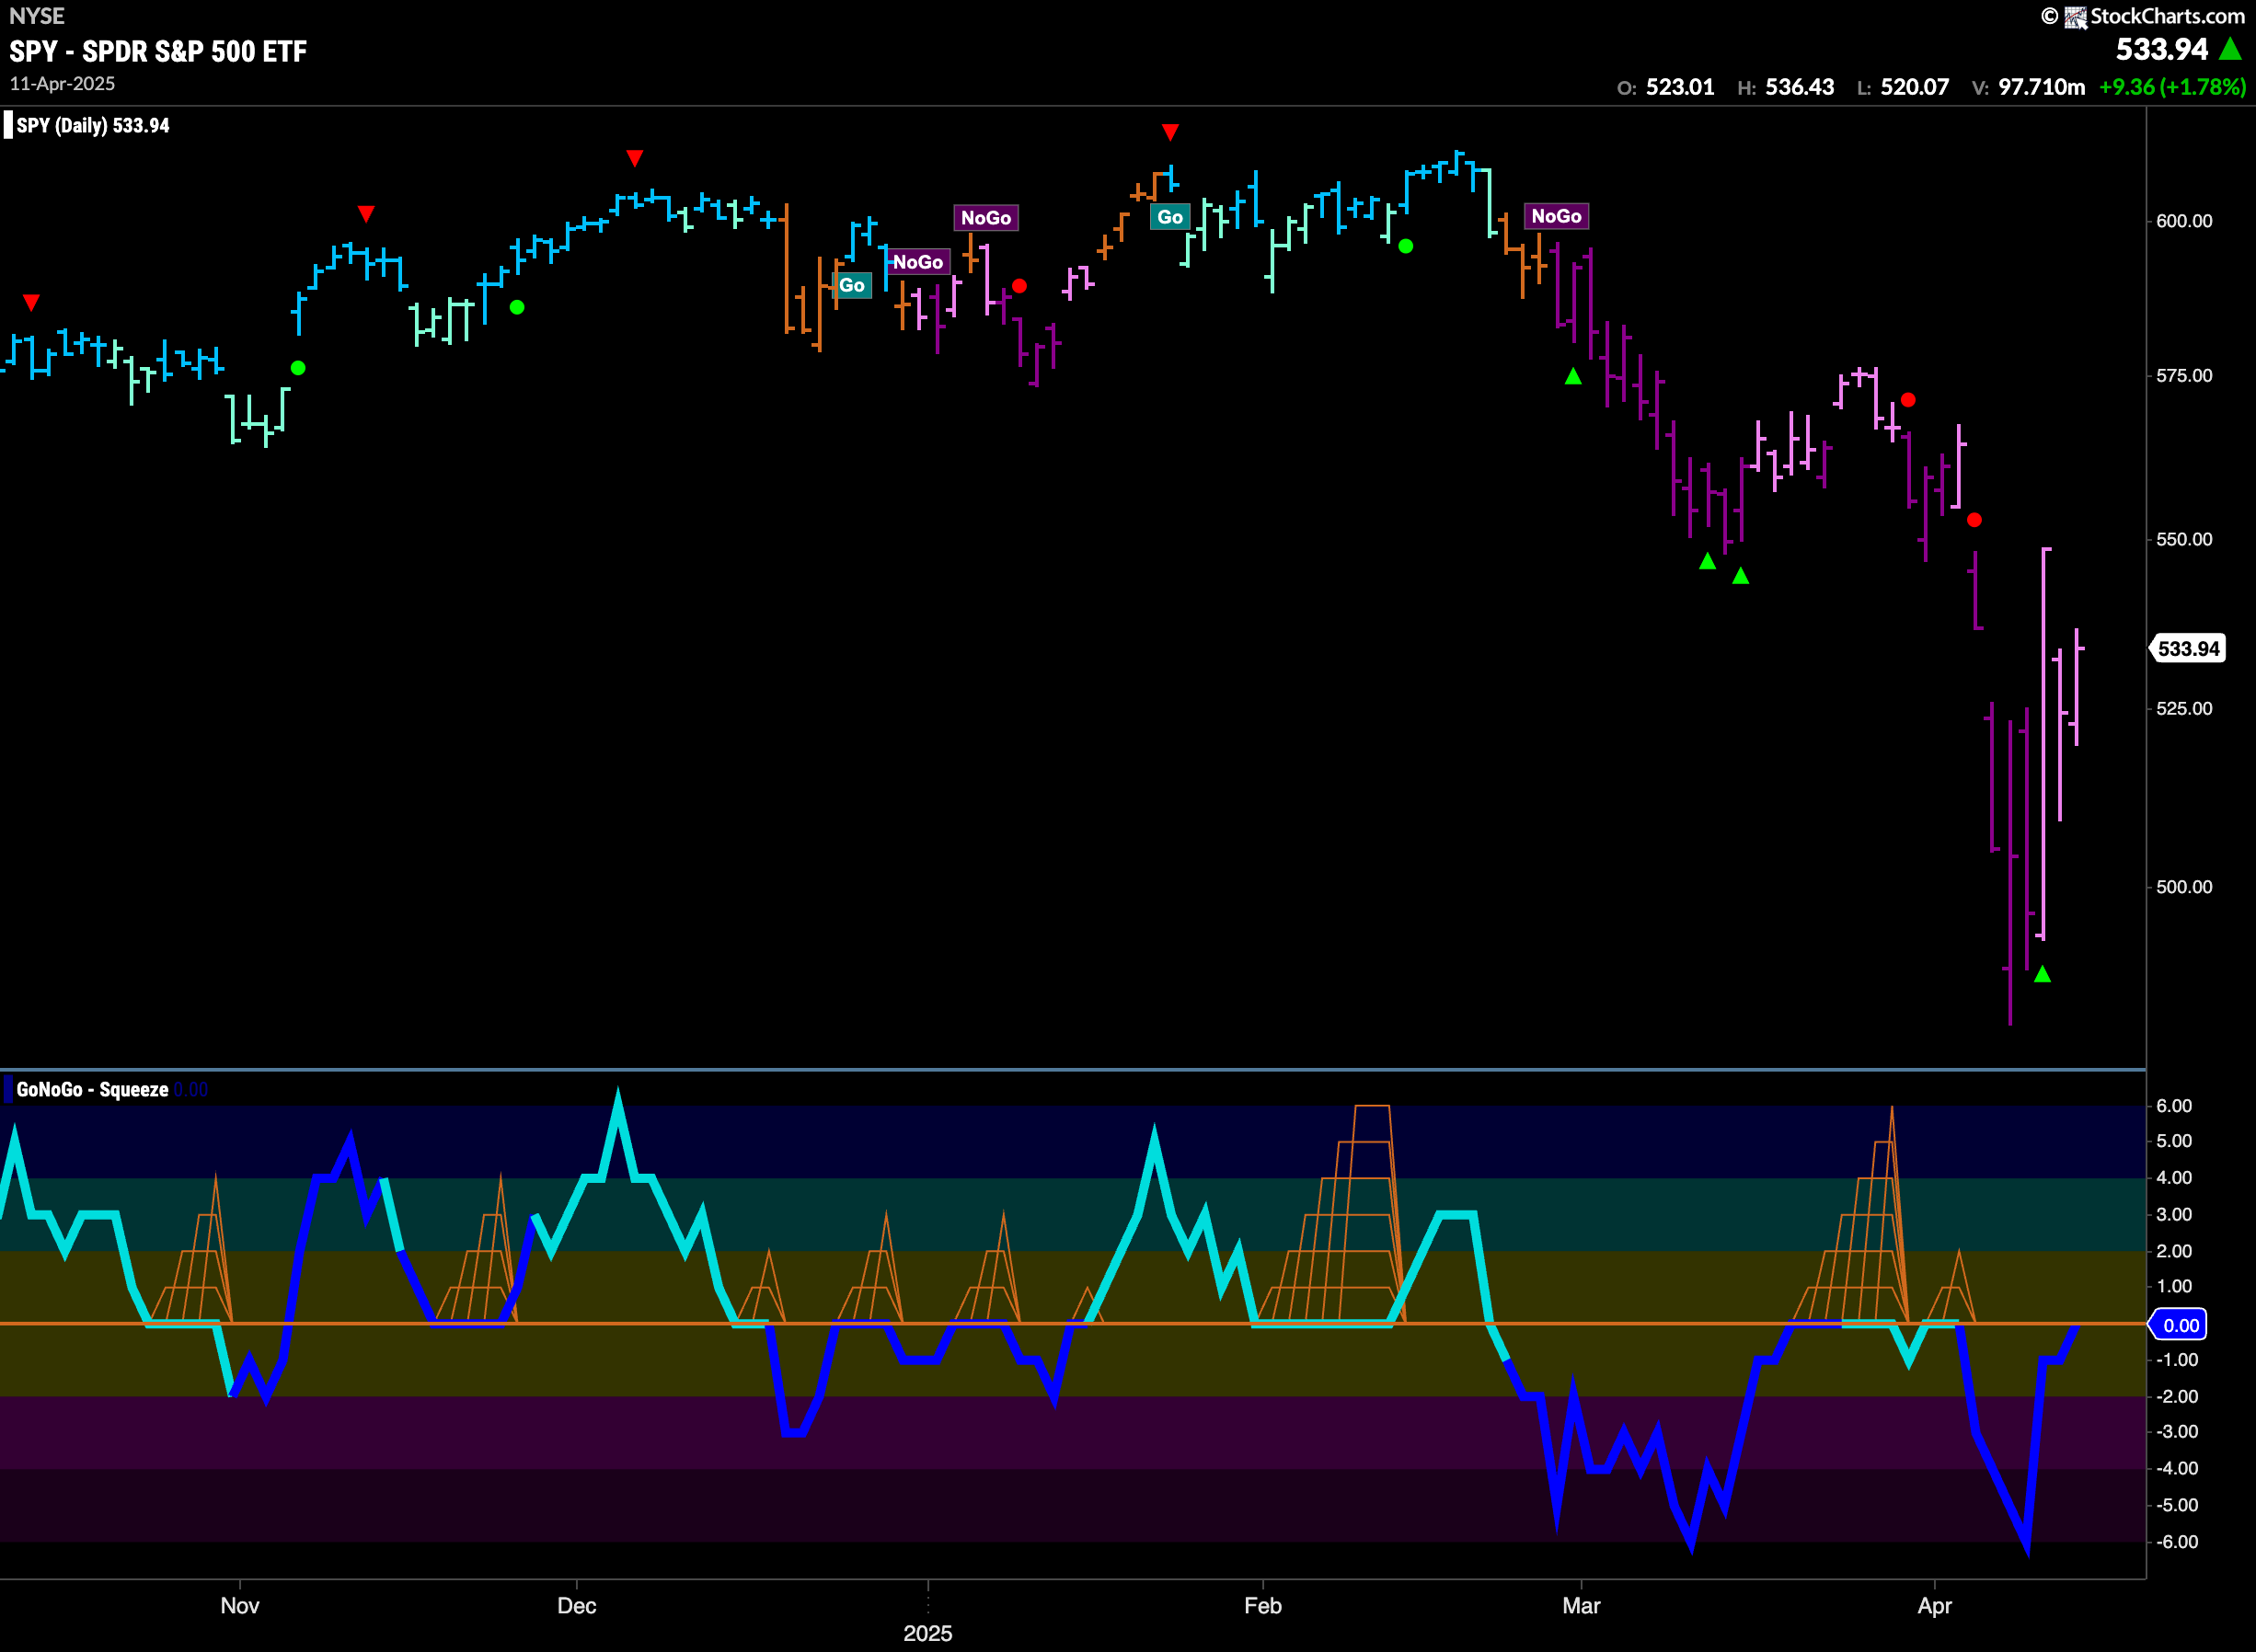
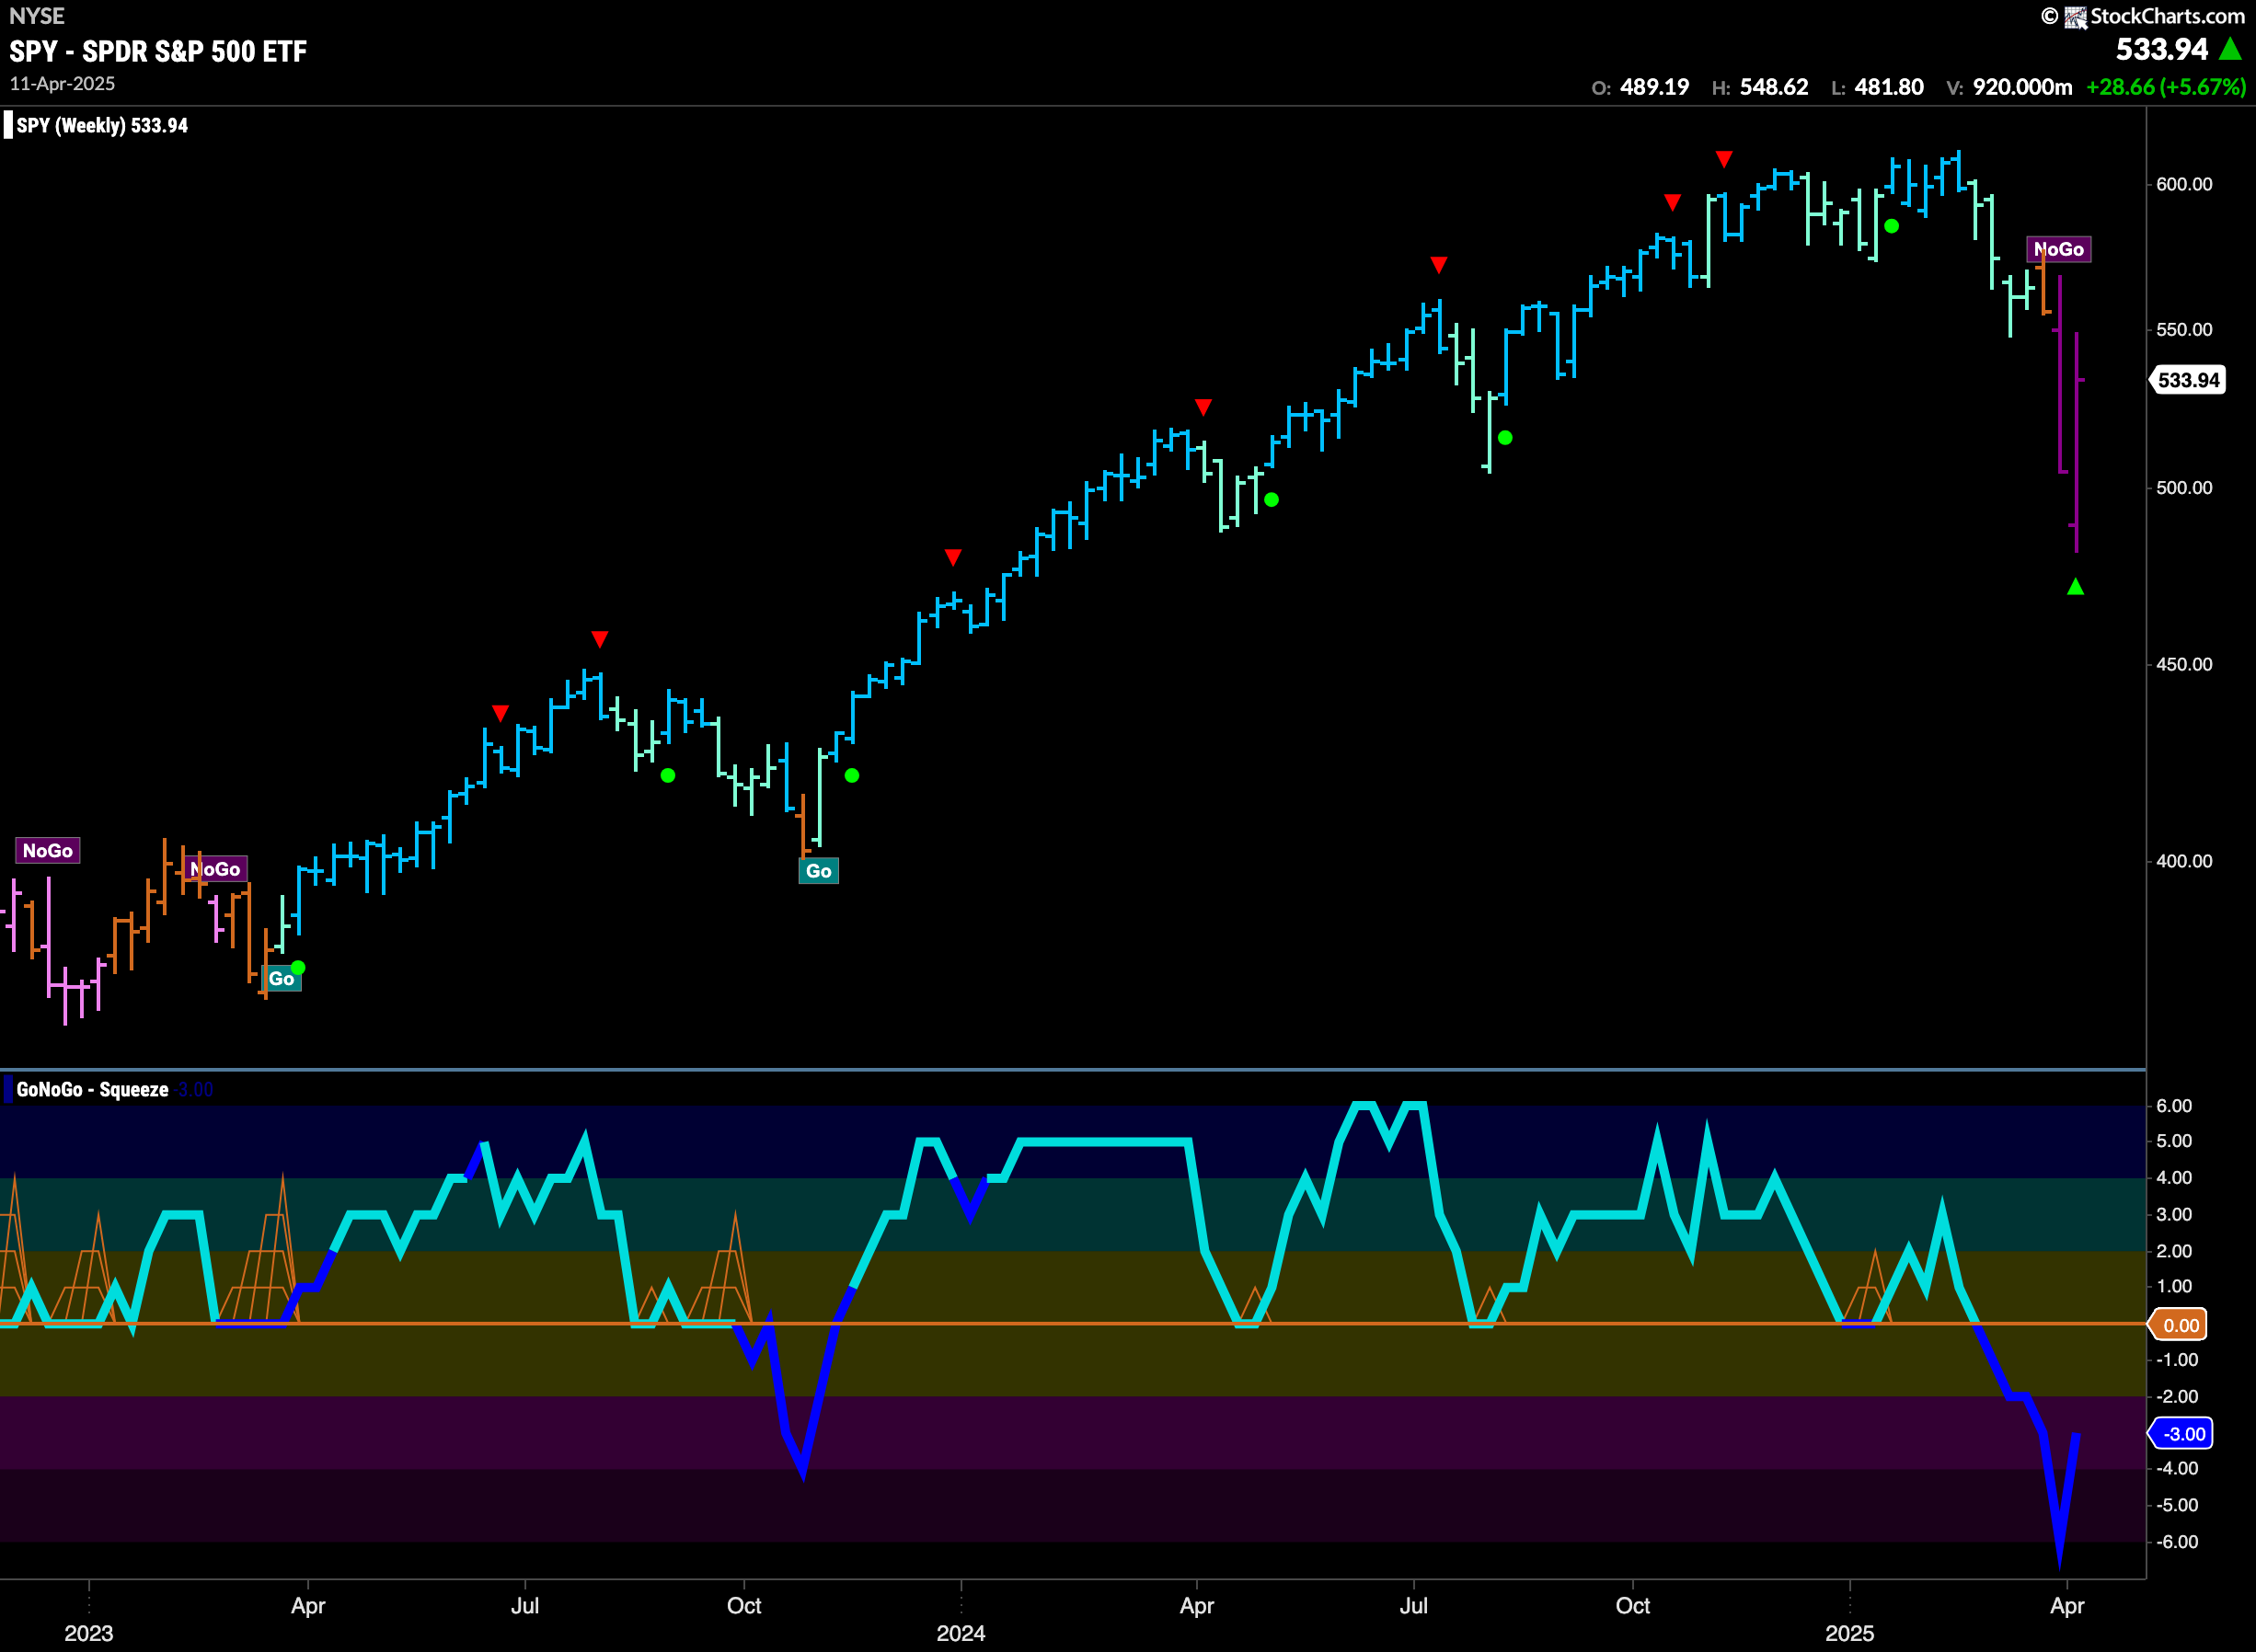
The GoNoGo chart below shows that the “NoGo” trend stayed for the week even as price tried to rally from the low. We saw pink bars reflecting a weakening “NoGo” trend and with GoNoGo Oscillator testing the zero line from below and volume is heavy. It will be very important to see if the oscillator gets rejected at this level. If it does, we will expect price to fall back to test recent lows.
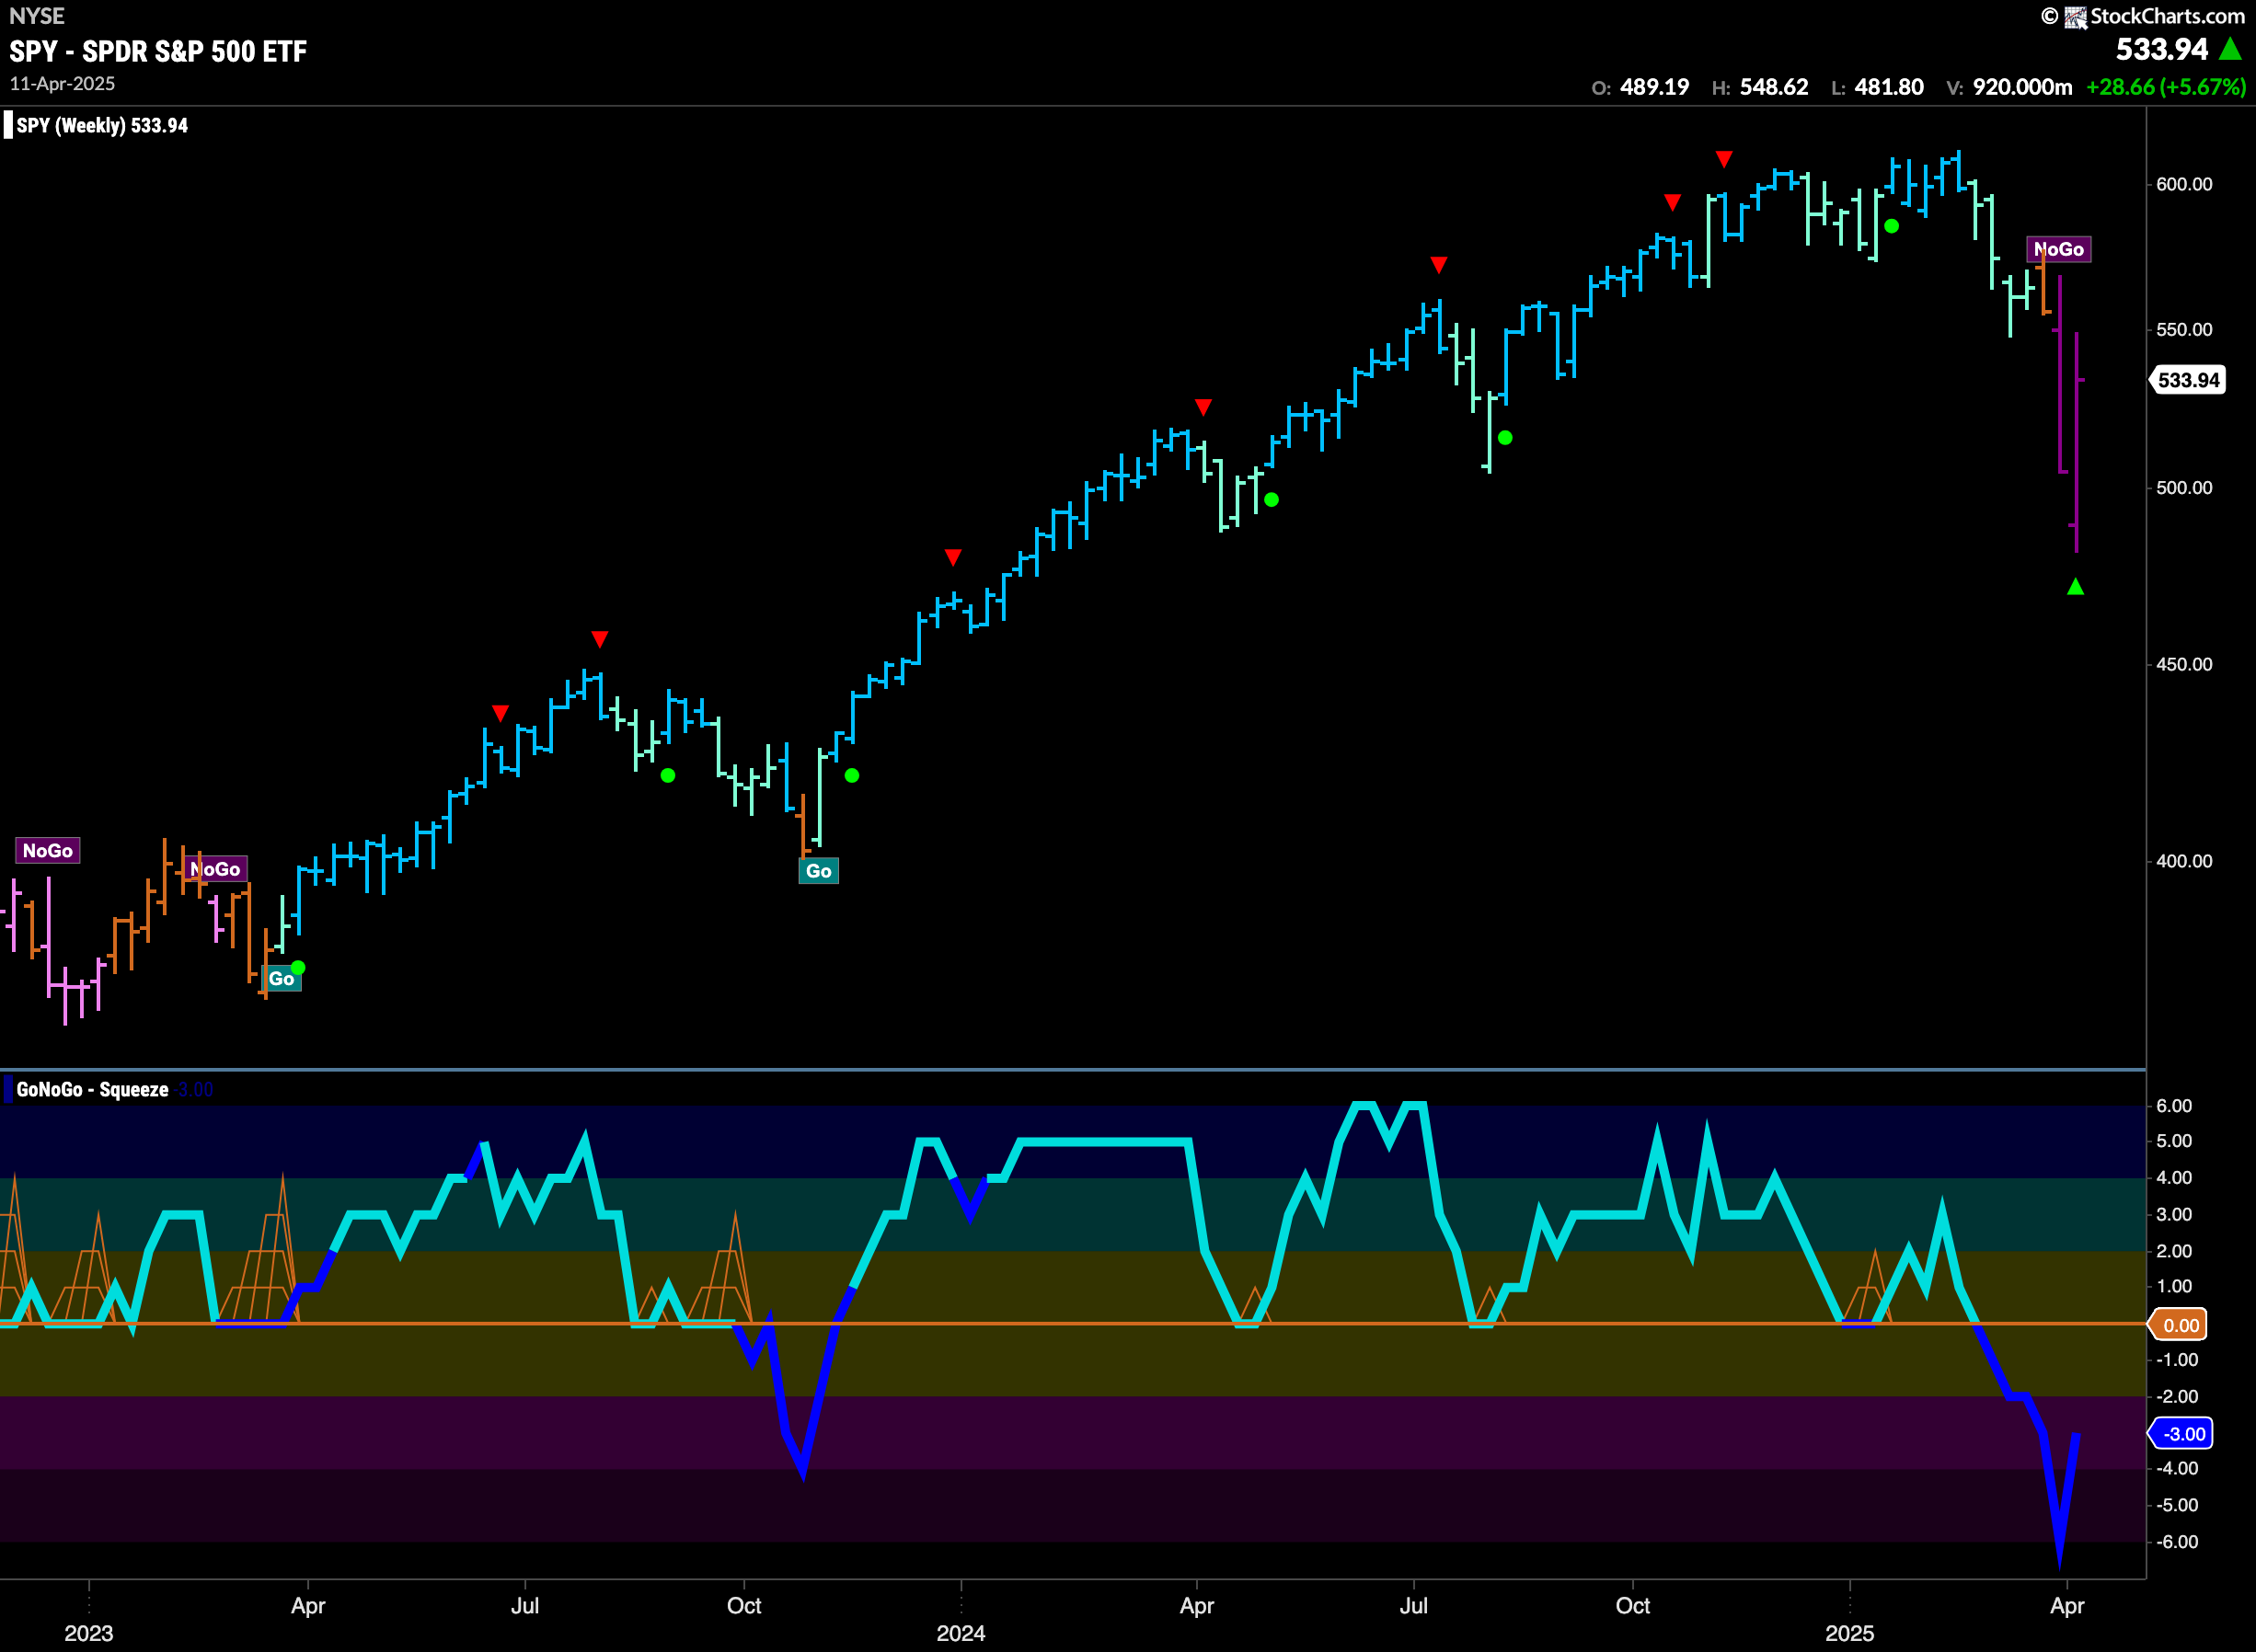
We see another strong purple “NoGo” bar on the weekly chart. Momentum has come out of oversold territory and so we see a NoGo Countertrend Correction Icon (green arrow) indicating that price may struggle to go lower in the short term. We will watch to see if the trend remains for the upcoming week.
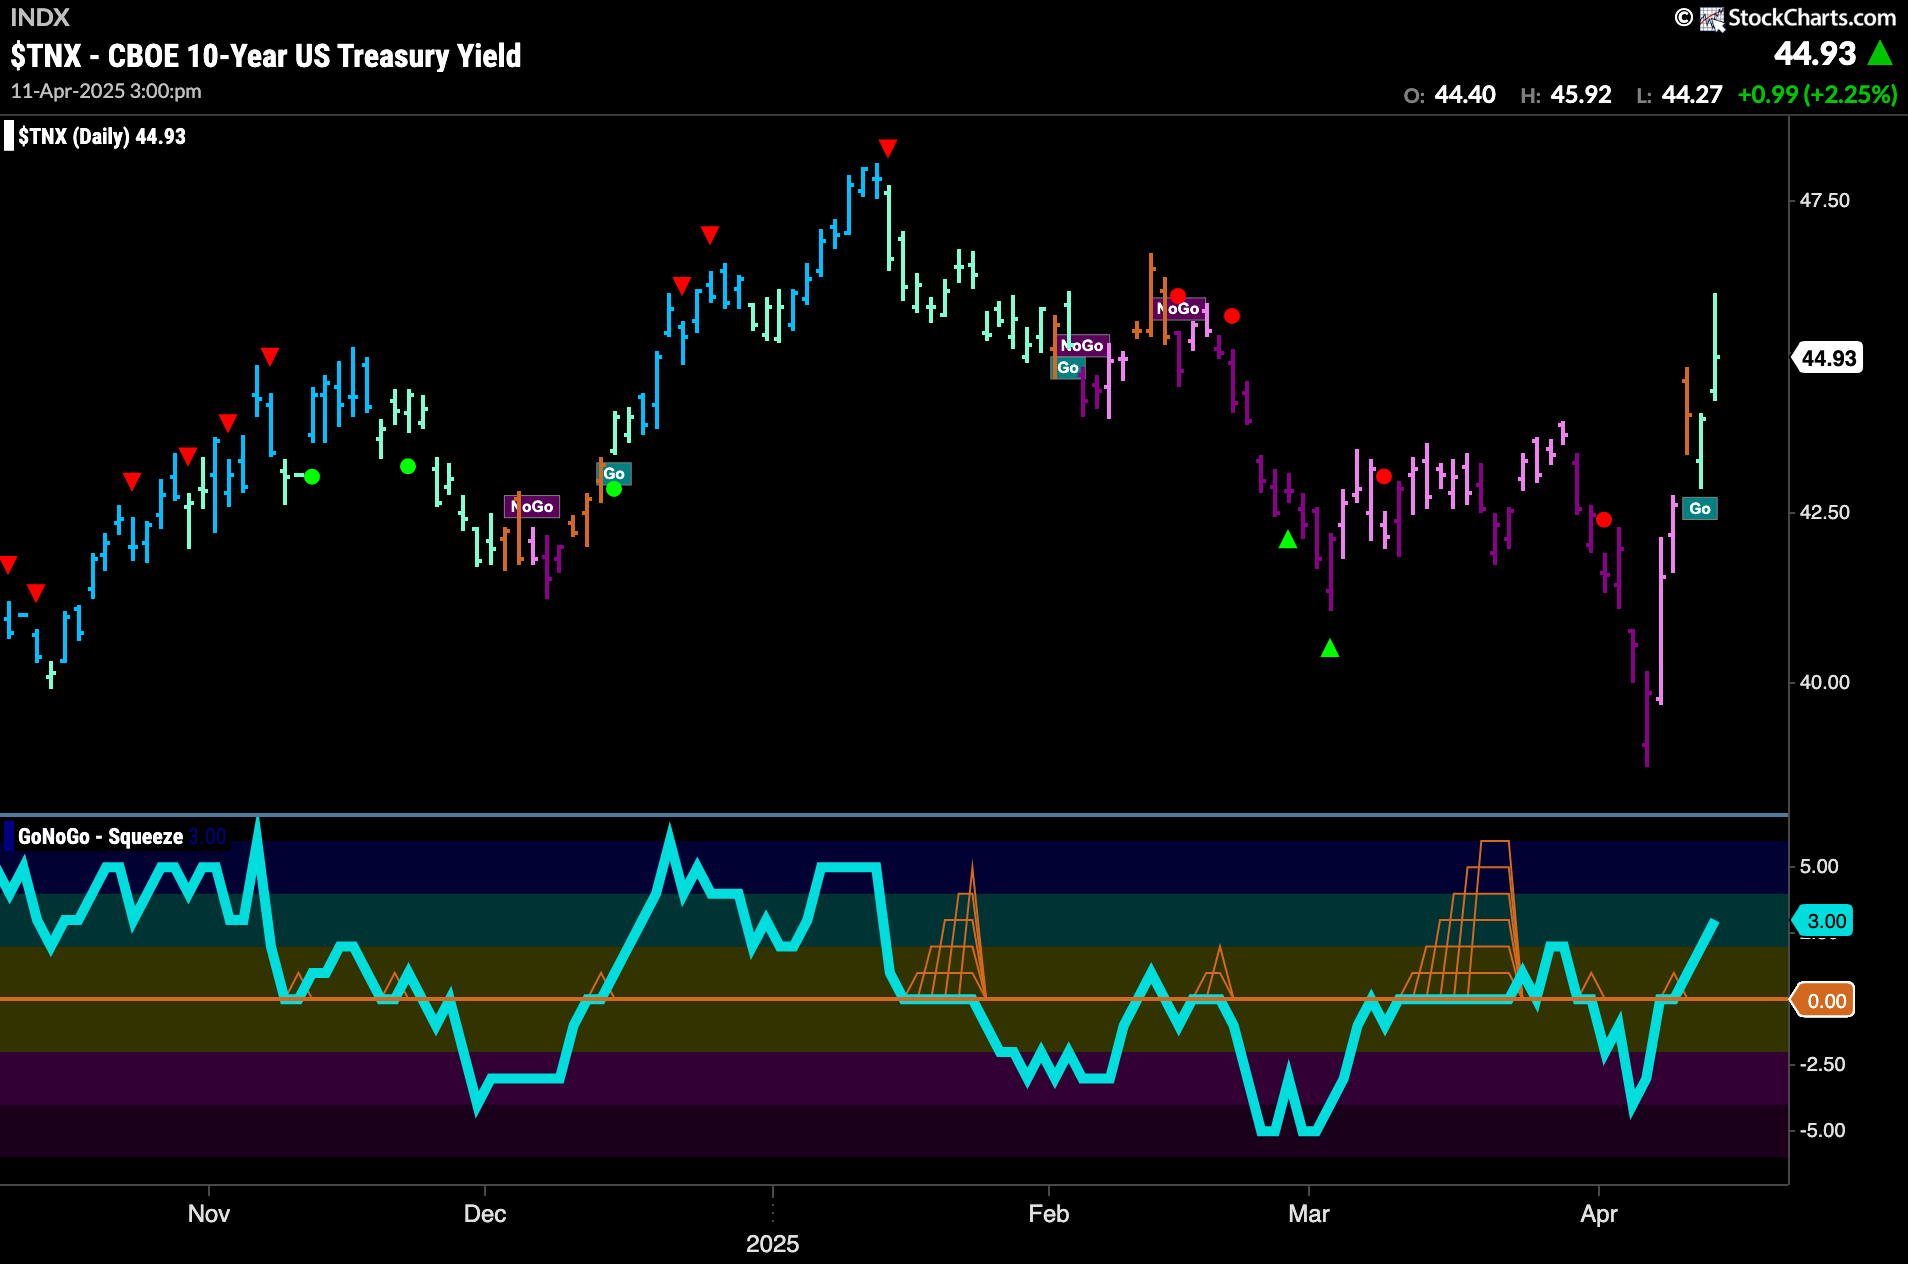
Treasury Rates Reverse Course
GoNoGo Trend shows that the “NoGo” trend gave way to first an amber “Go Fish” bar and then two weak aqua “Go” bars. Rates are rising sharply now as we look to set a new higher high. GoNoGo Oscillator has broken through the zero line into positive territory.
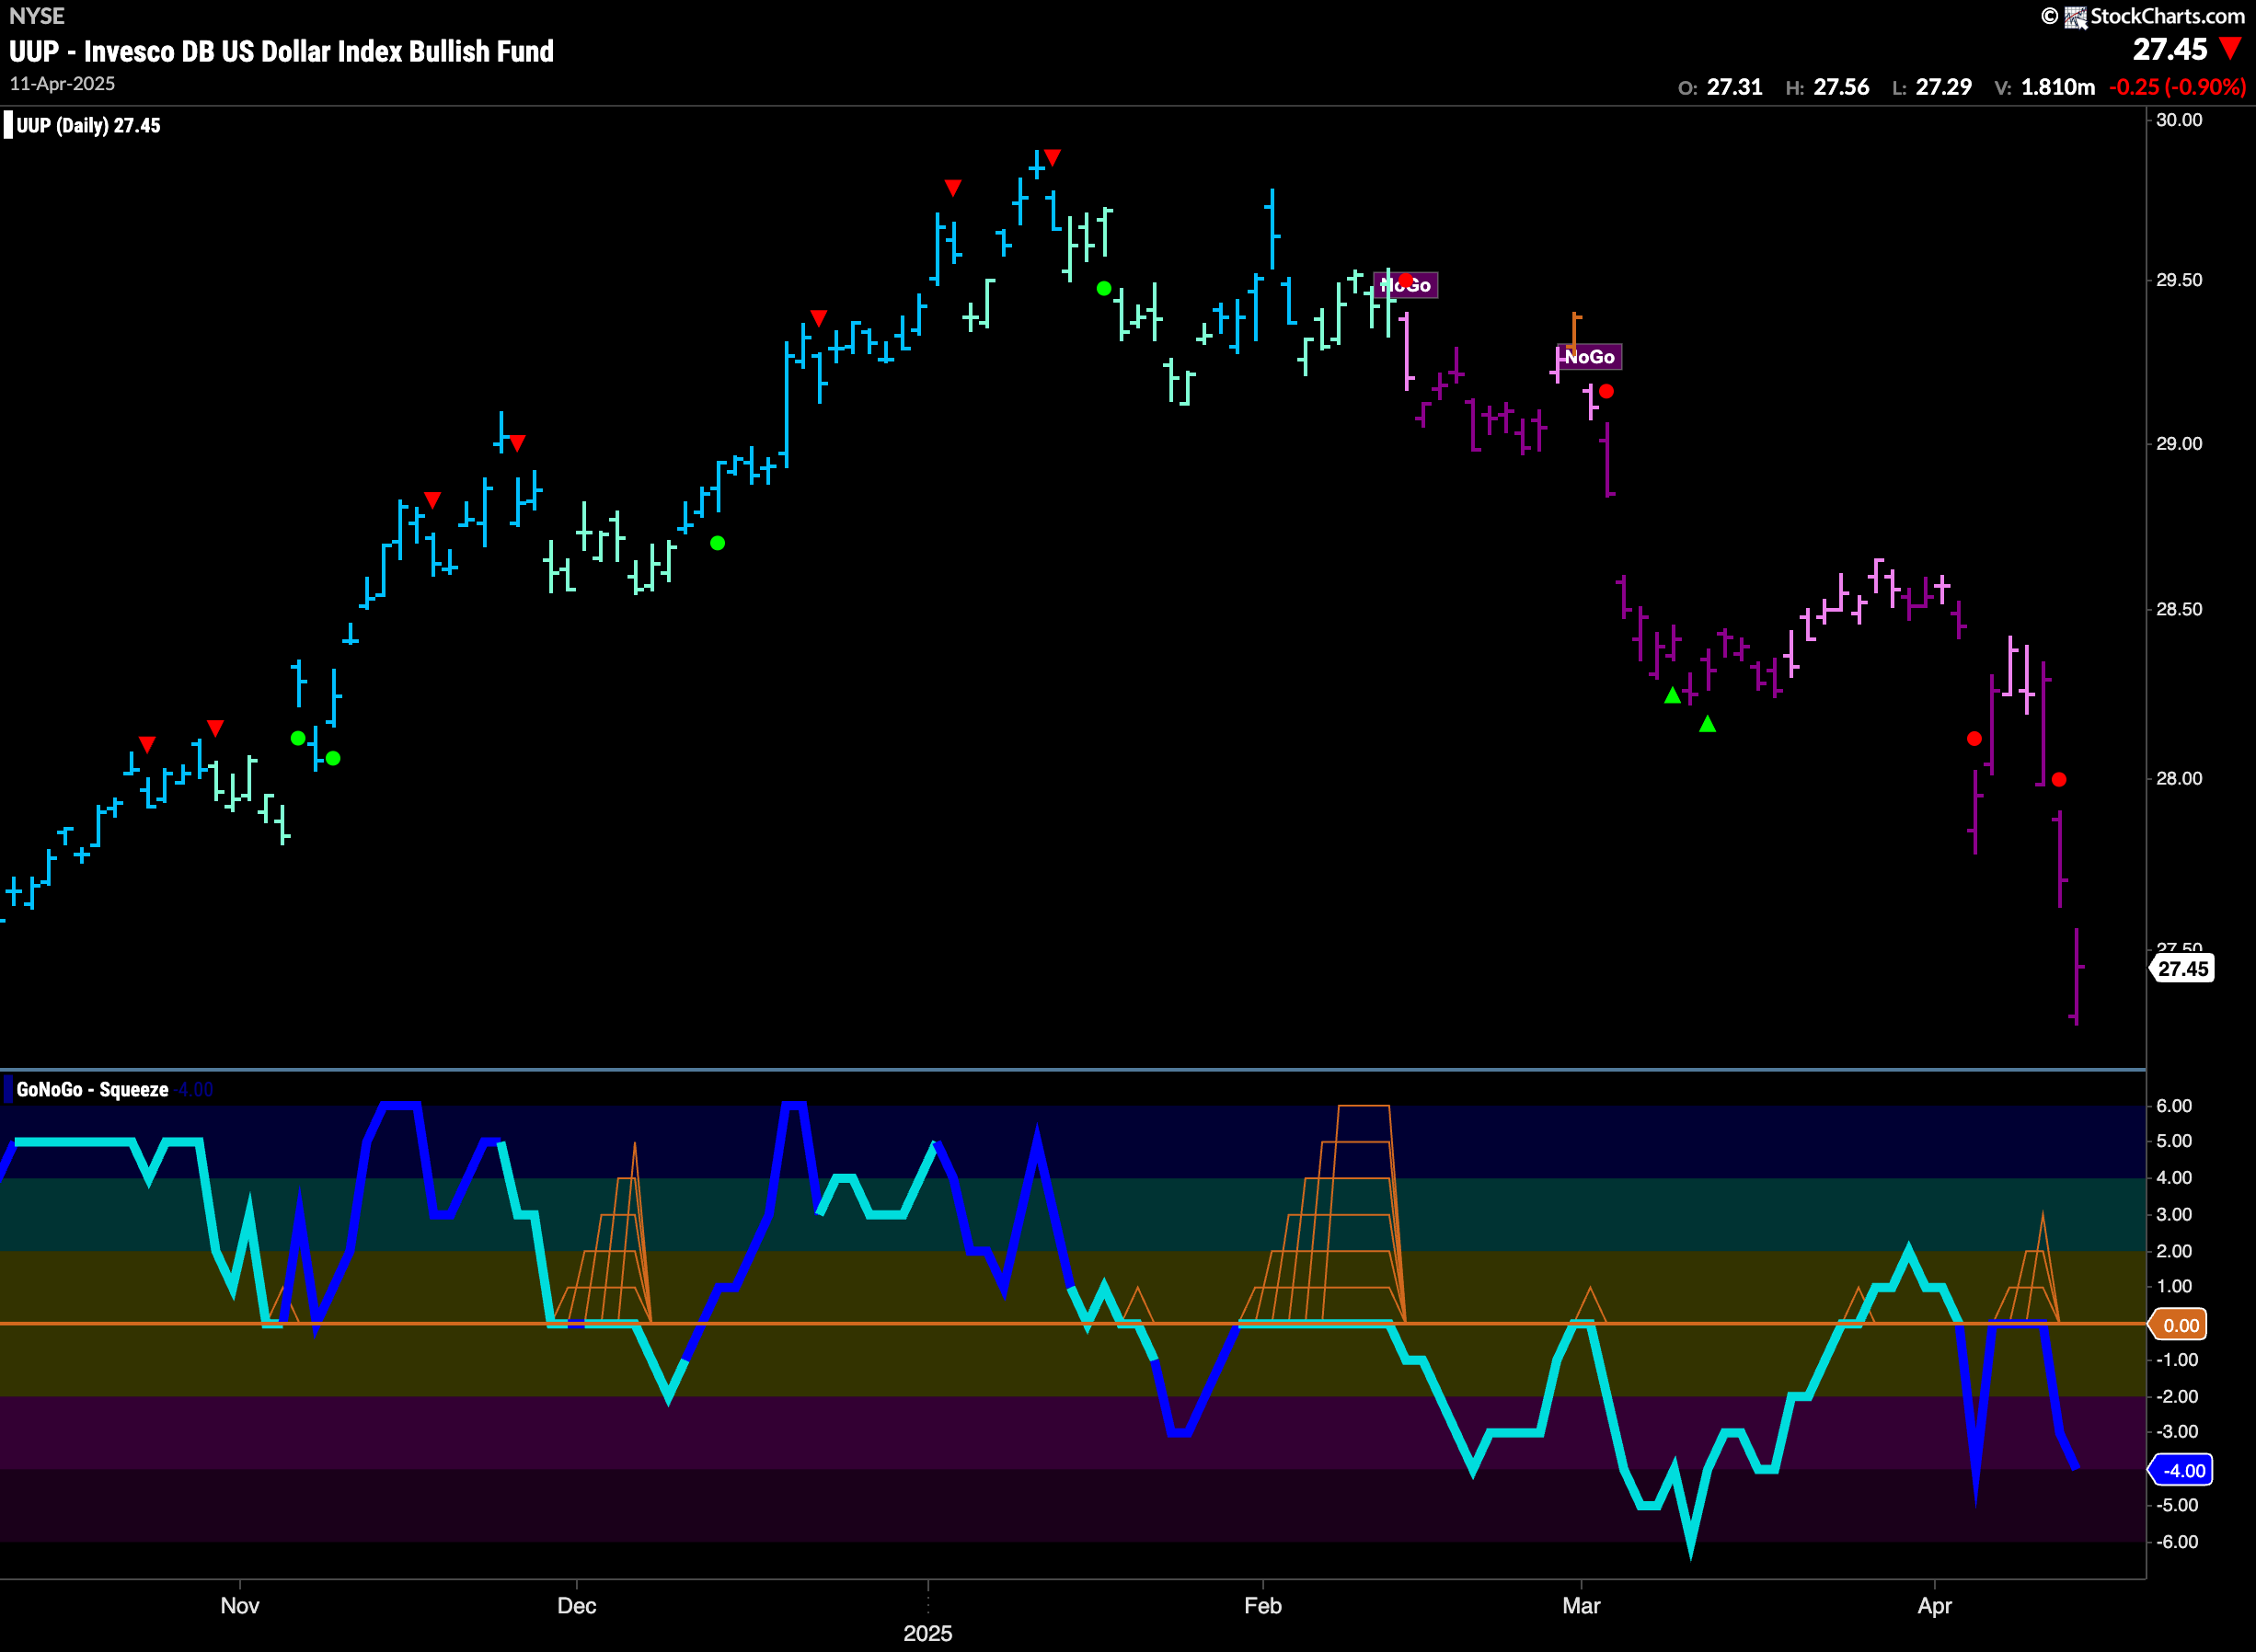
Strong “NoGo” Trend as Dollar Hits New Lows
The “NoGo” trend continued this week as we saw price make new lows on strong purple bars. This came after GoNoGo Oscillator was rejected by the zero line on heavy volume. This tells us that momentum is resurgent in the direction of the underlying “NoGo” trend. We will watch to see if price can consolidate at these lower levels.
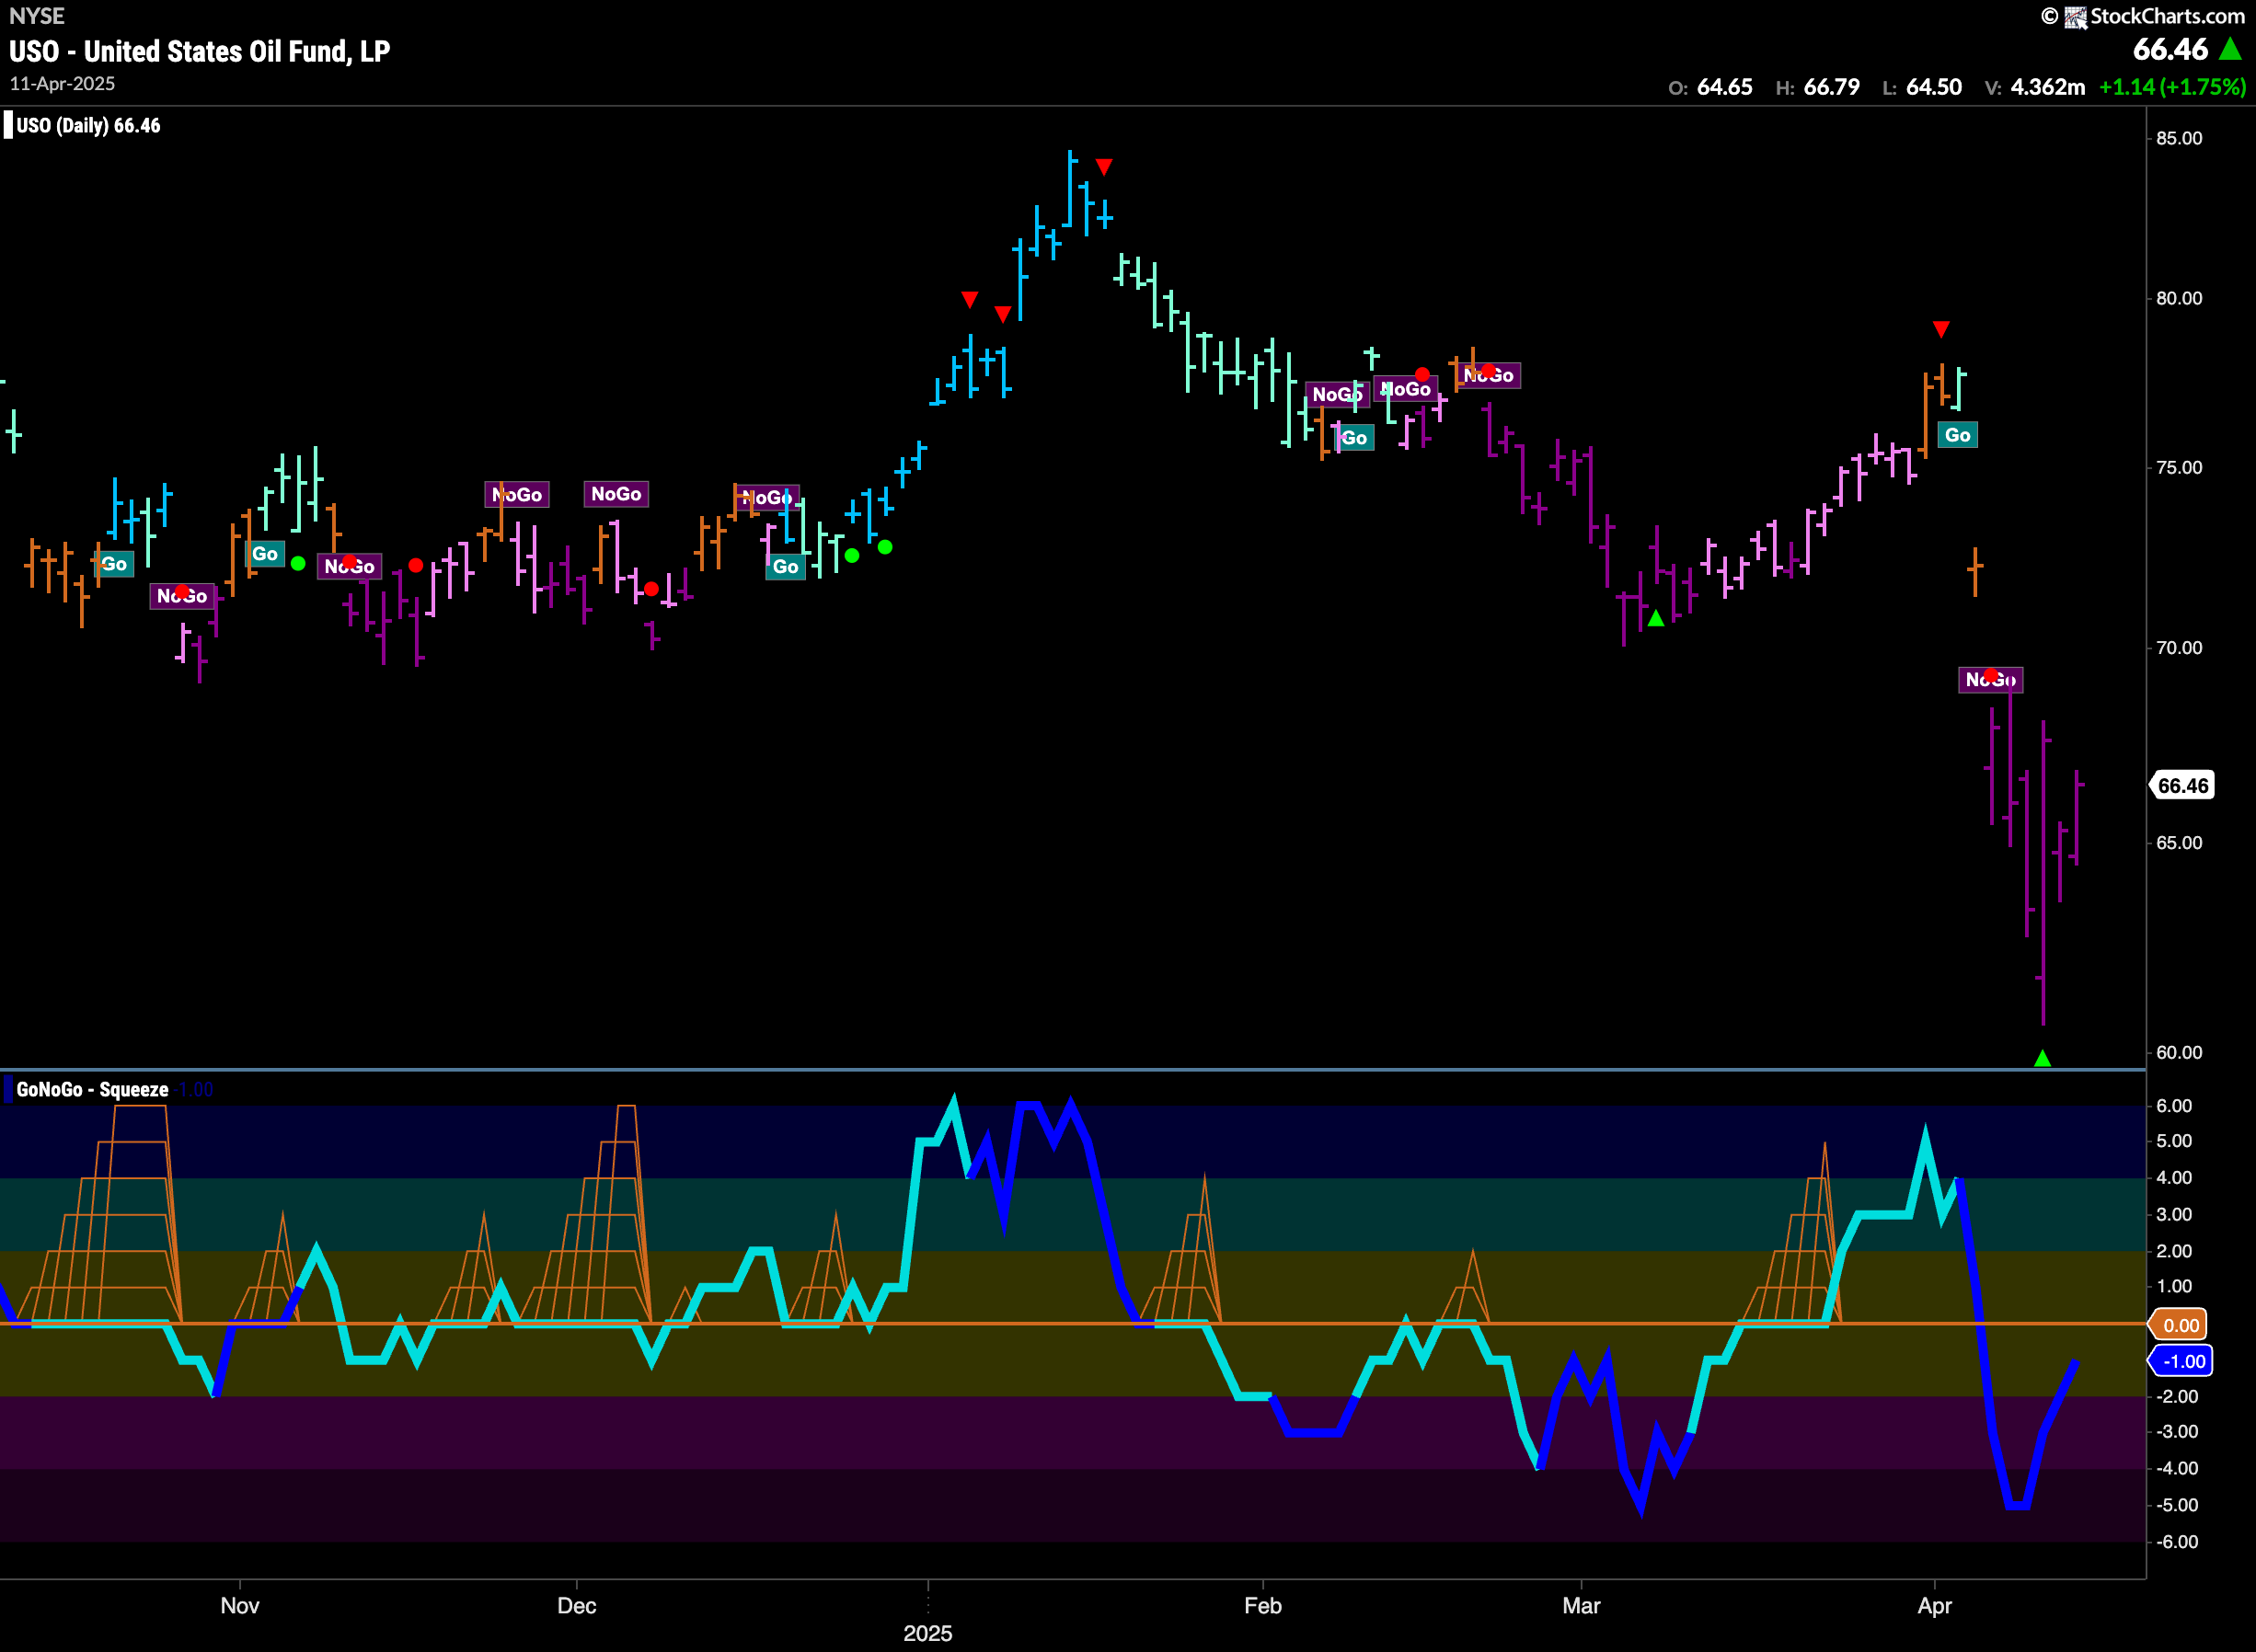
“NoGo” Stays Strong for Oil
The “NoGo” remained strong this week as we saw an uninterrupted string of purple bars as price cratered to new lows. After breaking through the zero line, GoNoGo Oscillator is still in negative territory on heavy volume and we will watch to see if price falls further from here.
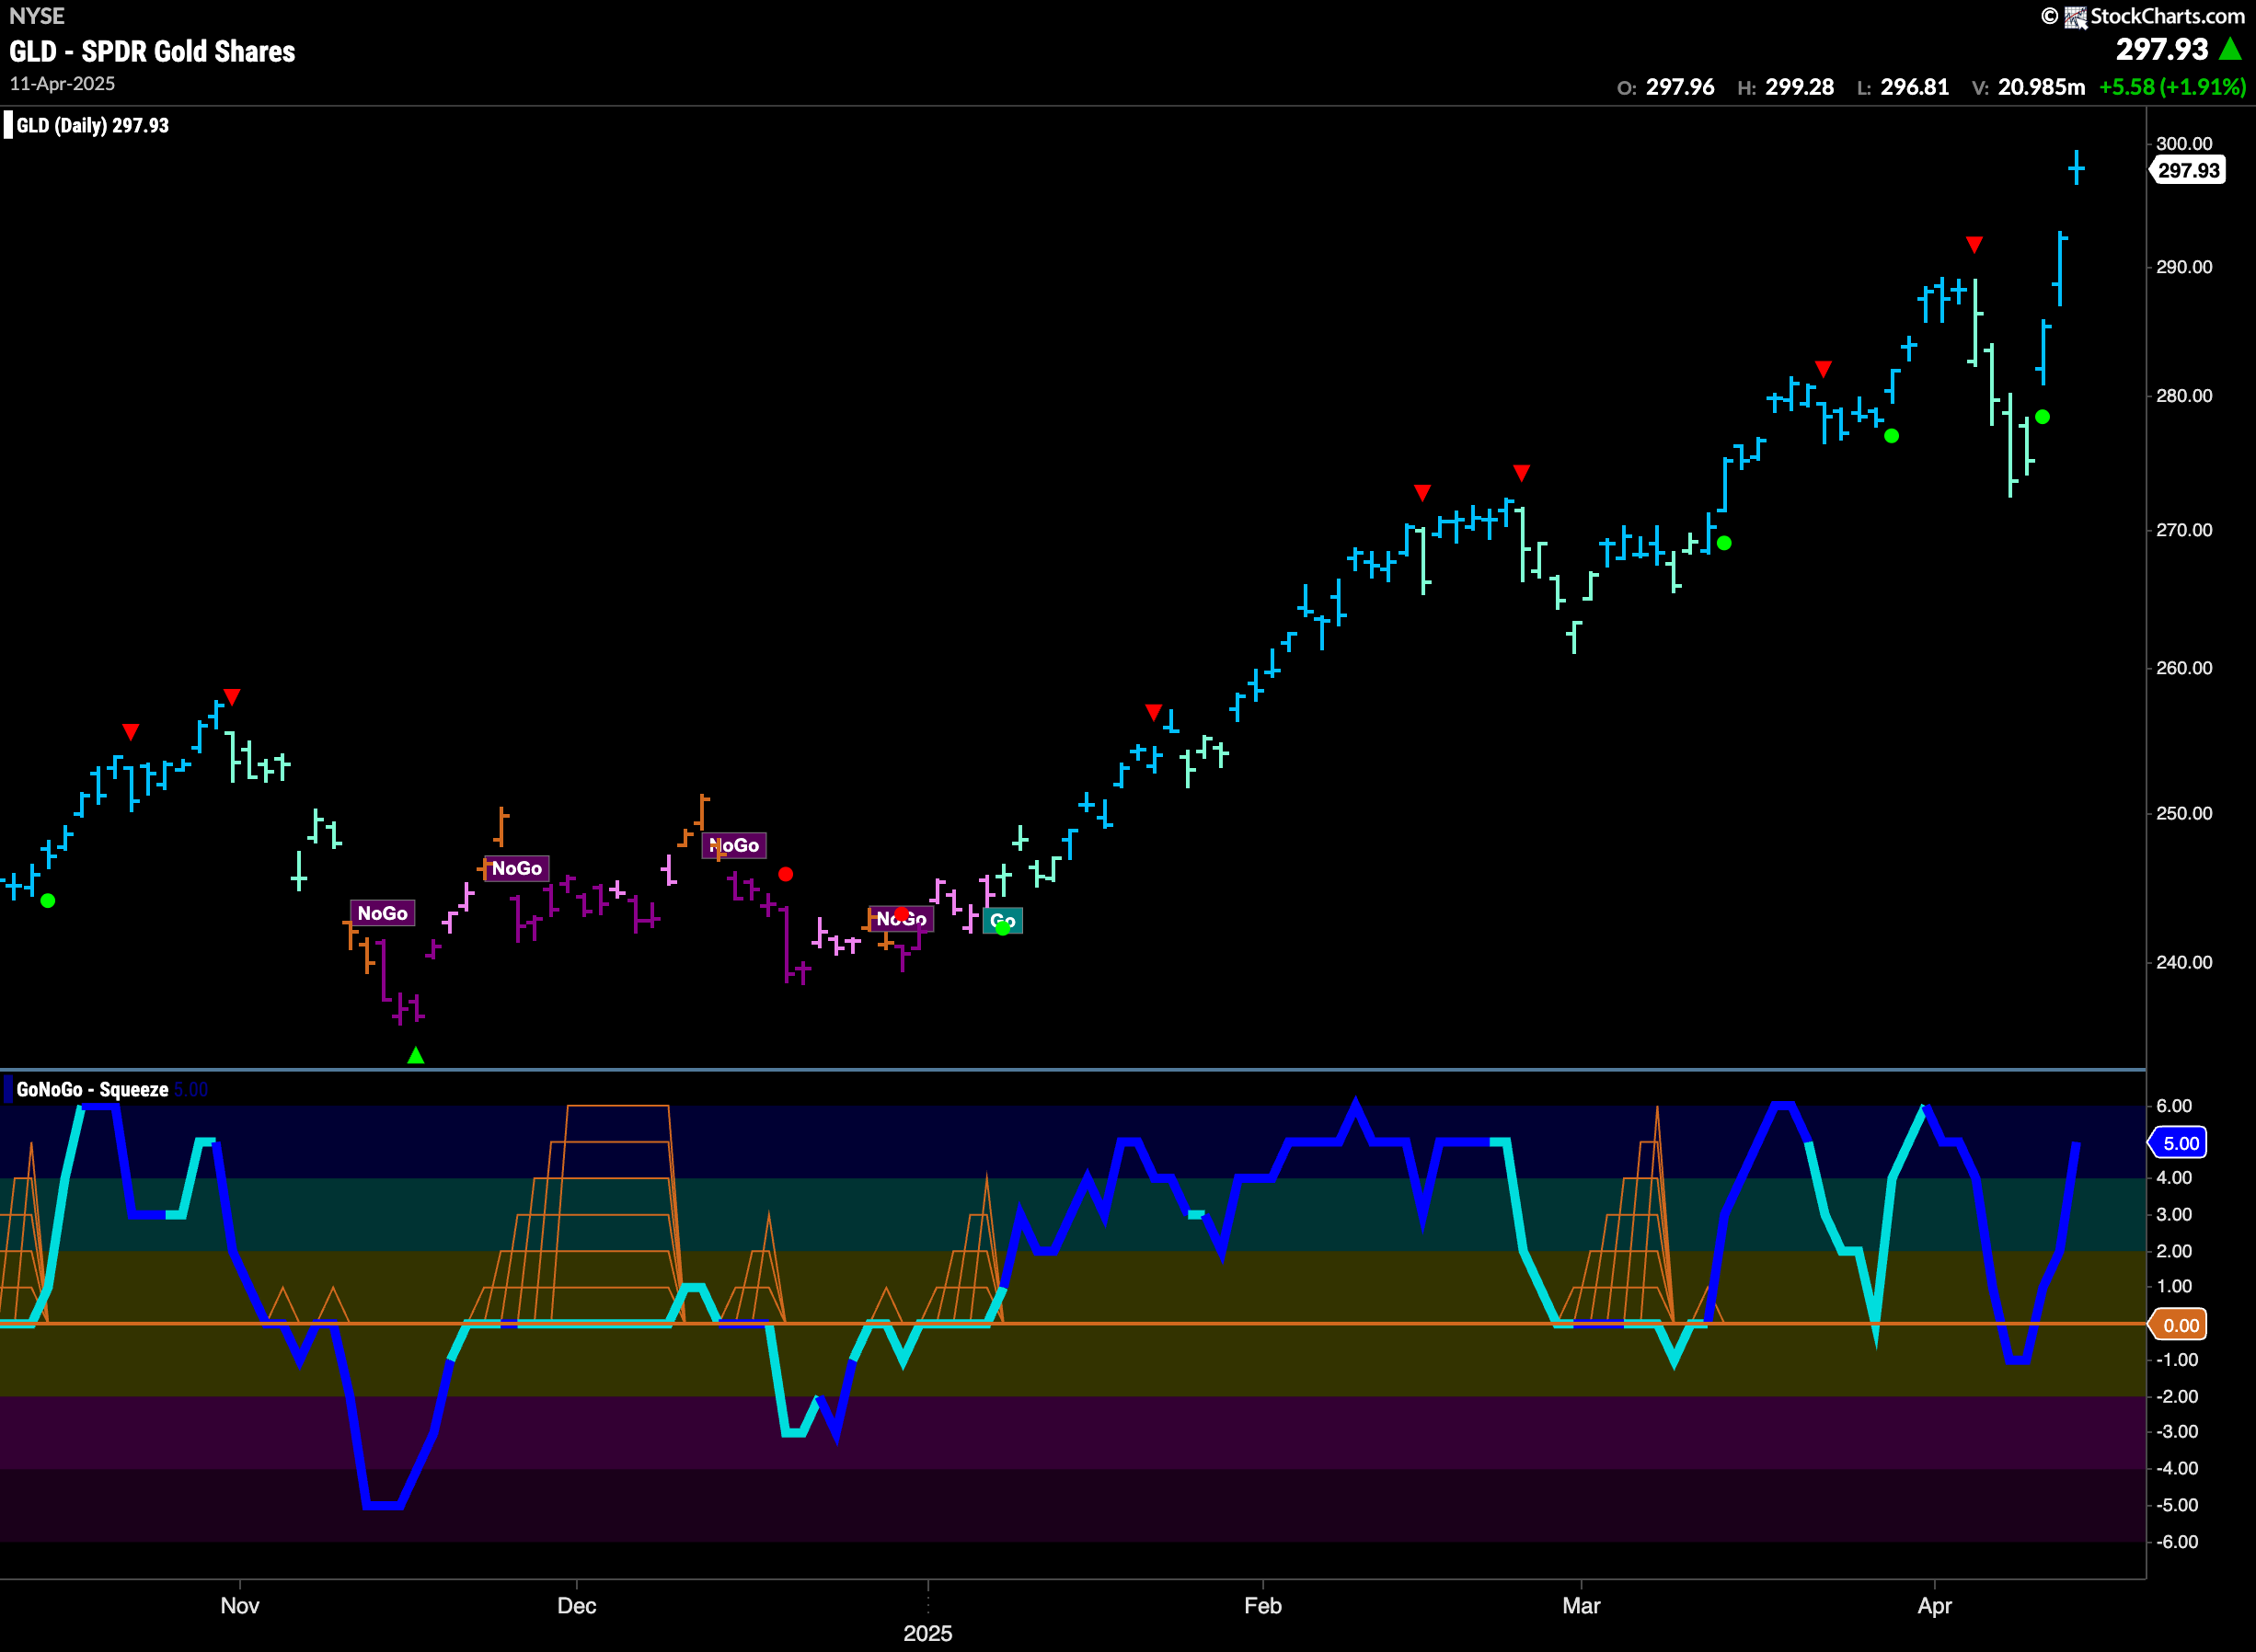
Gold “Go” Trend Jumps Even Higher
Yet again another higher high for the precious metal. Prices gapped higher after several weaker aqua bars to paint strong blue “Go” bars at new higher highs. This came after GoNoGo Oscillator rallied into positive territory on heavy volume indicating resurgent momentum in the direction of the “Go” trend.
Sector RelMap
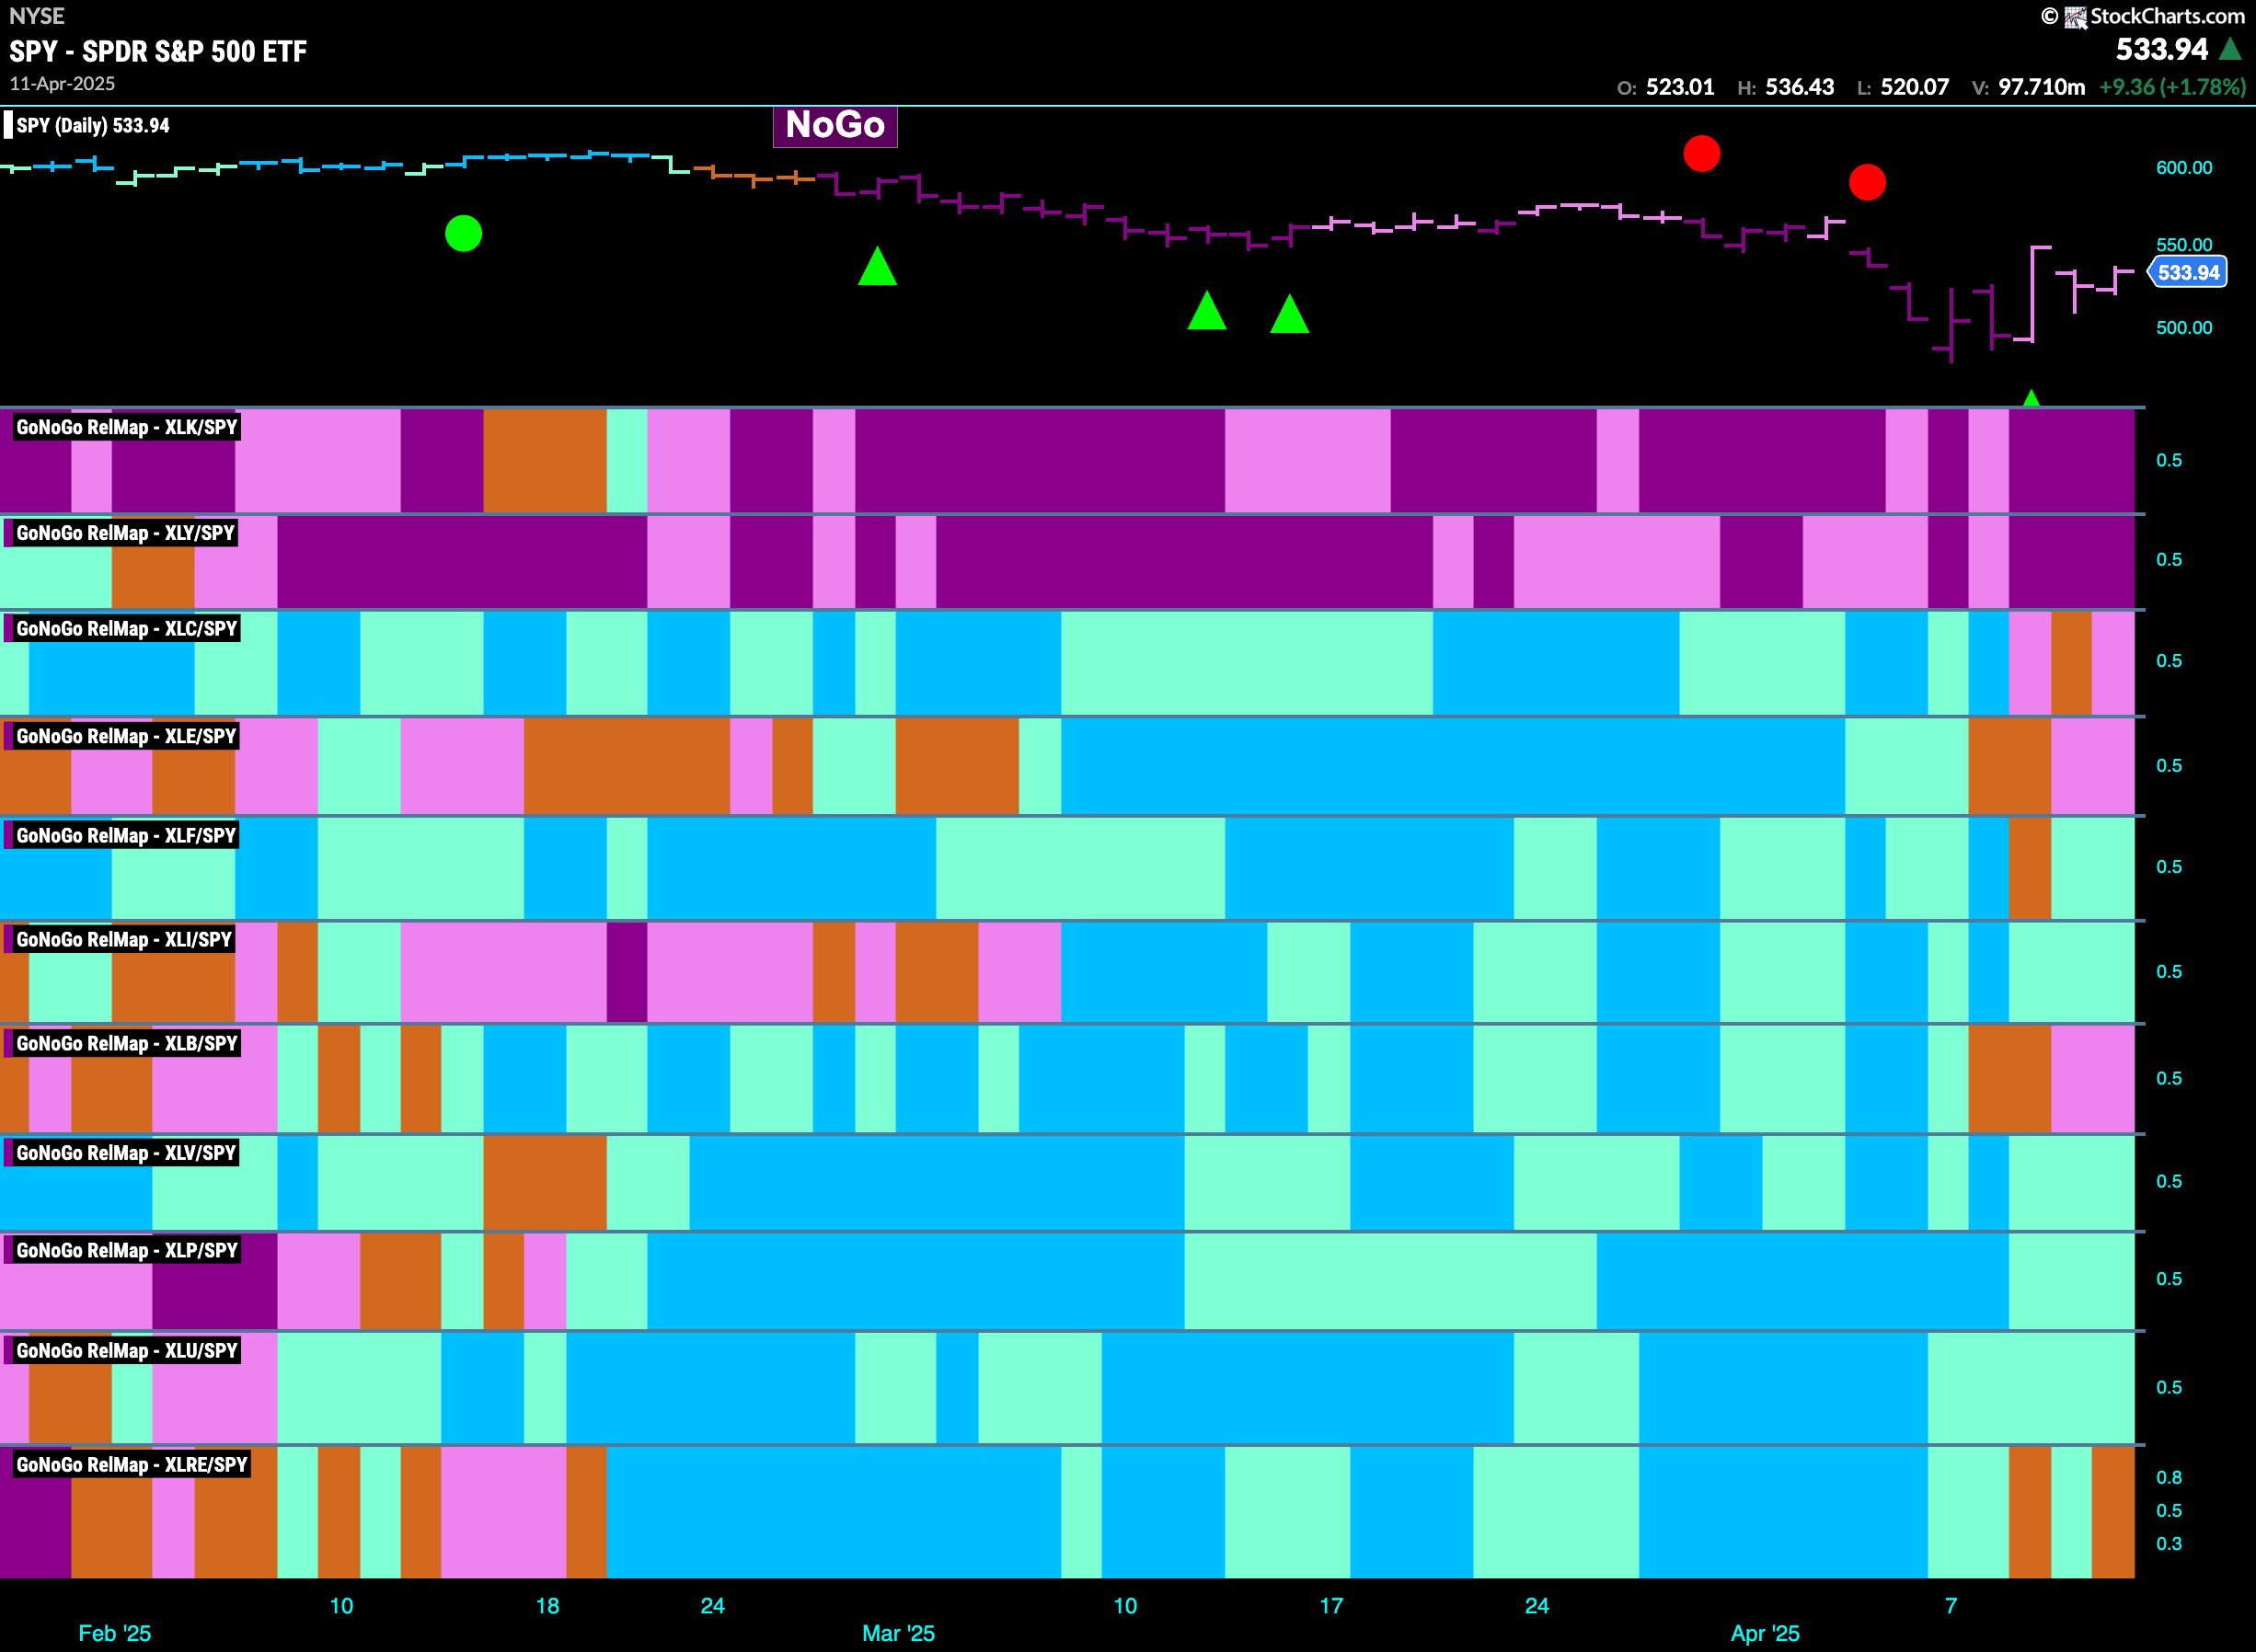
Below is the GoNoGo Sector RelMap. This GoNoGo RelMap applies the GoNoGo Trend to the relative strength ratios of the sectors to the base index. With this view we can get a sense of the relative out performance and relative underperformance of the sectors. 9 sectors are in relative “Go” trends. $XLF, $XLI, $XLV, $XLP, and $XLU are painting relative “Go” bars.
Utilities Sub-Group RelMap
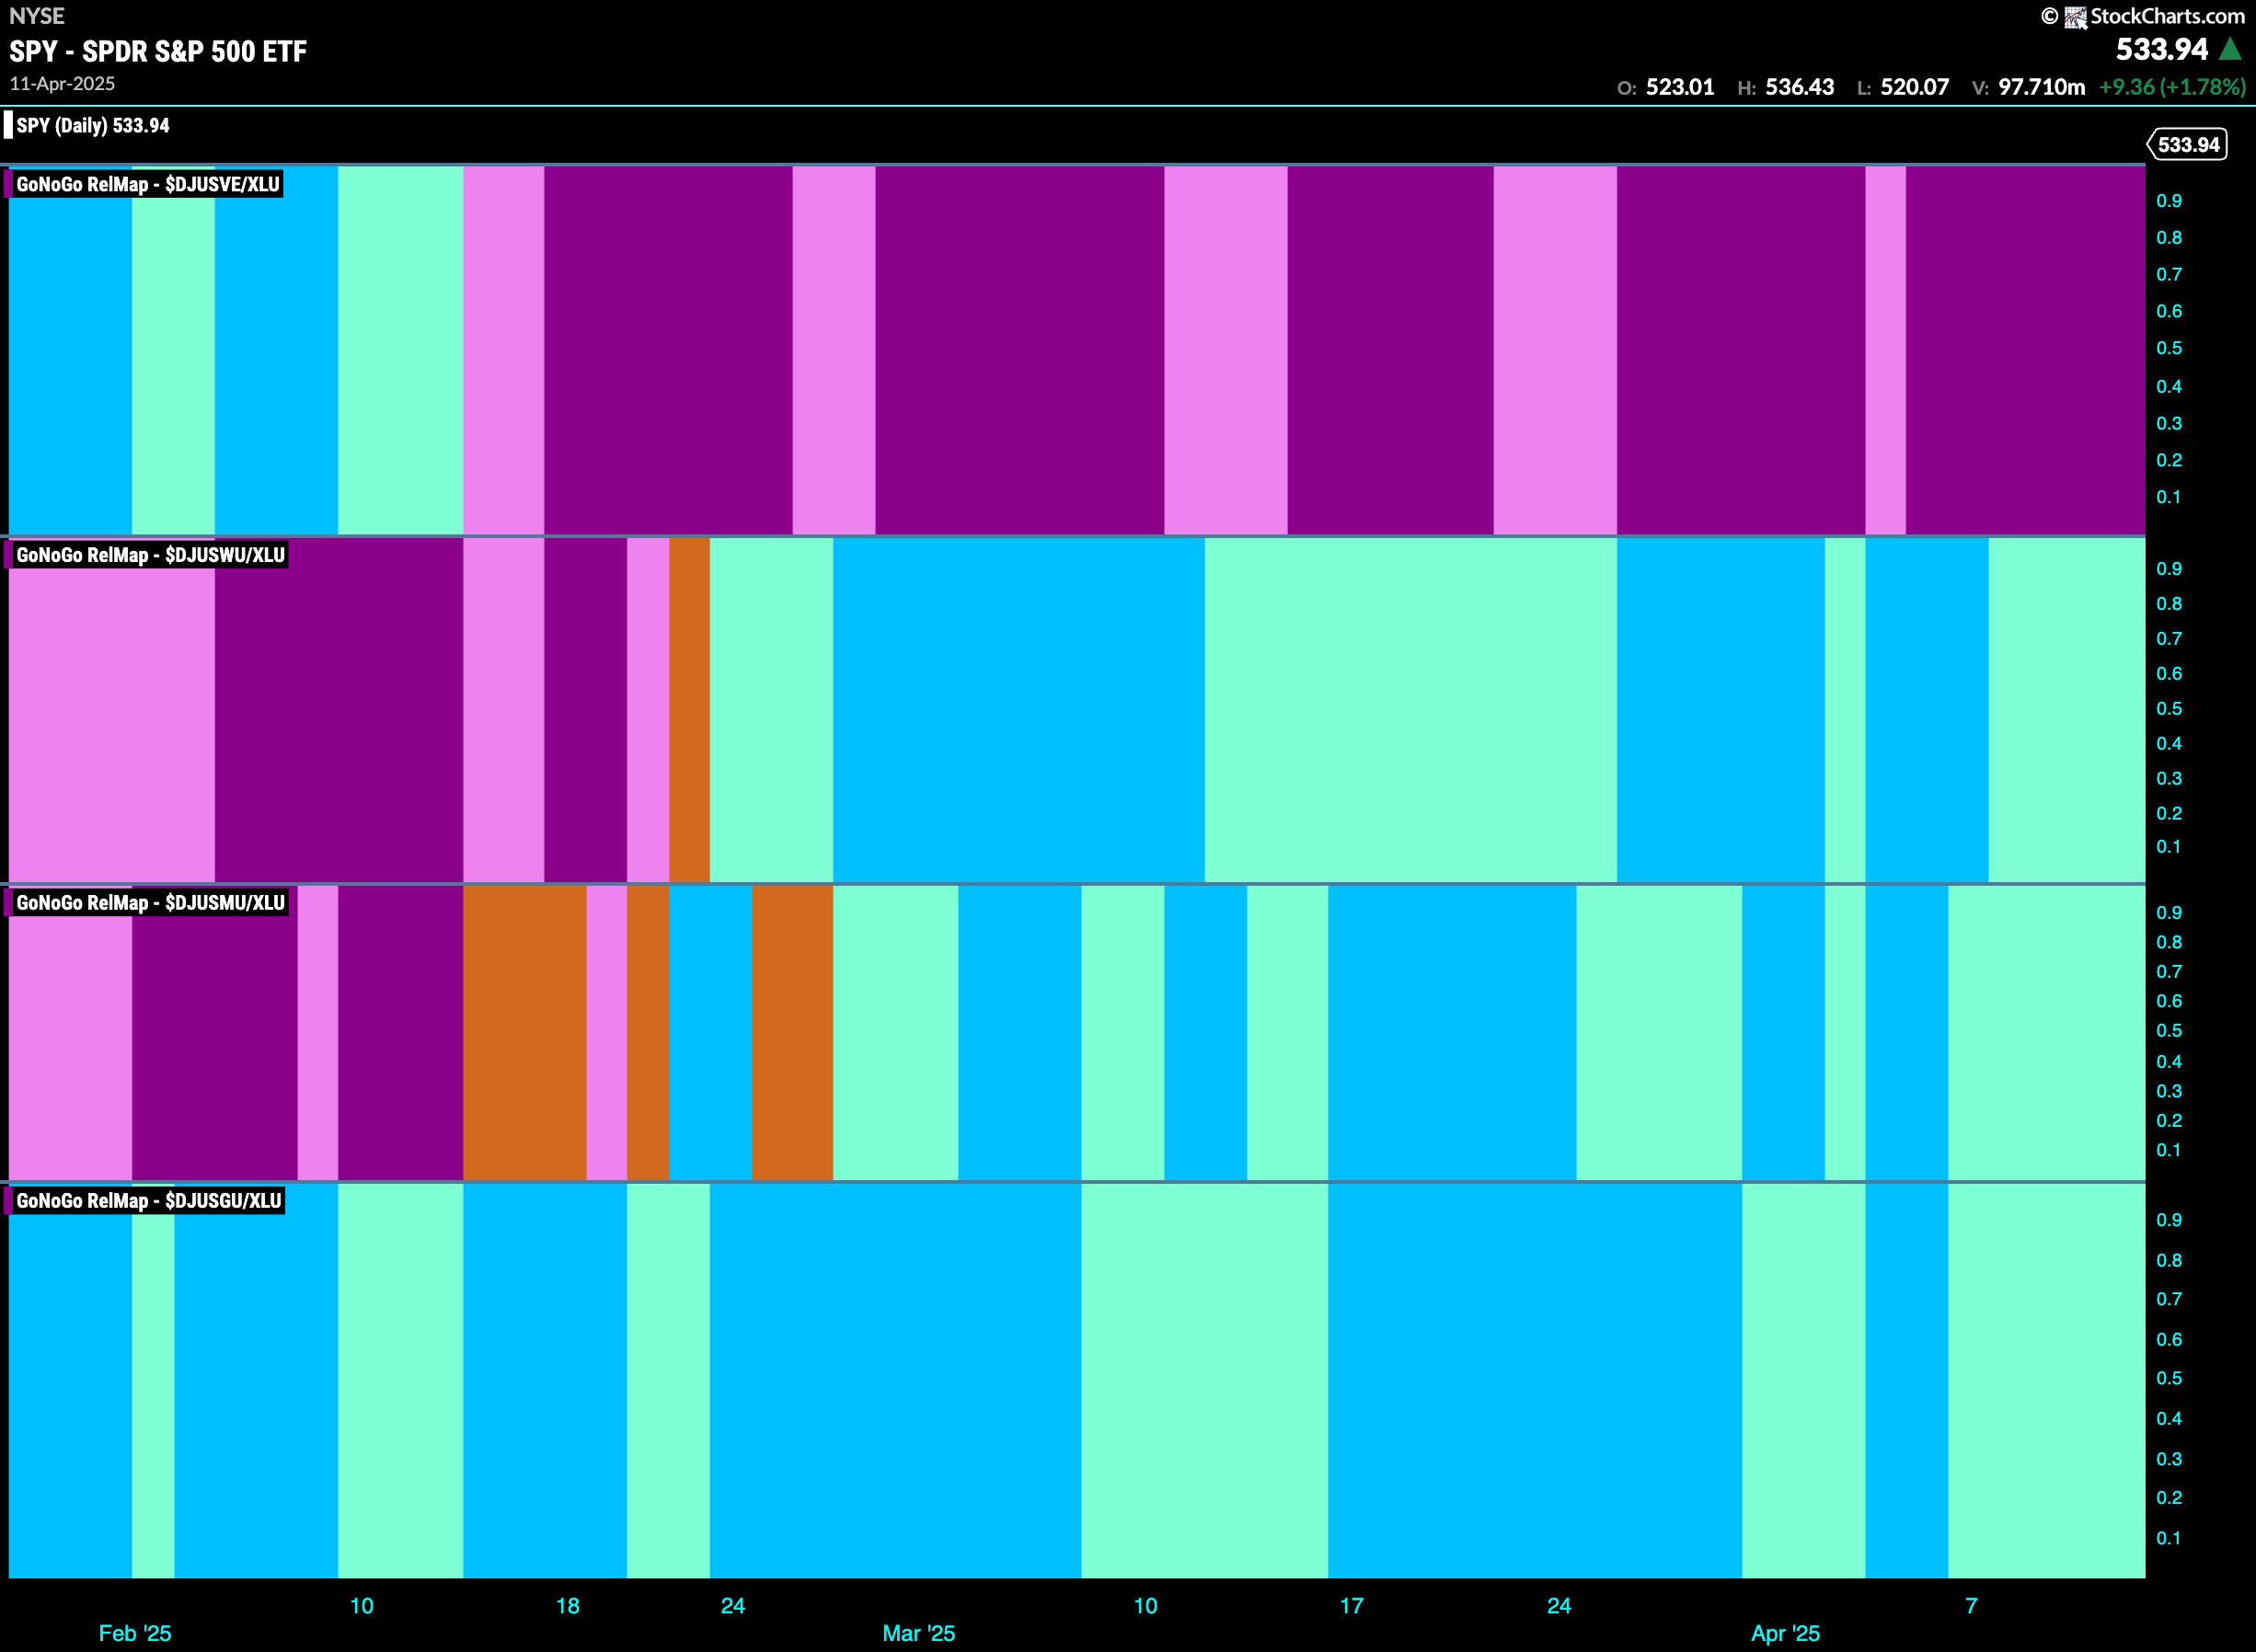
The chart below shows a relative trend breakdown of the sub groups within the tech sector this week. The Sub-Group RelMap plots the GoNoGo Trend of each sub index to the $XLU. We saw in the above GoNoGo Sector RelMap that $XLU is one of the longest remaining out-performers of the base index. When we look at the below RelMap we can see that in the 4th panel, the gas distribution index has been out-performing for some time.
$NFG Re-enters “Go” Trend
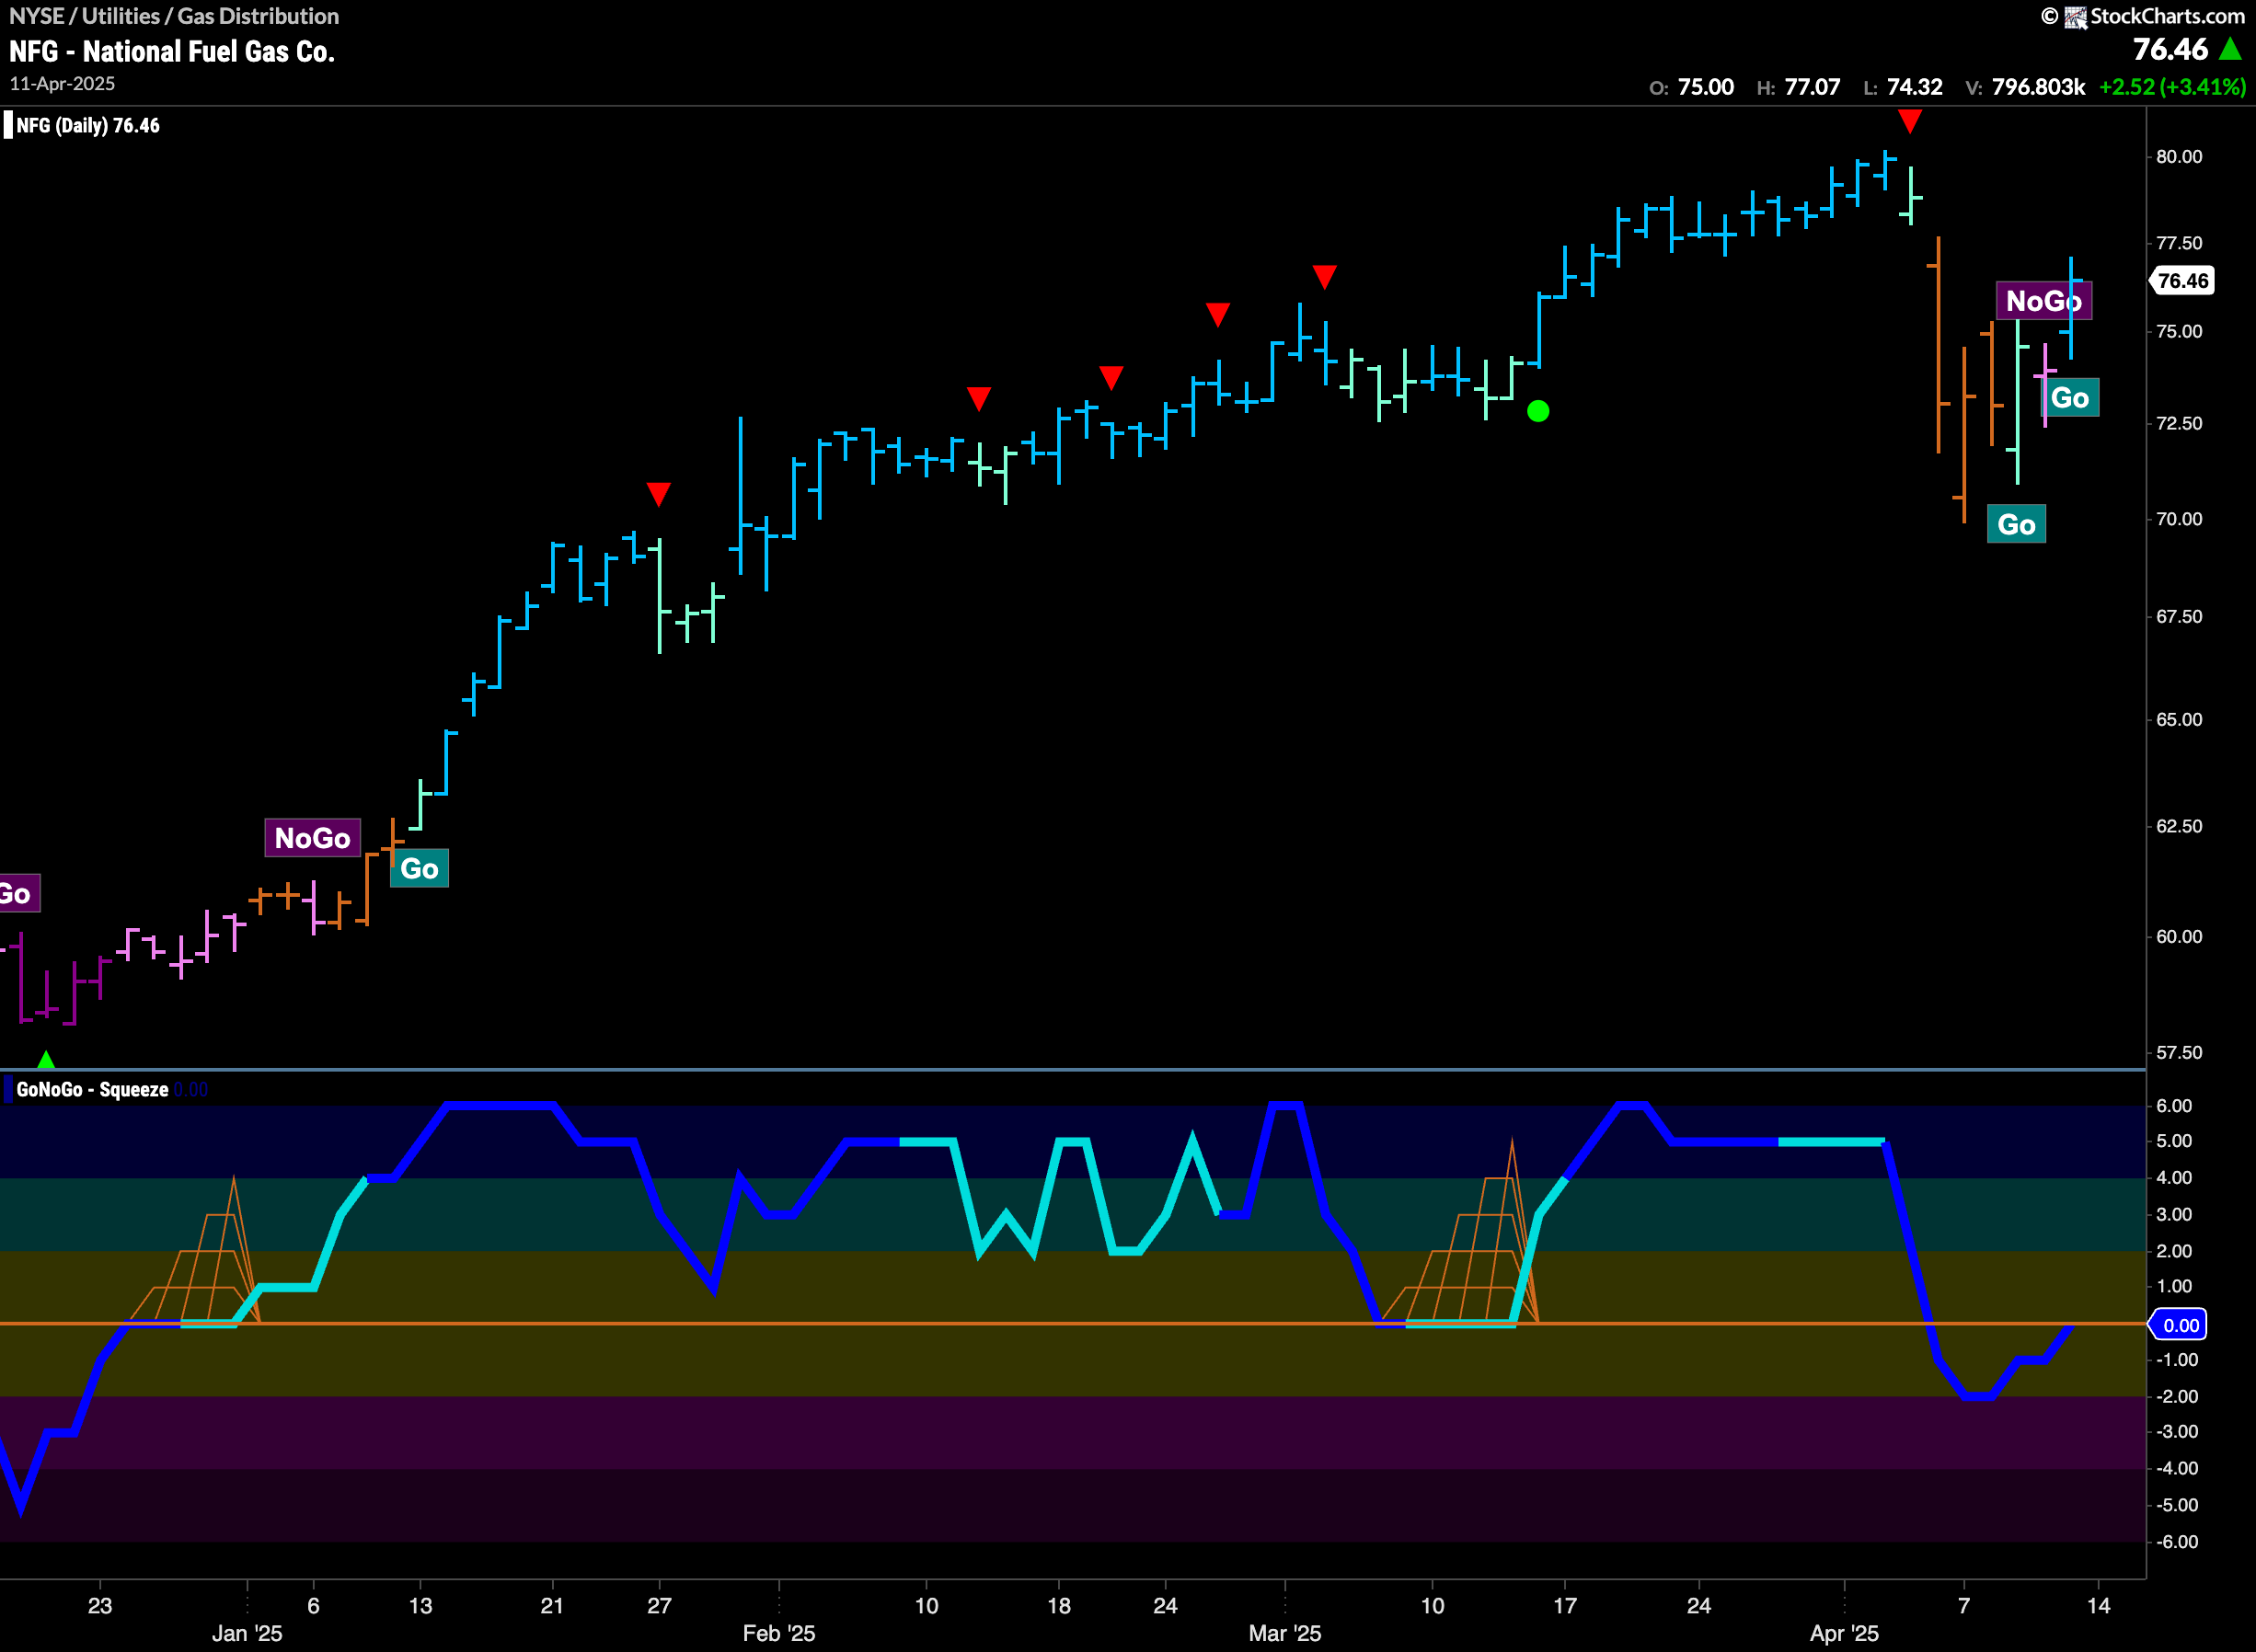
GoNoGo Trend shows that after some bars of uncertainty, a new strong blue “Go” bar is helping prices rally from the recent low. This comes as GoNoGo Oscillator tests the zero line from below on heavy volume. It will be important to watch what happens here. If the oscillator is able to regain positive territory we would know that momentum is resurgent in the direction of the new “Go” trend and we could expect that to push price higher.
$CPK Remains in “Go” Trend
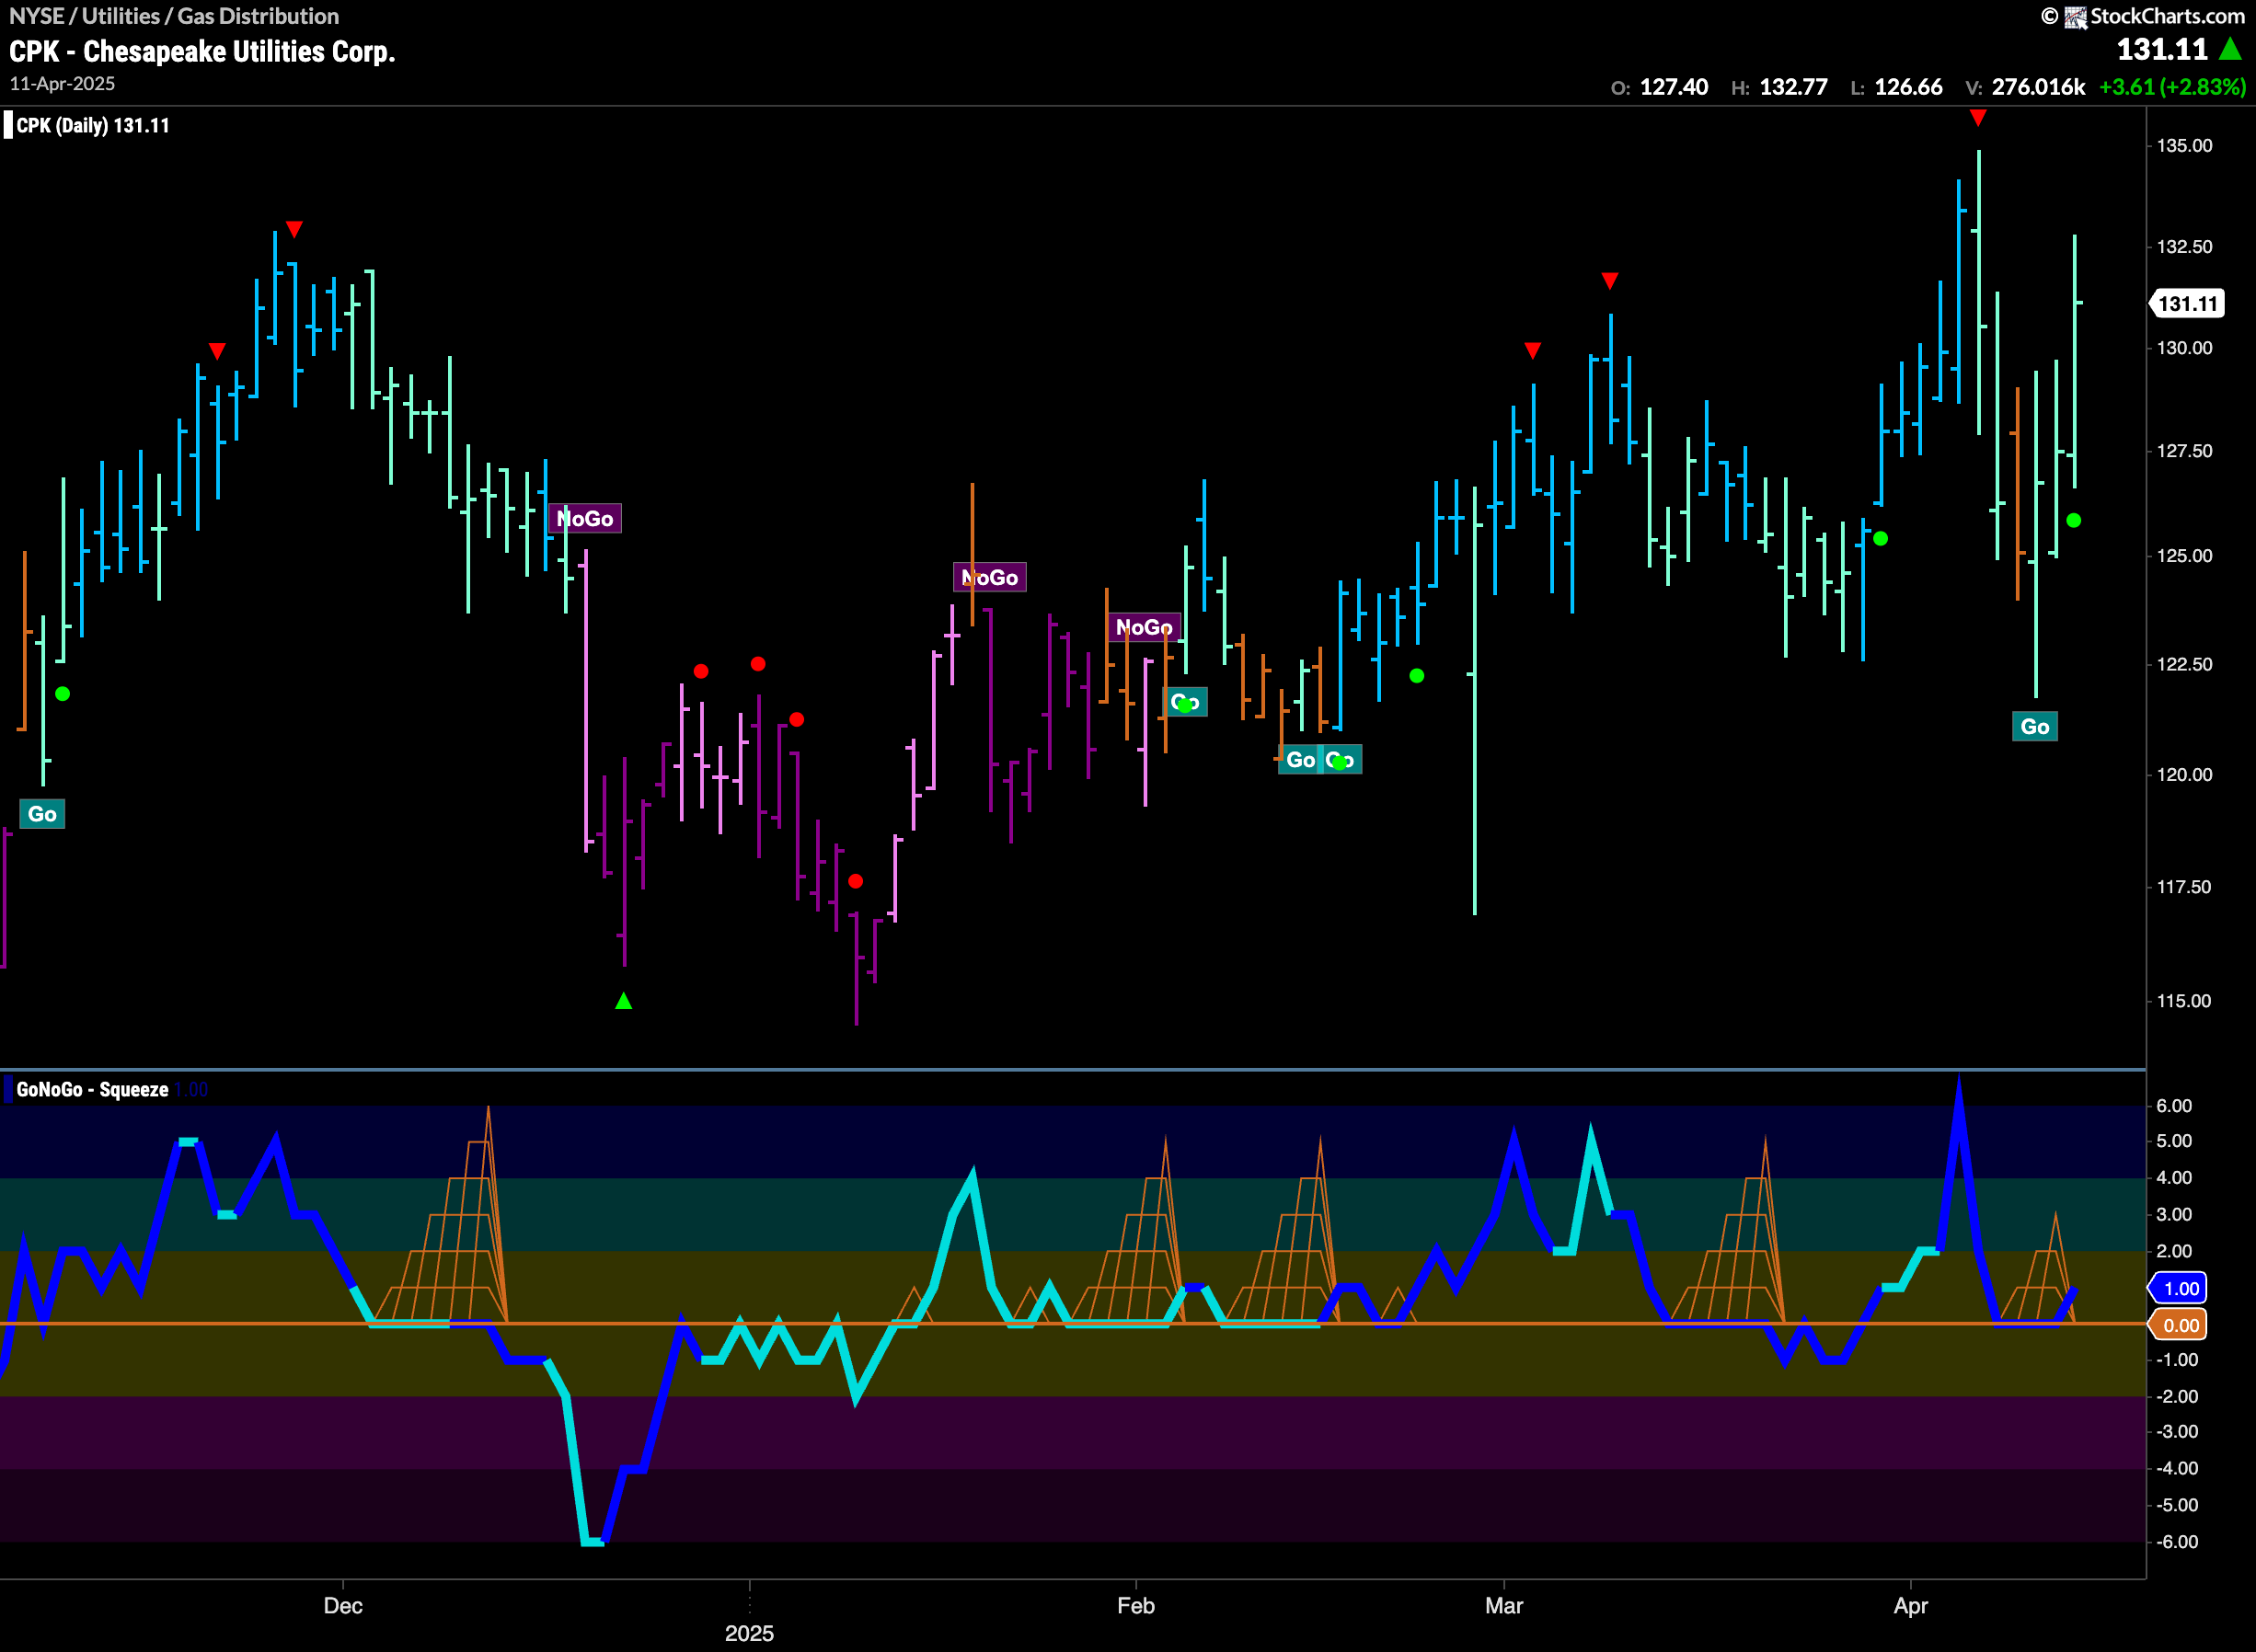
The chart below of $CPK shows that there has been volatile trading sessions for Chesapeake with large bars on a daily basis. With GoNoGo Trend painting weak aqua bars, it was important that GoNoGo Oscillator found support at the zero line and volume is heavy. This tells us that momentum is resurgent in the direction of the underlying “Go” trend and this could help the trend recover its strength. If it does, we will look for price to challenge for a new high.
