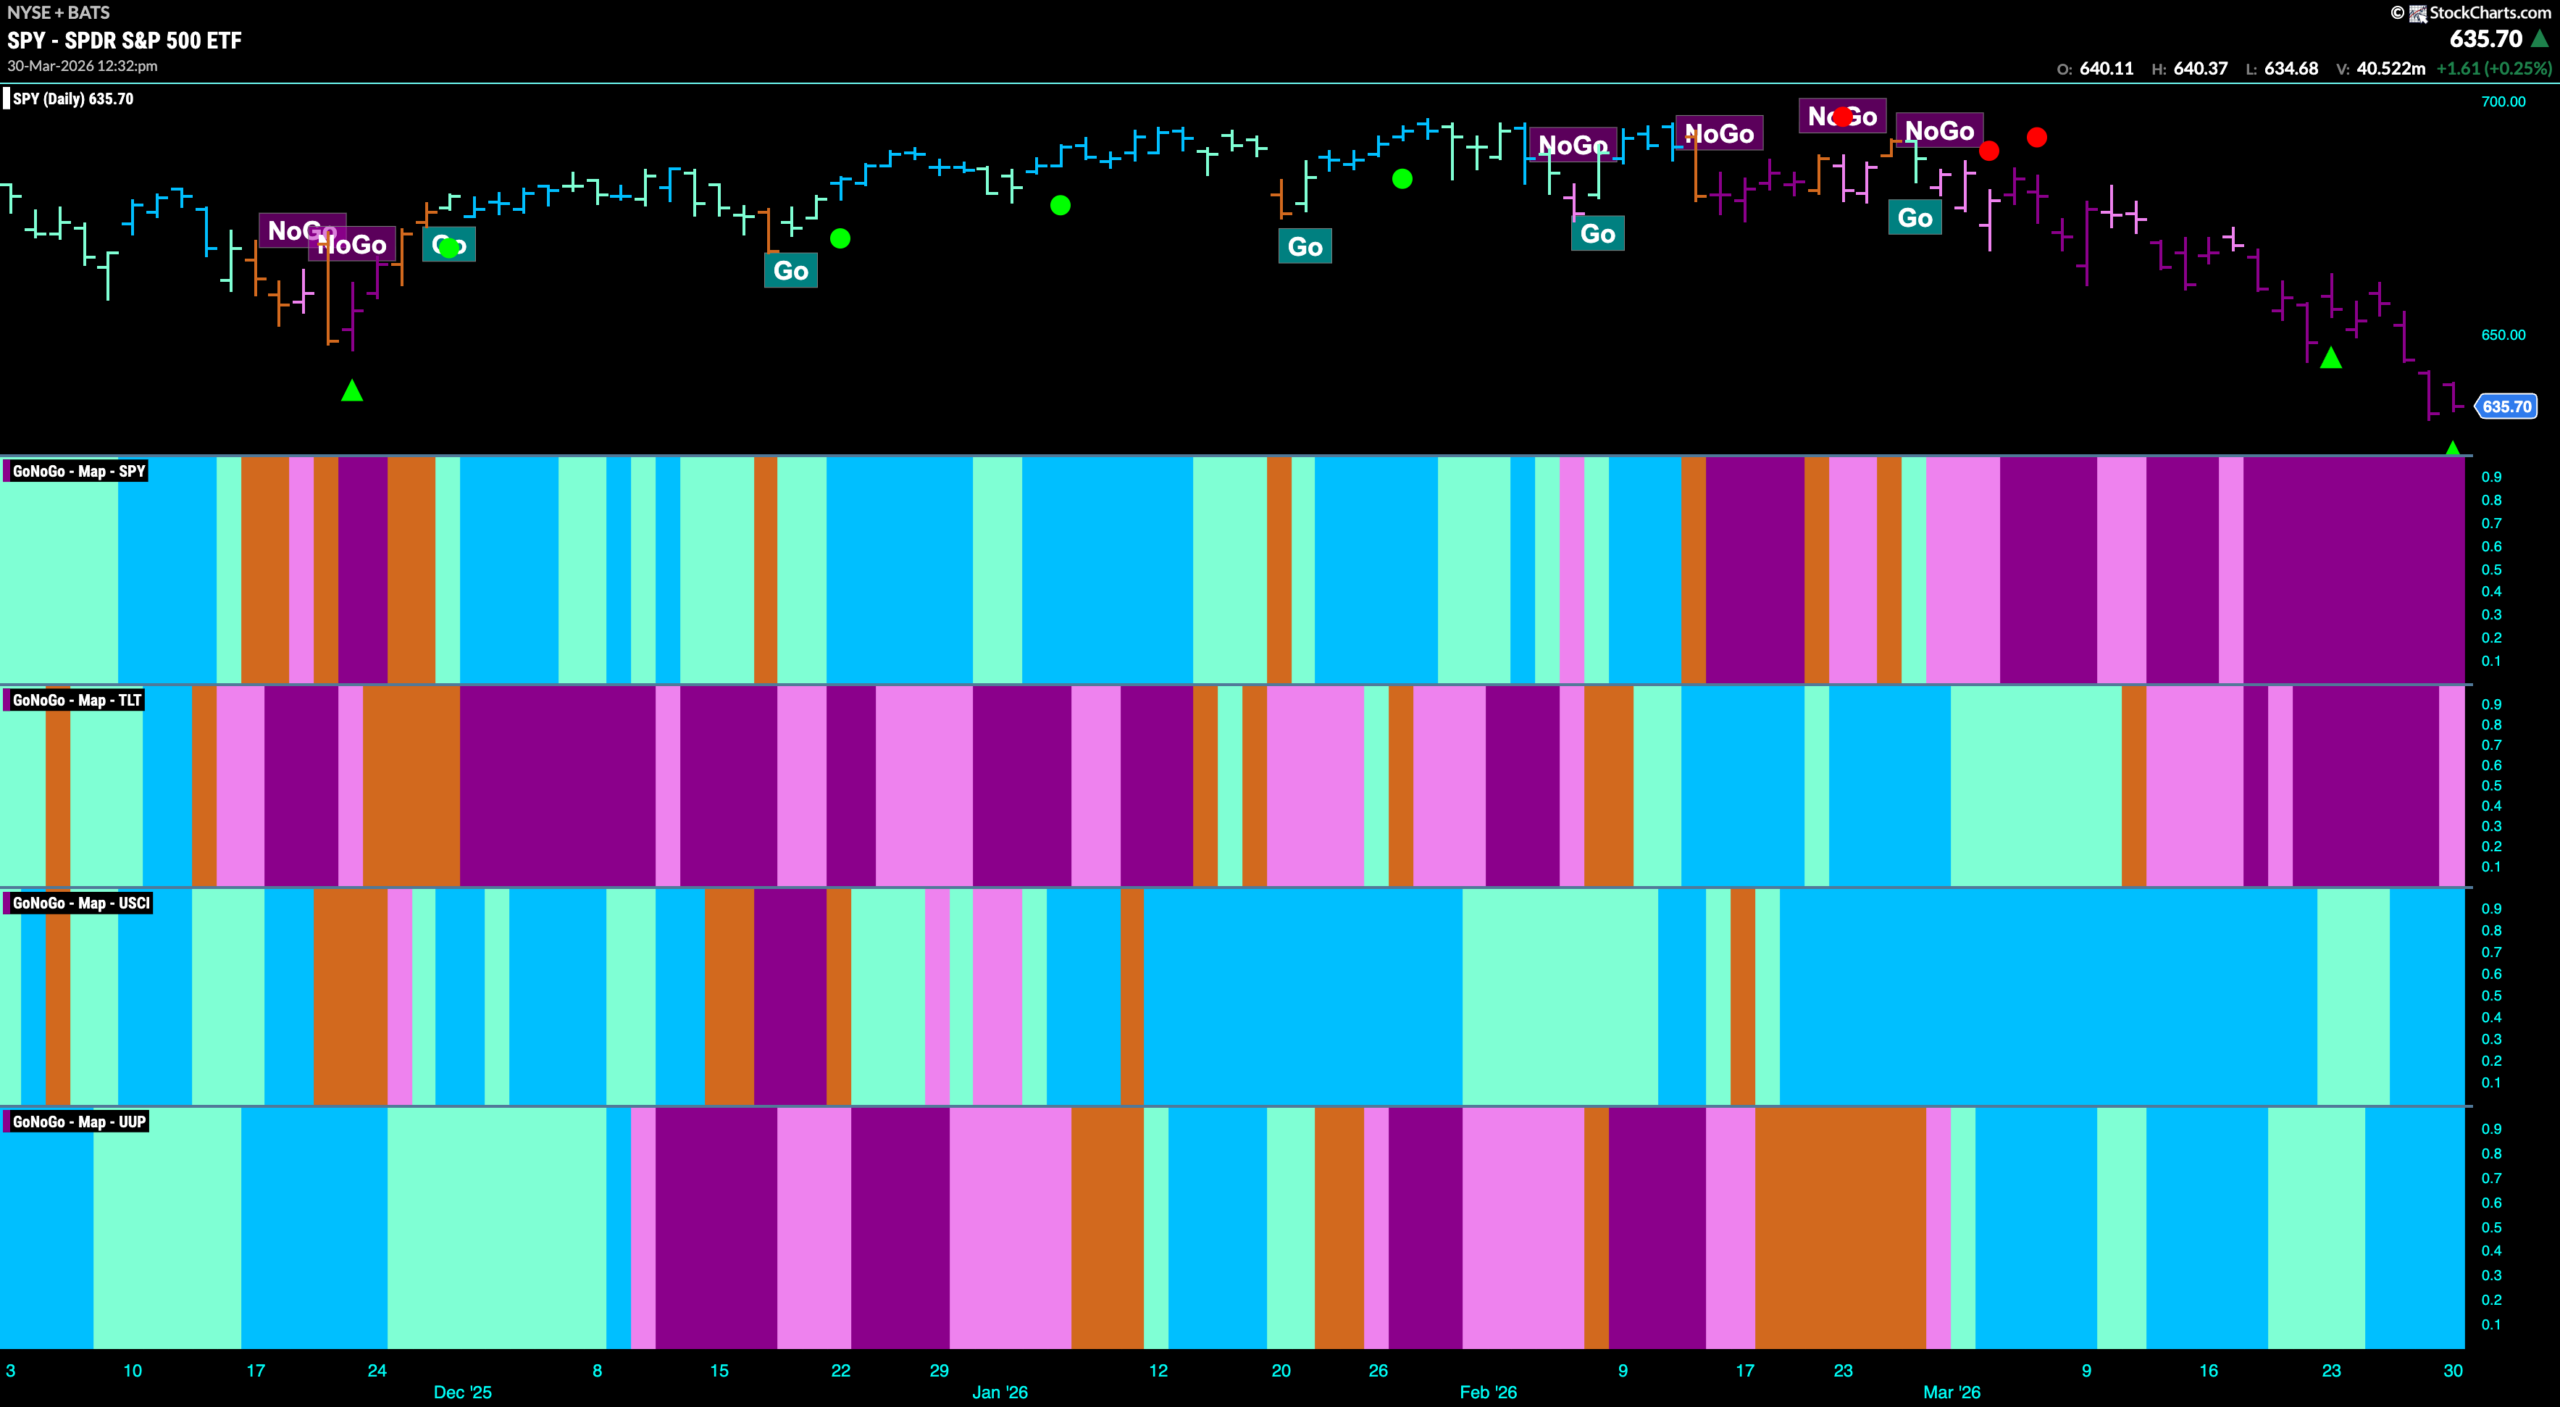
Good morning and welcome to this week’s Flight Path. The equity trend remained a “NoGo” with the indicator painting strong purple bars for the entire week as price fell to make another lower low. Treasury bond prices remained in a “NoGo” trend but we saw weakness creep in with a pink bar at the end of the week. U.S. commodity prices remained in a “Go” trend and we saw strong blue “Go’ bars for most of the week. A strong week for the U.S. dollar saw GoNoGo Trend paint mostly bright blue “Go” bars as the trend remained in place for another week.
$SPY Falls to New Lows
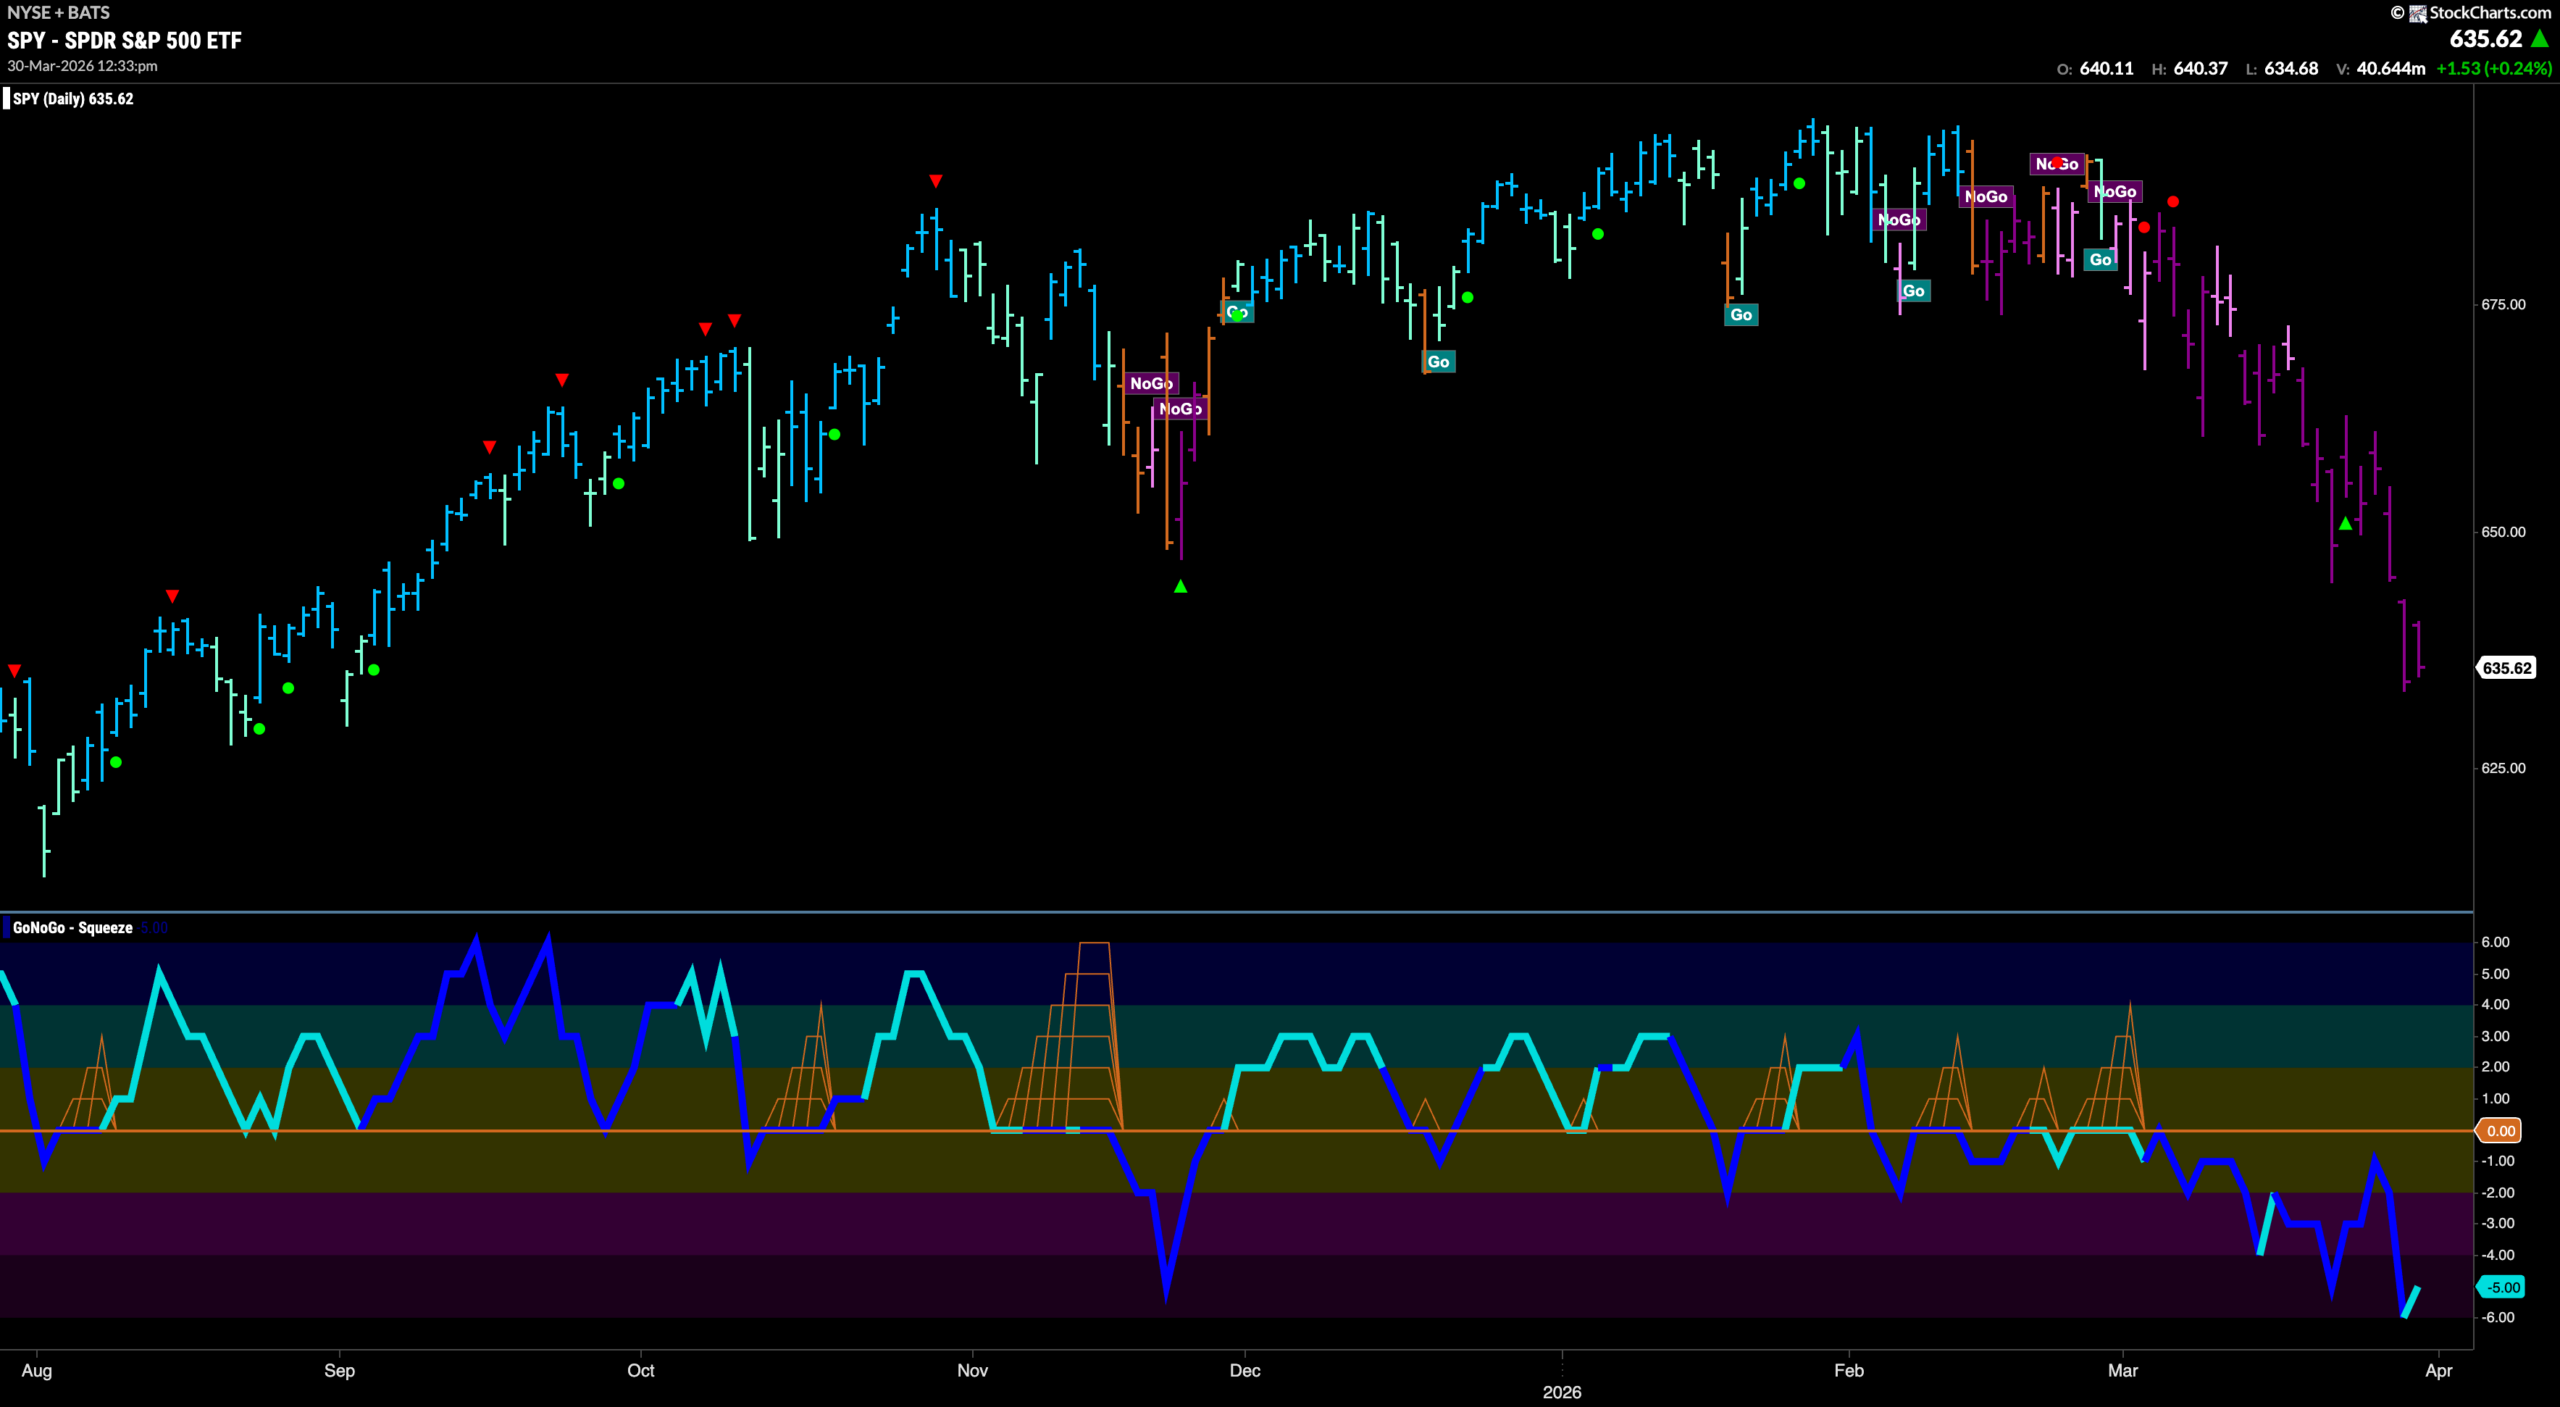
The GoNoGo chart below shows that the “NoGo” was strong this week. We saw uninterrupted purple bars showing the strength of the trend. Price fell again and November’s low was no match for the downside pressure as a new lower low was made last week. GoNoGo Oscillator tried to rally to the zero line but didn’t quite get there as it rolled over on heavy volume and fell to oversold extremes. Right now we see it at a value of -5.
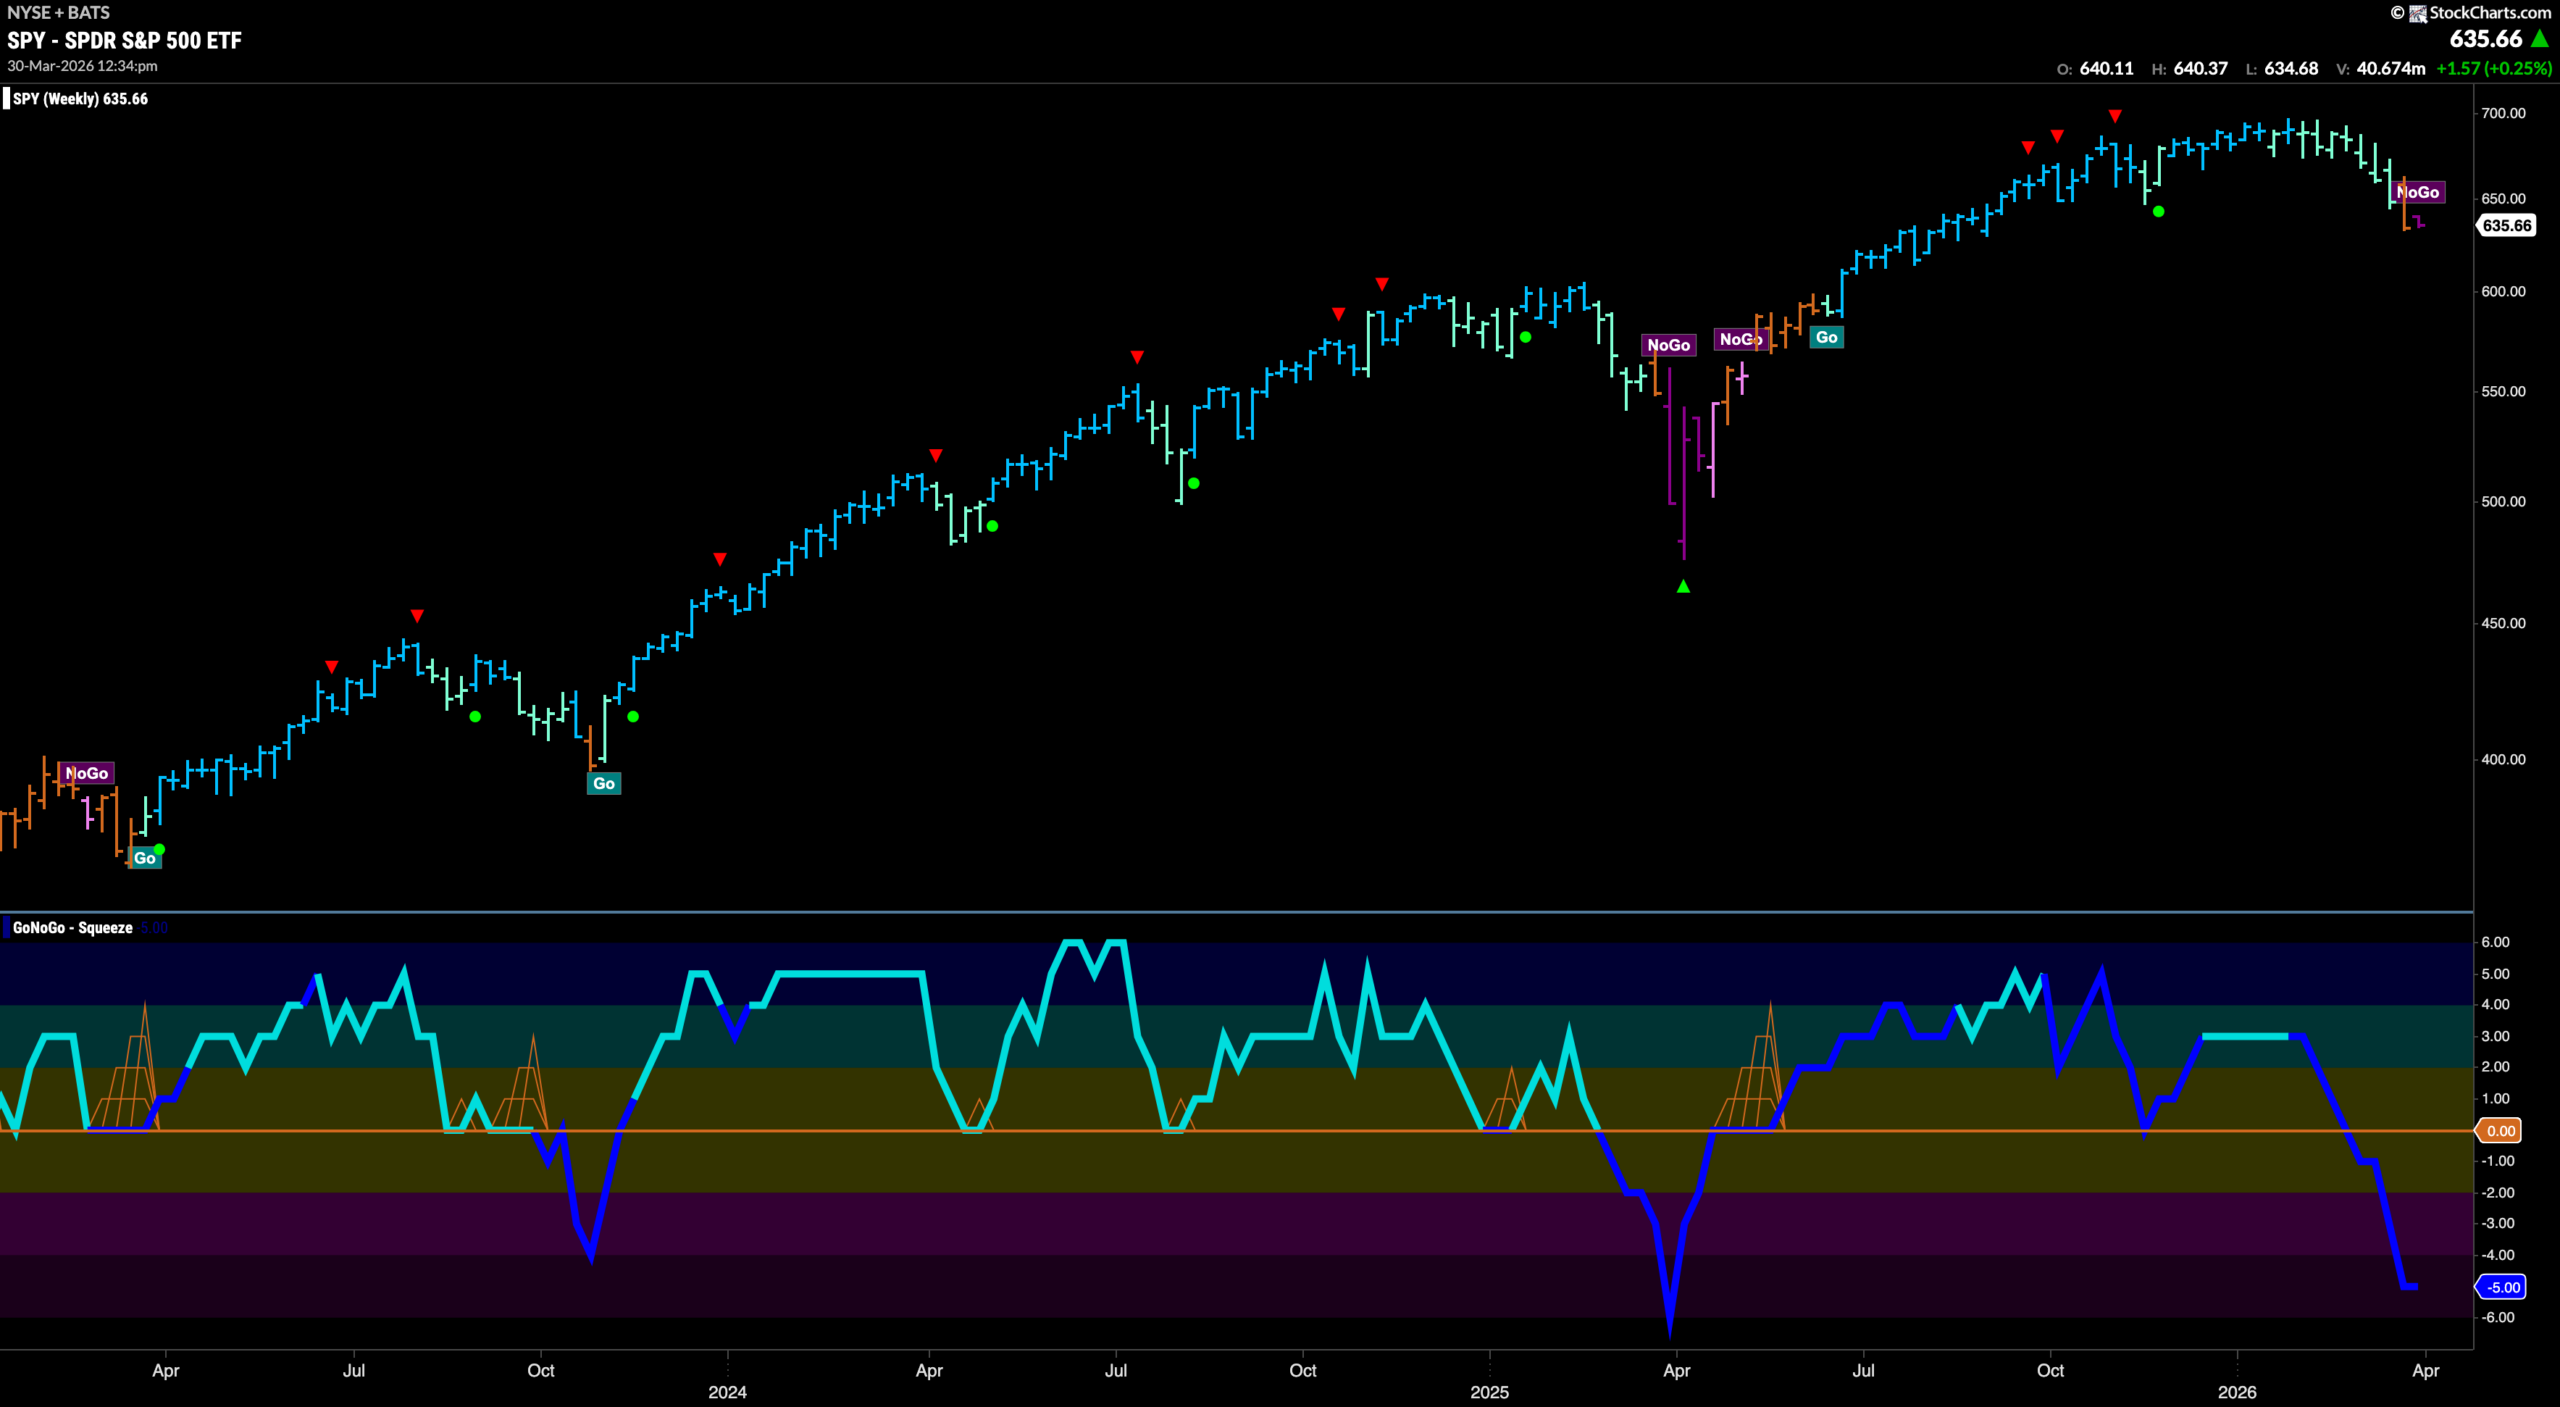
The weekly chart shows that we have transitioned out of the “Go” trend for the first time since last spring. Last week GoNoGo Trend painted an amber “Go Fish” and the current bar shows we are entering a new “NoGo” trend should prices remain depressed this week. This comes after GoNoGo Oscillator crashed through the zero line a few weeks ago, failing to find support at that level. Now, with heavy market participation, we see that GoNoGo Oscillator is aligned with the new “NoGo” trend. We will watch to see if price falls further in the coming weeks.
Treasury Rates Remain in “Go” Trend
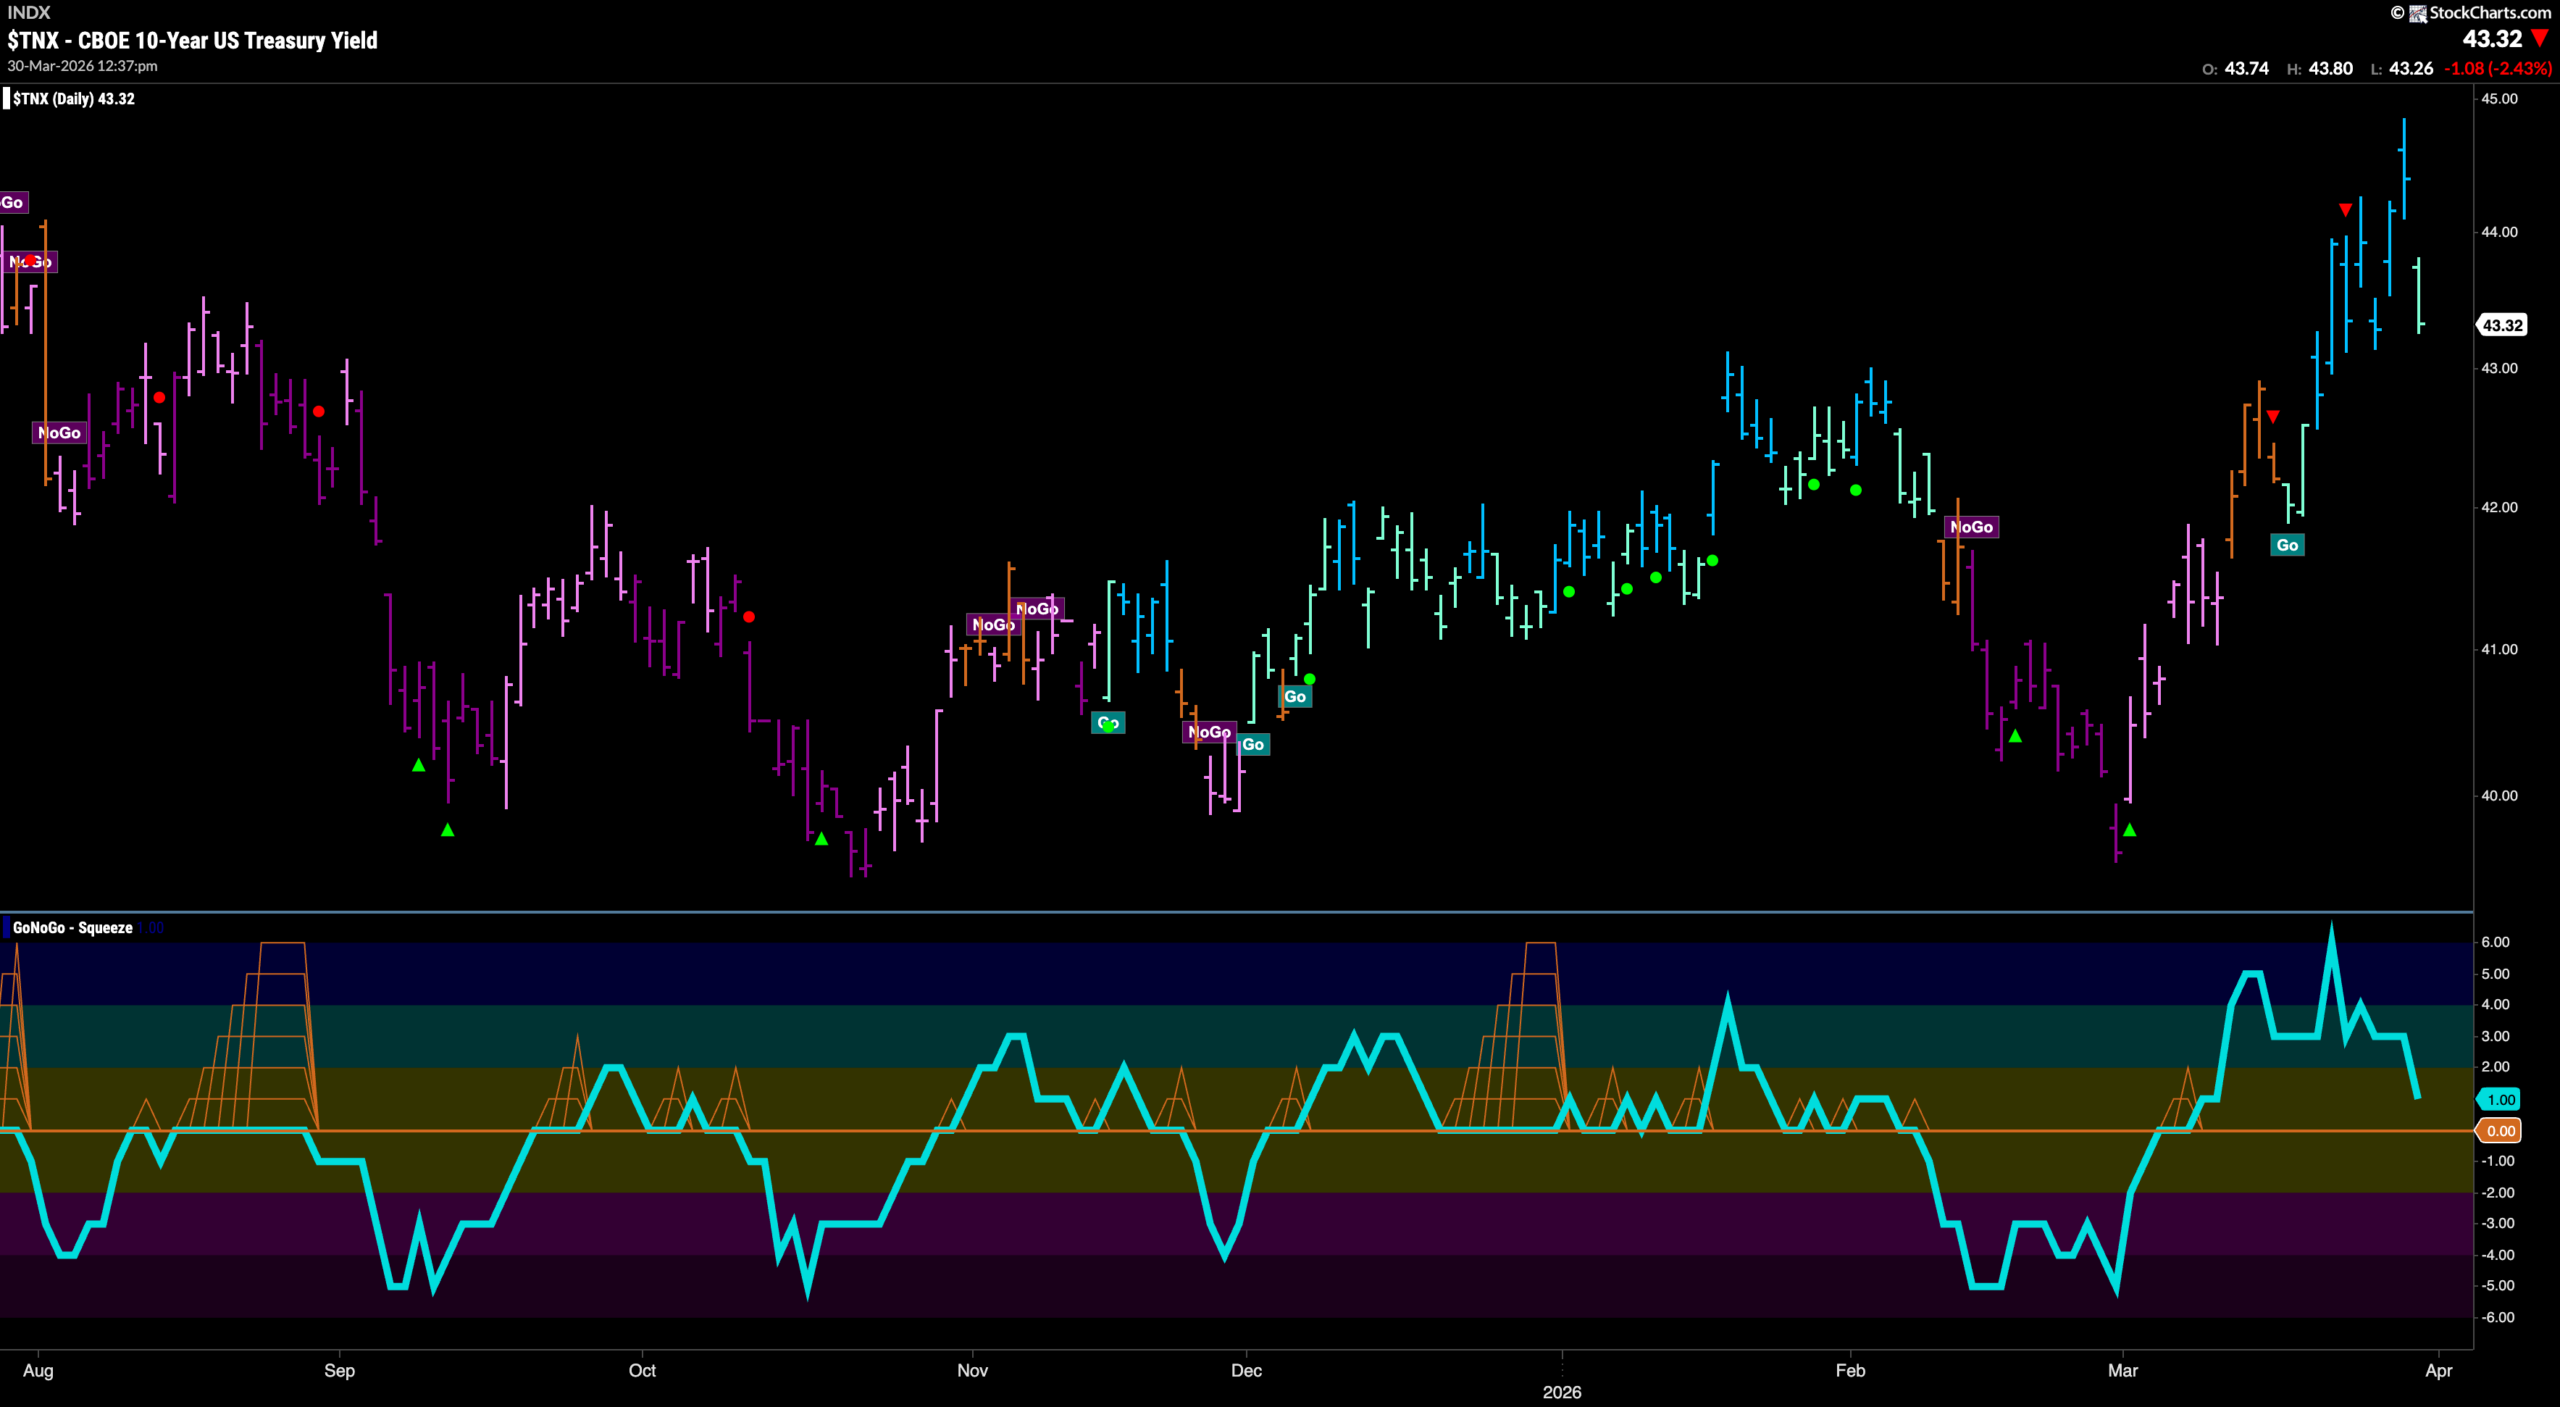
GoNoGo Trend shows that the “Go” trend remains in place as we see another higher high was made on strong blue “Go” bars. Now rates are above the highs from late January and early February we will watch to see if support is found should it be needed at those levels. GoNoGo Oscillator is in positive territory but no longer overbought and is fast approaching the zero line . We will watch to se if support is found at zero in the coming days and weeks. If the oscillator remains at or above the zero line then we will know that momentum is in line with the “Go” trend.
Dollar Sets New High in “Go” Trend
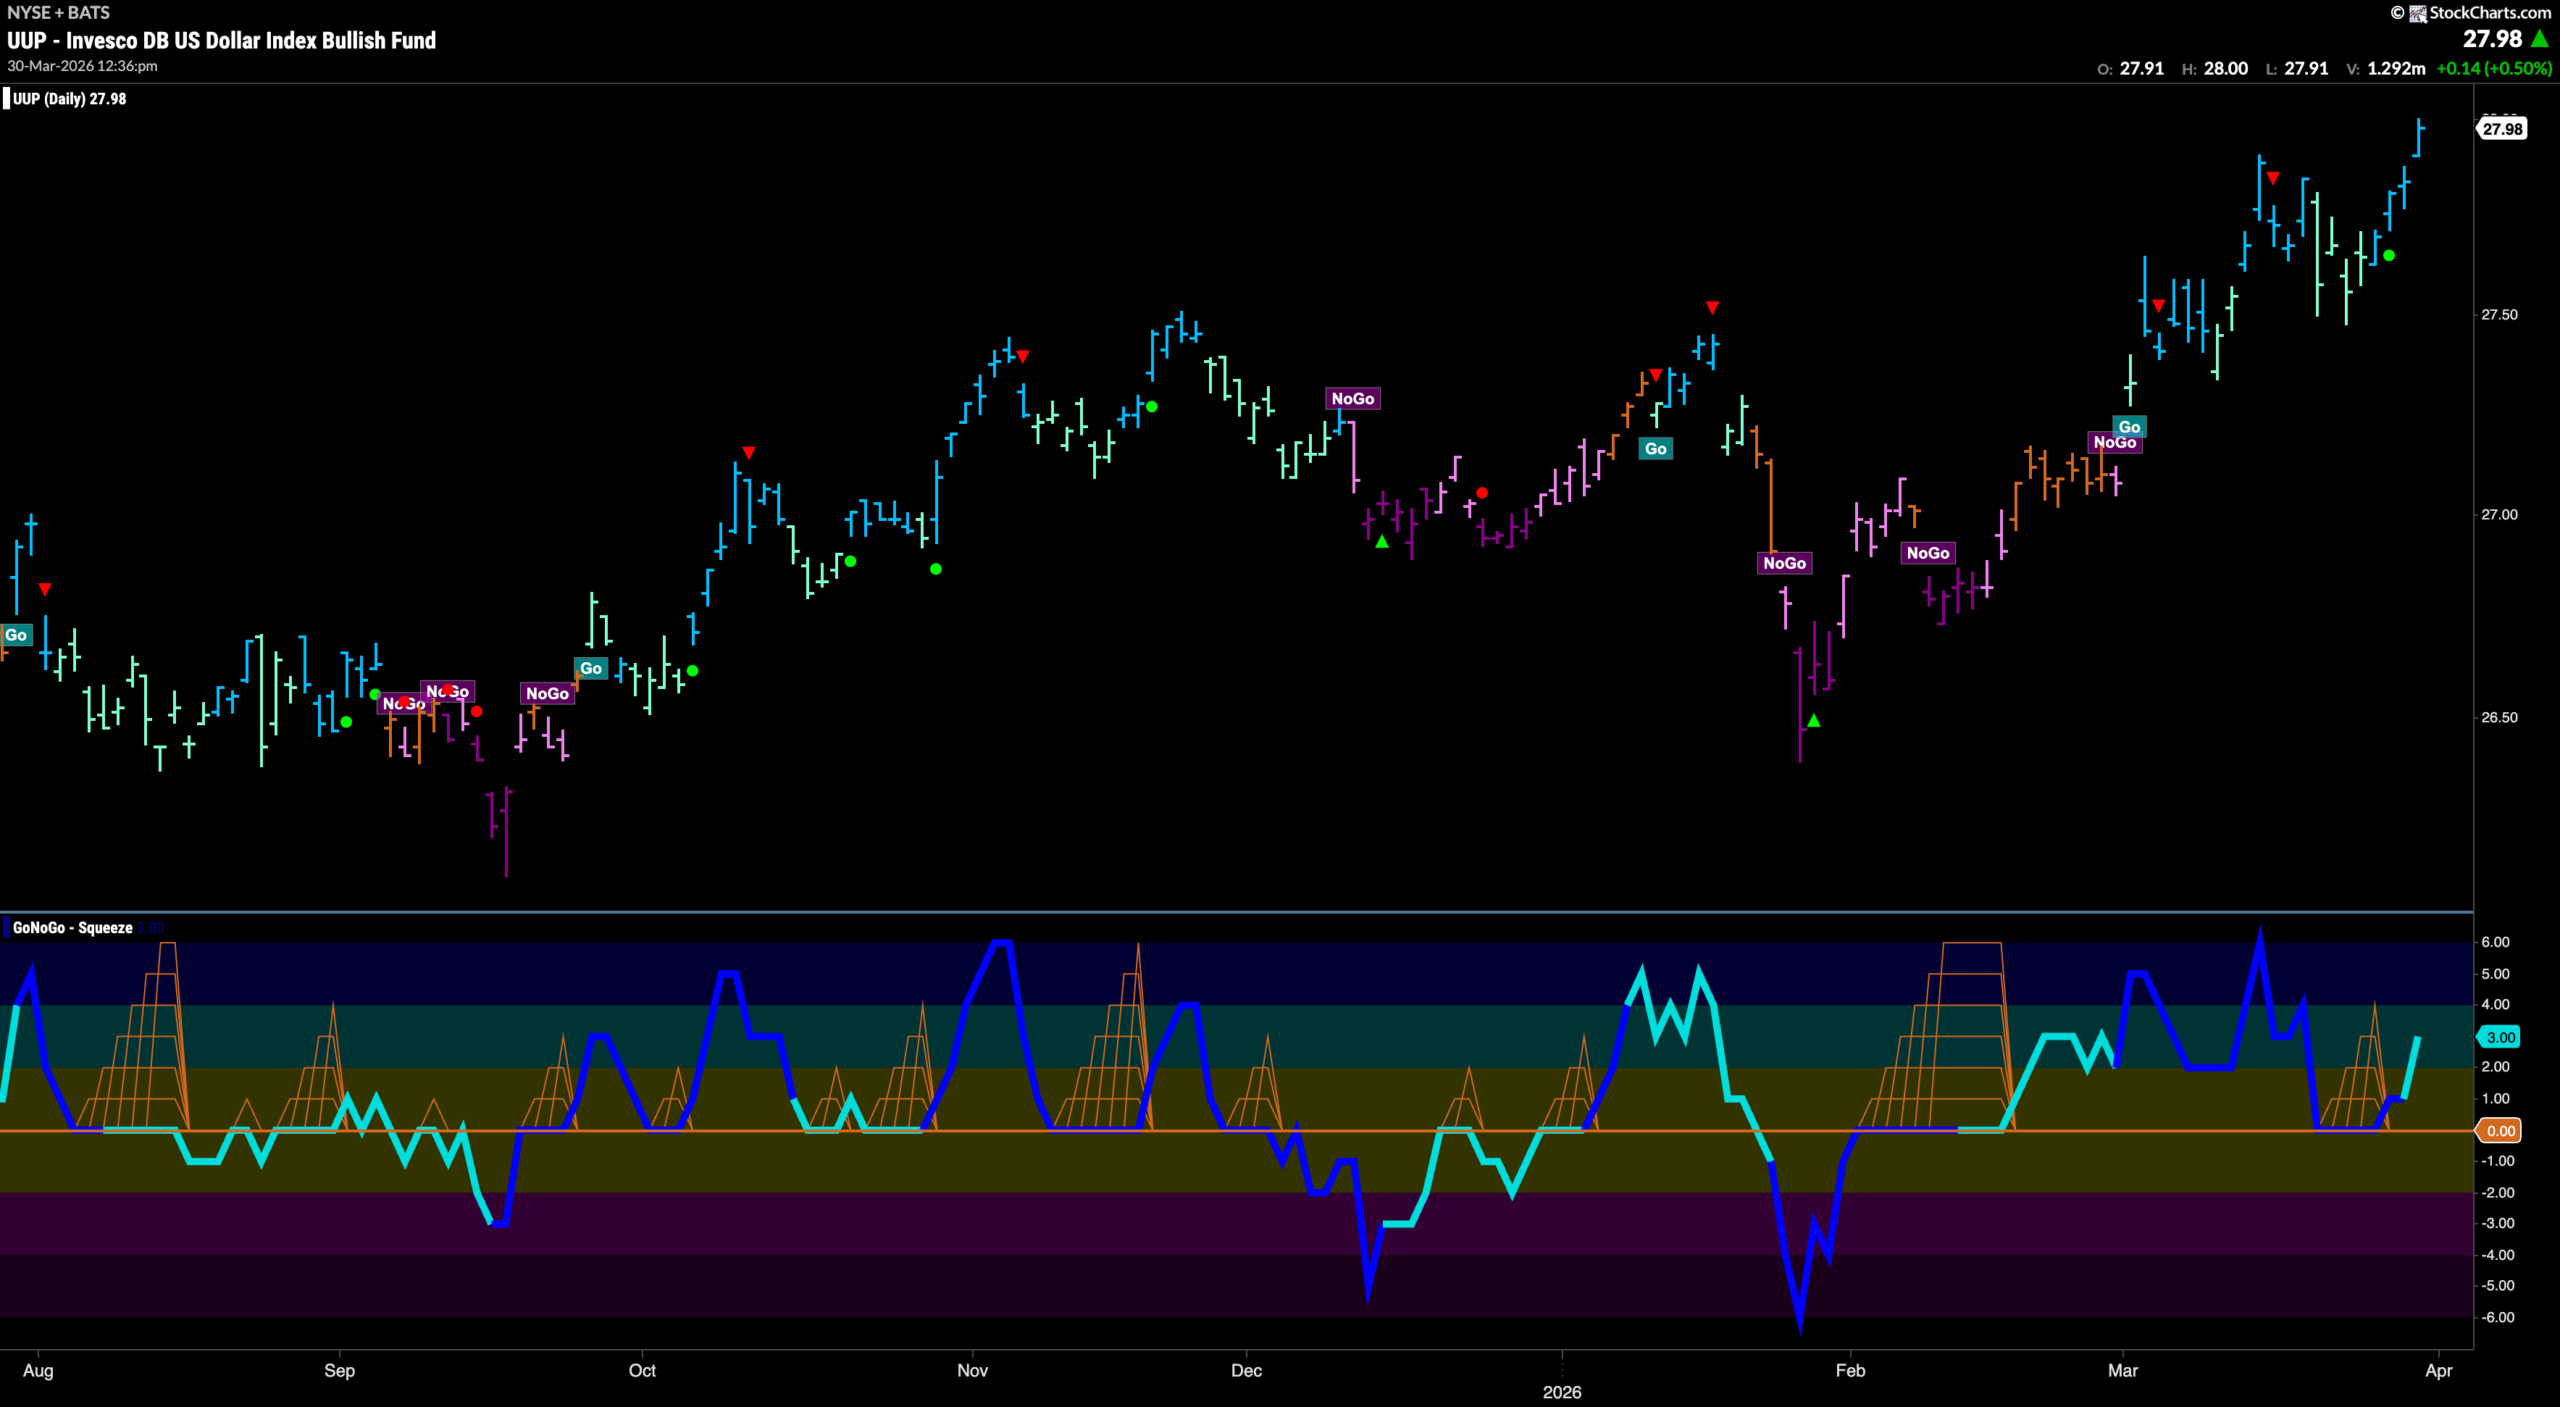
The chart below shows that the dollar remained in a “Go” trend and indeed we see strength as the indicator paints mostly bright blue bars. Currently, we see that price has gapped higher on a bright blue “Go” bar and is now at a new higher high. GoNoGo Oscillator recently found support again at the zero line and we know that momentum is therefore resurgent in the direction of the “Go” trend. Now at a value of 3, in positive territory but not overbought we know that momentum is in line with the trend.
After a Pause Oil Climbs Again
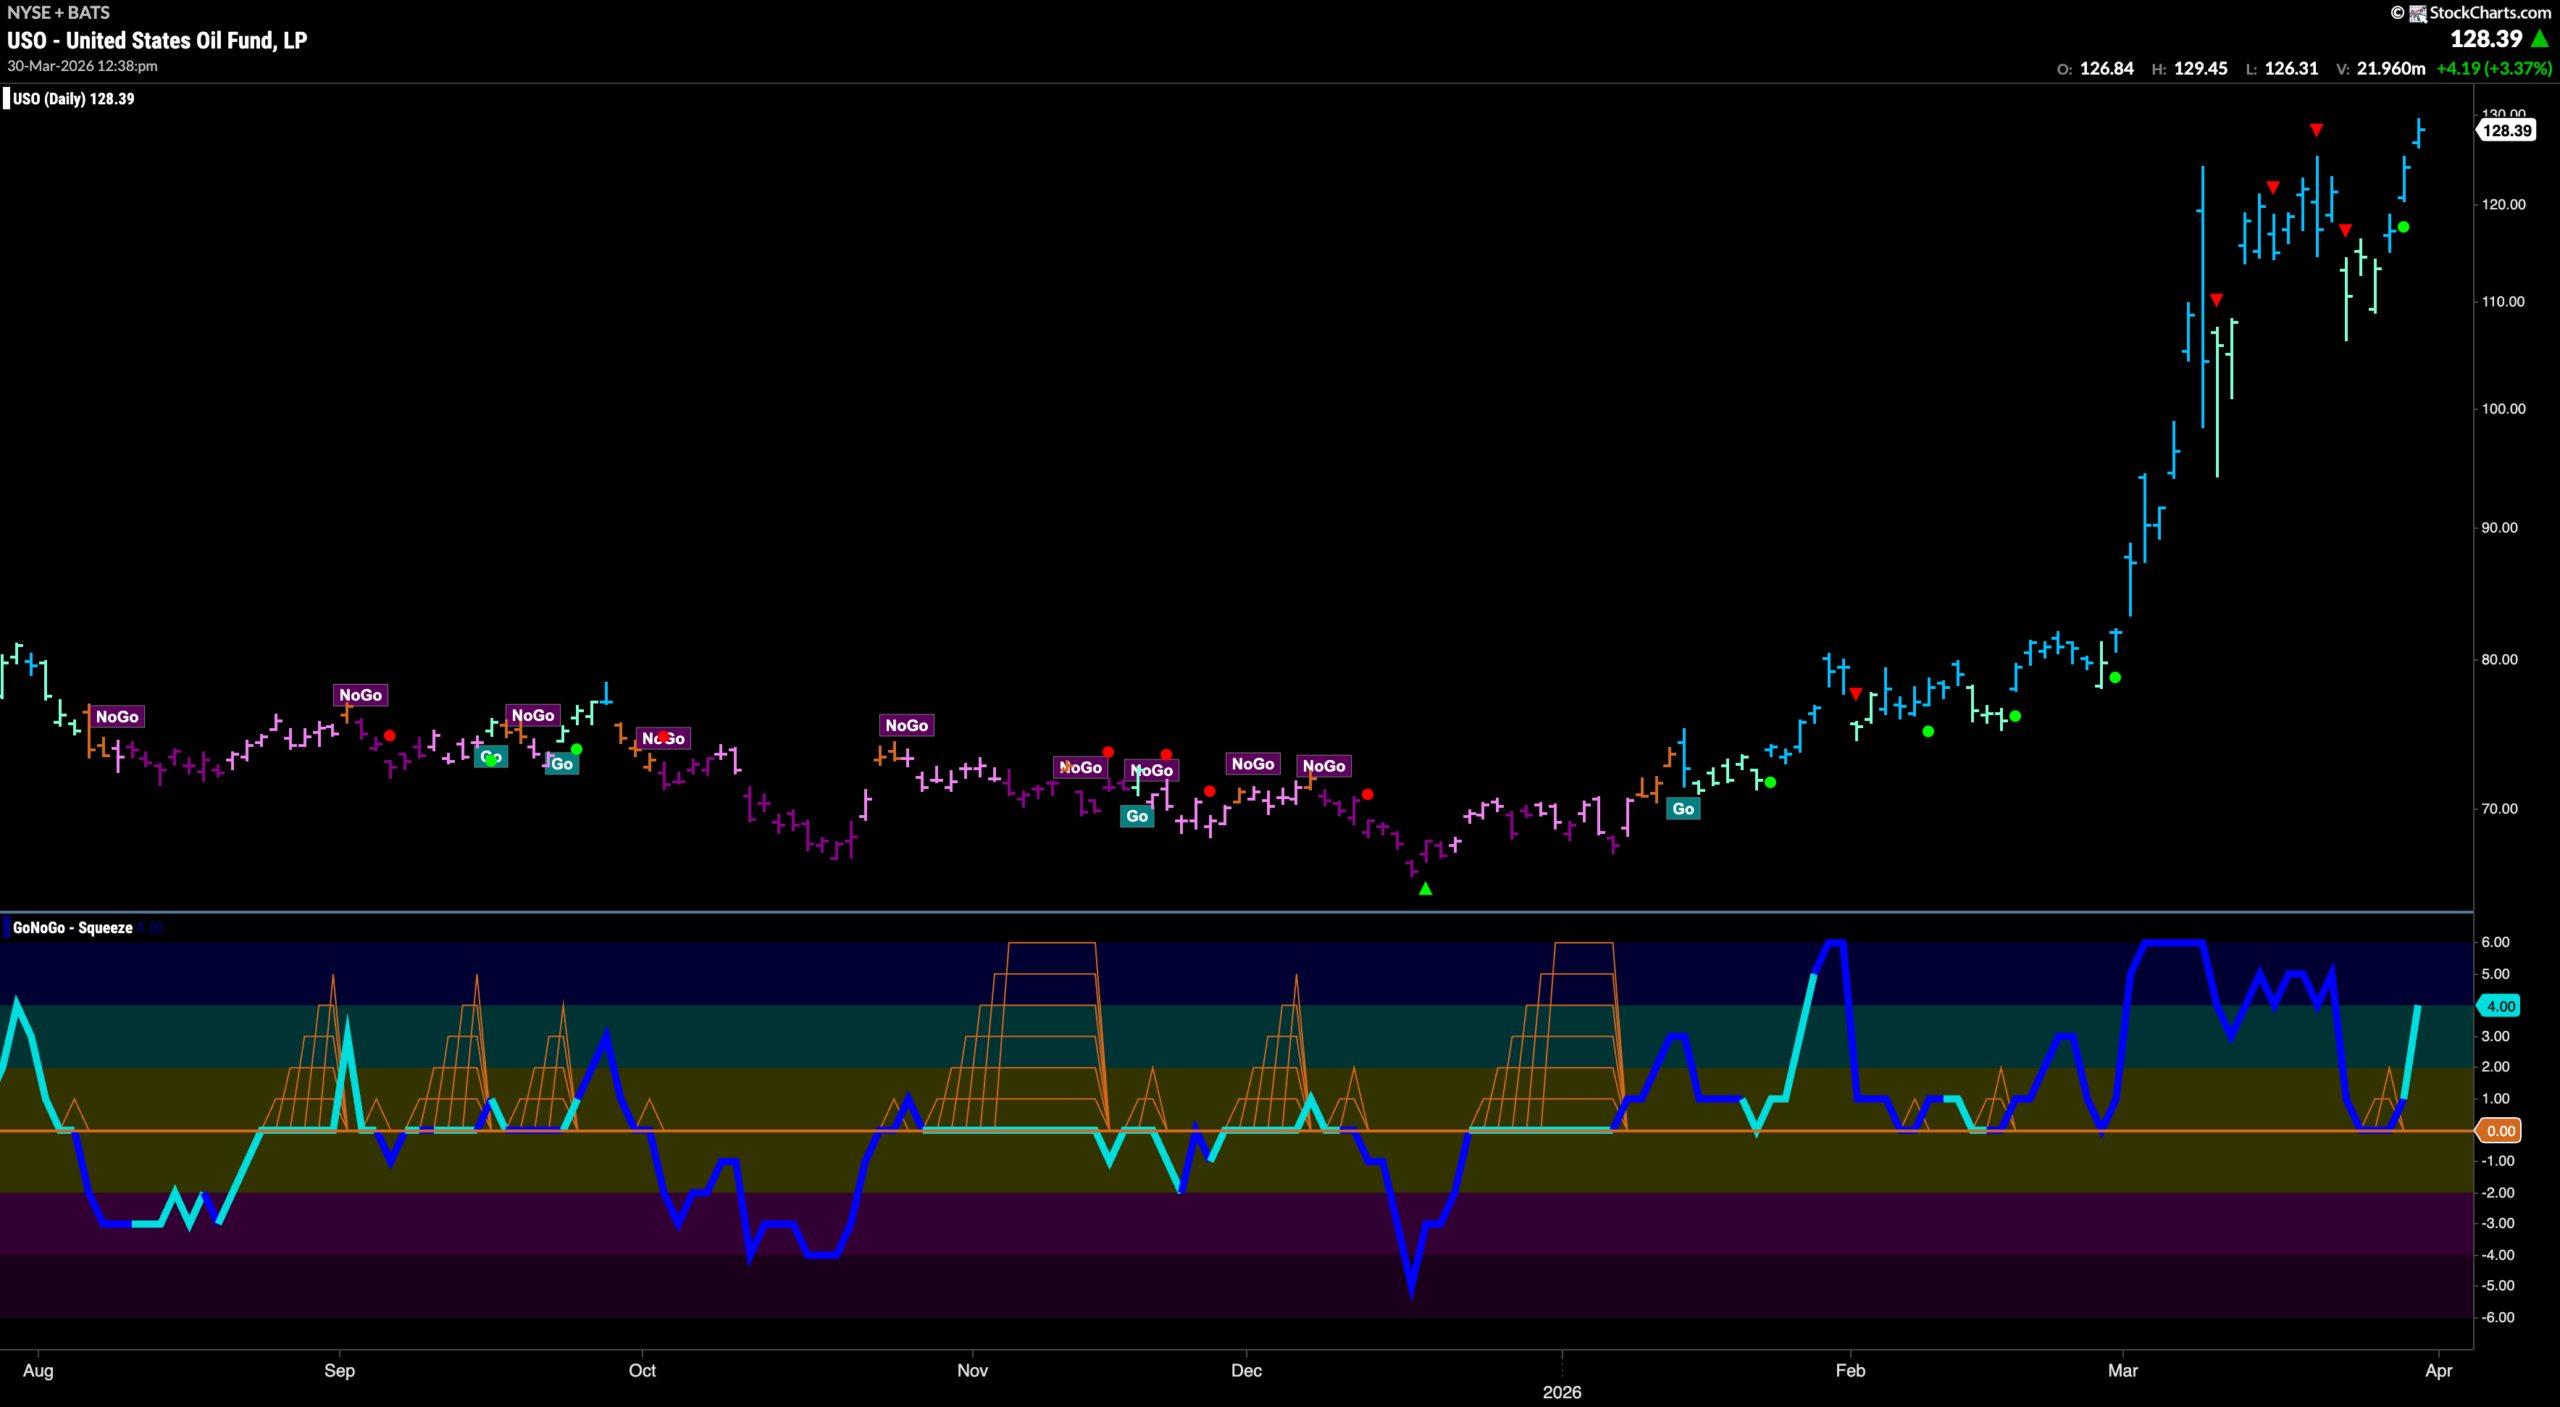
GoNoGo Trend shows that the “Go” trend remains for oil. After several Go Countertrend Correction Icons (red arrows) indicating likely short term struggles we saw weakness with paler aqua bars. However, when GoNoGo Oscillator tested the zero line from above support was found. This triggered a Go Trend Continuation Icon (green circle) under the price bar telling us that momentum was once again resurgent in the direction of the “Go” trend. This momentum boost has given price the push it needed to move to a new higher high.
Gold Now in “NoGo” Trend with New Lows
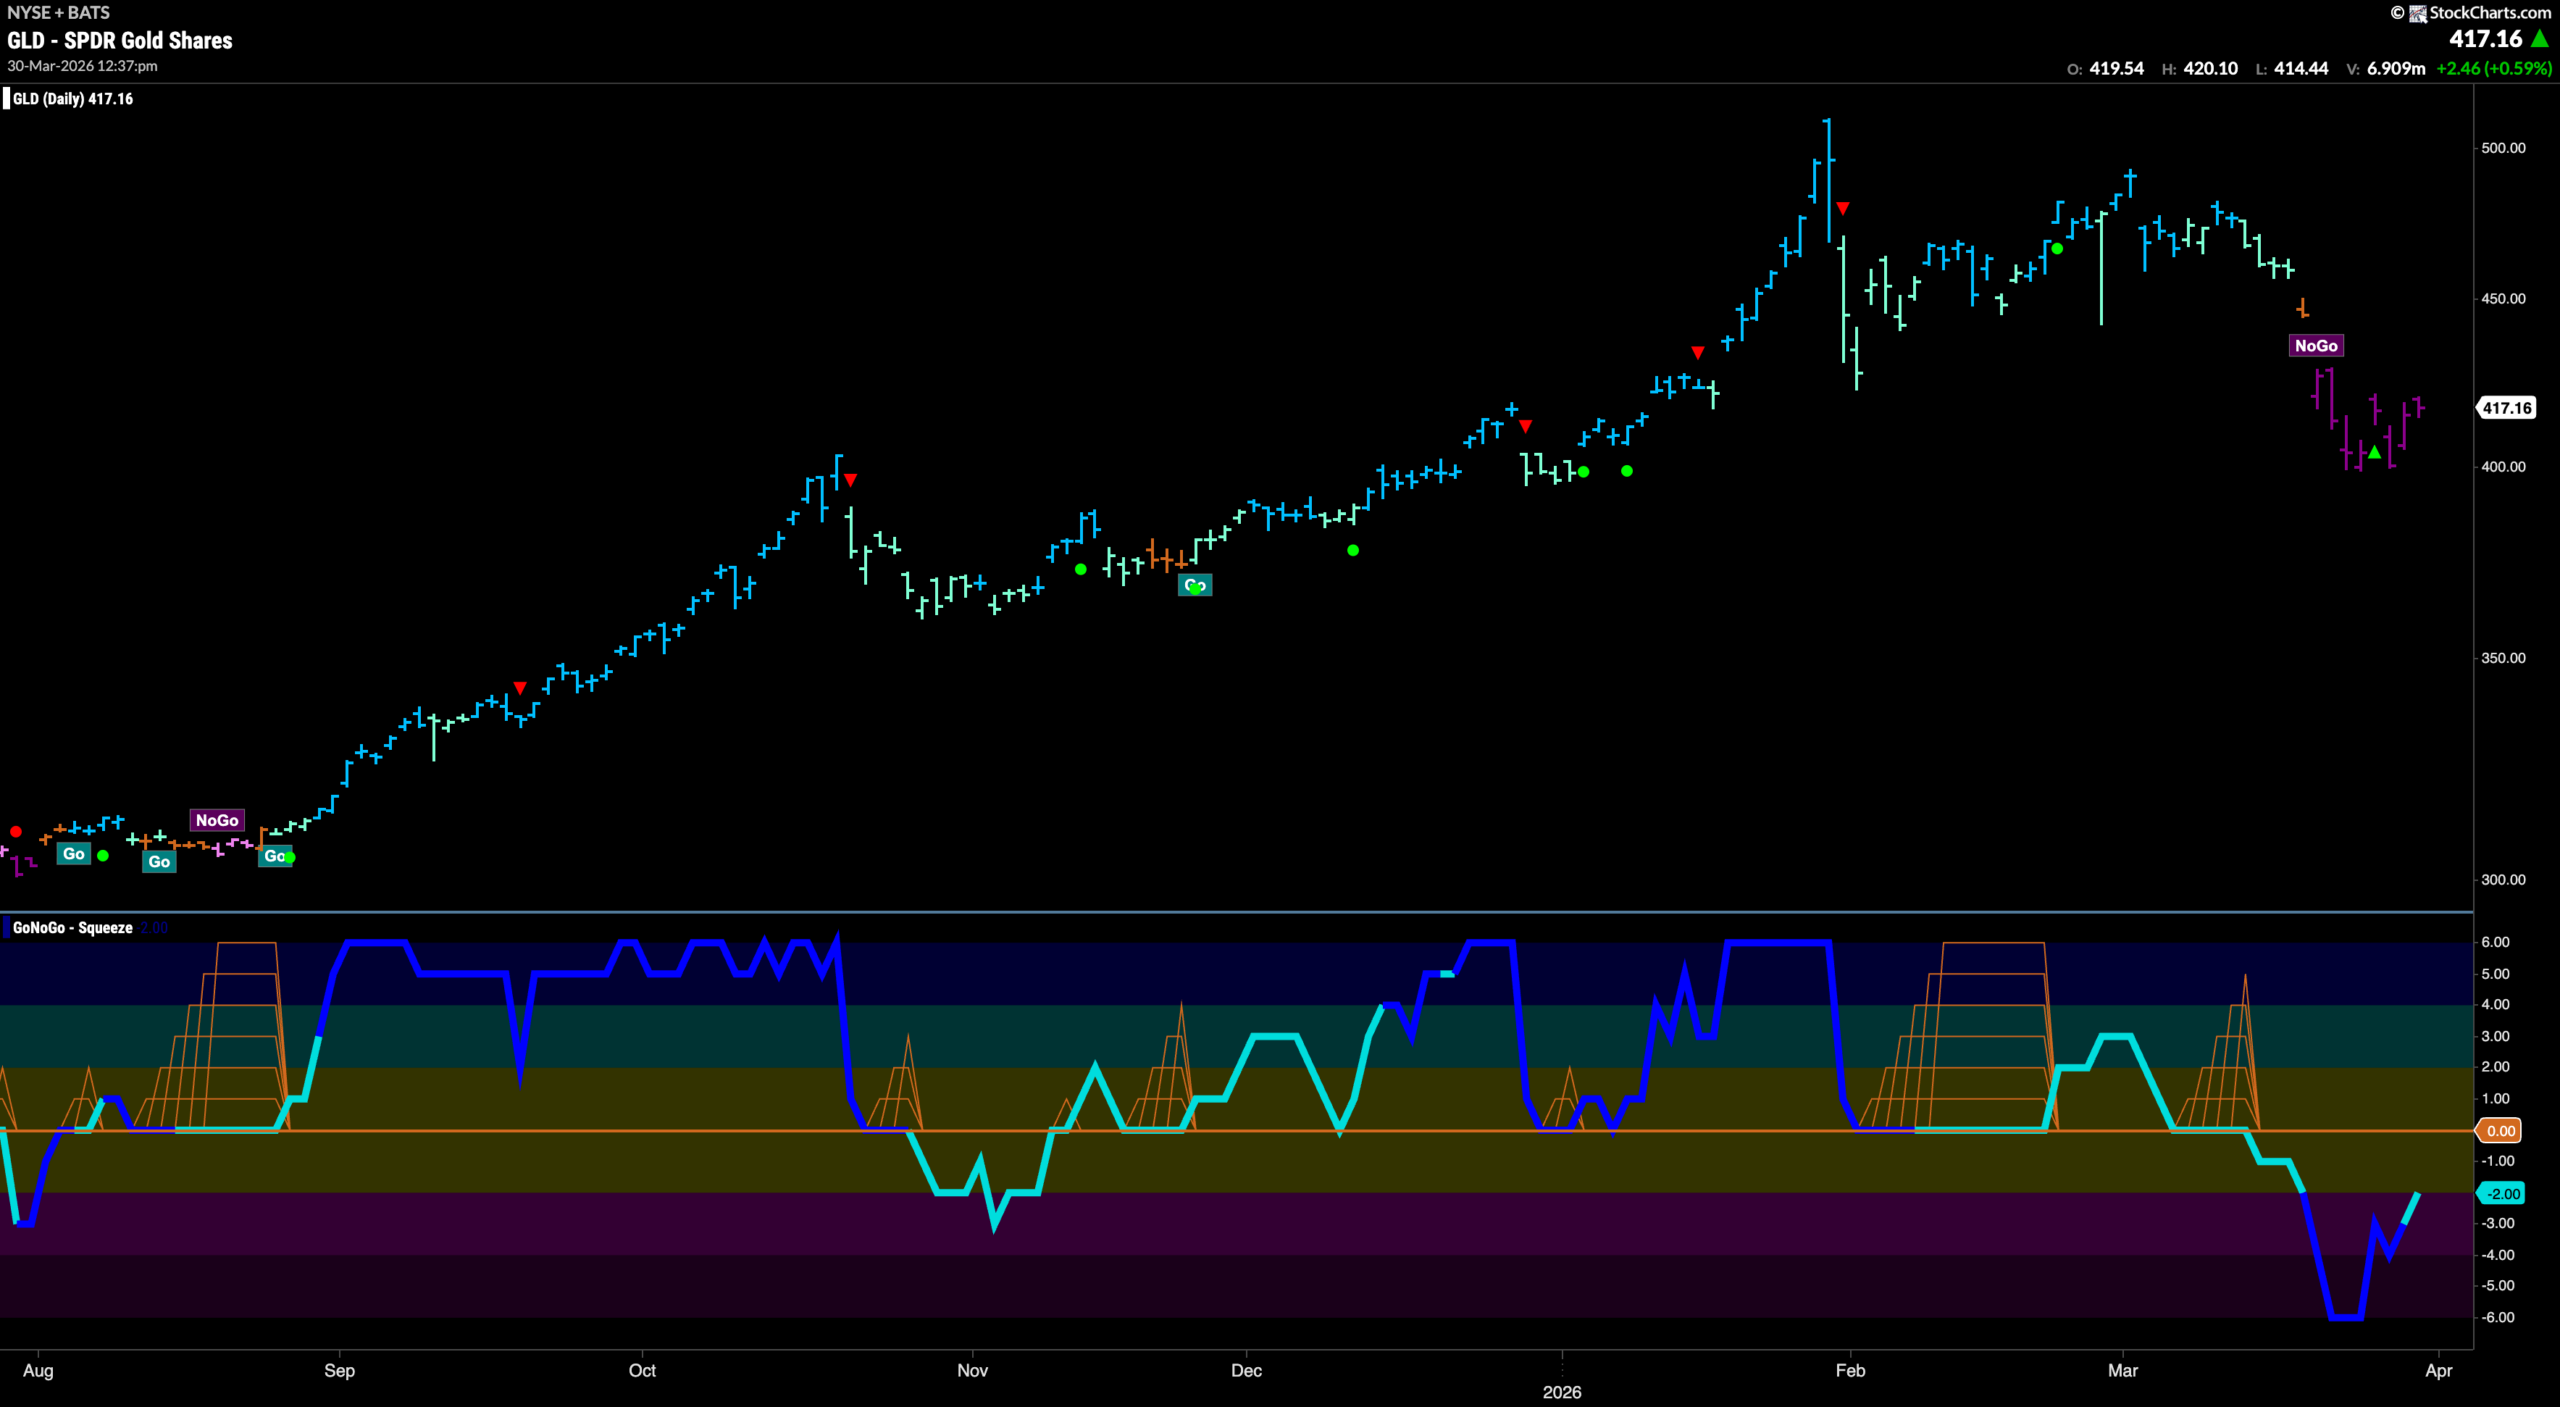
Gold has now been in a “NoGo” trend for over a week painting nothing but strong purple bars. Last week saw a new lower low in price. However, we did see a NoGo Countertrend Correction Icon (green arrow) indicating that price may struggle to go lower in the short term due to waning momentum. GoNoGo Oscillator is now at a value of -2. We will watch to see if it remains at or below the zero line and if it does that would be in line with the “NoGo” trend that we see in price.
Sector RelMap
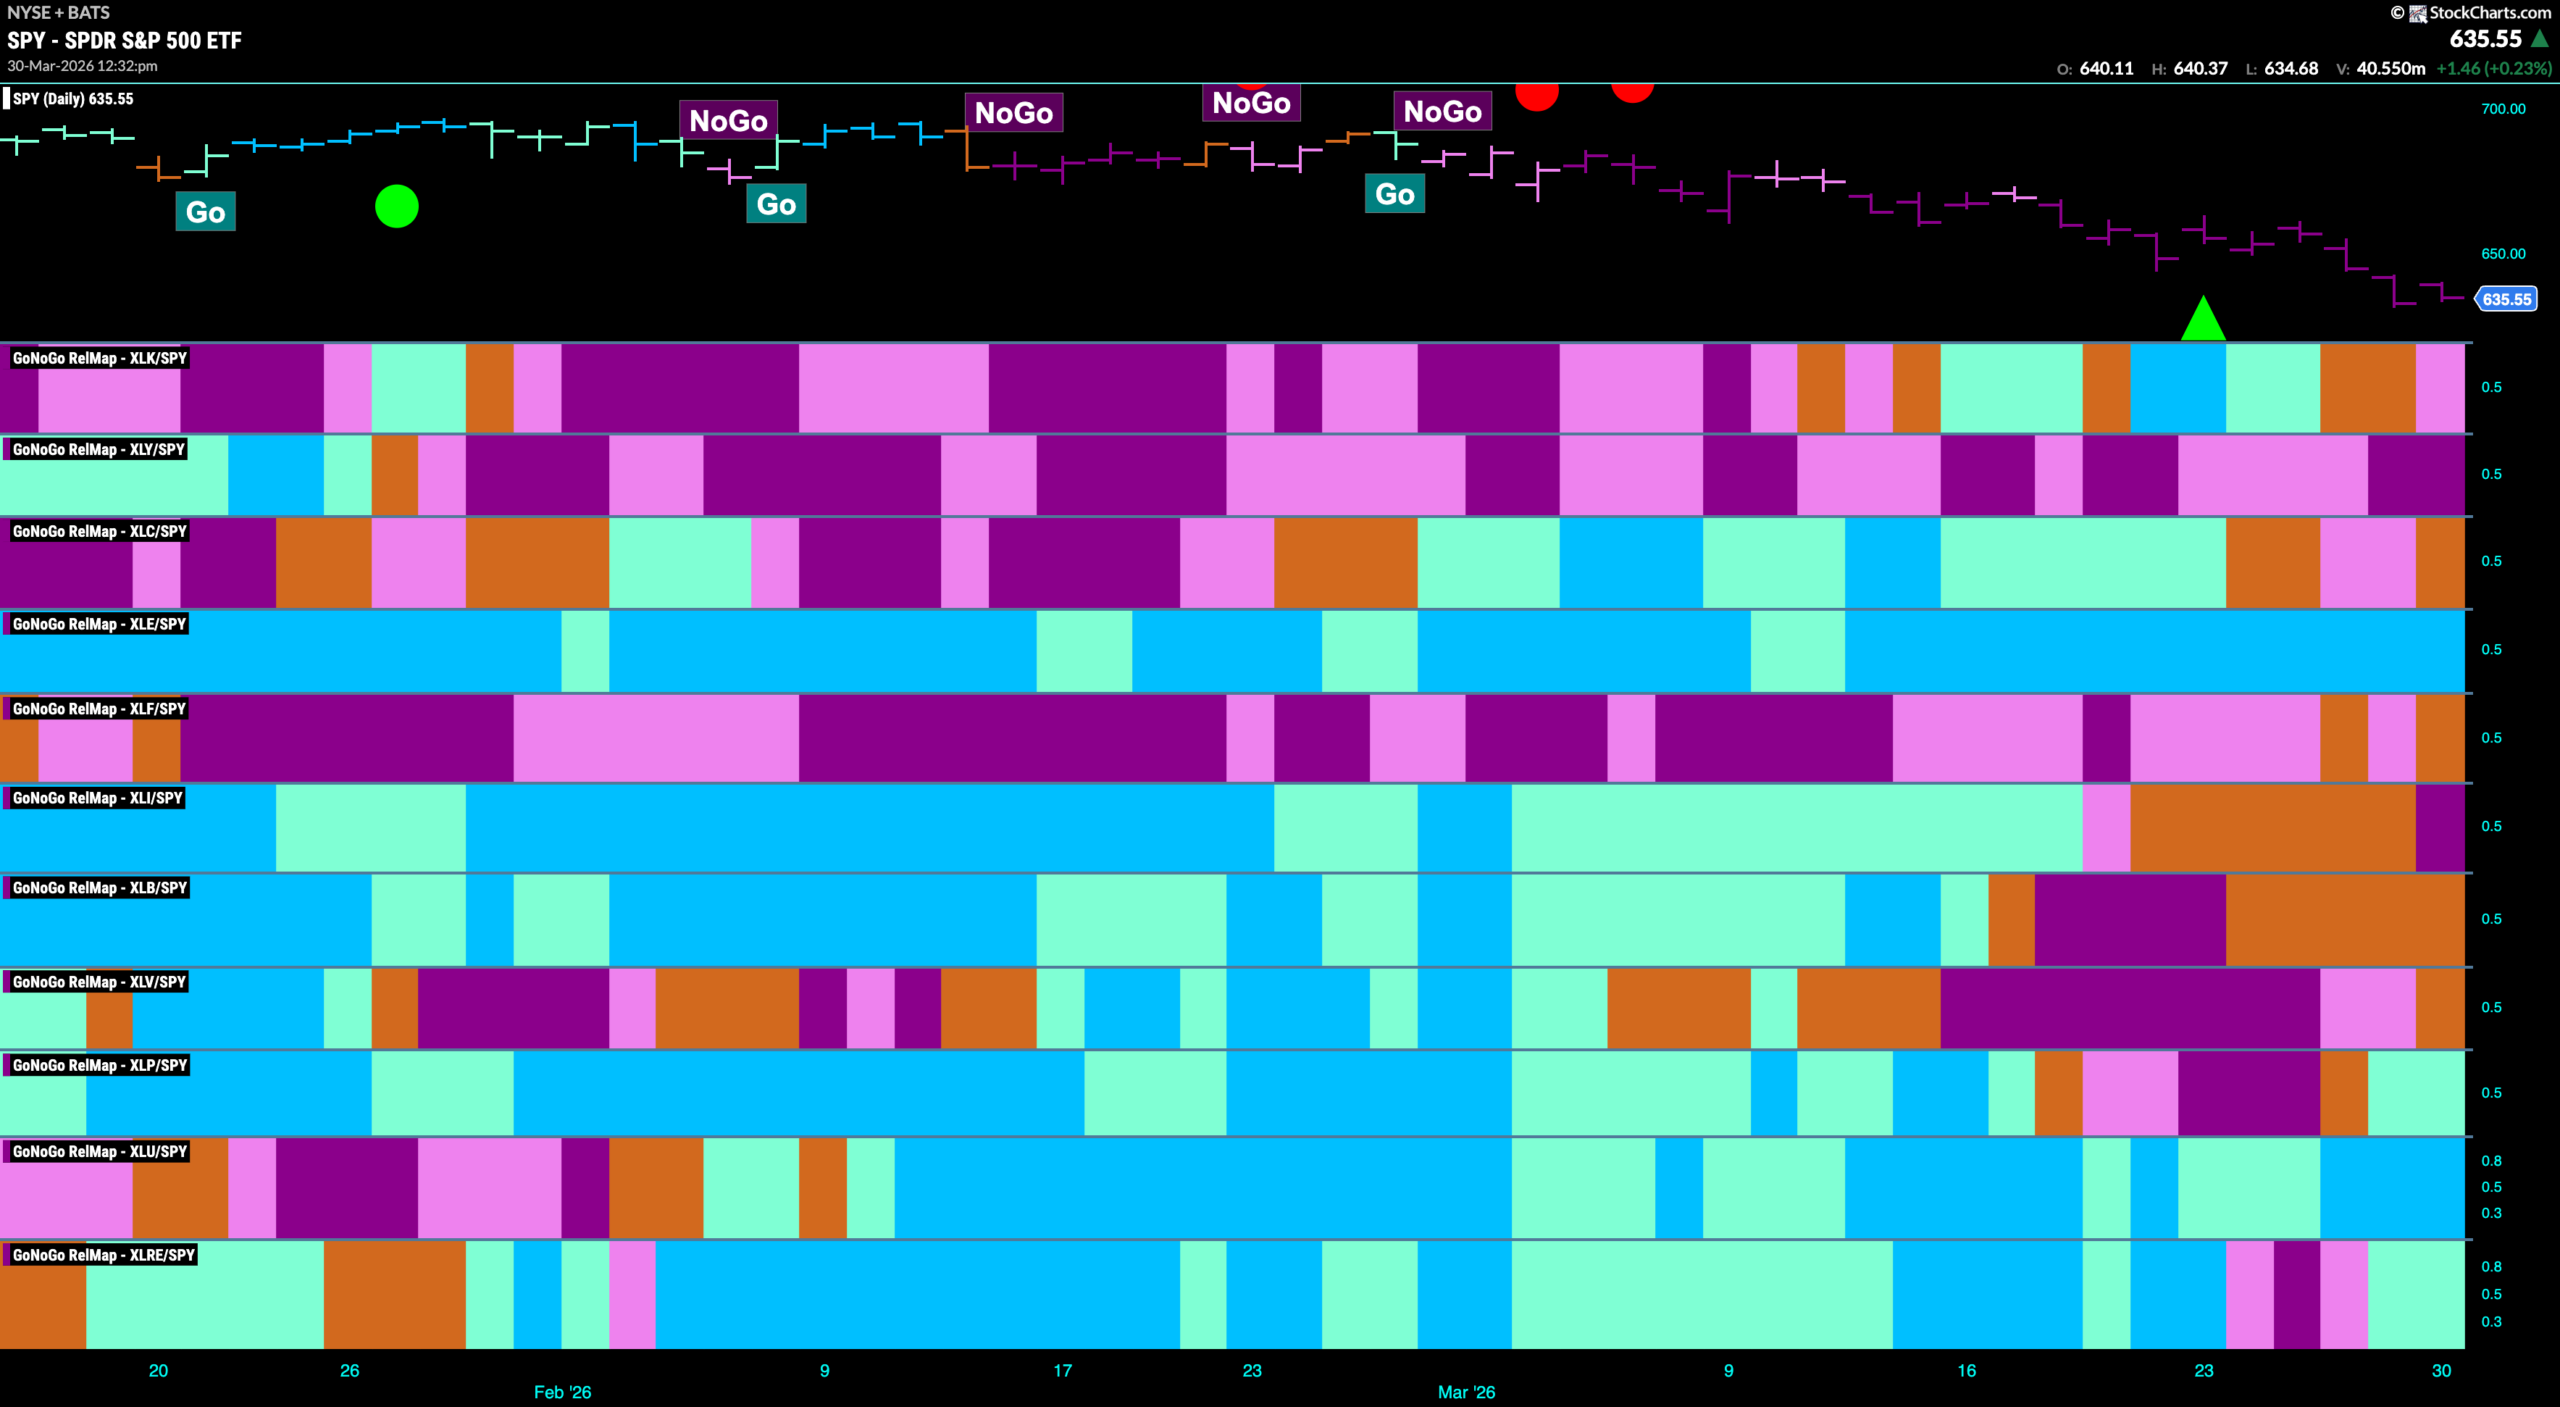
Below is the GoNoGo Sector RelMap. This GoNoGo RelMap applies the GoNoGo Trend to the relative strength ratios of the sectors to the base index. With this view we can get a sense of the relative out performance and relative underperformance of the sectors. 4 sectors are in relative “Go” trends. $XLE, $XLP, $XLU, and $XLRE are painting relative “Go” bars.
Utilities Sub-Group RelMap
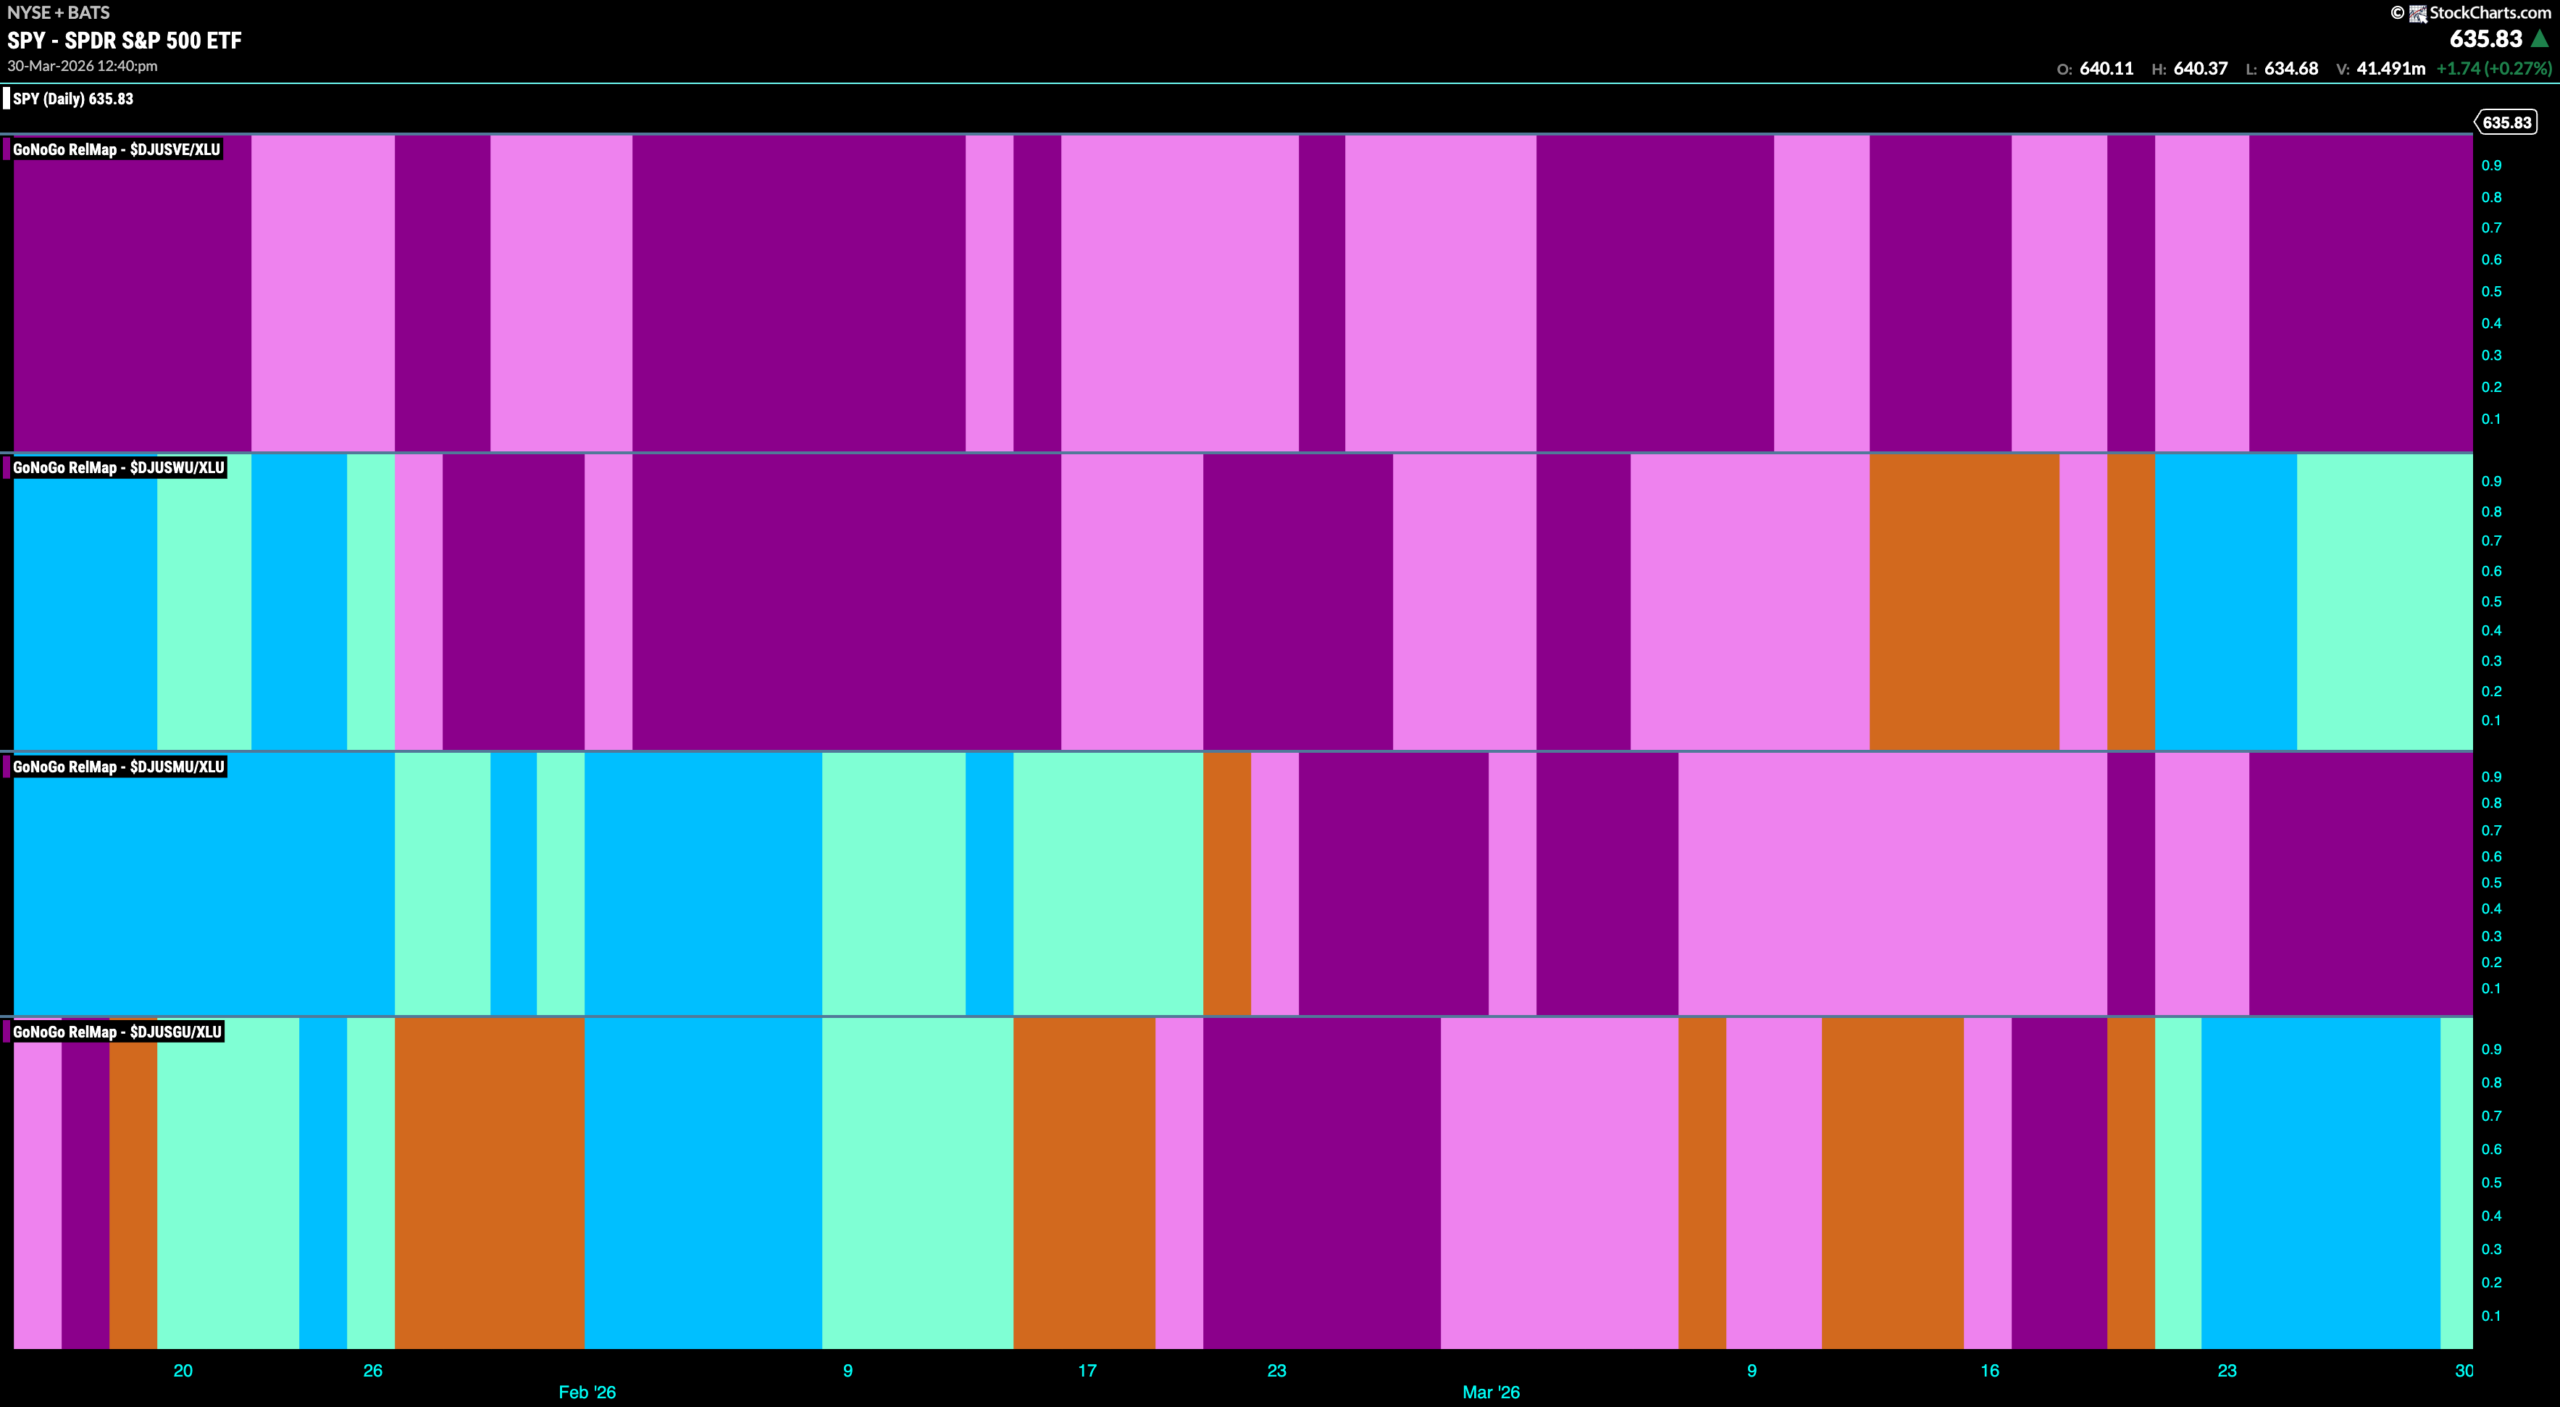
The chart below shows a relative trend breakdown of the sub groups within the utilities sector this week. The Sub-Group RelMap plots the GoNoGo Trend of each sub index to the $XLU. We saw in the above GoNoGo Sector RelMap that $XLU is a consistent out-performer and paints strong relative “Go” bars. When we look at the below RelMap we can see that the gas distribution index in the last panel is painting “Go” bars on a relative basis.
$NWN Looks for New High in “Go” Trend
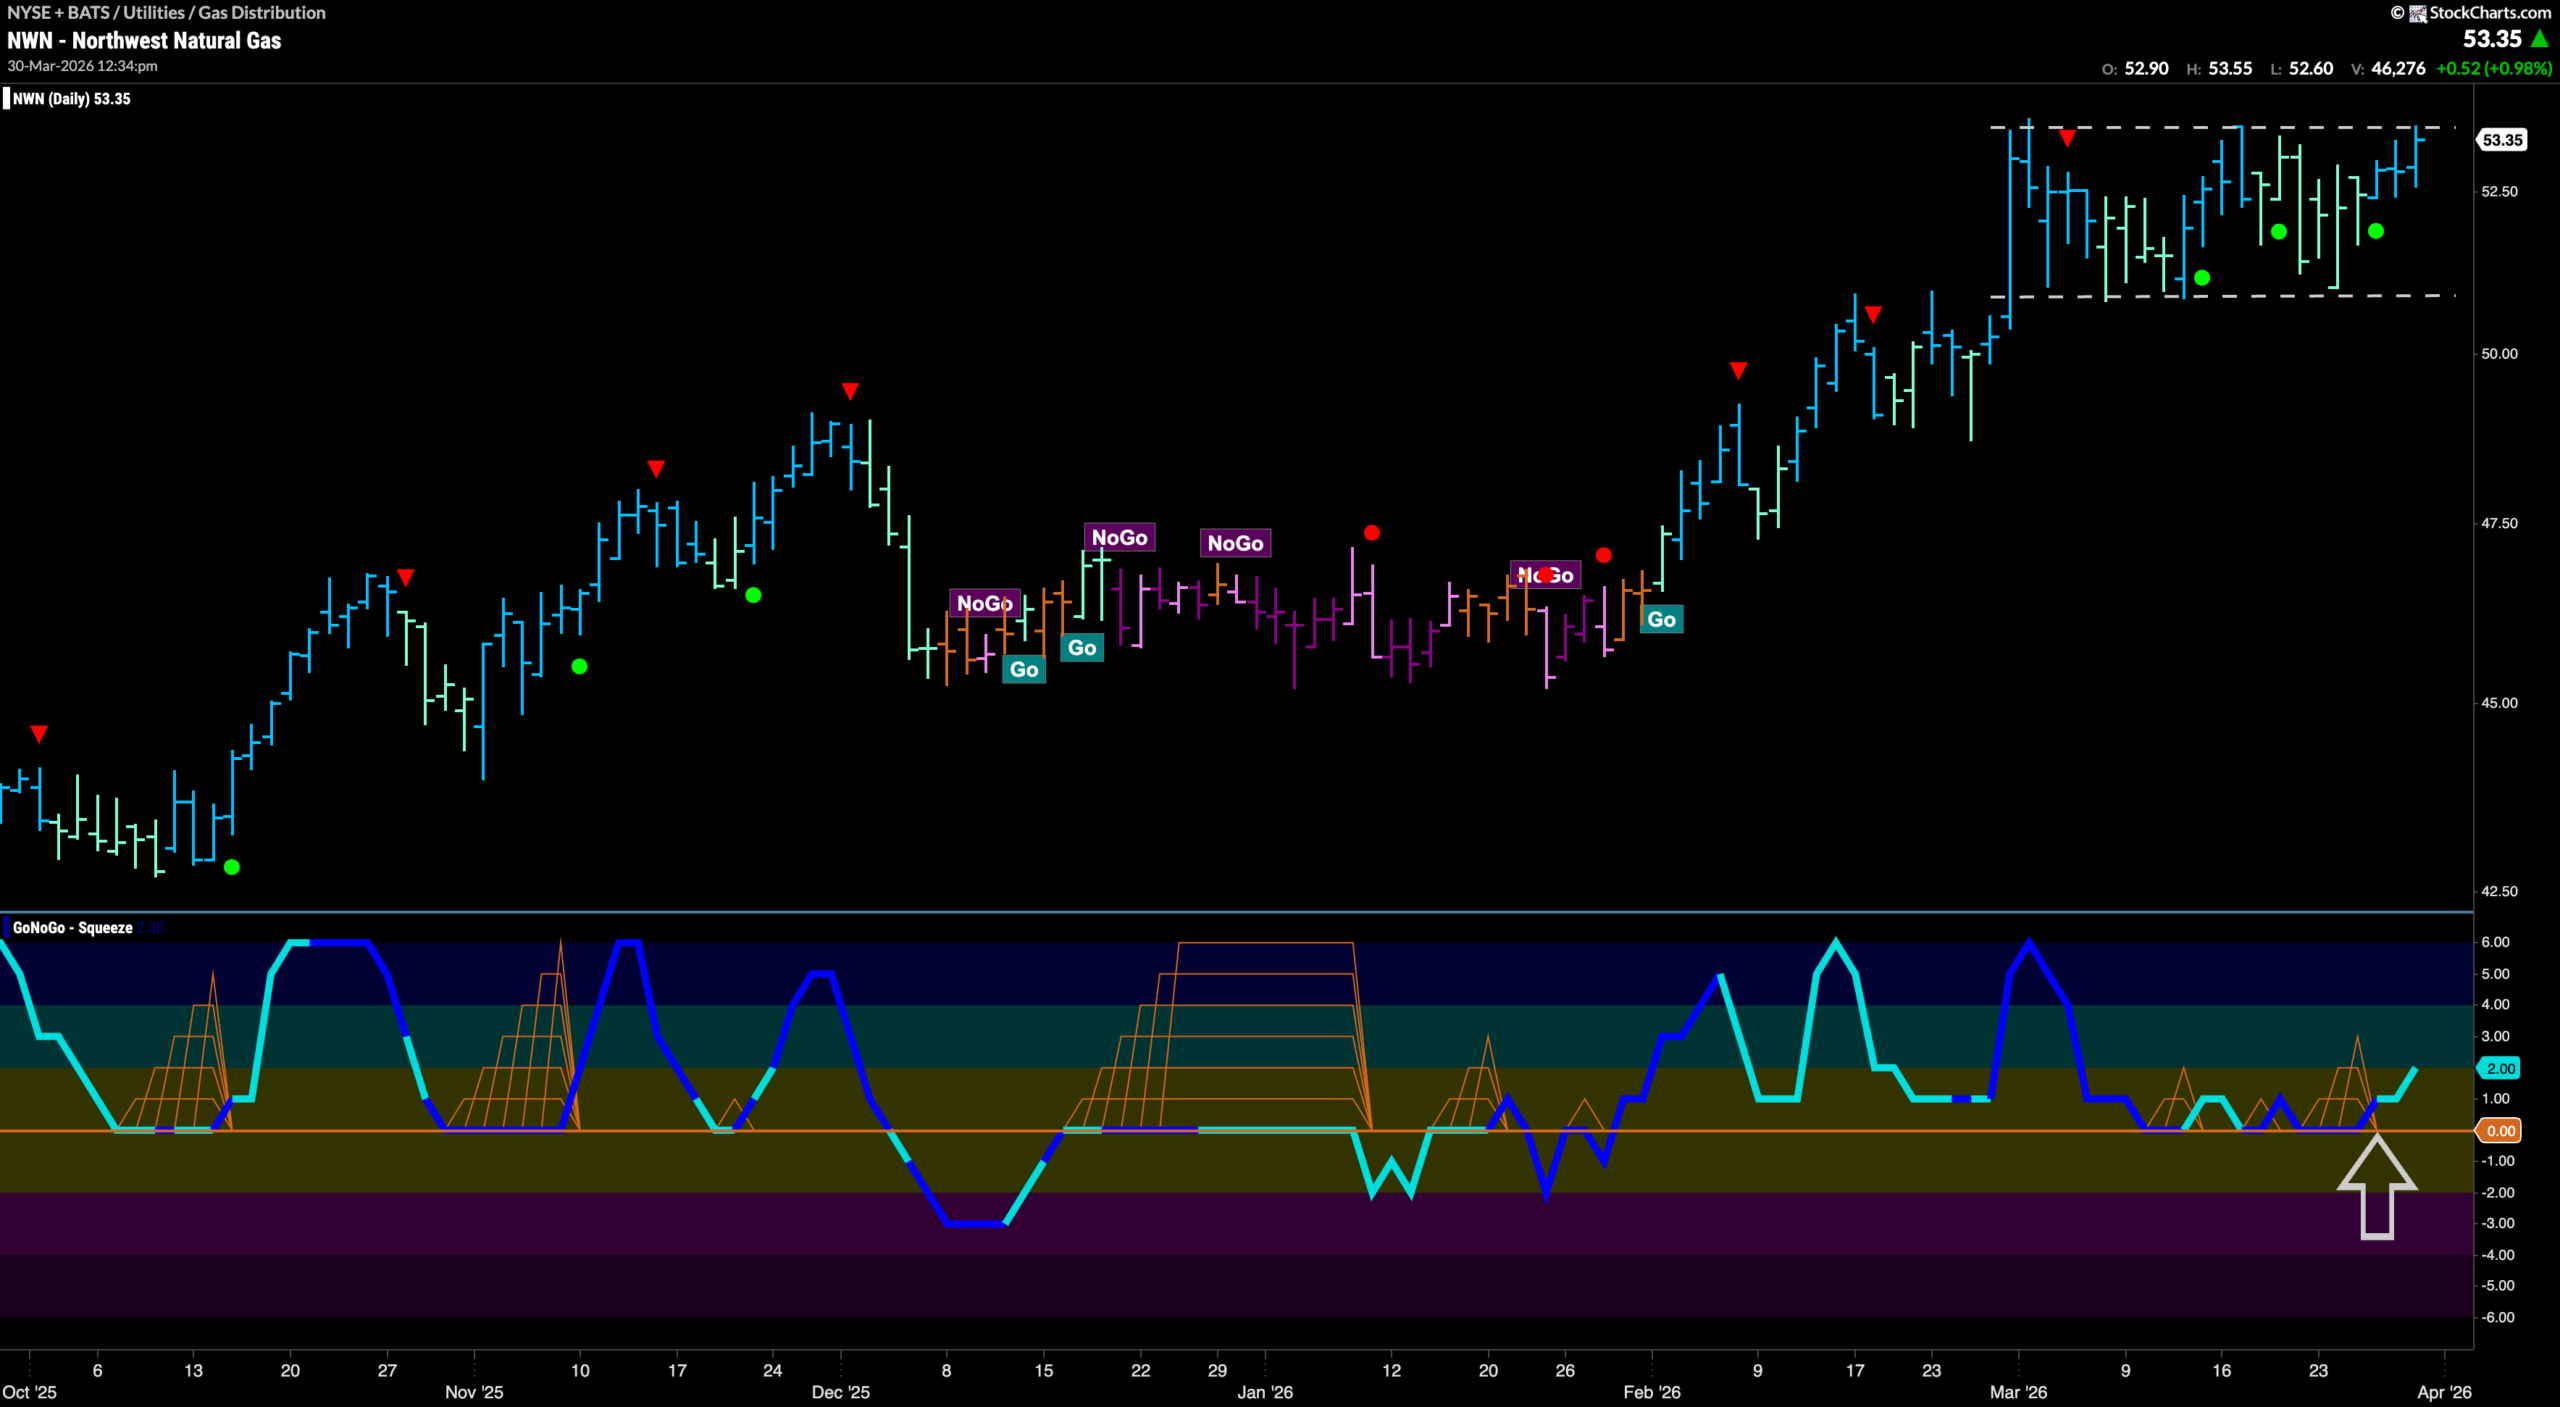
GoNoGo Trend shows that $NWN has been in a “Go” trend since the beginning of February. Since then we saw price rise on a series of higher highs and higher lows. After the last high at the beginning of March, we saw a Go Countertrend Correction Icon (red arrow) indicating that price may struggle to go higher in the short term due to waning momentum. Indeed, we saw GoNoGo Trend paint a majority of weaker aqua bars as price moved mostly sideways. During this sideways movement, we see that GoNoGo Oscillator fell to test the zero line from above and has repeatedly found support at that level. This has led to a clustering of Go Trend Continuation Icons (green circles) telling us that momentum remains in the direction of the “Go” trend. Now, with momentum rising into positive territory we see that GoNoGo Trend has painted fresh bright blue “Go” bars as price challenges overhead resistance.
$NJR Looks for New High in Upward Trend Channel
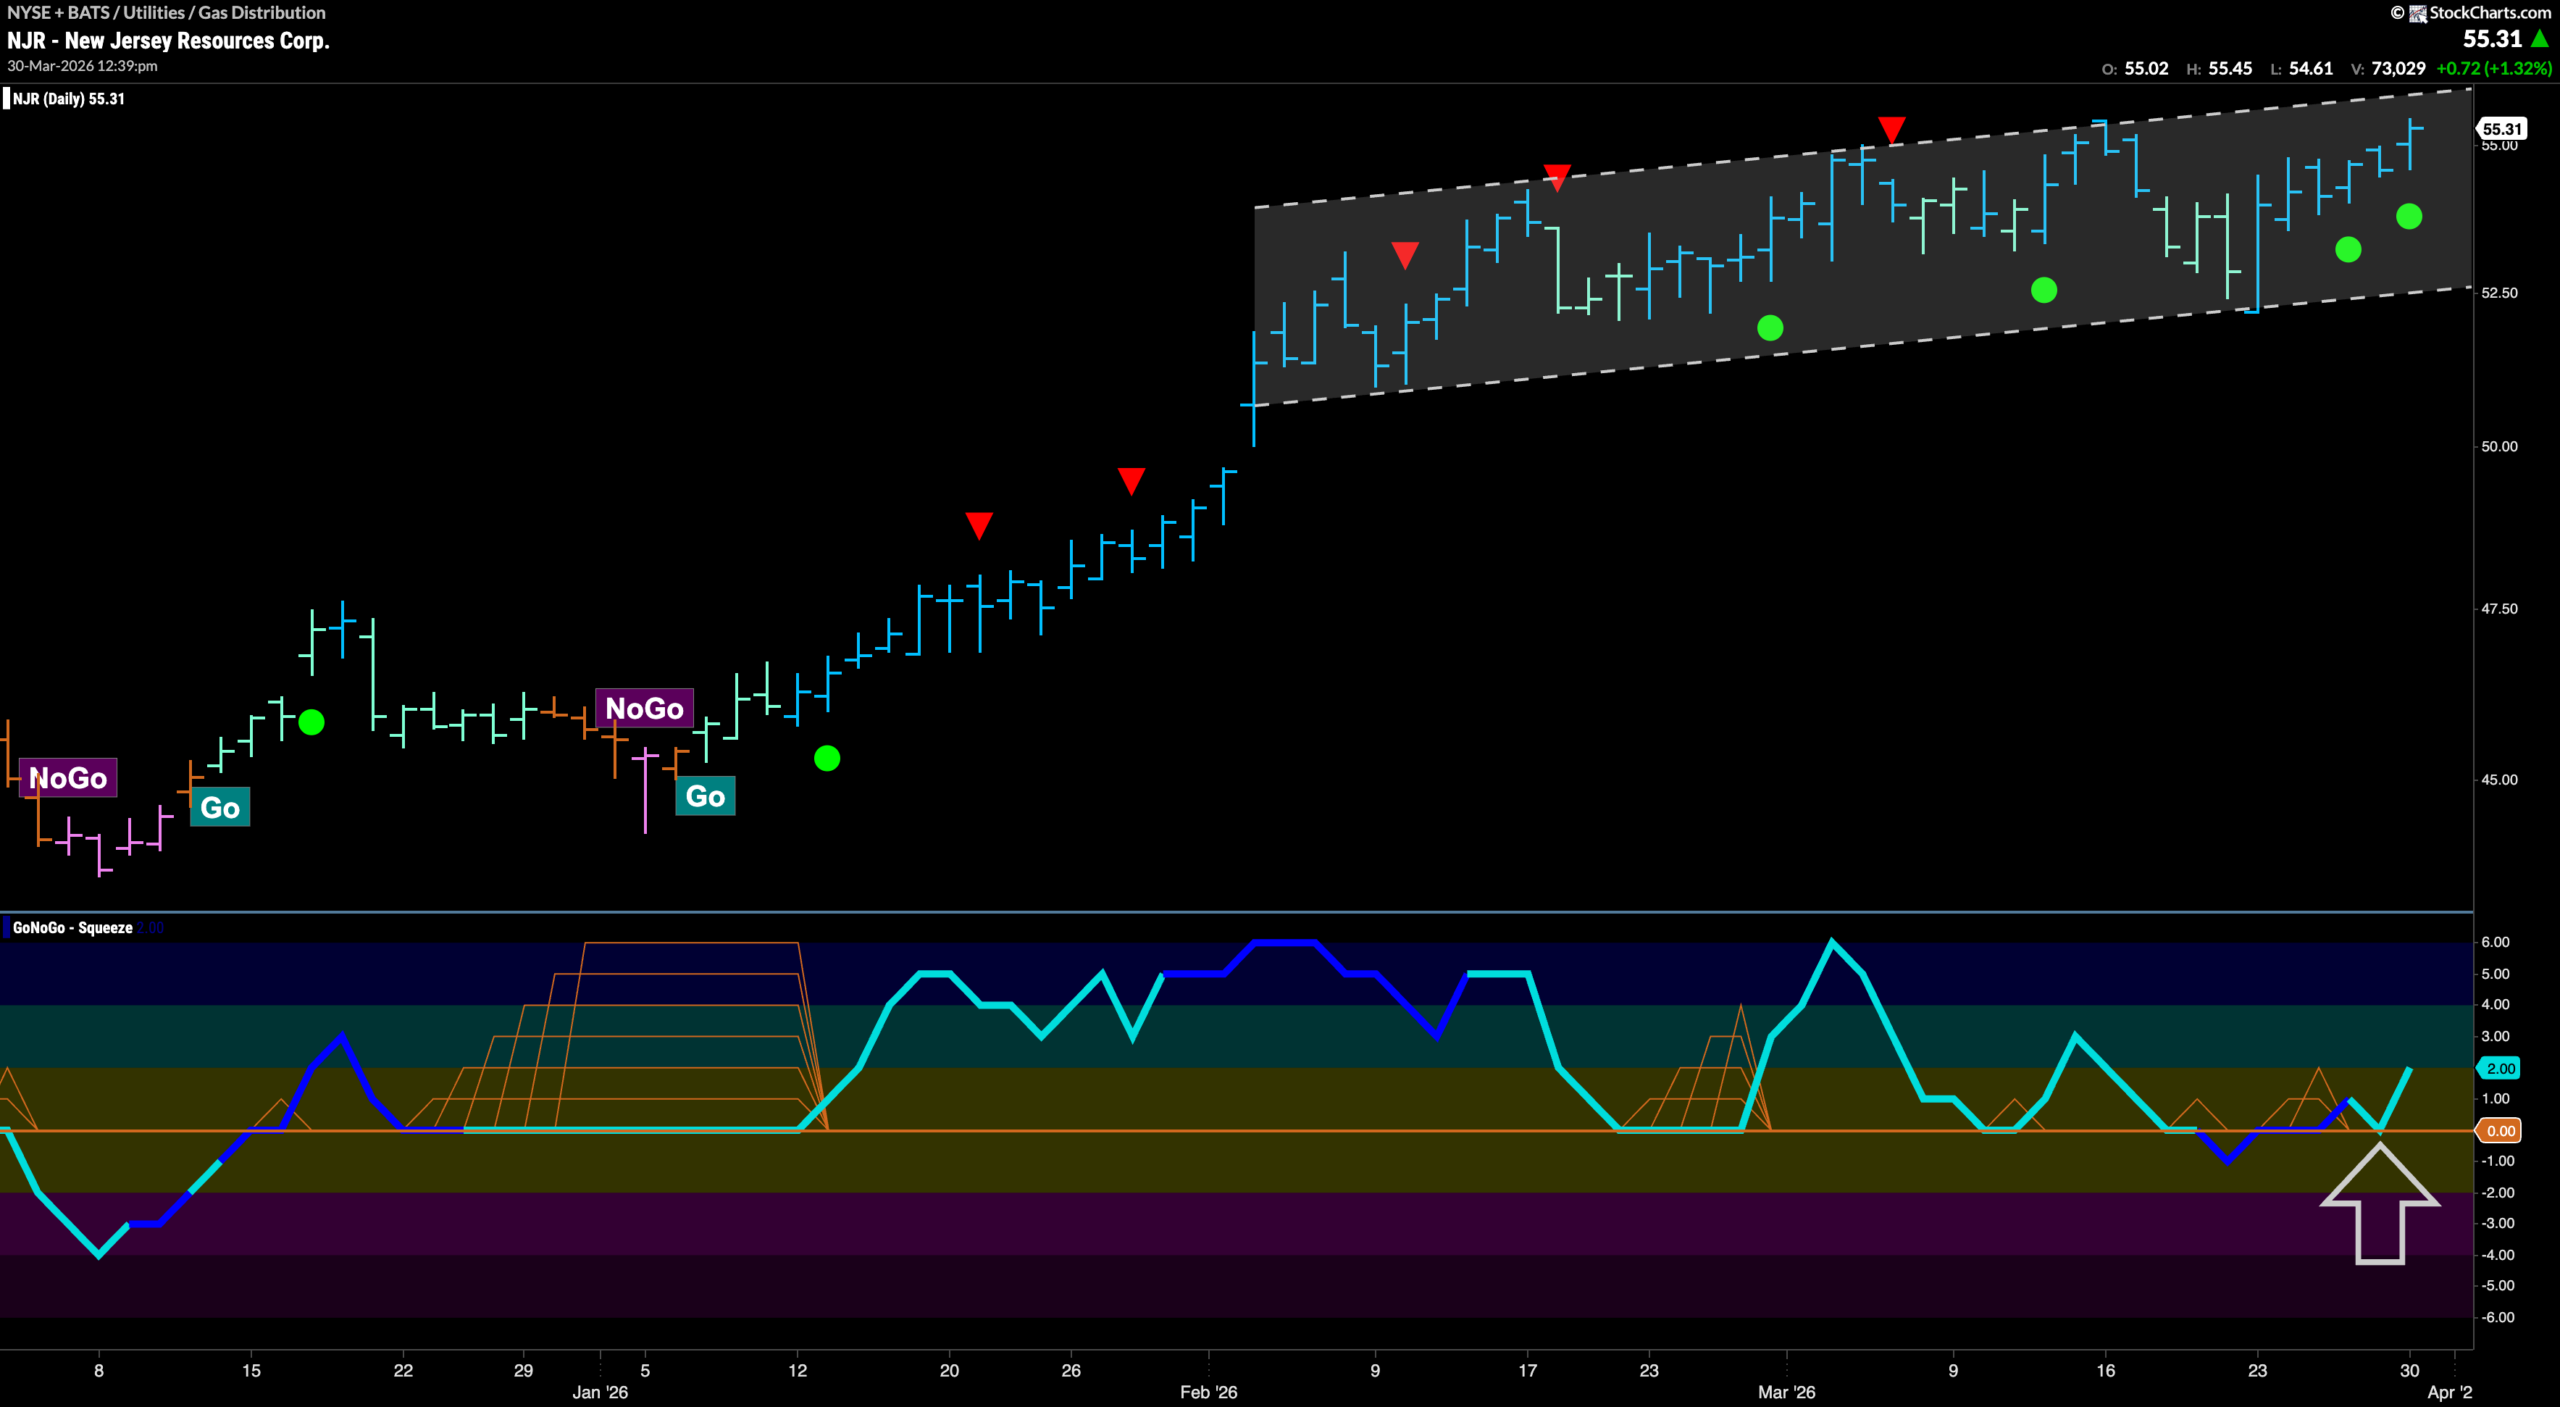
$NJR has been in a “Go” trend since the beginning of the year. GoNoGo Trend shows that we have seen a series of higher highs and higher lows on a majority of bright blue “Go” bars. During this time, GoNoGo Oscillator has found support each time it has tested the zero line signaling that momentum remains on the side of the “Go” trend. Recently, we see a couple of Go Trend Continuation Icons as GoNoGo Oscillator again rallies into positive territory. With price approaching the top of the channel, we will watch to see if this resurgent momentum will give price the push it needs to climb to a new higher high and even up and out of the channel.