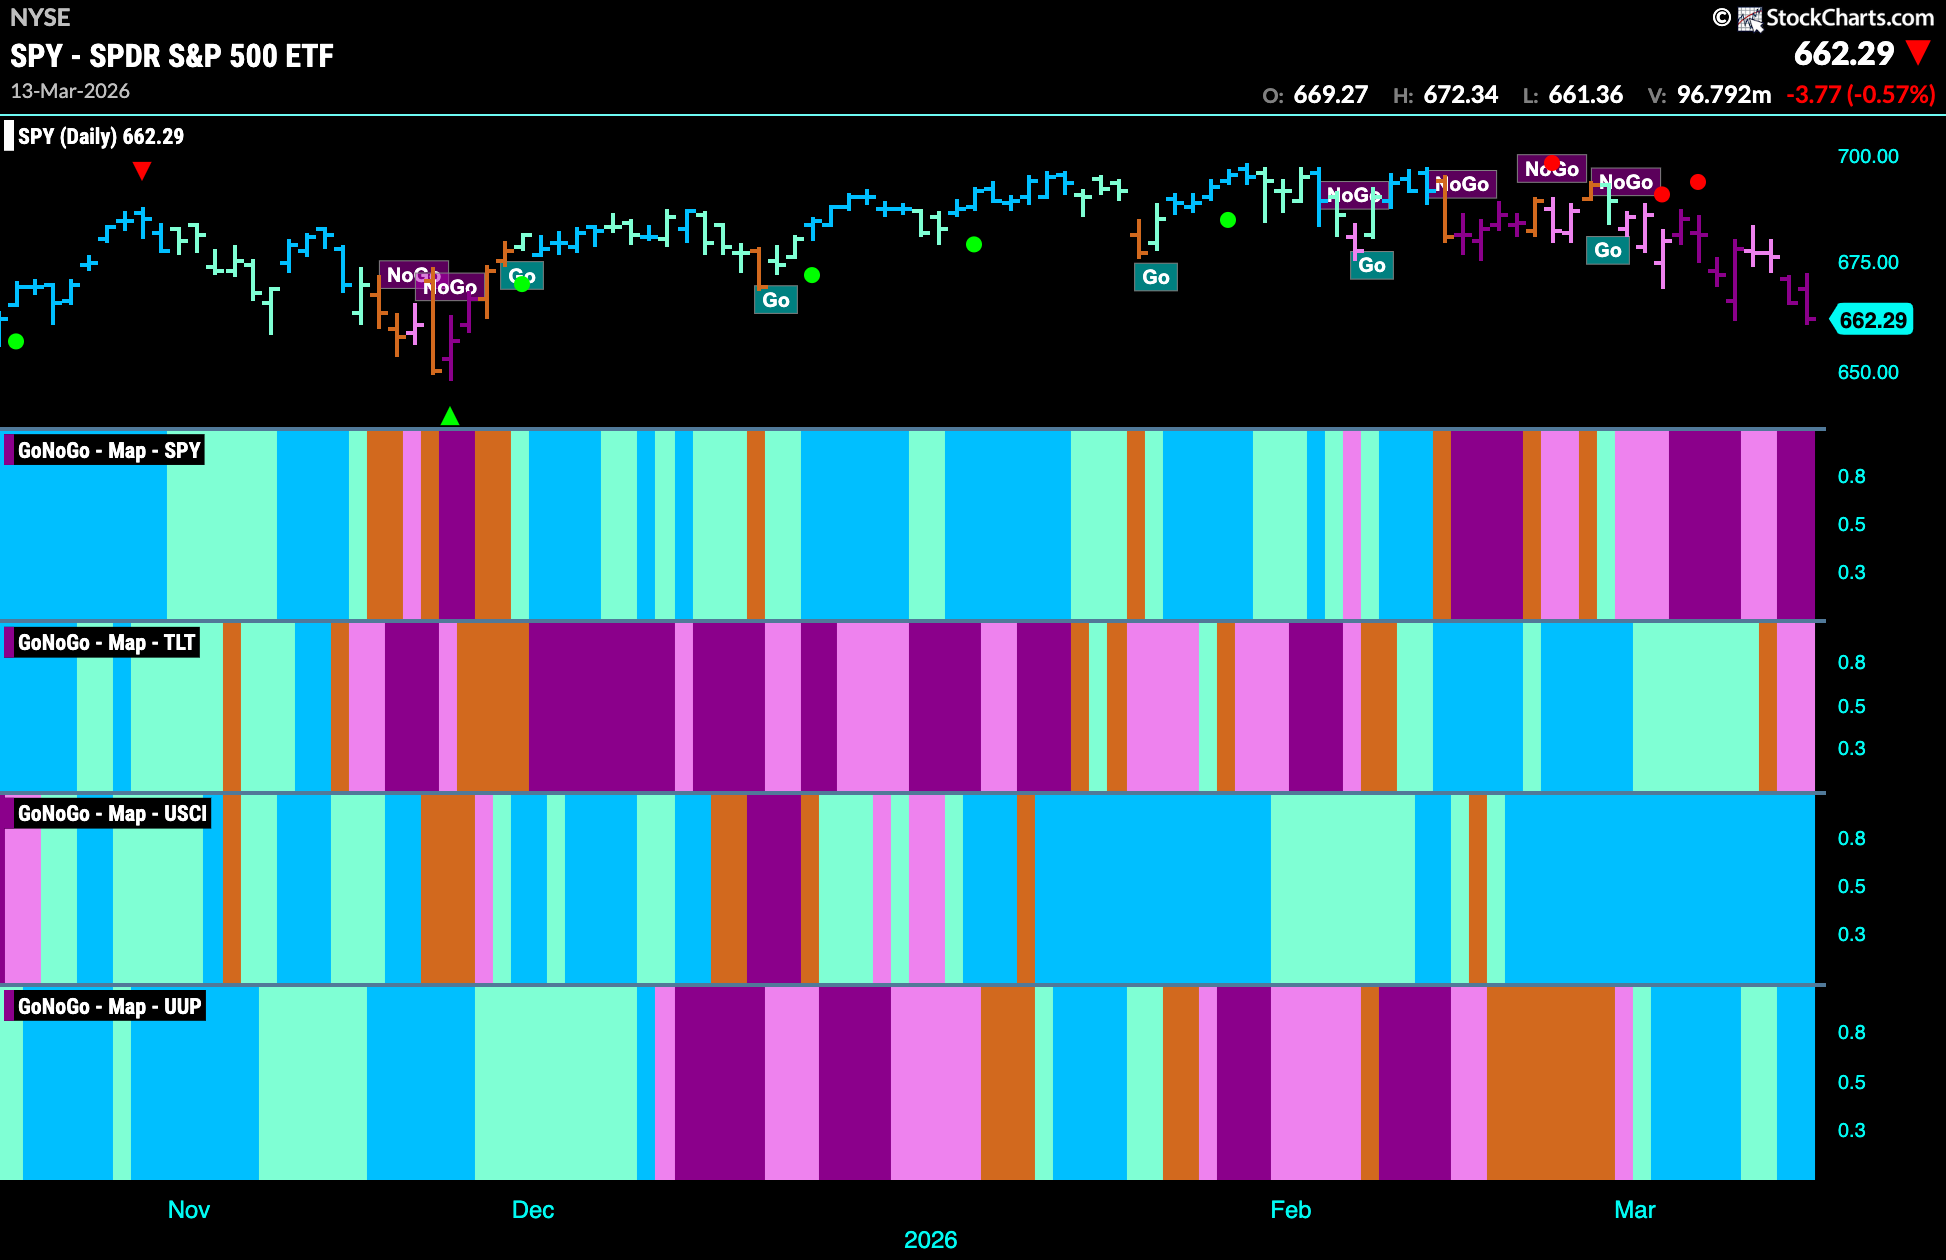
Good morning and welcome to this week’s Flight Path. Equities see the “NoGo” continue this week with strong purple bars as price threatens new lows. Treasury bond prices fall out of the “Go” trend and paint weaker pink “NoGo” bars. U.S. commodities, fueled by soaring oil prices, paint another week of uninterrupted strong blue “Go” bars. The dollar remains in a “Go” trend and we see the indicator painting more strong blue “Go” bars as the week comes to an end.
$SPY Hits Lows in “NoGo”
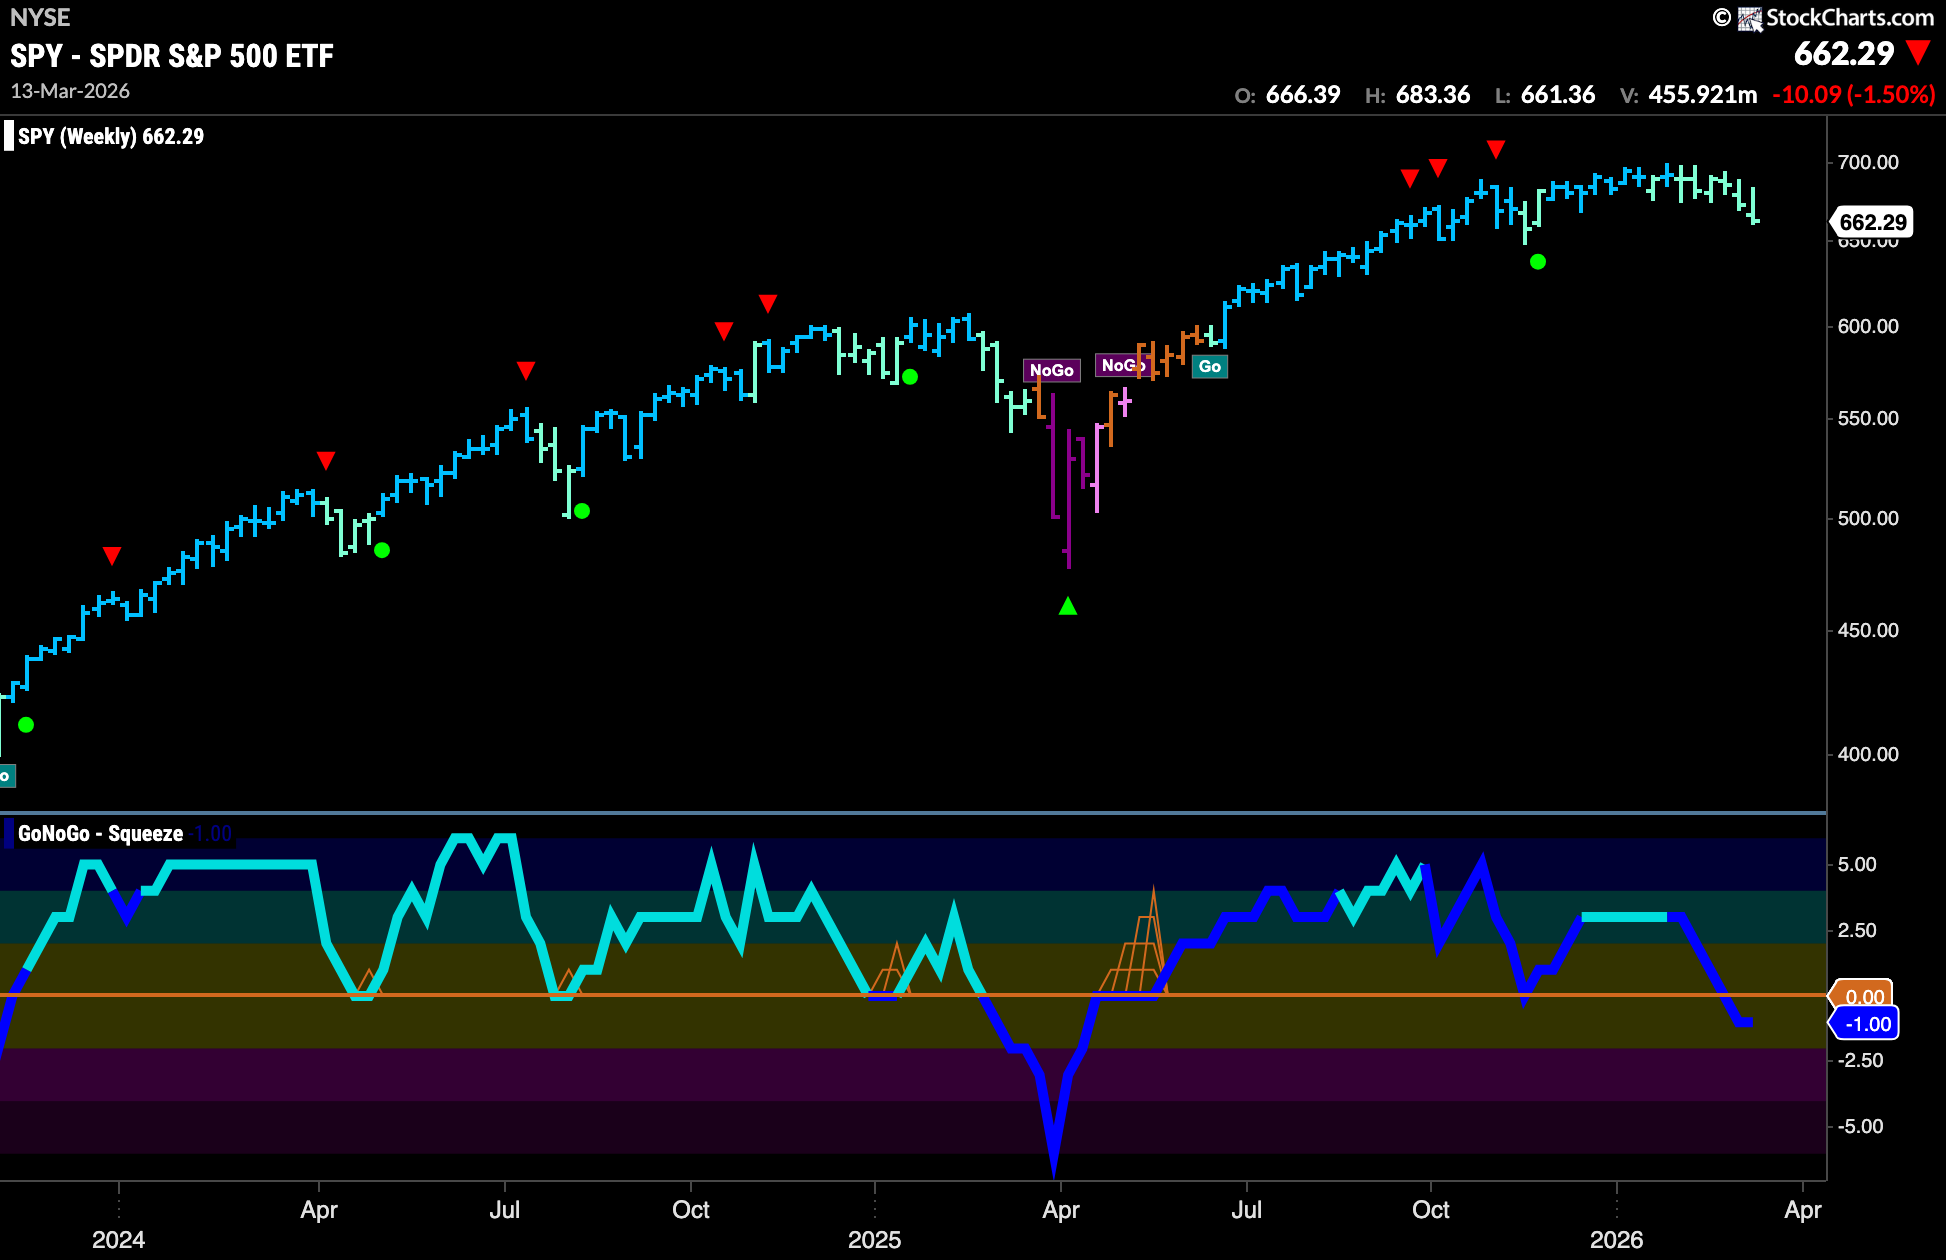
The GoNoGo chart below shows that the trend remains in place as GoNoGo Trend paints strong purple “NoGo” bars and price moves to new intermediate lows. GoNoGo Oscillator is sinking fast into negative territory having been able to distance itself from the zero line and we see that volume remains elevated this week as the market participates in the “NoGo” move.
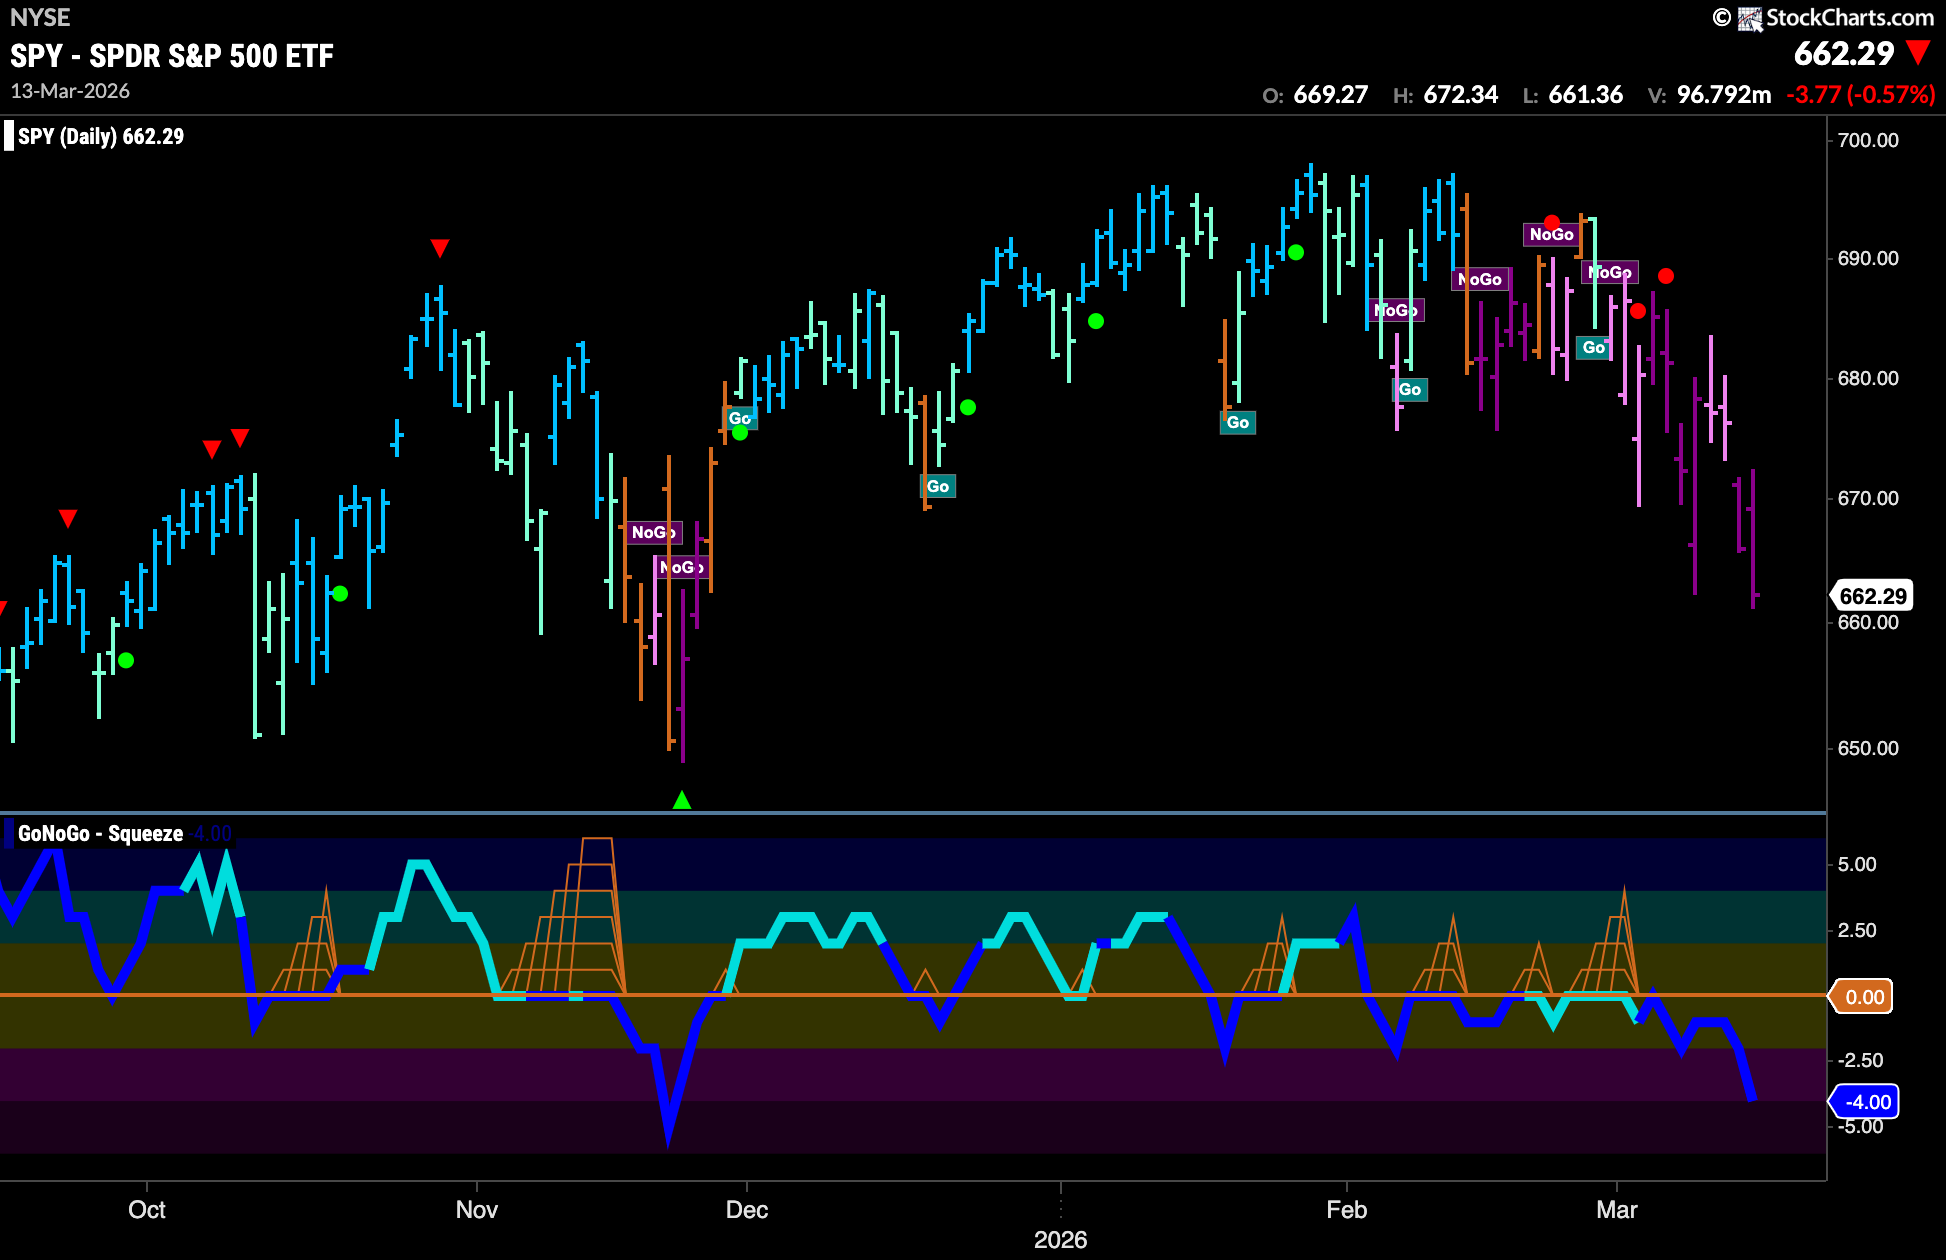
The weekly chart shows that on the large time frame we are hanging on to the “Go” trend with the indicator painting a 6th consecutive weak aqua bar. Last week we noted that GoNoGo Oscillator had fallen to test the zero line from above and this week we see that it has slipped through that level without finding support, and that volume is heavy. This could be an indication of a larger correction to come.
Treasury Rates Paint “Go Fish” bars
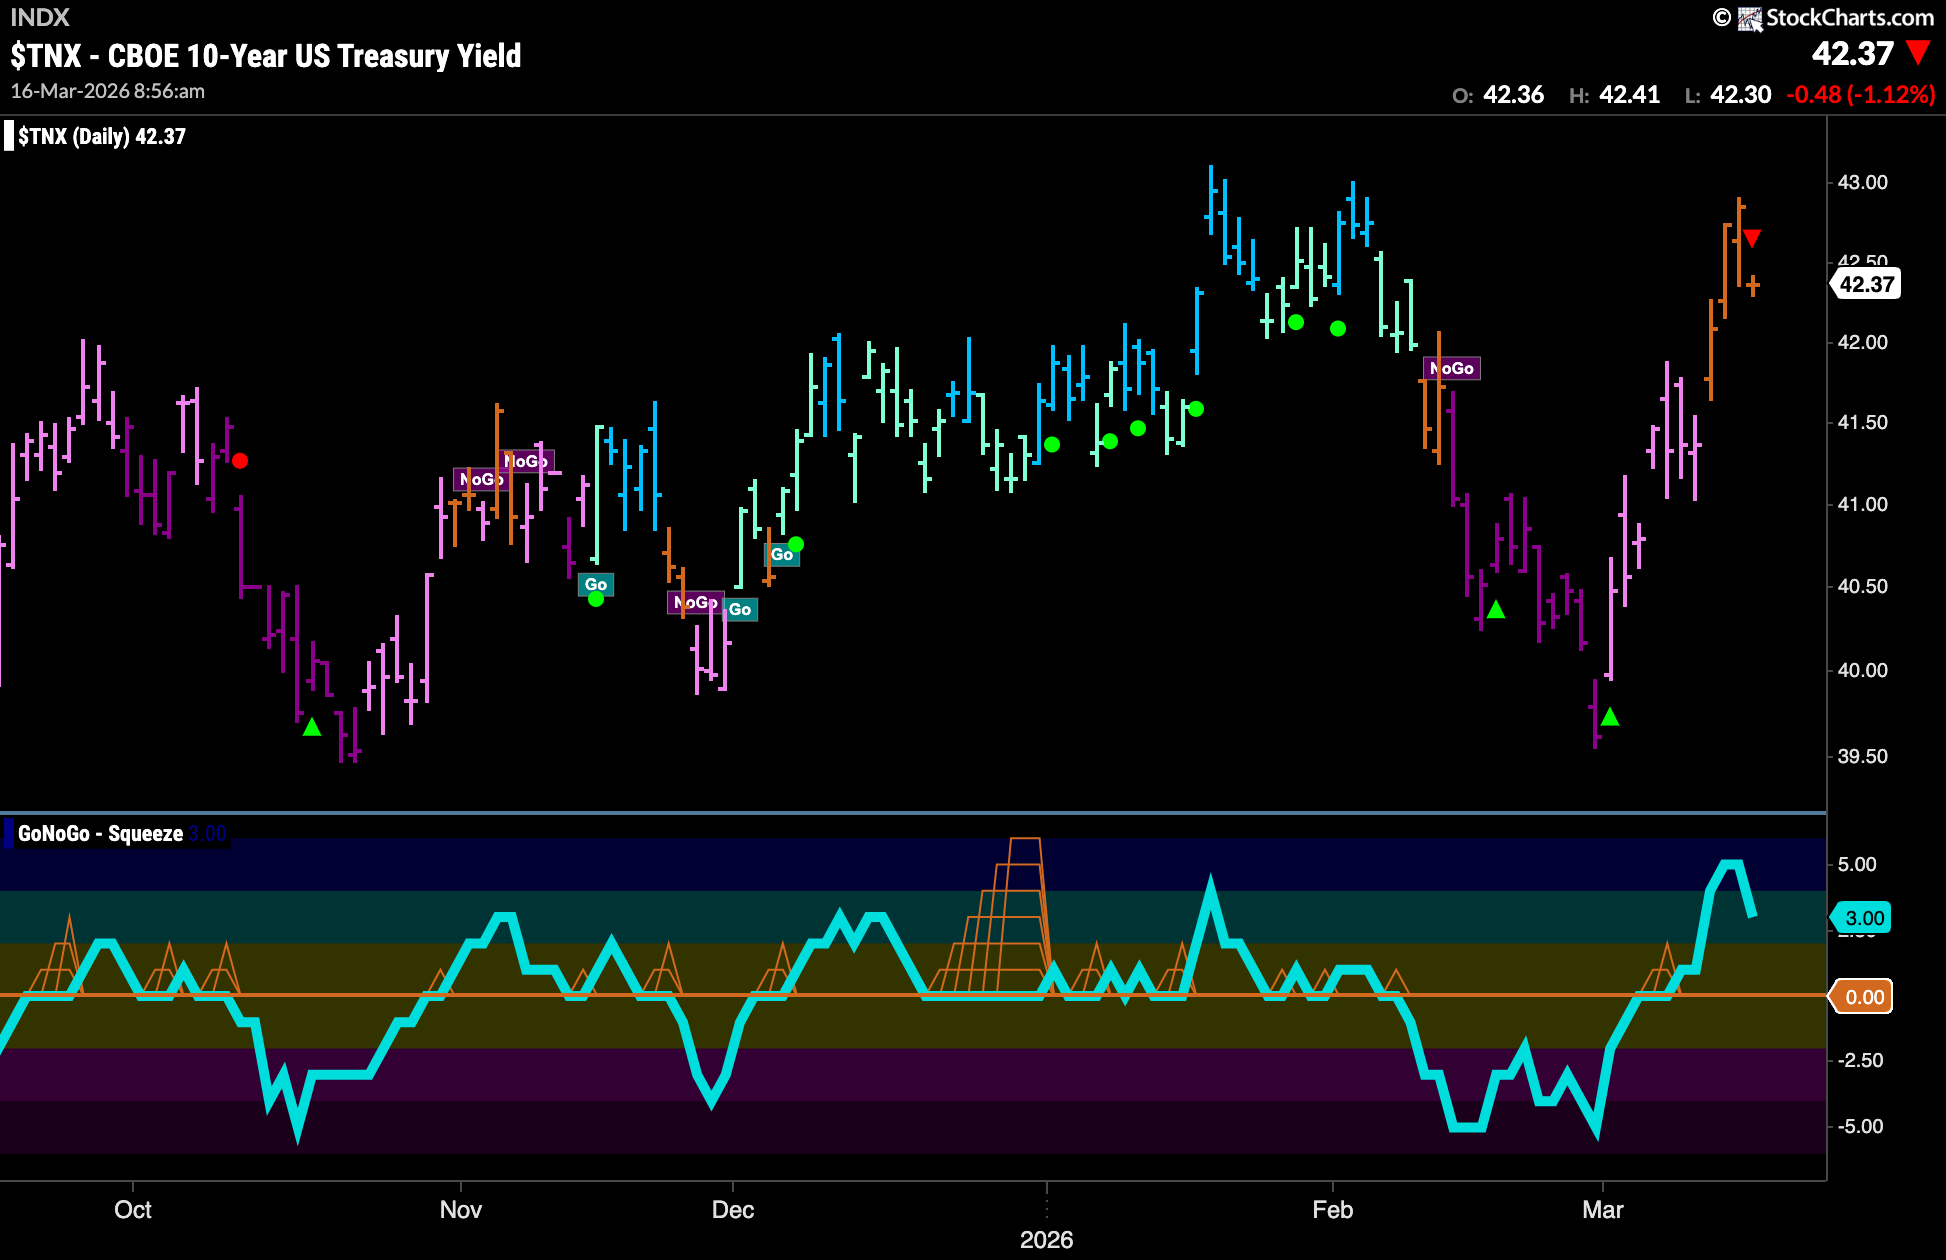
GoNoGo Trend shows the trend remains uncertain as not enough criteria are being met behind the scenes to paint either a “Go” or a “NoGo” trend. Having failed to set a new higher high, we see that rates have fallen and momentum is waning as it falls out of overbought territory back to a value of 3. We will watch to see if GoNoGo Oscillator remains at or above the zero line or if it falls back into negative territory. This would gives us a hint at the next direction.
Dollar Breaks to New High in “Go” Trend
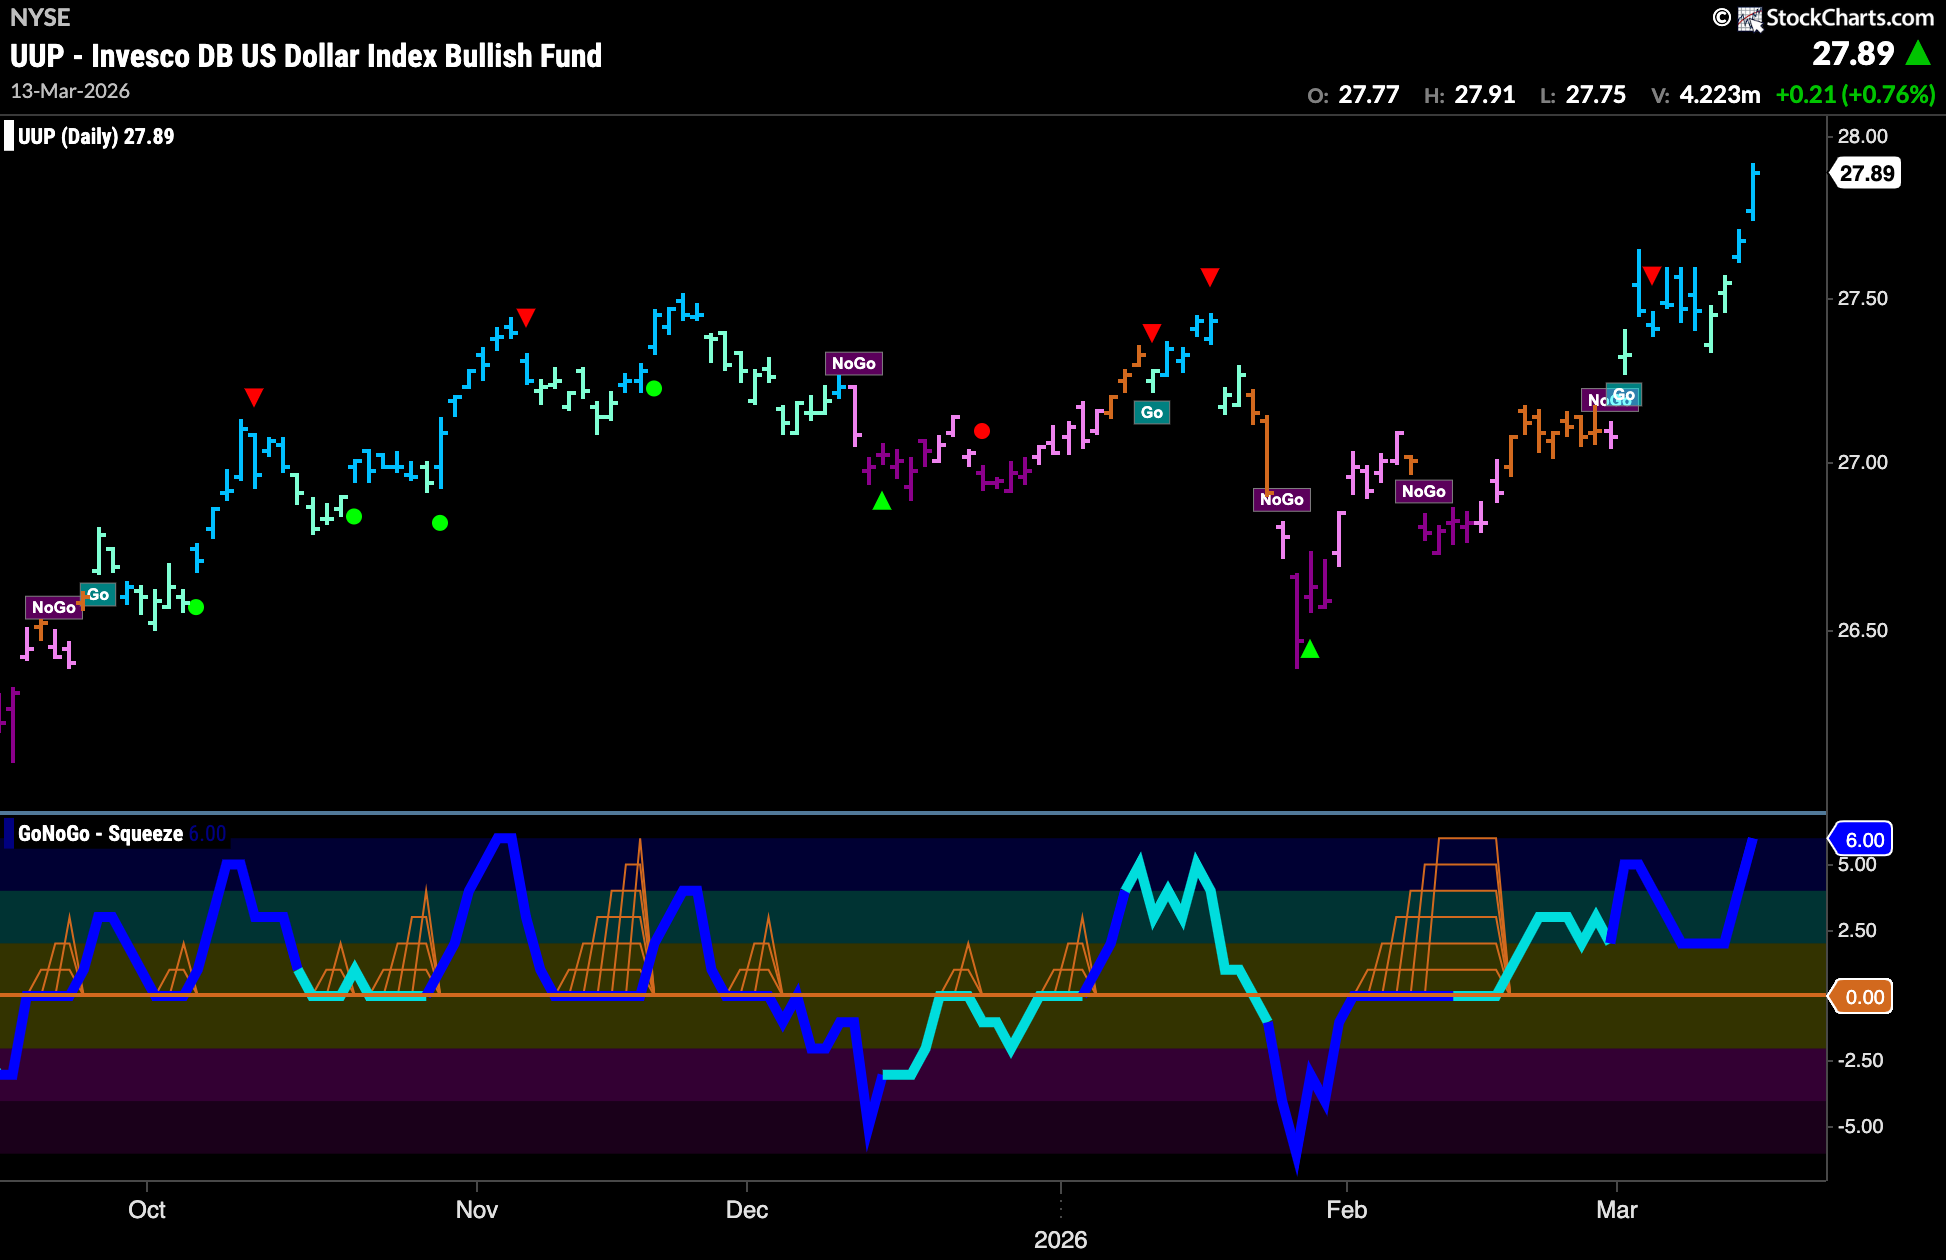
The chart below shows that the dollar remained in its new “Go” trend and indeed saw strength as GoNoGo Trend painted bright blue bars and price raced to new higher highs this past week. This climb is a strong move above historical resistance and comes as GoNoGo Oscillator reversed course on heavy volume back into overbought territory. That demonstrates strong enthusiasm in the price move. We will watch to see if the greenback can consolidate at these new higher highs in the coming days.
Oil Consolidates Before Testing Highs
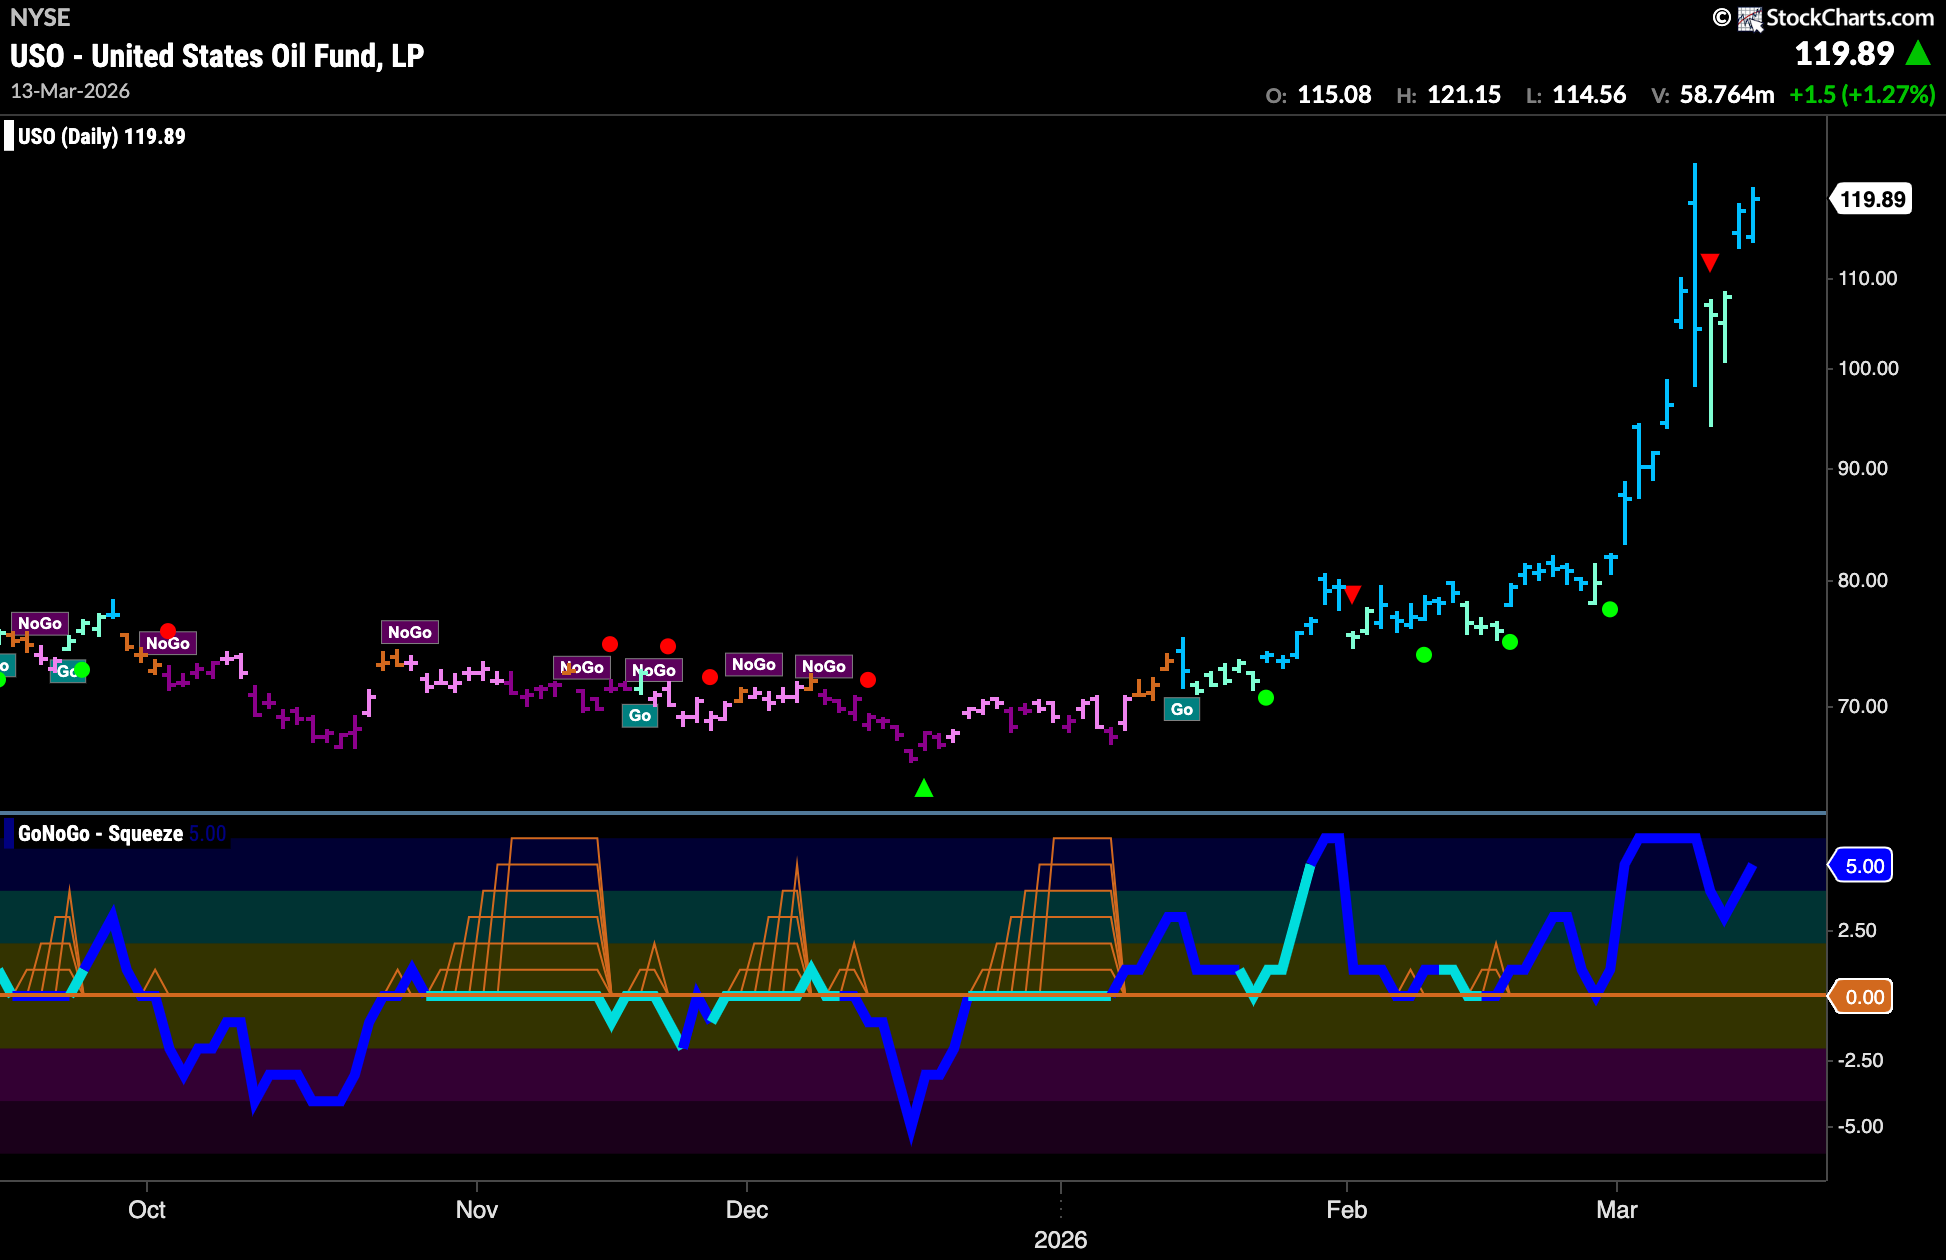
GoNoGo Trend shows that the “Go” trend remains firmly in place. After the volatile move higher last week we saw weaker aqua bars as price fell back but strength has returned quickly with bright blue bars as price gaps back toward the high from earlier in the week. GoNoGo Oscillator fell out of overbought territory but never got close to zero before turning around and is now approaching overbought territory again.
Gold Sees Weakness in “Go” Trend
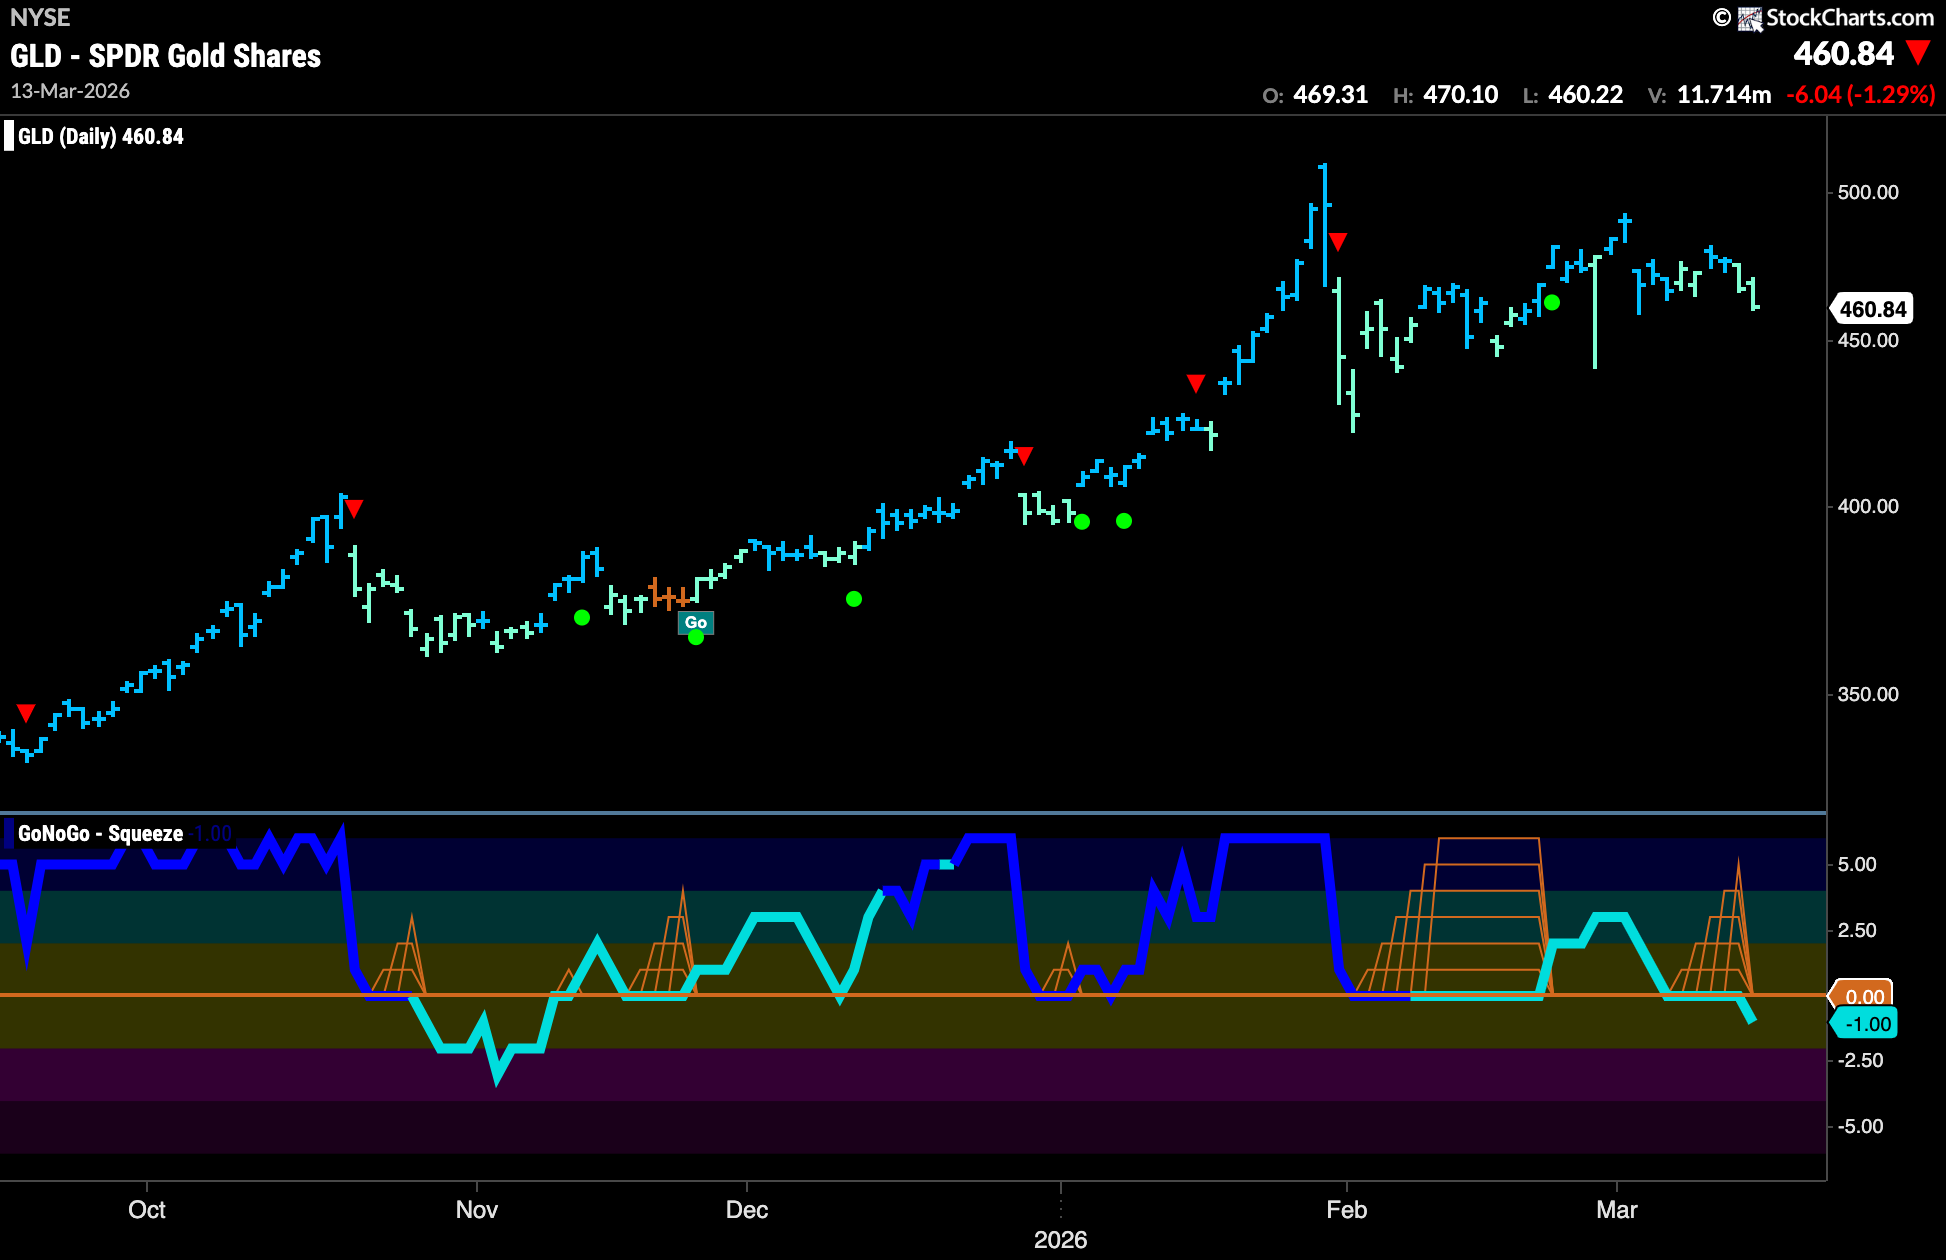
The trend in Gold is hanging around although it has been unable to come close to challenging the high from a few months ago. We see that as the week progressed, GoNoGo Trend began to paint weaker aqua bars and GoNoGo Oscillator fell to test the zero line yet again. This time, after a few bars at that level and a small GoNoGo Squeeze, we see that the oscillator is breaking down in to negative territory. This is a concern for the “Go” trend as we know that momentum is out of line with the “Go” trend.
Sector RelMap
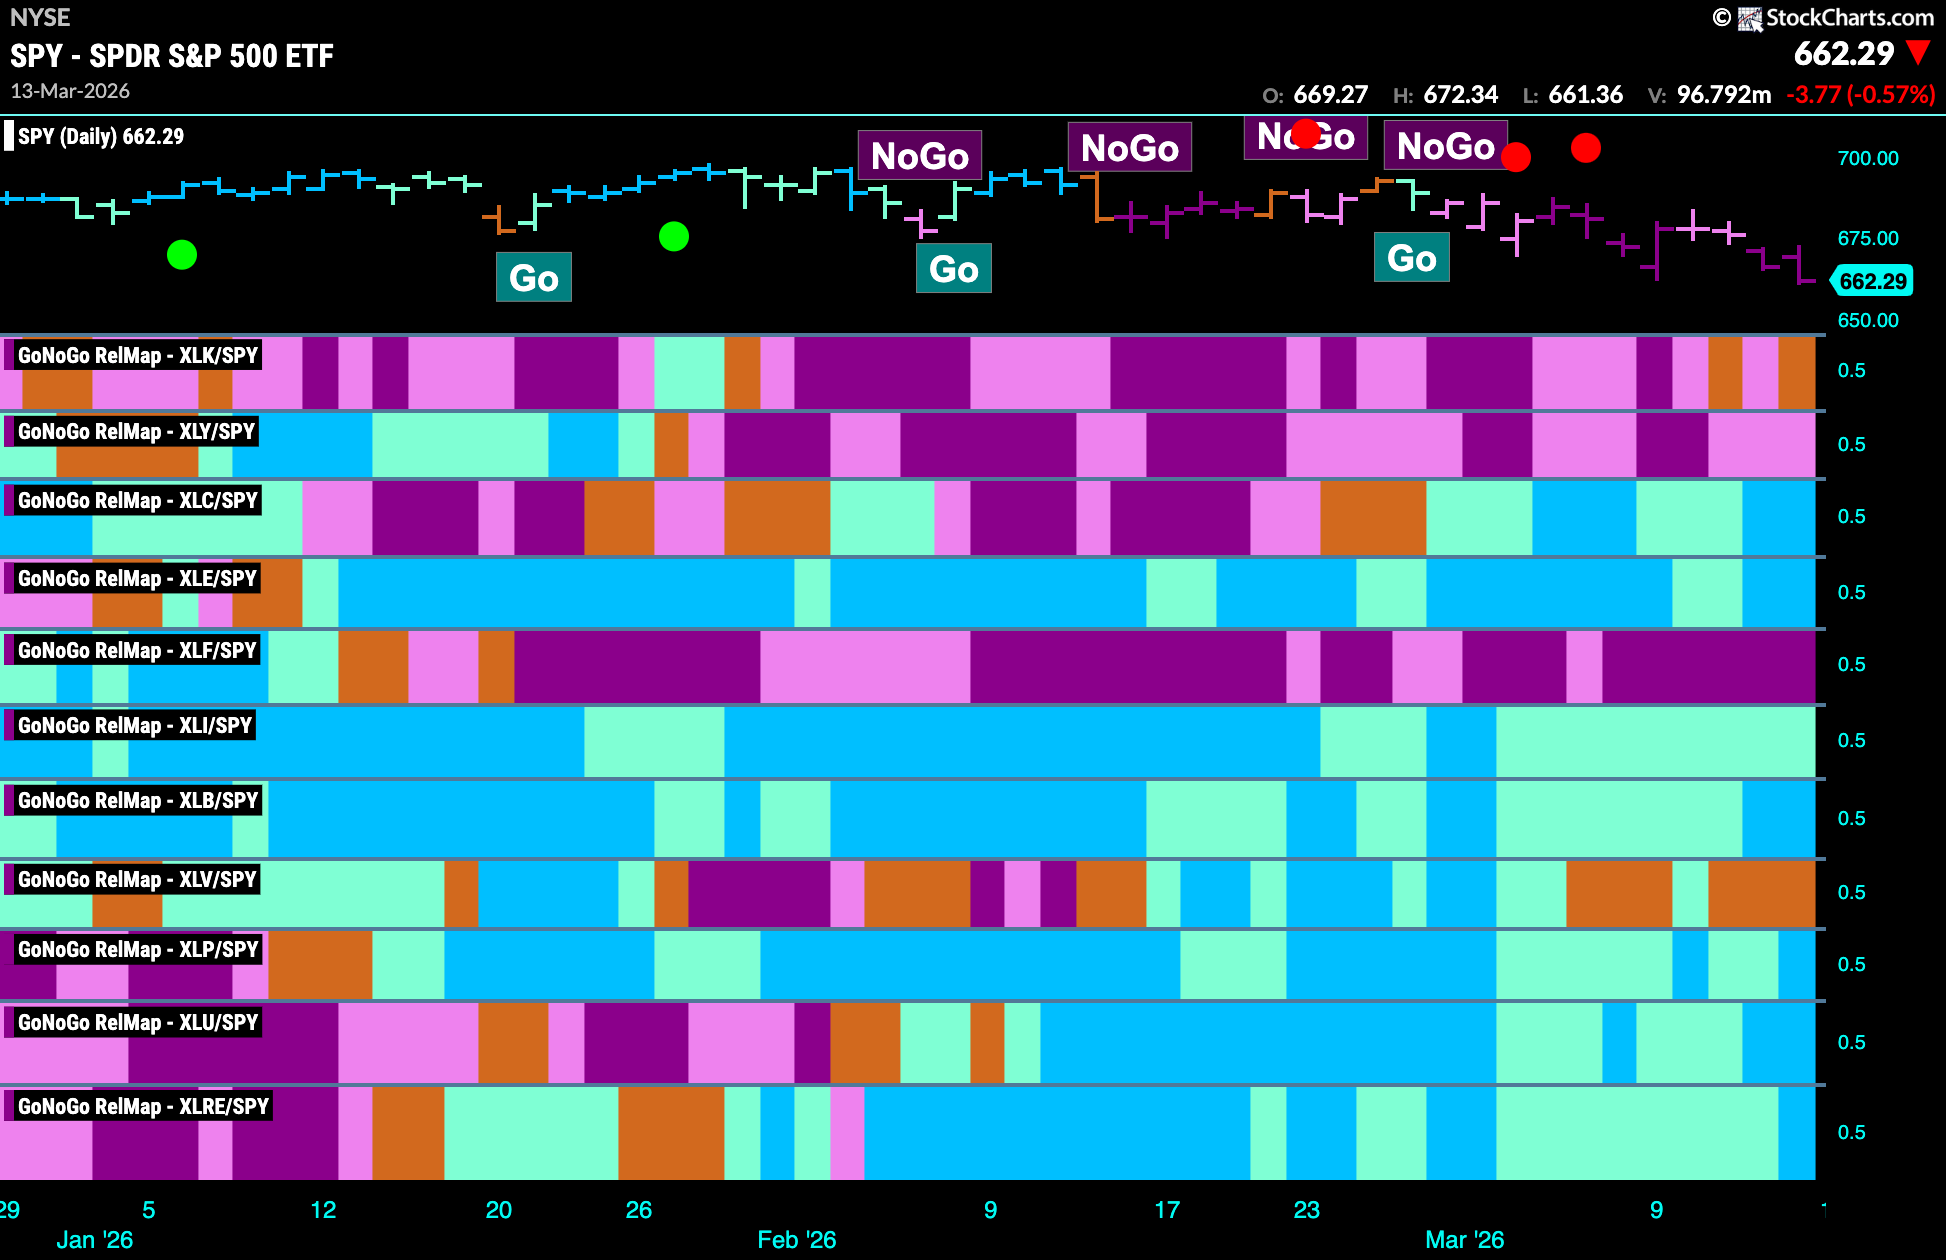
Below is the GoNoGo Sector RelMap. This GoNoGo RelMap applies the GoNoGo Trend to the relative strength ratios of the sectors to the base index. With this view we can get a sense of the relative out performance and relative underperformance of the sectors. 7 sectors are in relative “Go” trends. $XLC, $XLE, $XLI, $XLB, $XLP, $XLU, and $XLRE are painting relative “Go” bars.
Staples Sub-Group RelMap
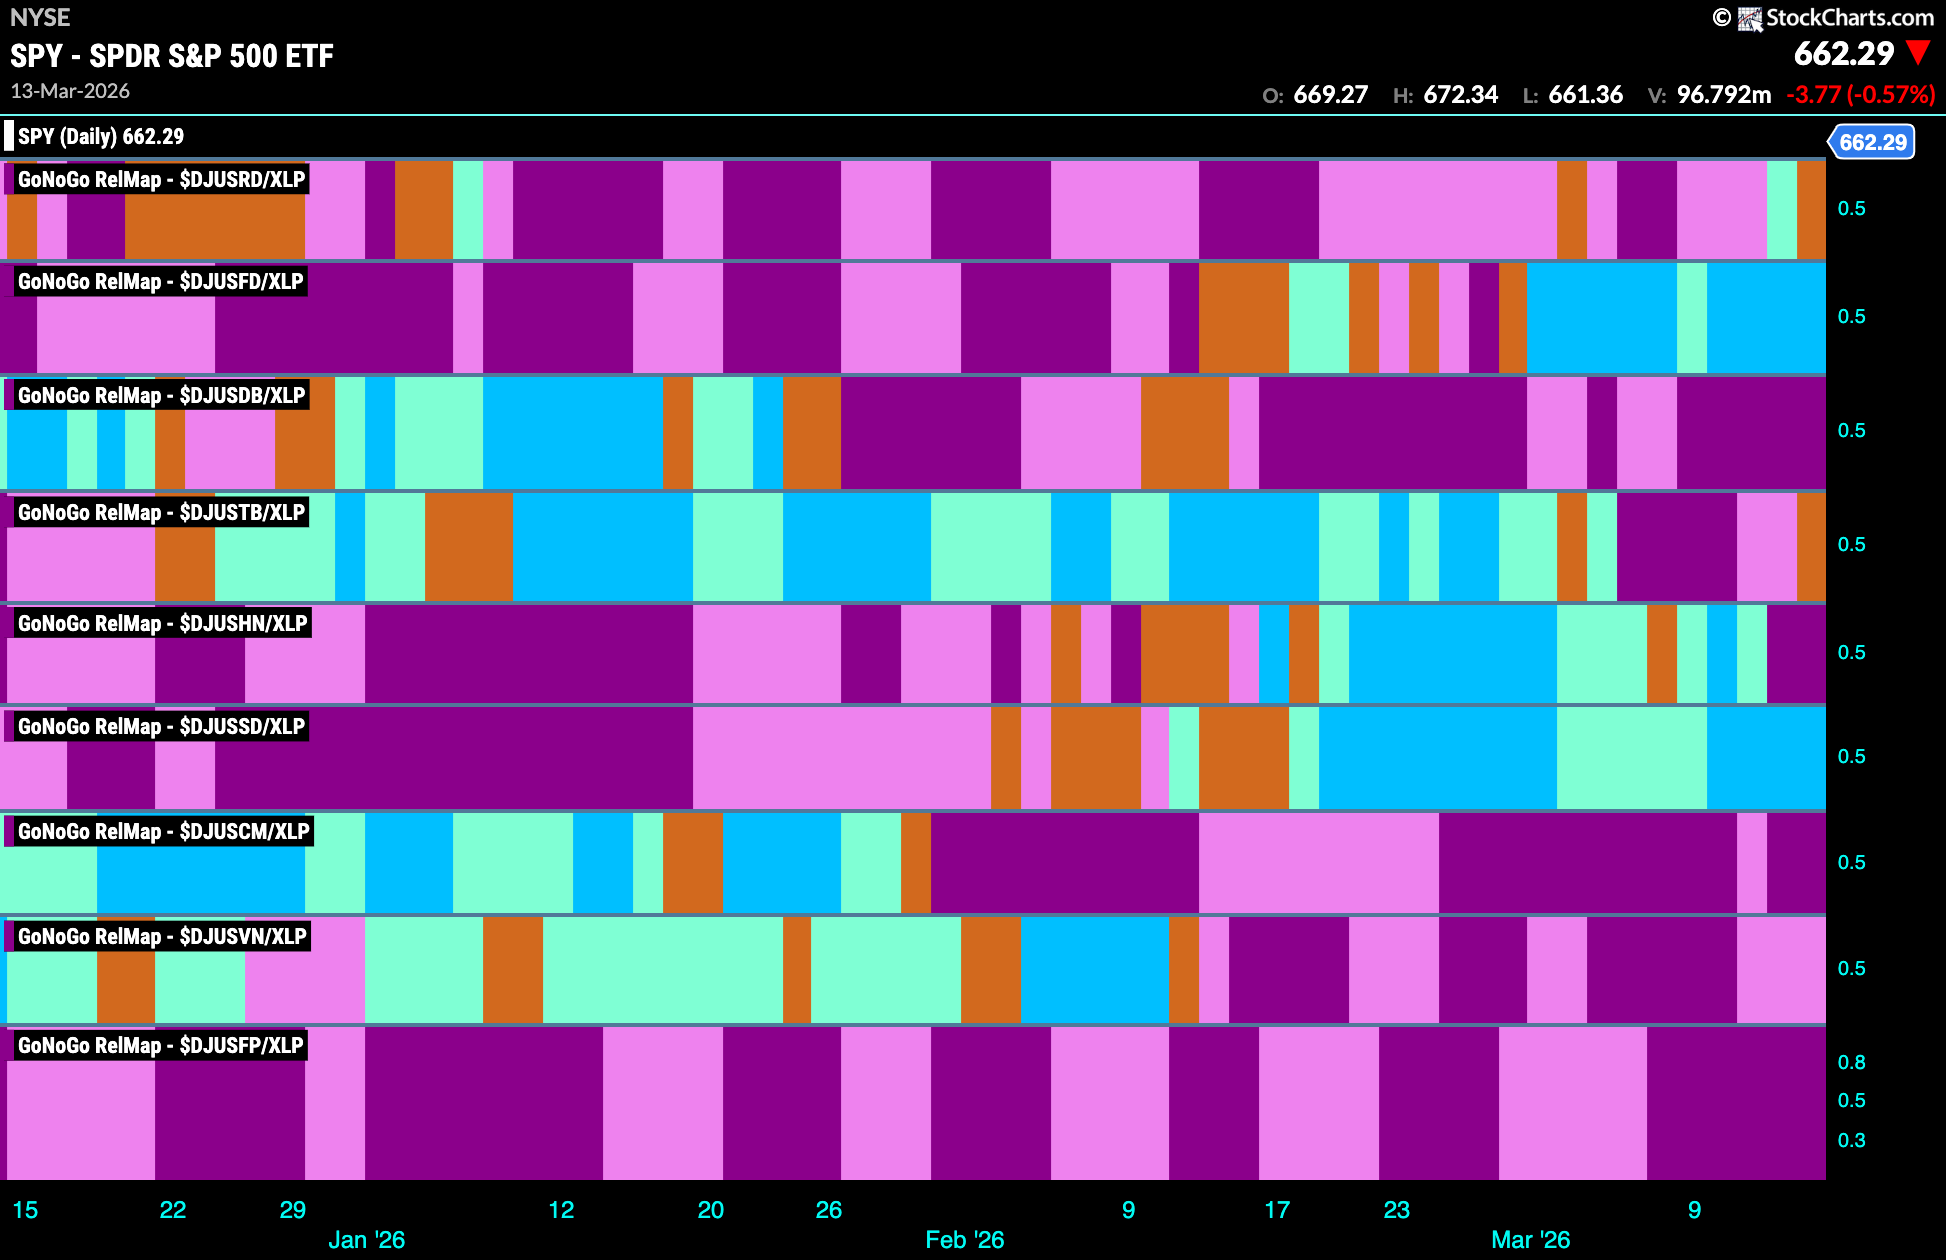
The chart below shows a relative trend breakdown of the sub groups within the staples sector this week. The Sub-Group RelMap plots the GoNoGo Trend of each sub index to the $XLP. We saw in the above GoNoGo Sector RelMap that $XLP is a consistent out-performer and paints strong relative “Go” bars. When we look at the below RelMap we can see that the food retailers index in the 2nd panel is painting strong blue “Go” bars on a relative basis.
$UNFI Looks to Power Through Overhead Resistance
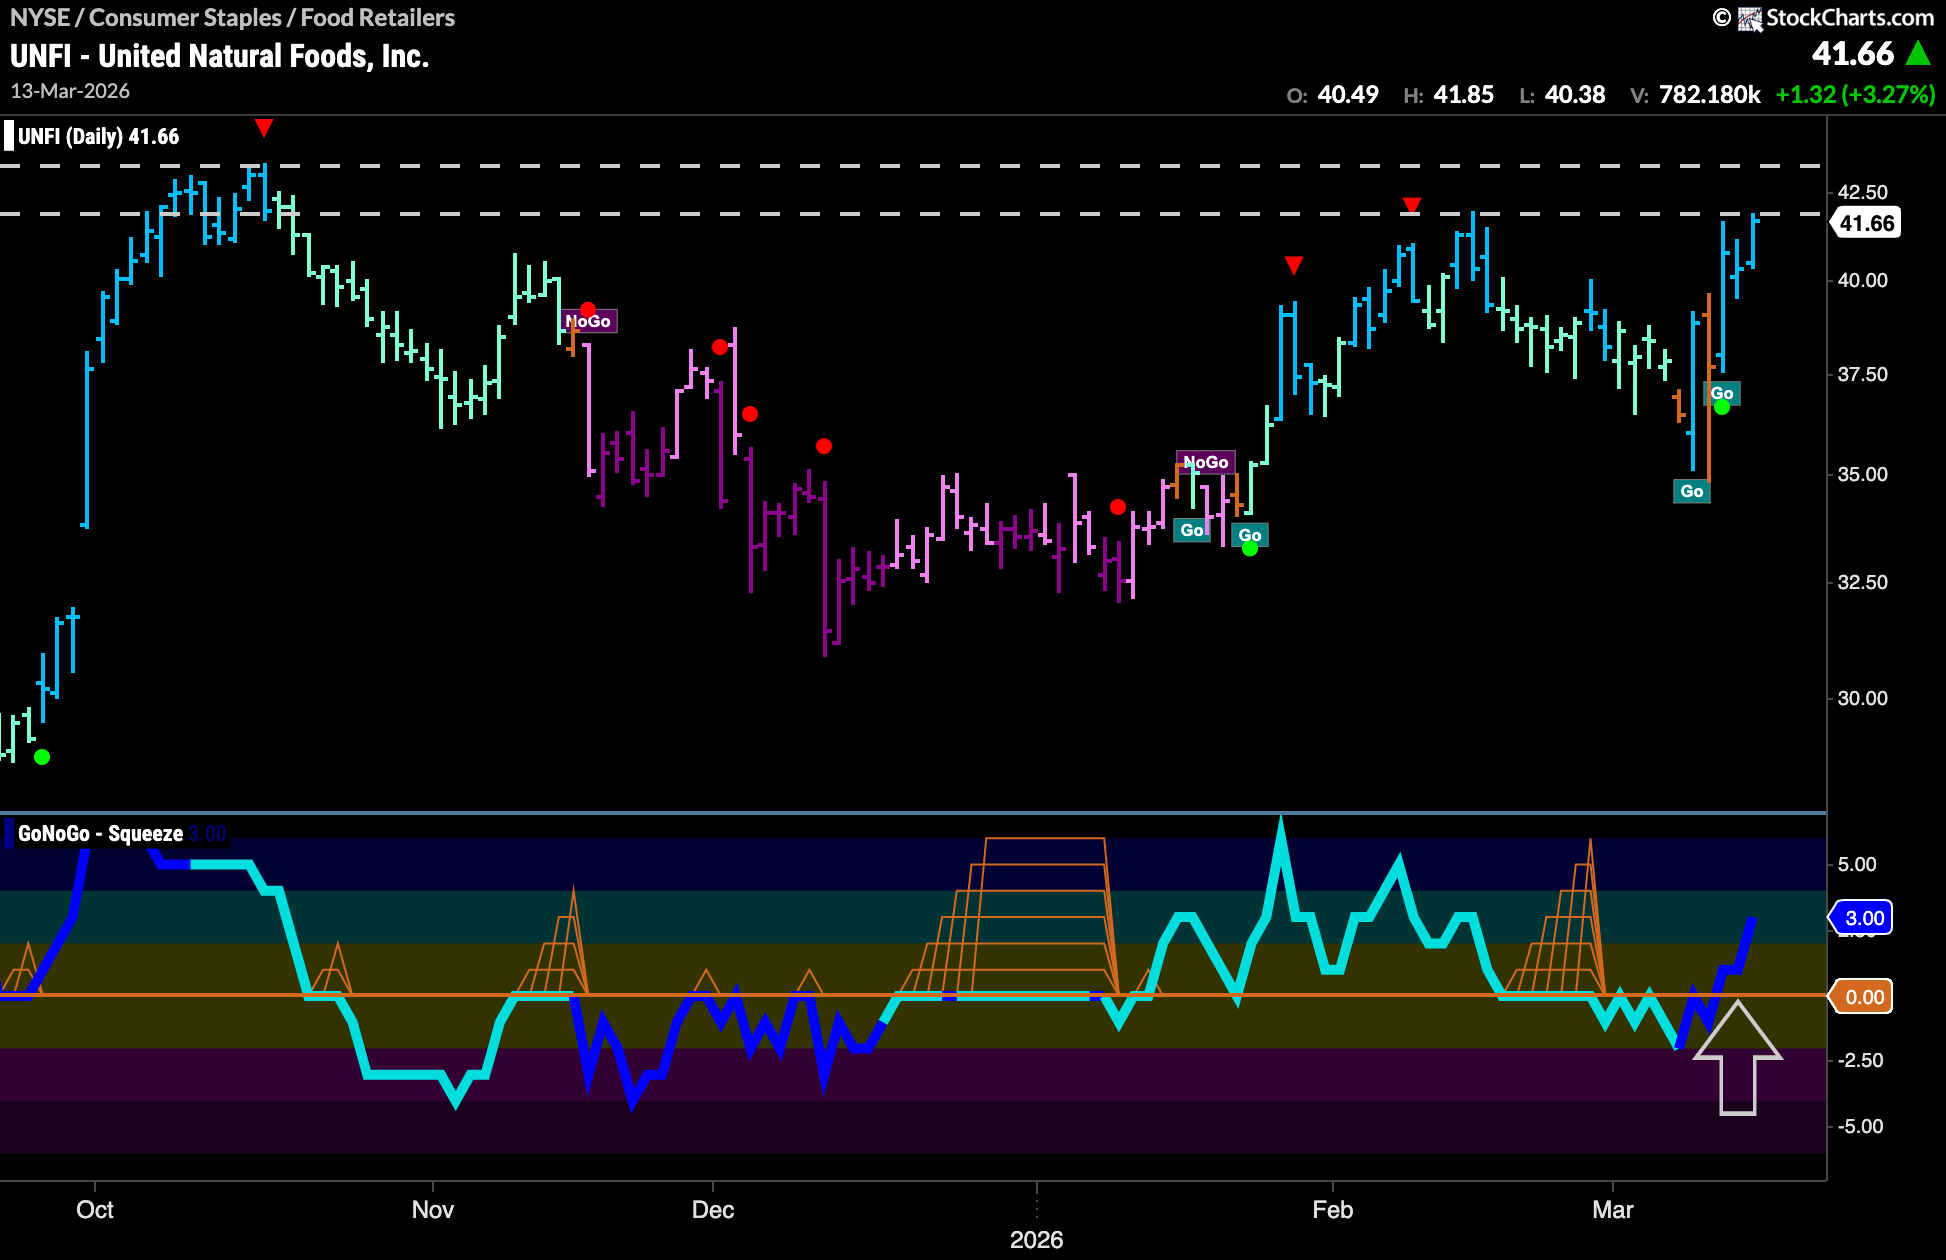
GoNoGo Trend shows that $UNFI has run up against the horizontal resistance we can see on the chart from prior highs in February. If we look at the oscillator panel, we can see that GoNoGo Oscillator has powered back through the zero line on heavy volume into positive territory. This came as price recovered from uncertainty amber “Go Fish” bars. We will watch to see if this resurgent momentum in the direction of the “Go” trend will help give price the push it needs to move higher. We note that there will likely be resistance from late last year should it move into the channel we have annotated on the chart.
$VLGEA Breaks Out of Upward Sloping Channel
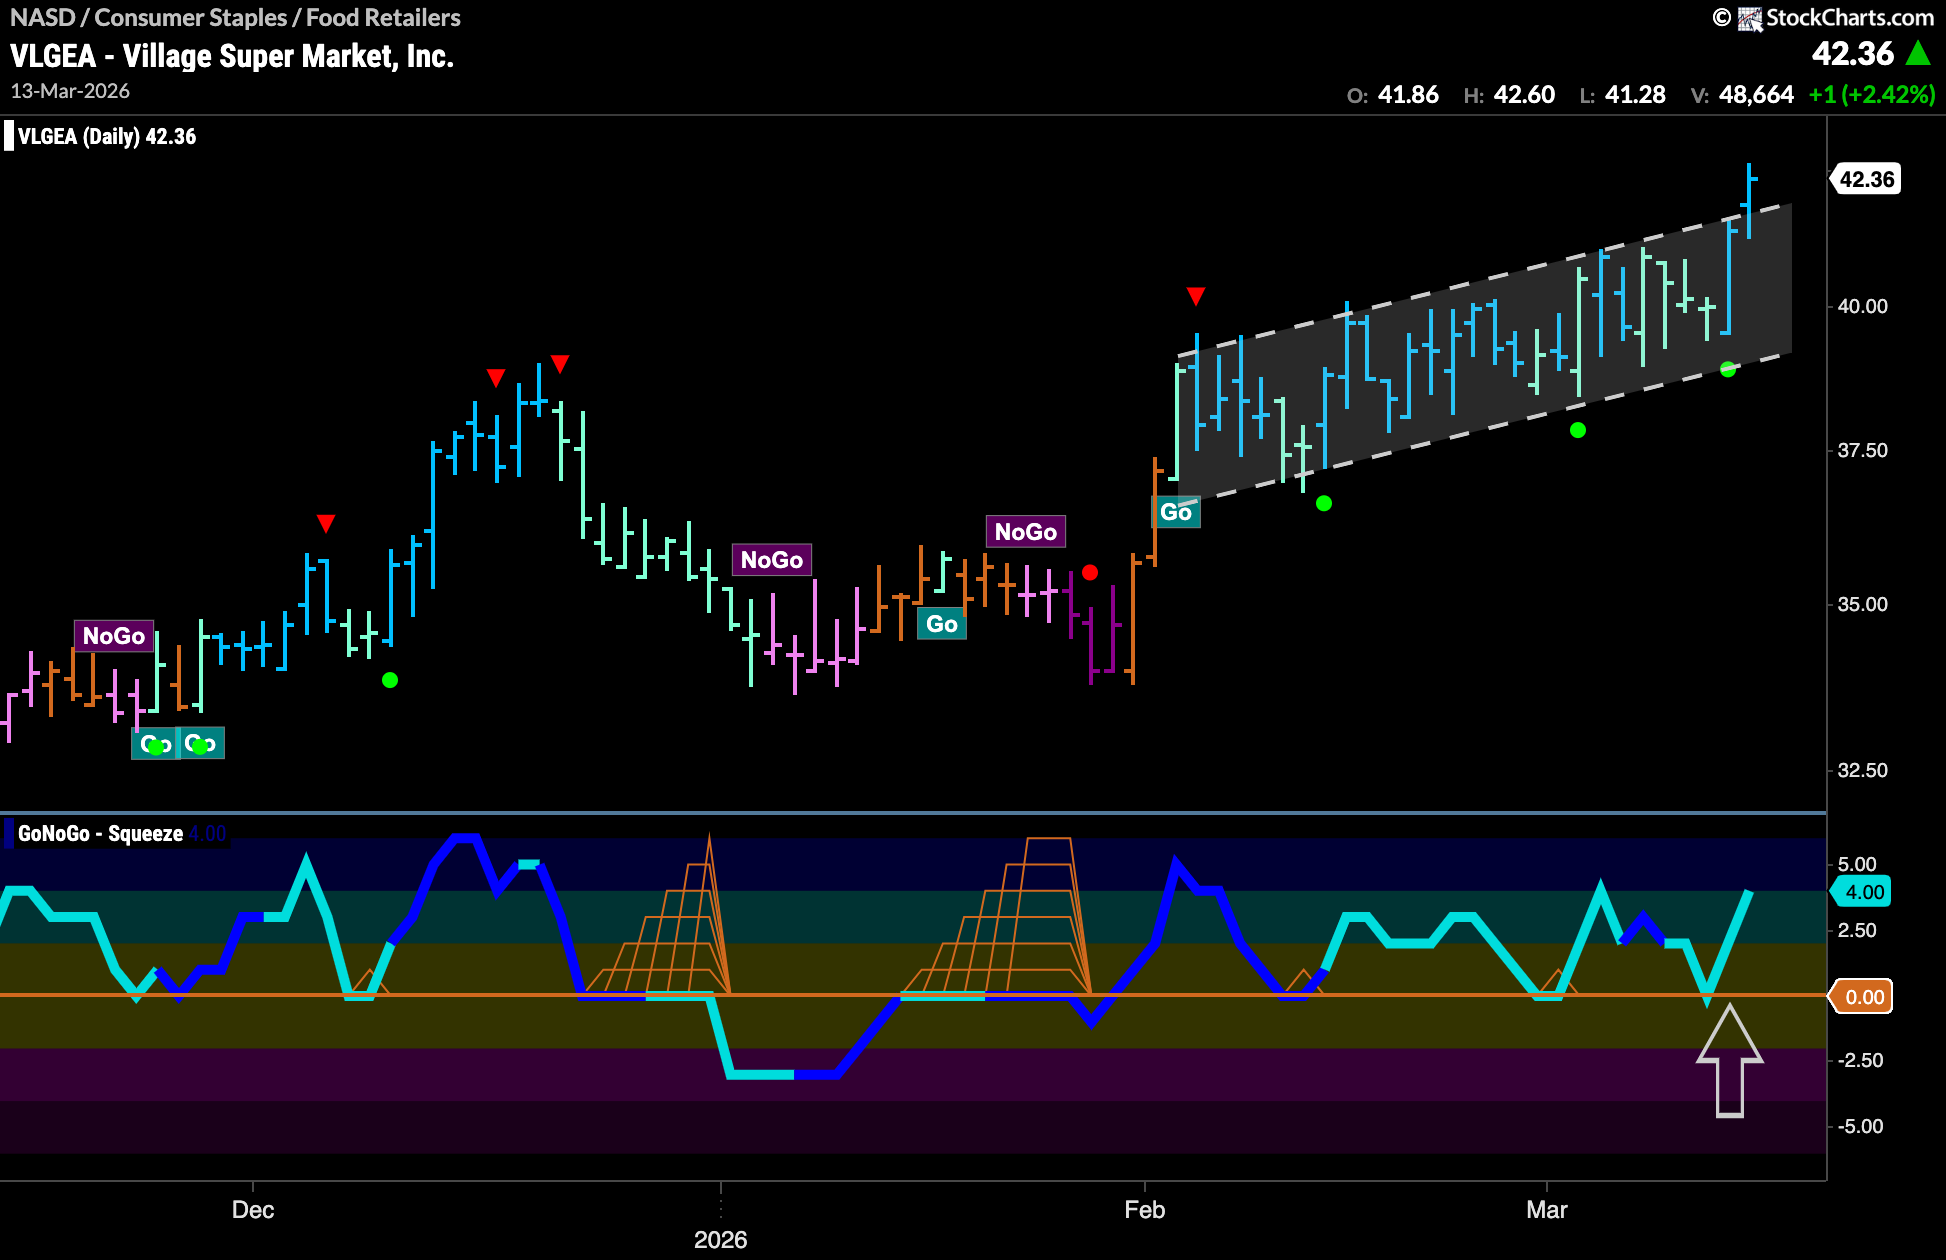
$VLGEA has surged up and out of the upper bound of a trend channel. GoNoGo Trend shows that a “Go” trend has been in place and very consistently has been climbing higher with gradually higher highs and higher lows. In the lower panel, we see that each time the zero line has been tested it has become support. Recently, we see another bounce off zero and a Go Trend Continuation Icon (green circle) suggesting that momentum is resurgent in the direction of the “Go” trend. Price has followed by breaking out of the channel to another higher high. We will look for price to consolidate this move and potentially use the upper bound of the channel as support should it be needed going forward.