
The record highs in equity indexes last week masked deterioration in the number of shares participating in the trend, a warning of potential fragility for this seasonal run.
Good morning and happy holiday season – U.S. markets will have a shortened trading session due to the Thanksgiving holiday.
Looking only at the index level, we see strong “Go” trends for US Equities. Consider the GoNoGo Asset Map below. Not much has changed this week as we see equities able to remain in a strong “Go” painting bright blue bars. The dollar shows strength as we see a return to strong “Go” bars after a “Go Fish” bar last week. Commodities also remain in a “Go” trend albeit on weaker aqua bars. Treasuries (prices) struggle still, painting a mix of pink and purple “NoGo” bars last week.

No Love for the Little Guy (last week)
“All animals are equal, but some animals are more equal than others.”
- George Orwell, Animal Farm
U.S. small-cap stocks lagged their large-cap peers by a wide margin last week. The Russell 2000 Index fell nearly 3% for the week. It’s been a volatile stretch for these more speculative shares, as the index has fallen nearly 4% over the past two weeks after surging more than 6% in the trading week ending November 5. See the chart below of $IWM. GoNoGo Trend® conditions have weakened to aqua bars amidst the pullback right to prior resistance levels. GoNoGo Oscillator® fell to the zero line on heavy volume and is now building a squeeze. This is a crucial decision point for whether the small-cap rally will hold.

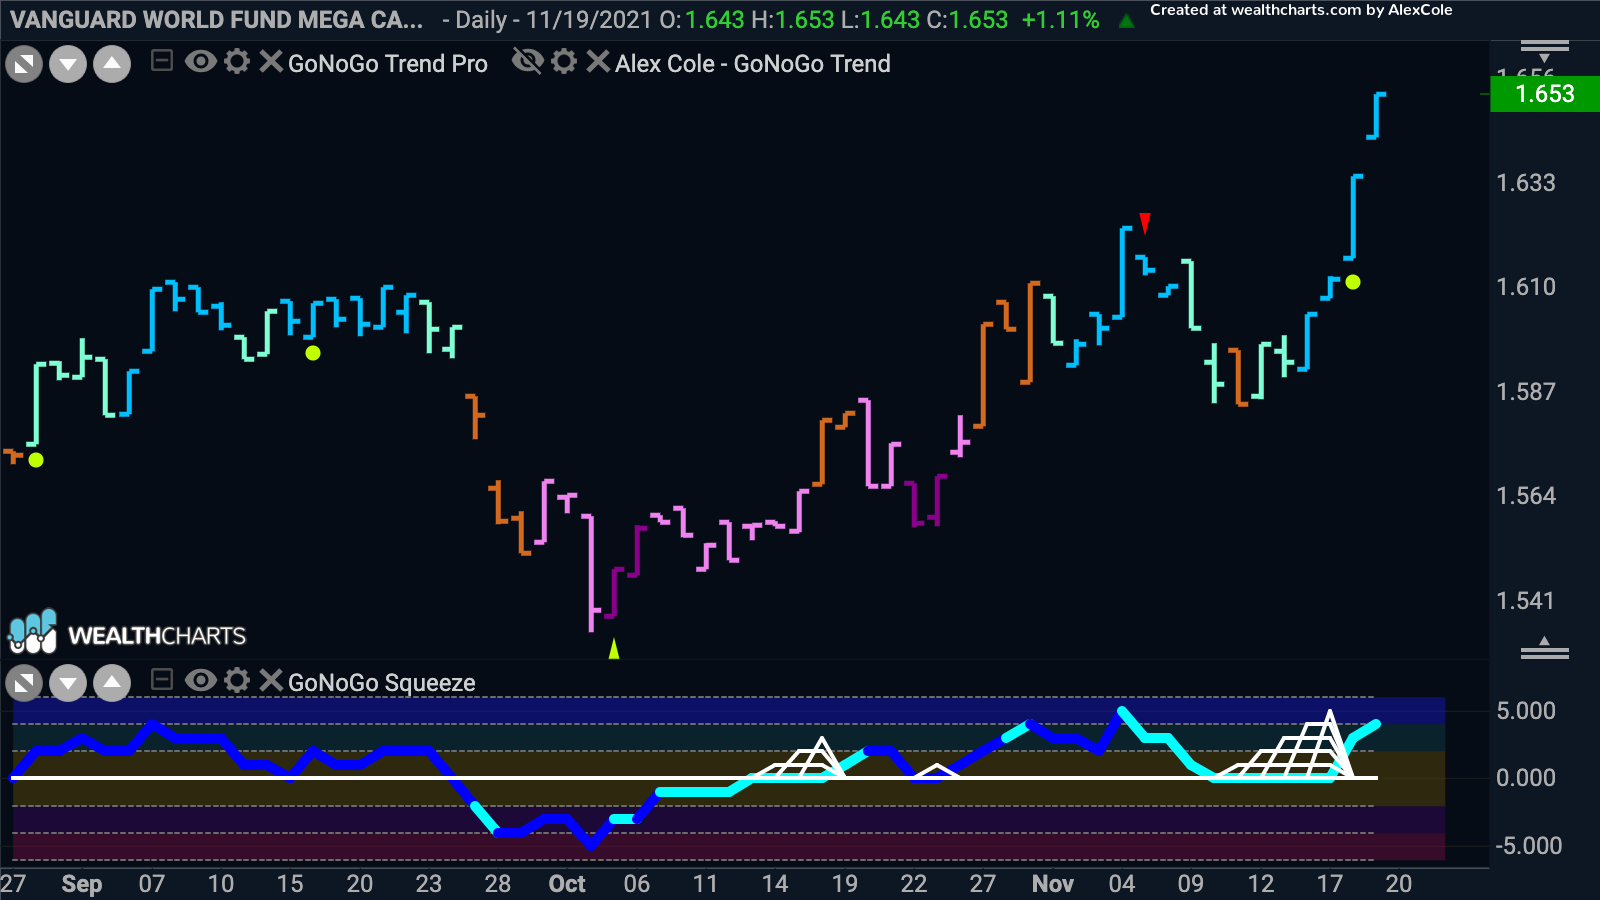
Technicians look to market internals such as “breadth studies” to see how healthy a market rally is. One note of caution for investors now is simply how narrow the current rally has become. See the chart below of $MGK/RSP which depicts the relative ratio of mega-cap growth shares vs an equal weight index. We can see the runaway performance of the largest tech, discretionary, and communications companies that make up the growth index vs an equal weight index that highlights the underperformance of industrials, energy, financials, and smaller market cap companies in the index:

Sector Performance – Leadership Narrows
Below is a GoNoGo RelMap® which applies the GoNoGo Trend methodology to the relative ratio of each sector ETF to the benchmark index, the $SPY. There were only three sectors showing relative “Go” trends to end last week’s trading. Materials ($XLB), discretionary ($XLY), and technology ($XLK). Materials, discretionary, and technology have been the out-performers for a few weeks now.
Economists are watching US Consumer Spending closely for signs of Covid recovery. With the historically fervent U.S. shopping season upon us, it seems technology and discretionary are well-positioned to move higher.
Notice that Energy ($XLE), Industrials ($XLI) and Financials ($XLF) showed further downside pressures this week and are now all in “NoGo” relative trends against the index:

Discretionary vs Technology
Let’s take a look at the GoNoGo Chart of the ratio of discretionary to technology, $XLY to $XLK. Interestingly, even as both sectors outperform, it is the discretionary sector that is in a relative “Go” trend. Price looks to have set a higher low even while the GoNoGo Oscillator struggled to hold the zero line. The oscillator is back at zero now, on heavy volume, so we will watch to see if it can break back into positive territory which would show strength for discretionary vs technology. If the oscillator gets rejected at the zero line then we may see some struggles for this ratio in the price panel above.

Tesla Topping or Consolidating?
Tesla has been an unbelievable performer and has delivered outsized returns for many investors over the last few years. Being the largest company in the discretionary sector, it has helped drive sector outperformance. Let’s look at the GoNoGo Charts below to see what the technical picture is now for the electric vehicle maker. The weekly chart shows that the trend is still in place. GoNoGo Trend is painting paler aqua “Go” bars as price comes off a recent high. The Go CounterTrend red correction arrow highlighted this top. GoNoGo Oscillator is in positive territory but not overbought and on heavy volume.

If we look at the daily chart of Tesla, we can see that price has corrected sharply from the recent high. A string of aqua “Go” bars saw price drop significantly and the GoNoGo Oscillator fell from overbought levels quickly to the zero line. The oscillator is currently riding the zero line as price looks to have set a new low. GoNoGo Trend sees the trend strengthen to strong blue “Go” bars and we will look for the oscillator to rally into positive territory. If it does, we will see a Go Trend Continuation green circle appear under the price bar and we could look for an attack on prior highs.

Technology Leading Higher
What about technology? The leader of 2020 has returned as we’ve noted recently in research notes. But did it ever go away? The chart below is a weekly GoNoGo Chart of the technology sector and we can see that the “Go” trend has been in place since early 2020. On a relative basis, other sectors this year have taken their turn at driving alpha, but on a pure trend basis, the technology sector has been in an uninterrupted “Go” trend. It has in fact gone from strength to strength. In recent weeks, we have seen a new high following a string of strong blue “Go” bars and the GoNoGo Oscillator has rallied sharply off the zero line on heavy volume.

Bill.com Setting Up for Move Higher?
So technology looks strong, we can look for GoNoGo setups that are attractive. Below is the chart of $BILL. We can see that it is in a “Go” trend and has been for some time, making a series of higher highs and higher lows. Right now, price has pulled back from a high that was signaled by a Go Countertrend correction red arrow. Current levels could offer support as the concept of polarity reminds us that old resistance becomes support. GoNoGo Oscillator has also fallen to the zero line where it is trying to find support. If we see the oscillator rally from here then we will look for price to make an attempt to set a new high above $350.


