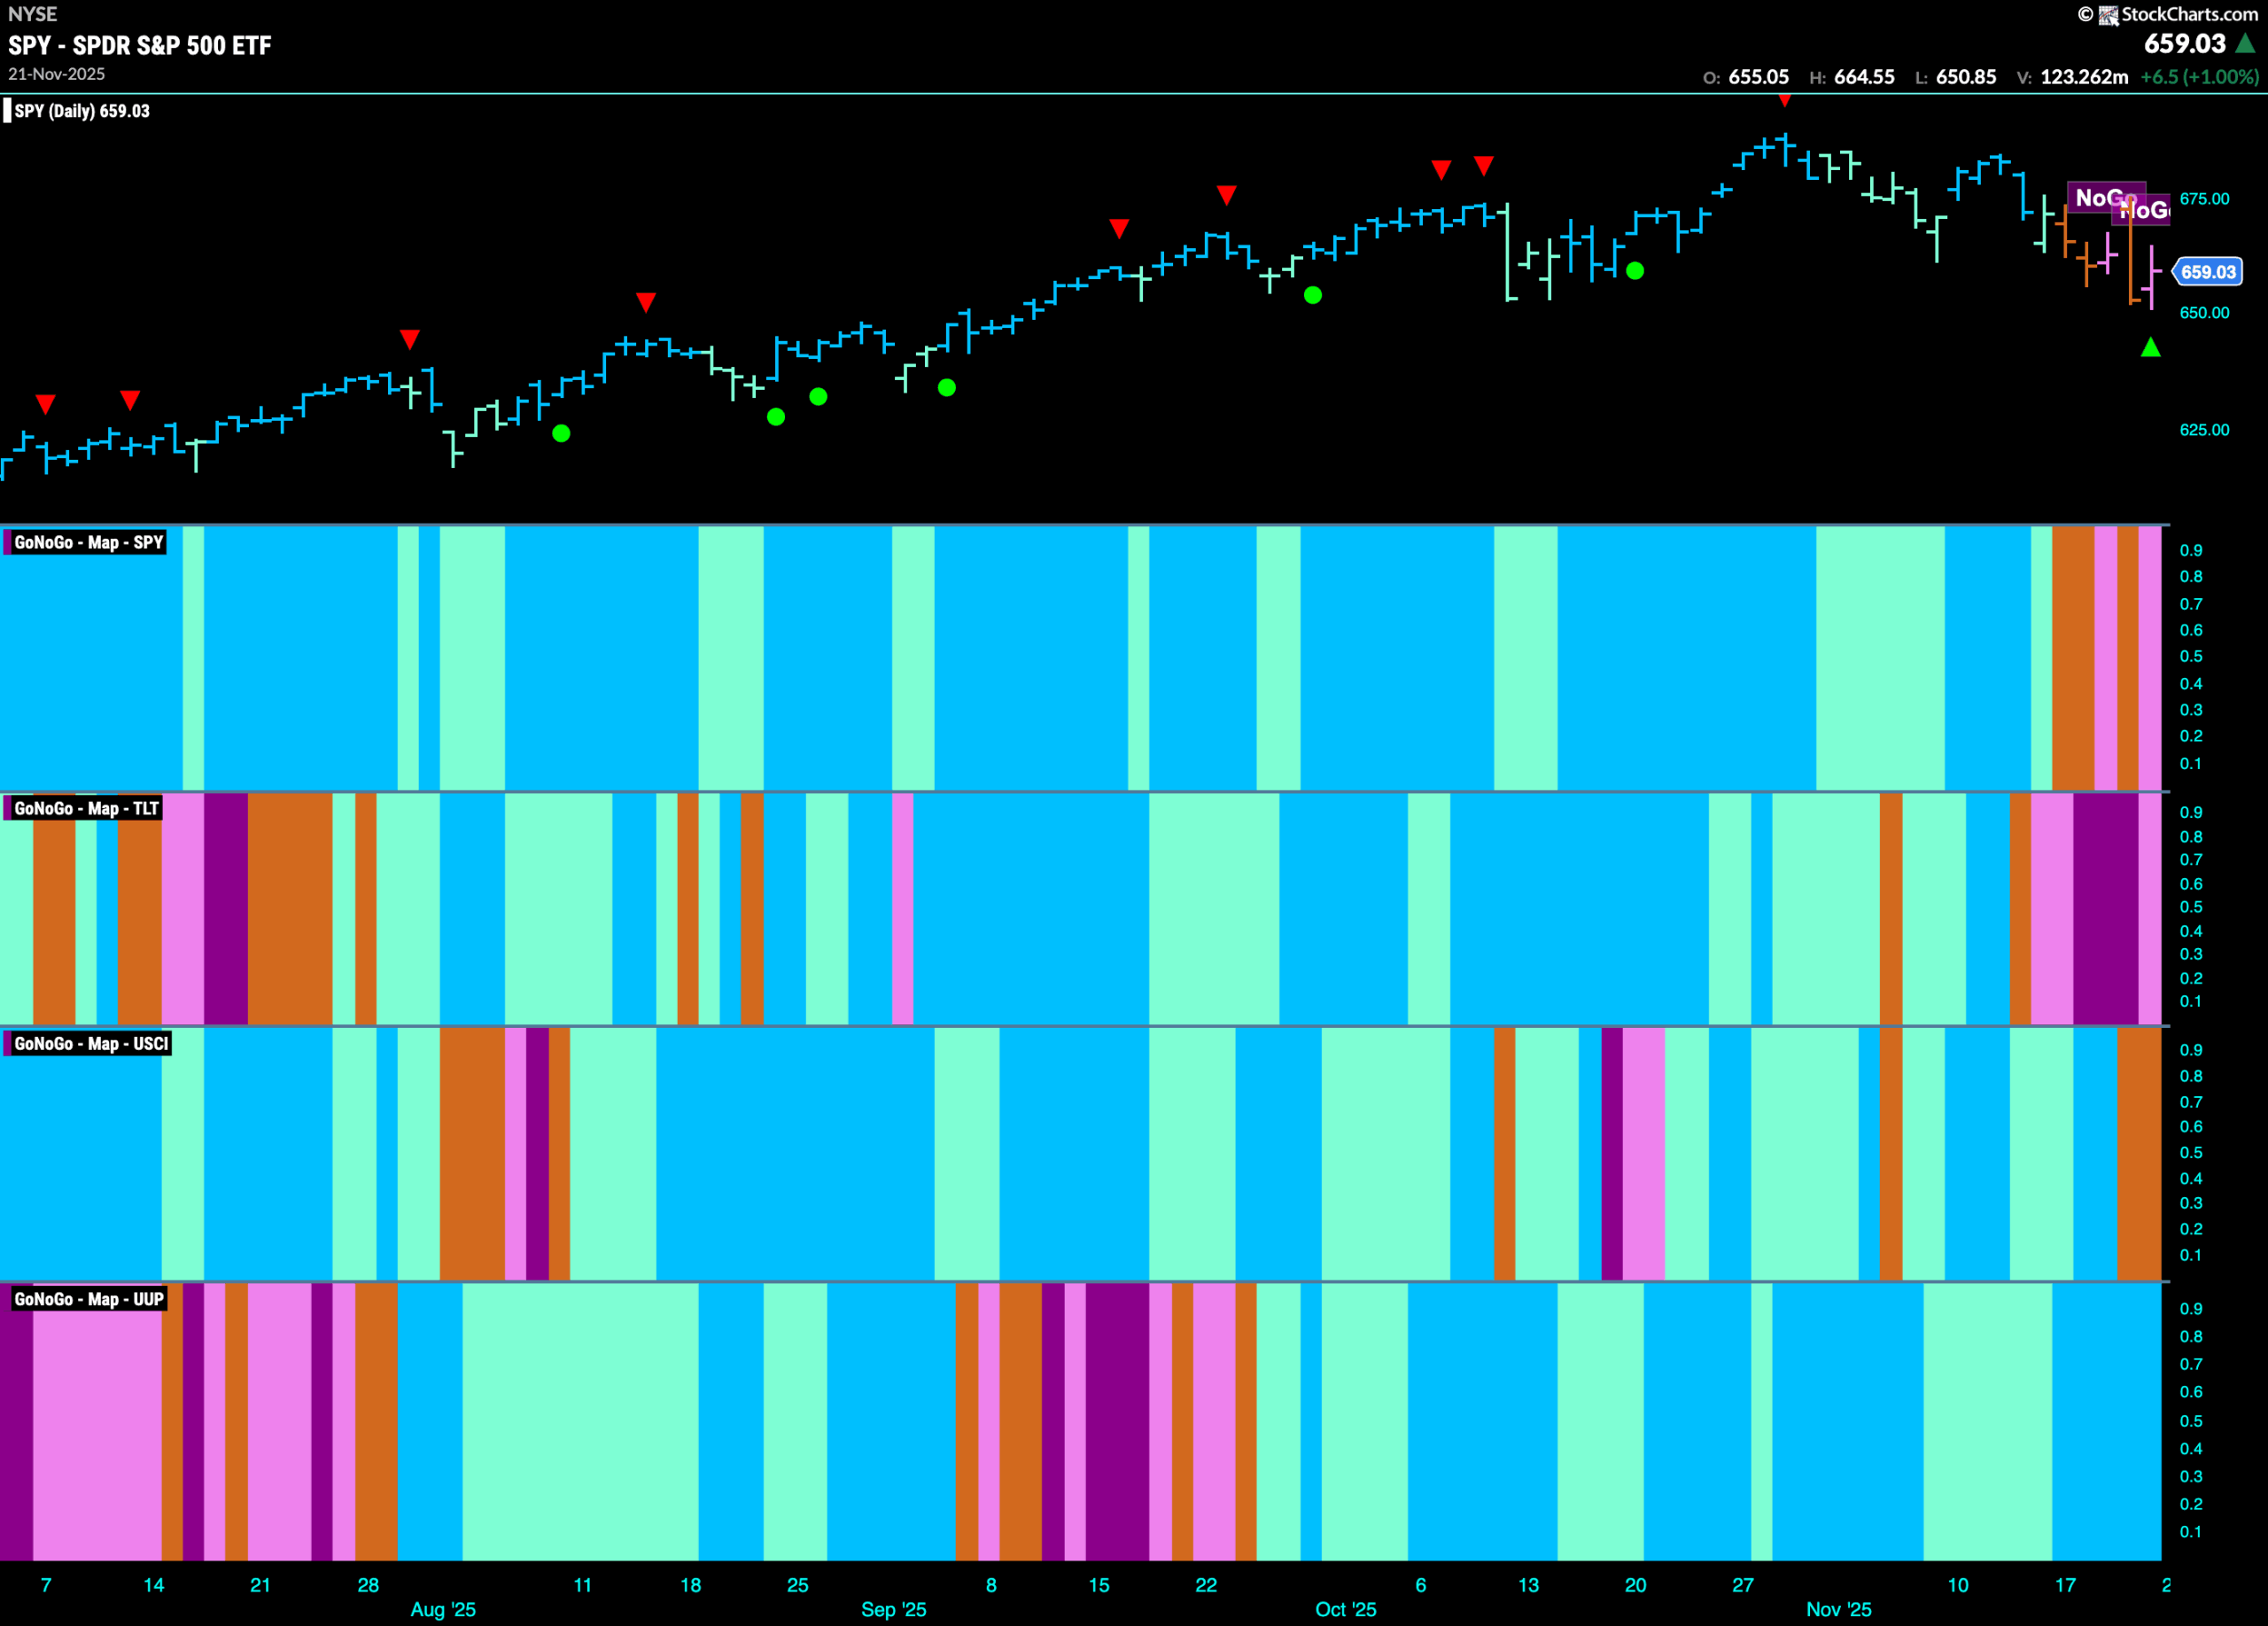

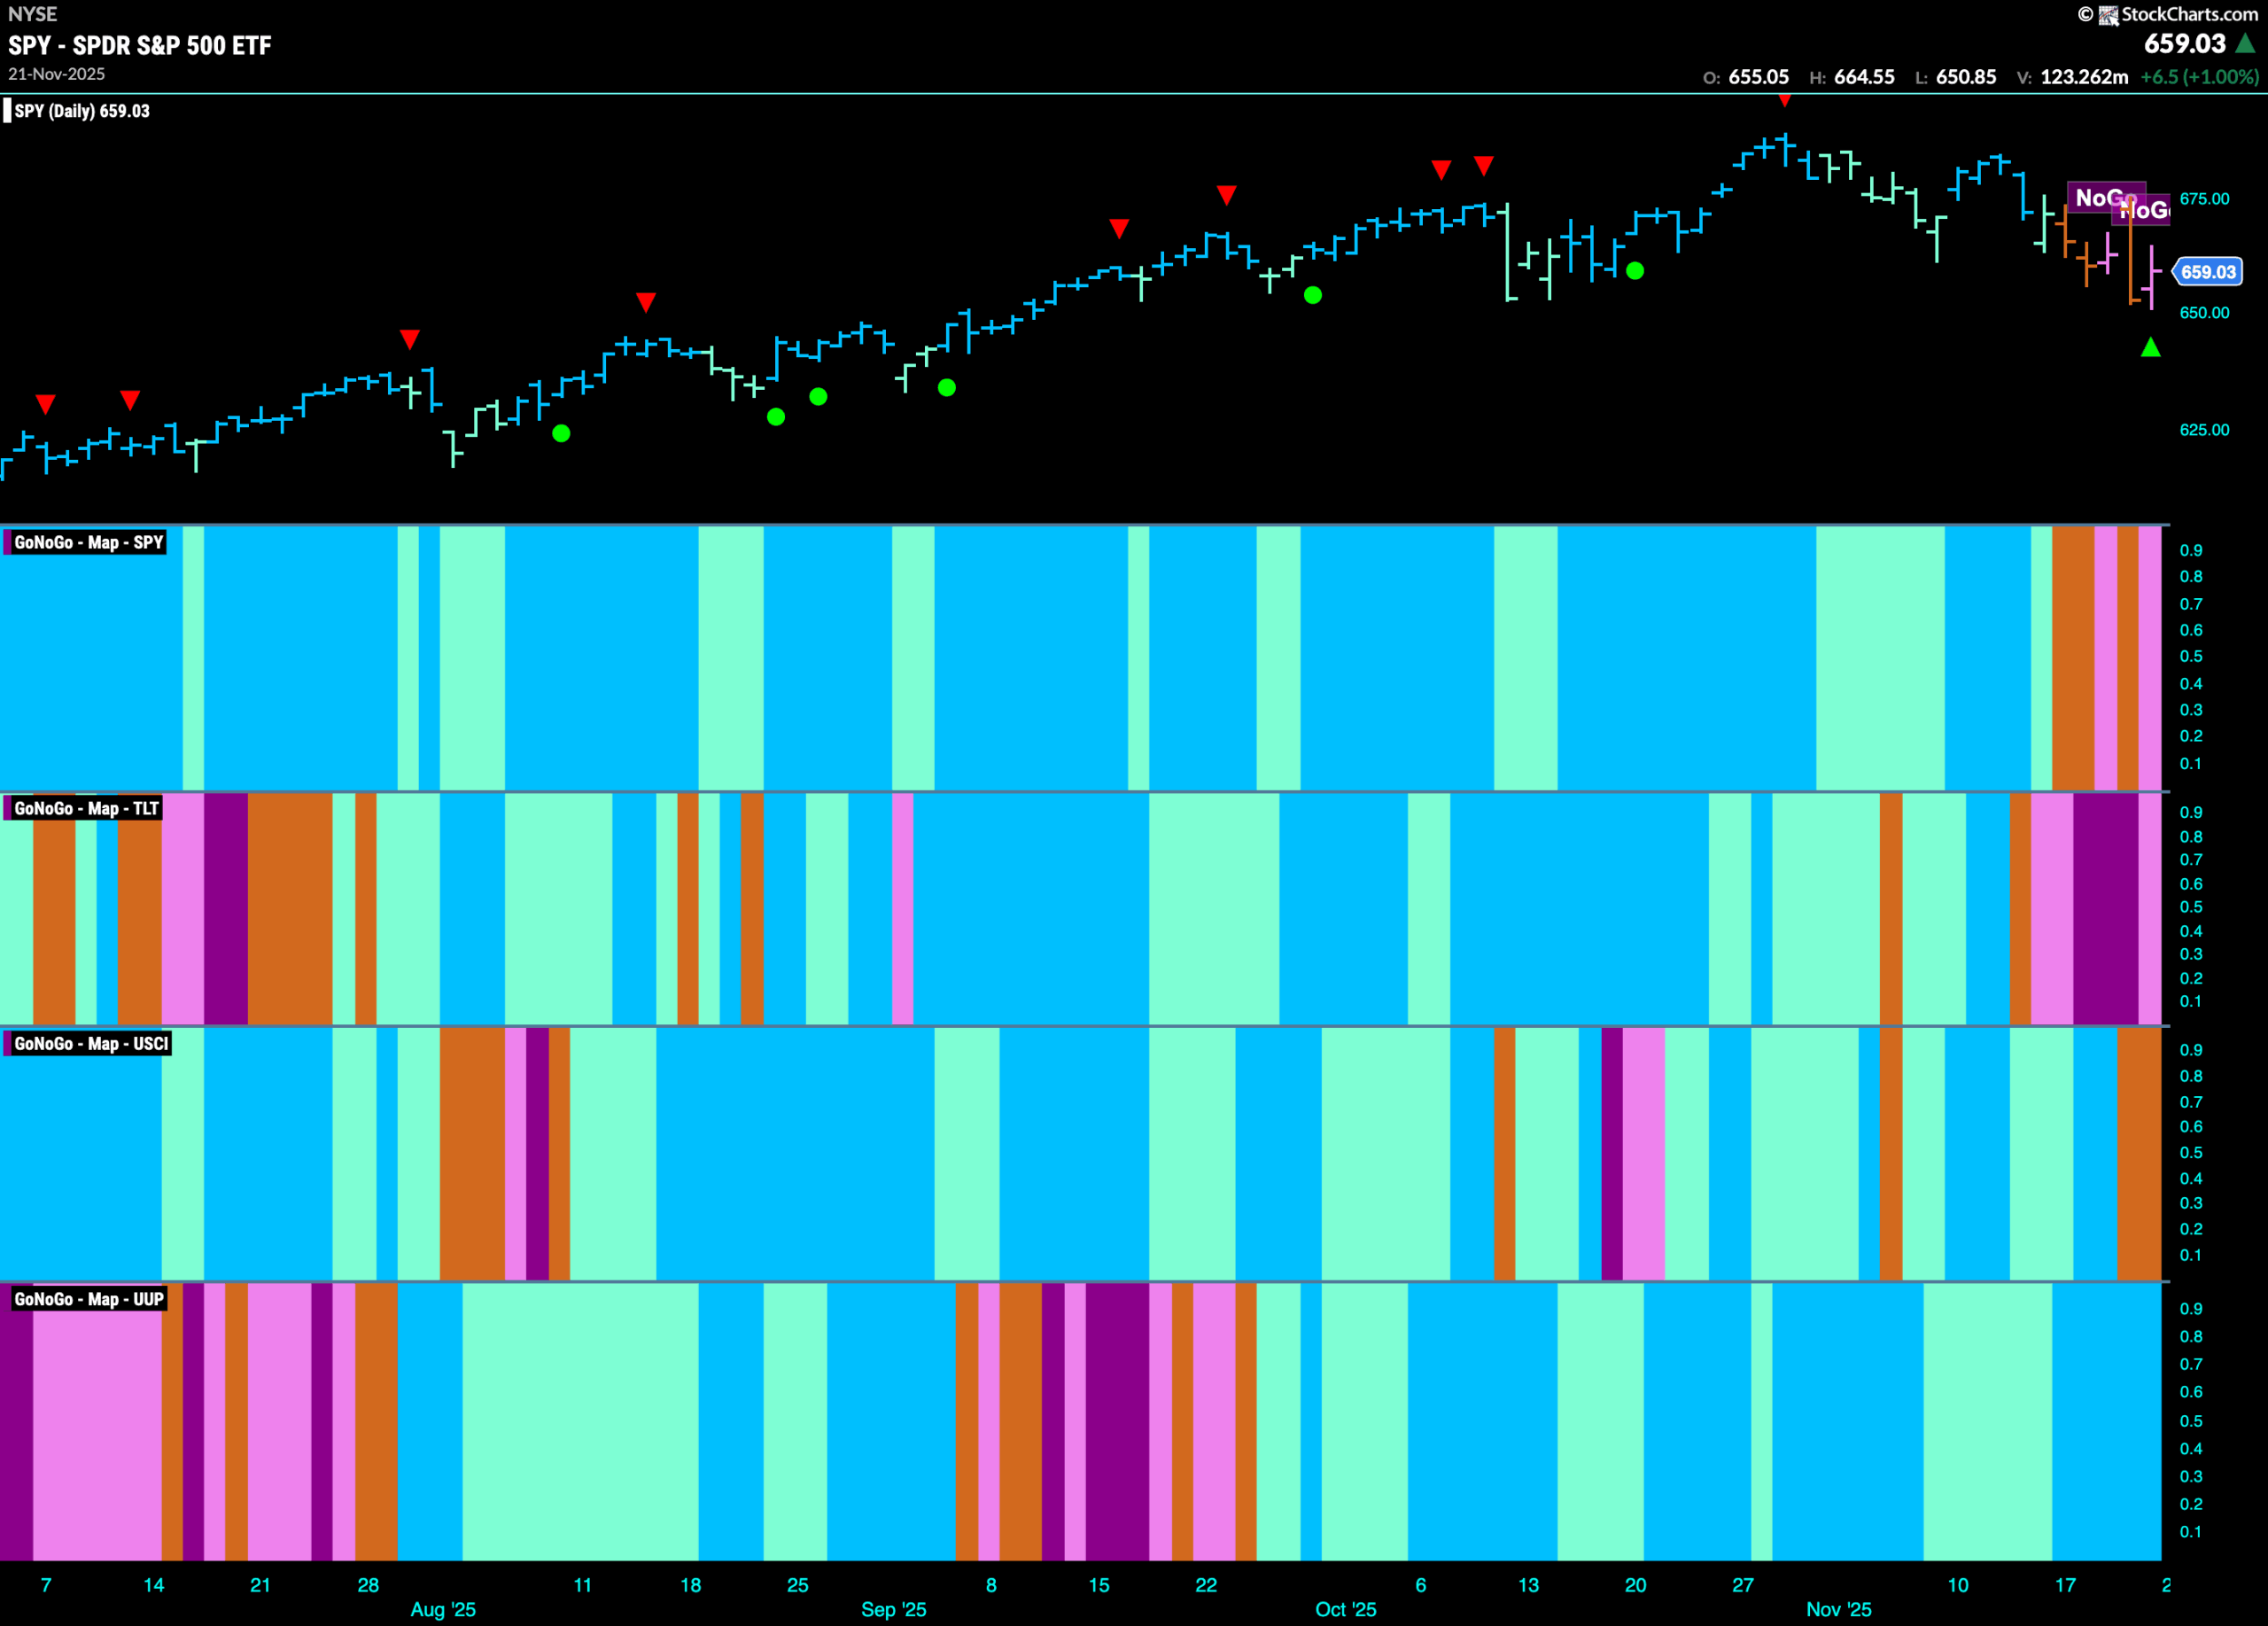
Good morning and welcome to this week’s Flight Path. Equities have seen the trend change this week as uncertainty crept in with amber “Go Fish” bars before we saw “NoGo” pink bars. Treasury bond prices remain in a “NoGo” trend with “NoGo” bars this week. U.S. commodities also flashed uncertainty as we see a couple of amber “Go Fish” bars. The dollar is the lone hold out still painting bright blue “Go” bars.
$SPY Sees “Go” Trend Fail
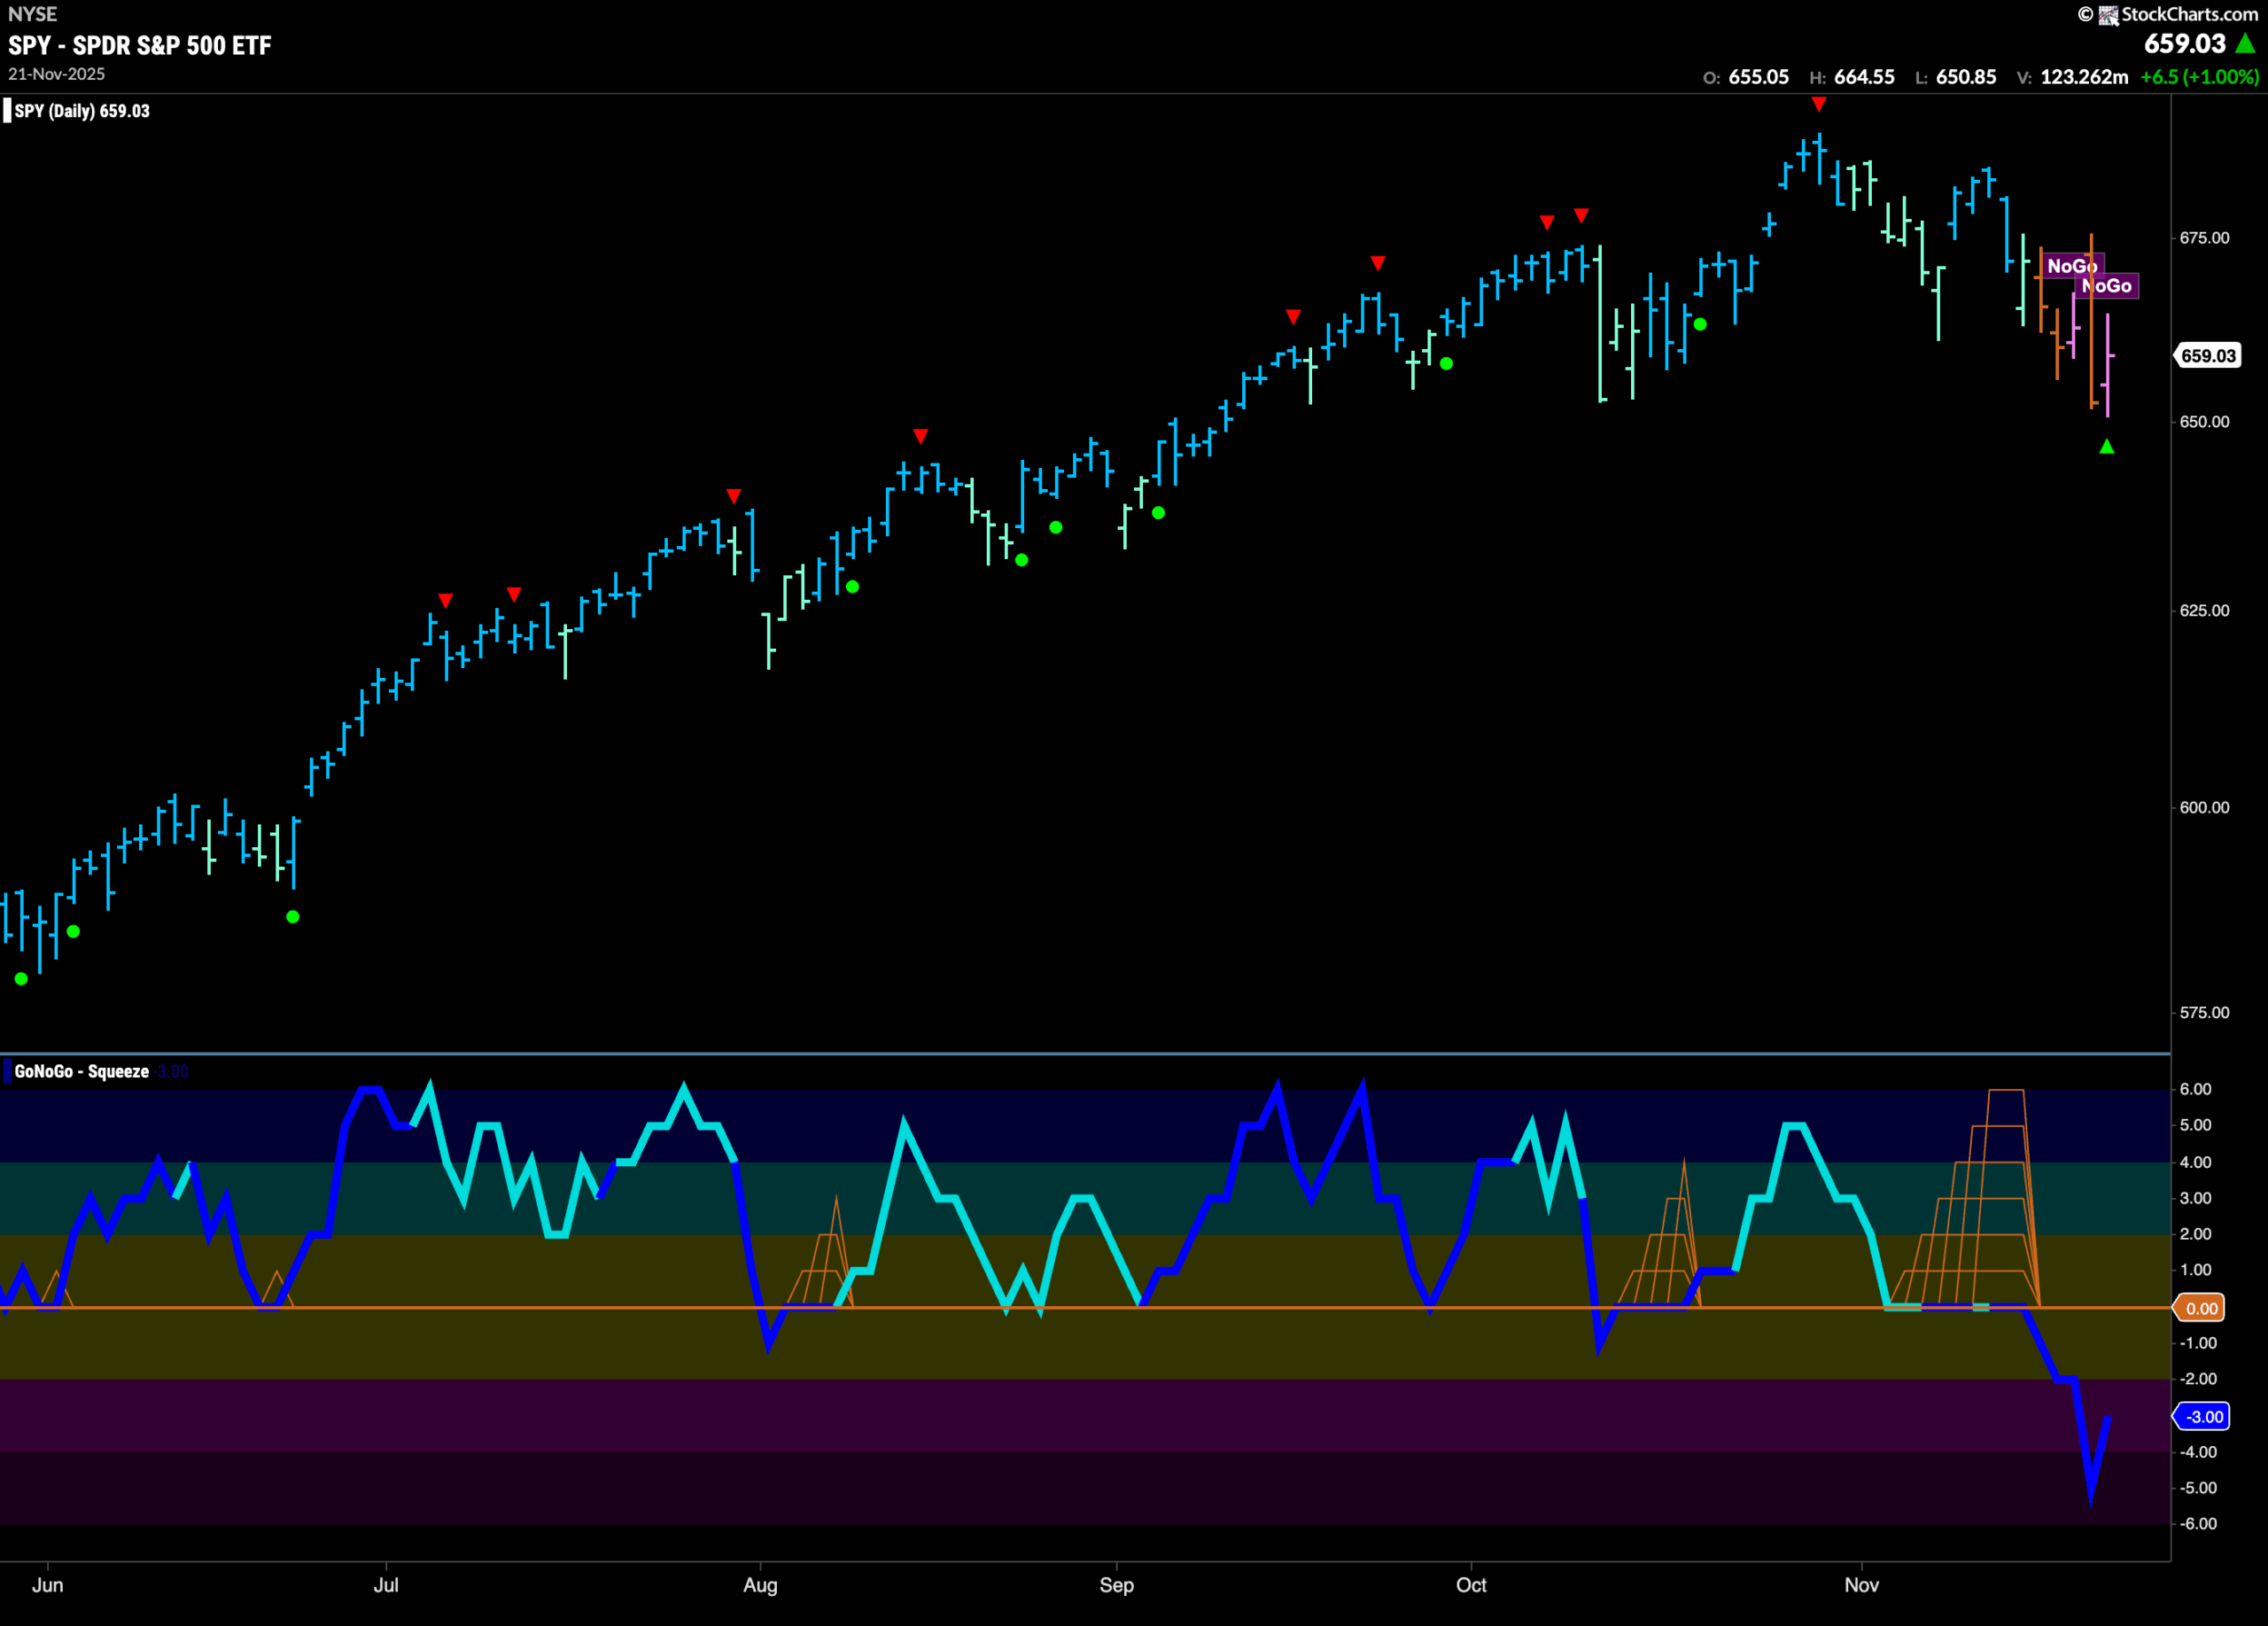
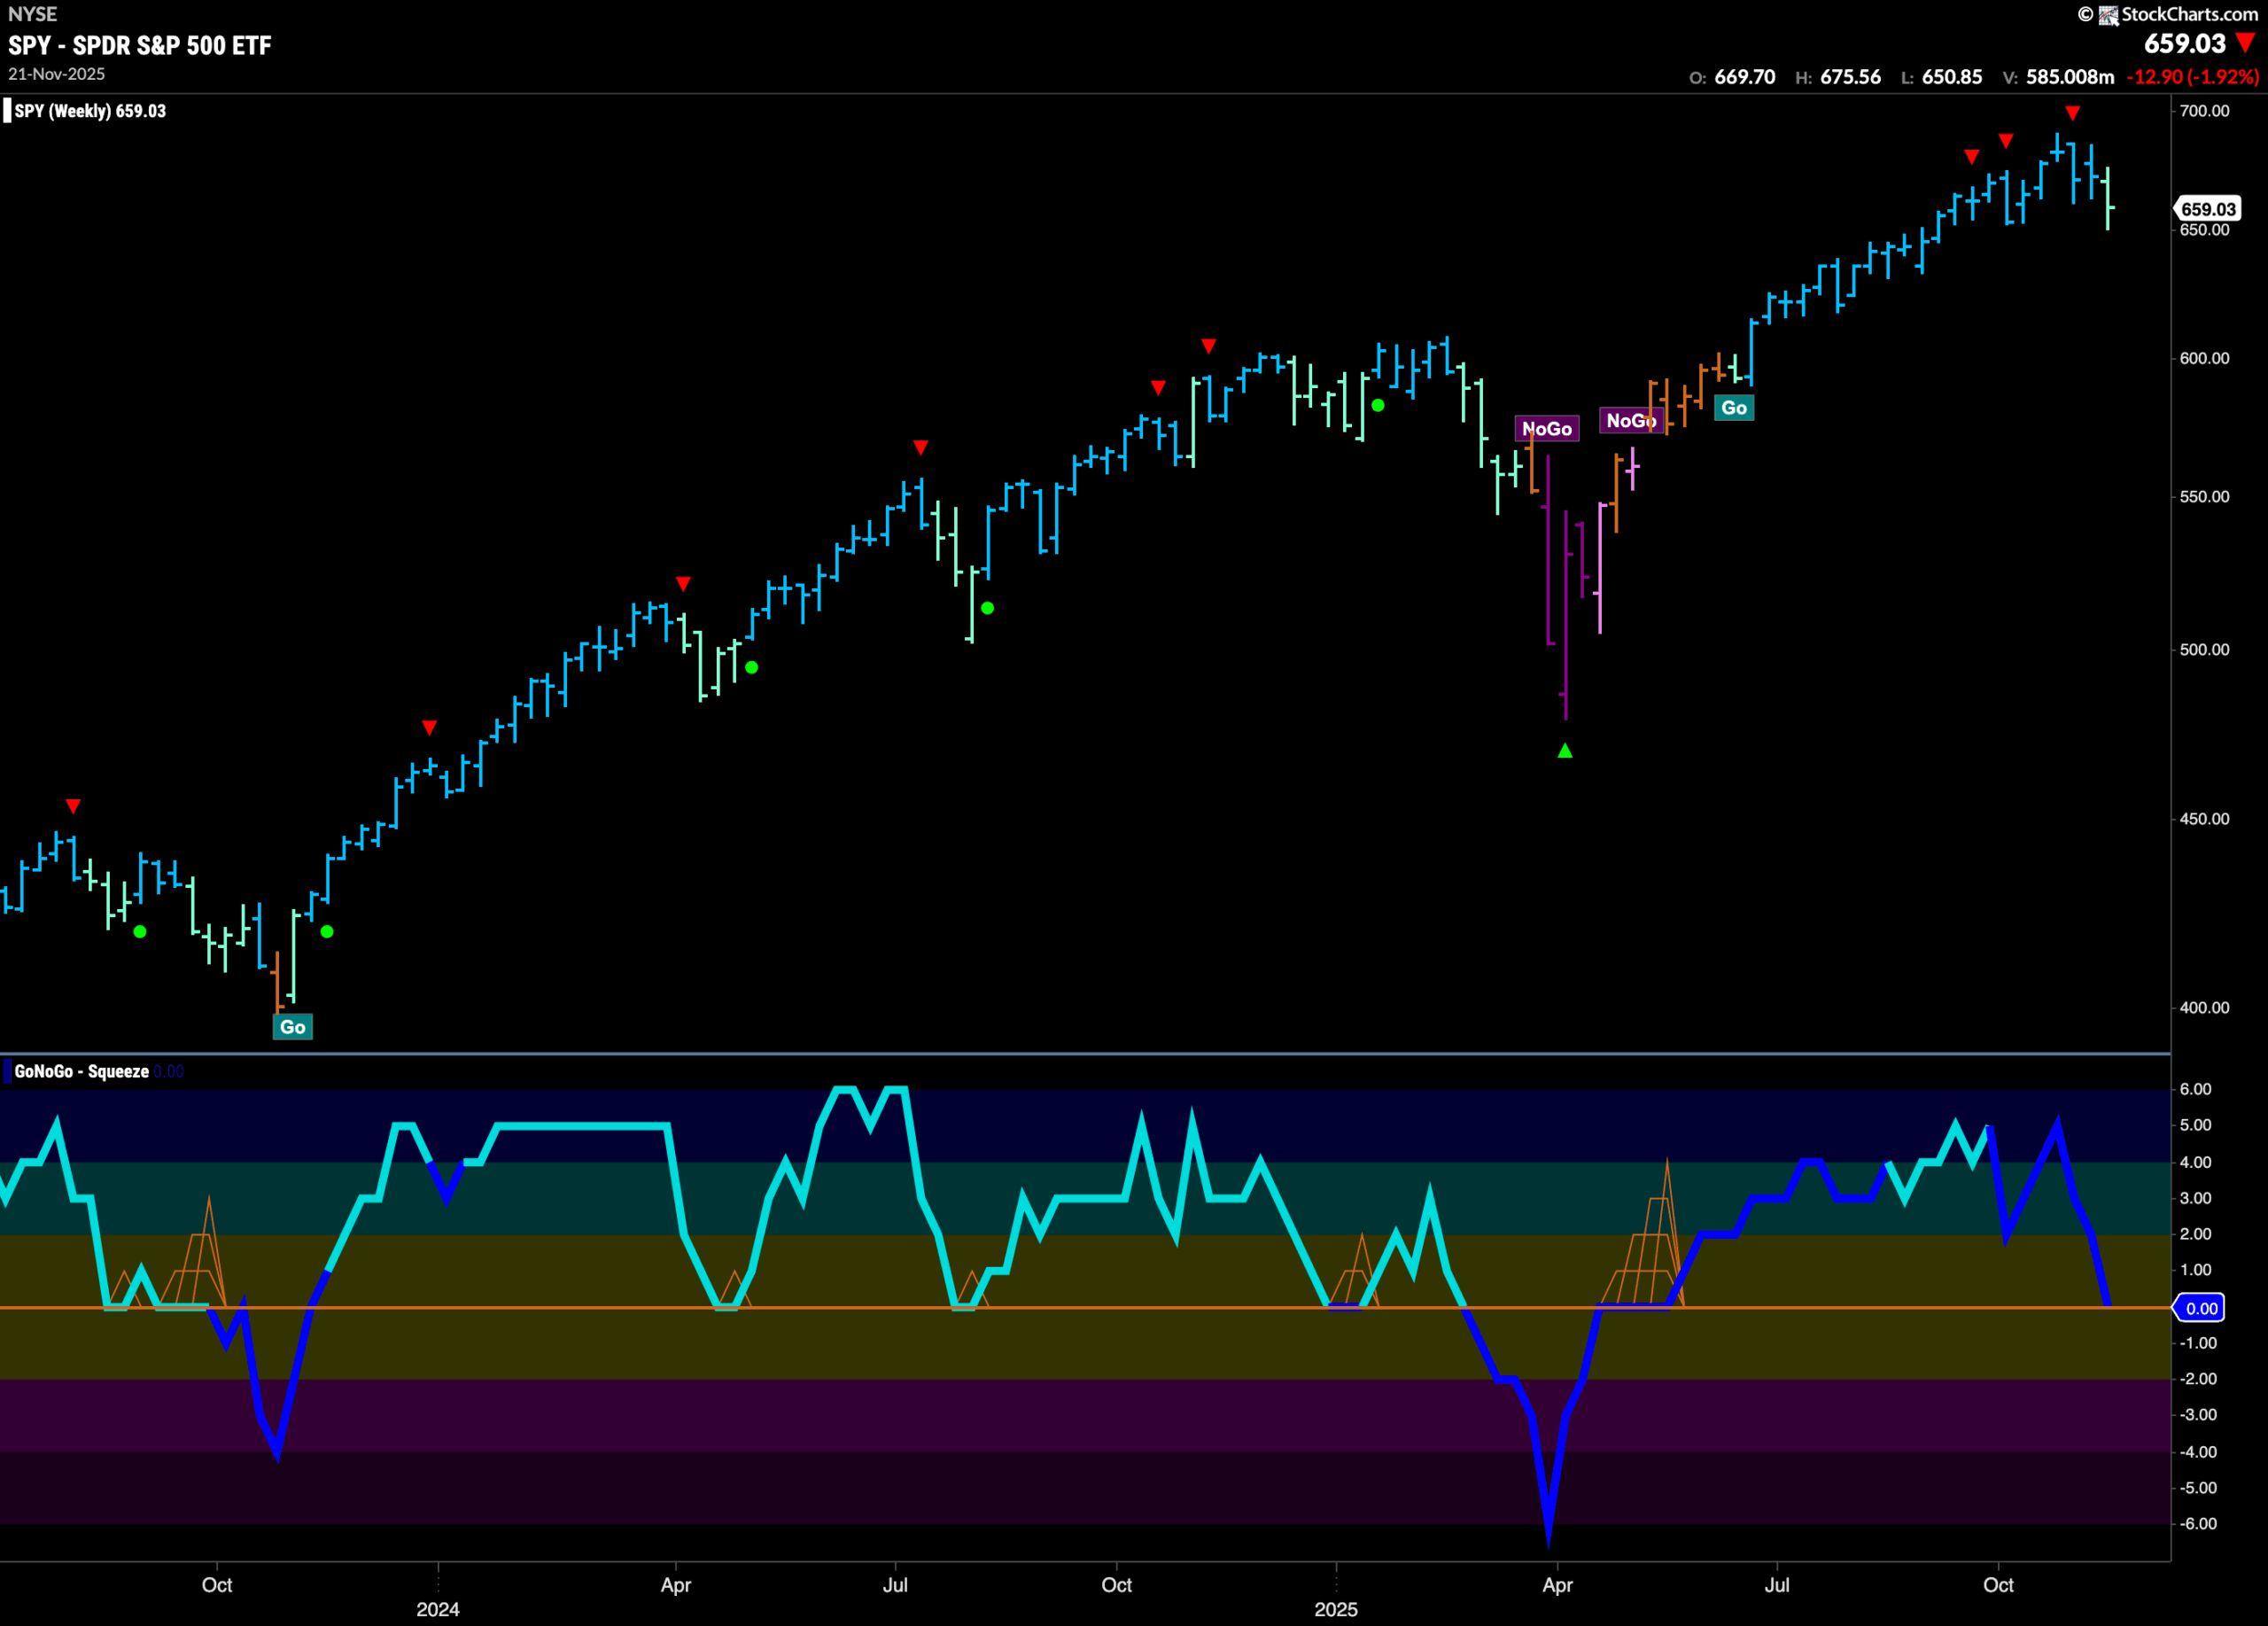
The GoNoGo chart below shows that the “Go” trend failed this past week. We saw first amber “Go Fish” bars representing market uncertainty before weak pink “NoGo” bars took over. This happens after there was a failed attempt to find support. If we look to the oscillator panel we can see that GoNoGo Oscillator failed to hold the zero line and a Max GoNoGo Squeeze was broken into negative territory on heavy volume. Now, the oscillator is at a value of -3 so no longer oversold.
The weekly chart shows that for the first time in months the “Go” trend on the longer time frame has shown some weakness. This comes as GoNoGo Oscillator crashes to test the zero line from above. It will be important for momentum to find support at that level for the “Go” trend to remain healthy. If GoNoGo Oscillator can bounce back into positive territory that would be healthy for the “Go” trend. A break into negative numbers could indicate a deeper correction.
Treasury Rates Struggle to Maintain Trend
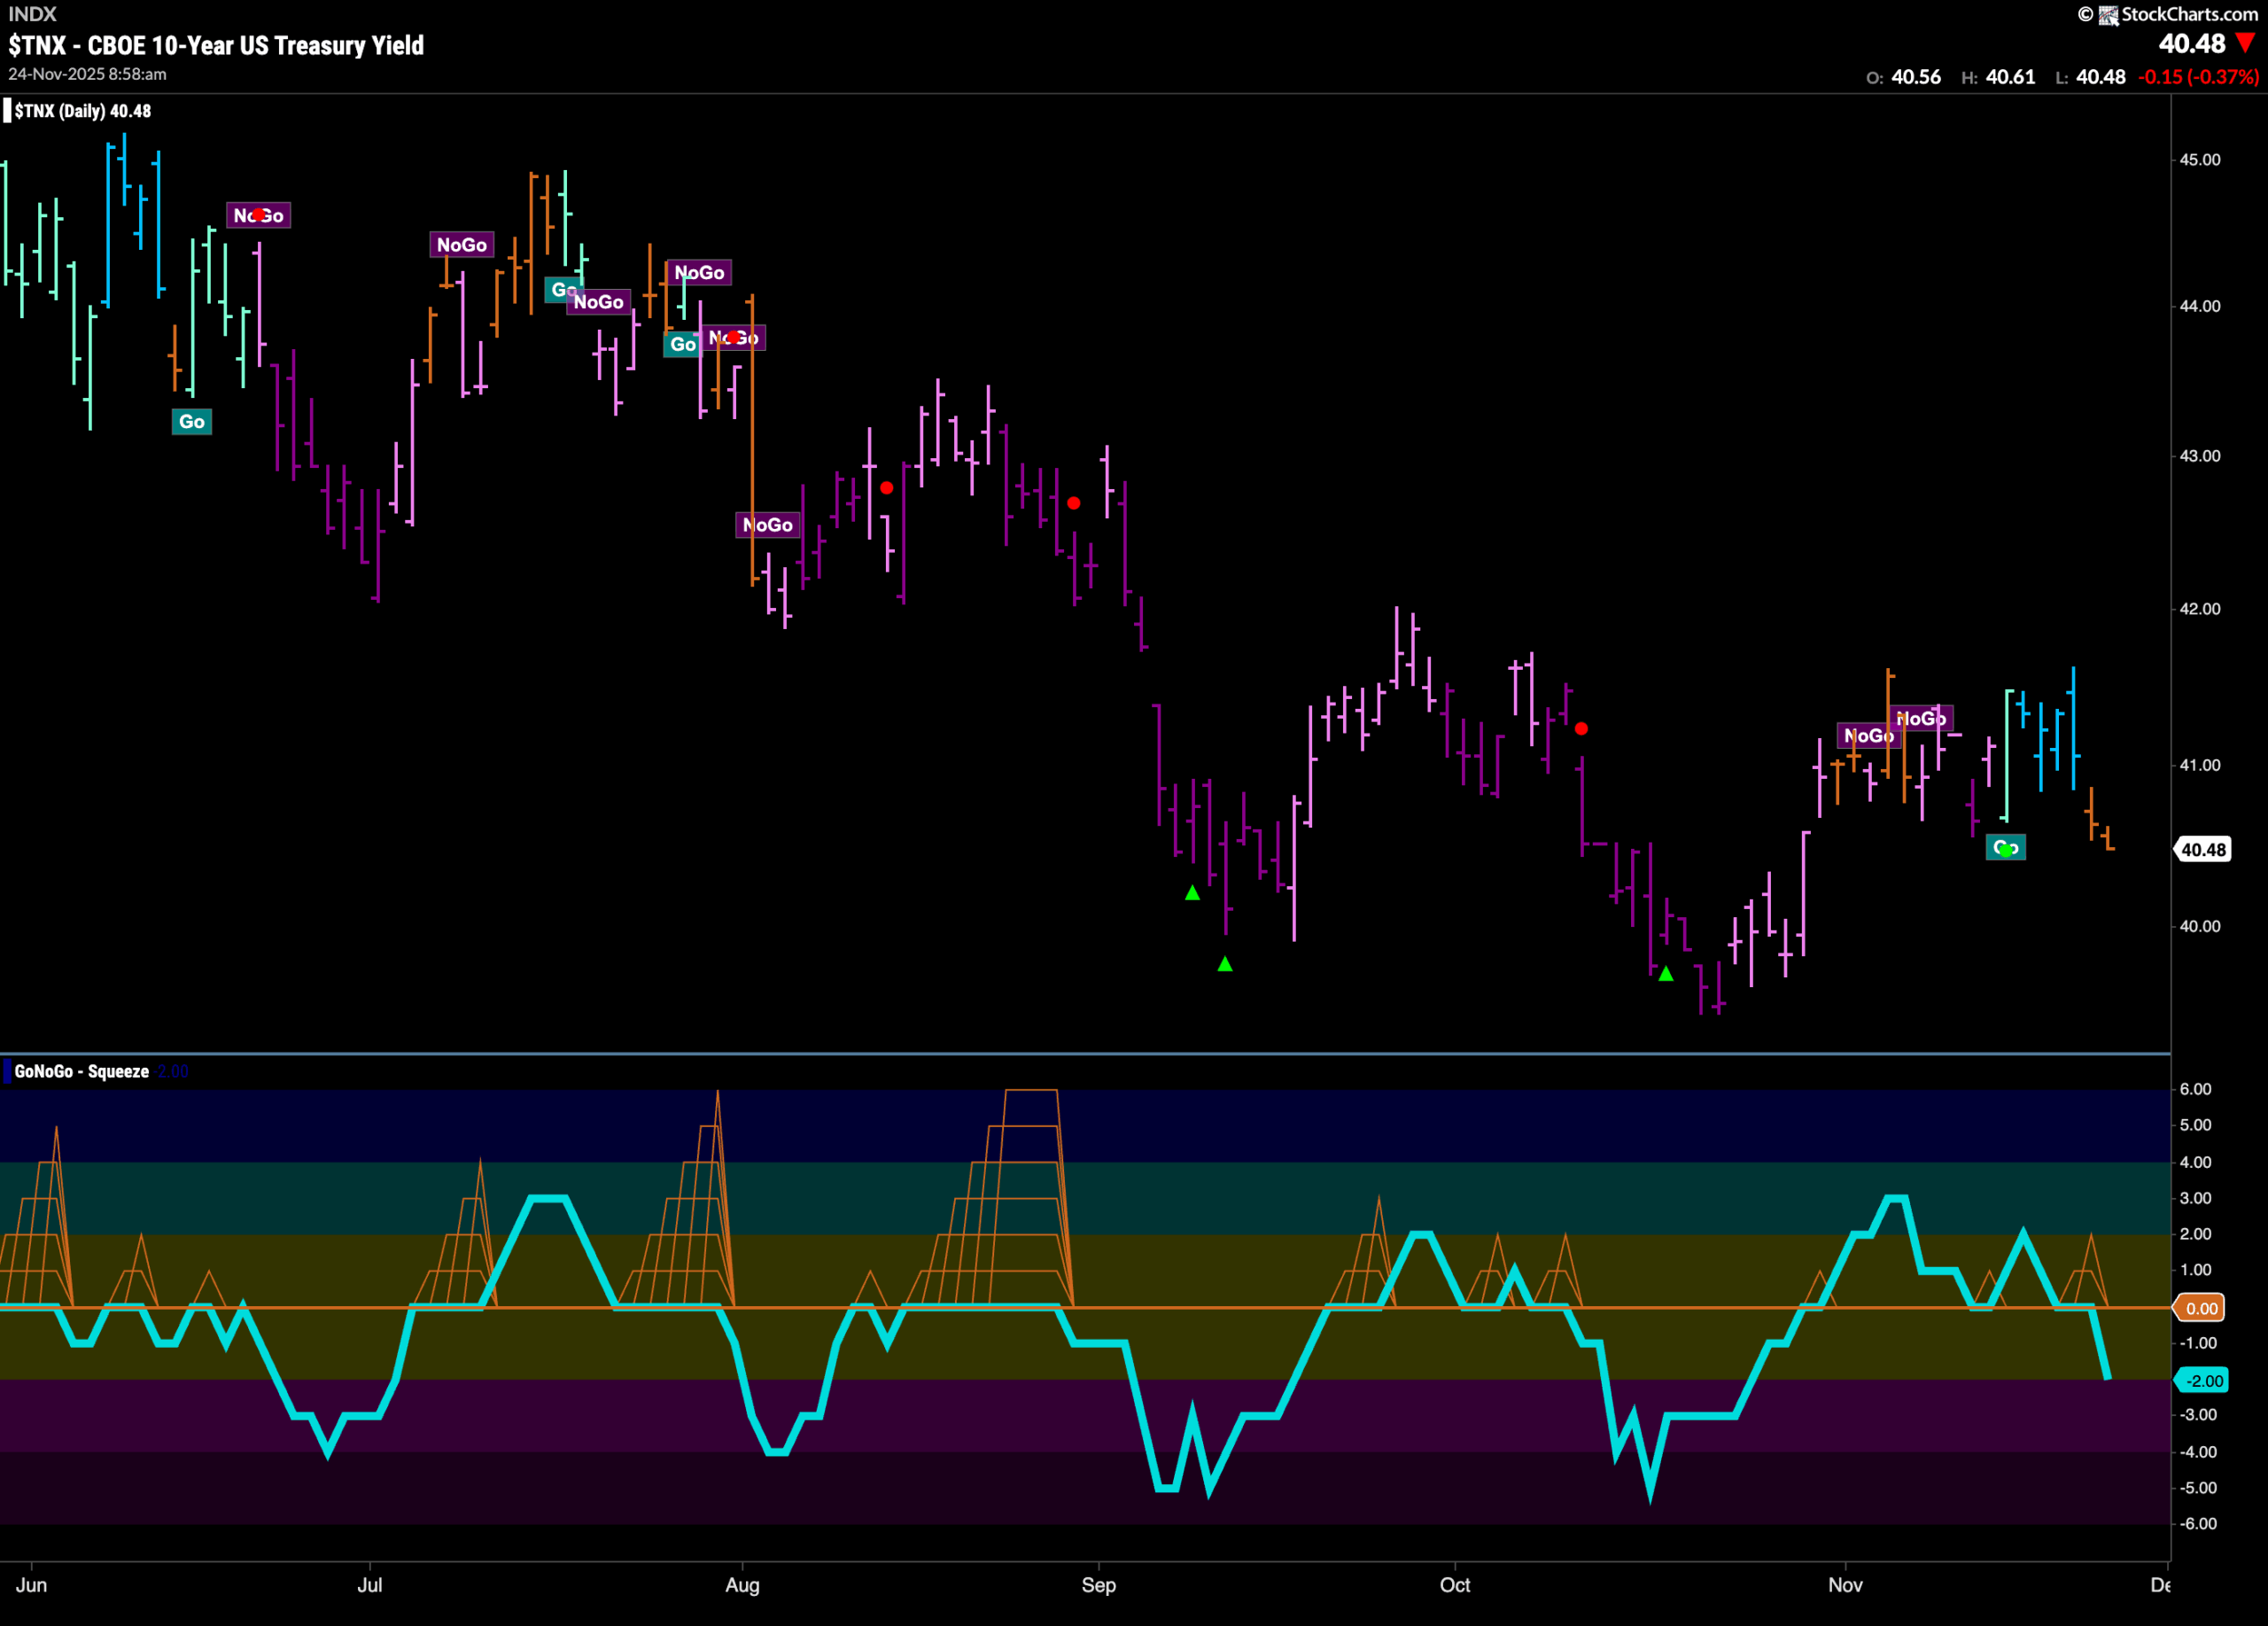
GoNoGo Trend paints amber “Go Fish” bars after a brief attempt to establish a “Go” trend. We can see that momentum failed as well if we turn our attention to the lower panel. GoNoGo Oscillator is now firmly in negative territory after having broken through the zero line at the second try. This week will be important for rates as GoNoGo Trend tries to determine trend.
Dollar in Strong “Go” Trend at New High
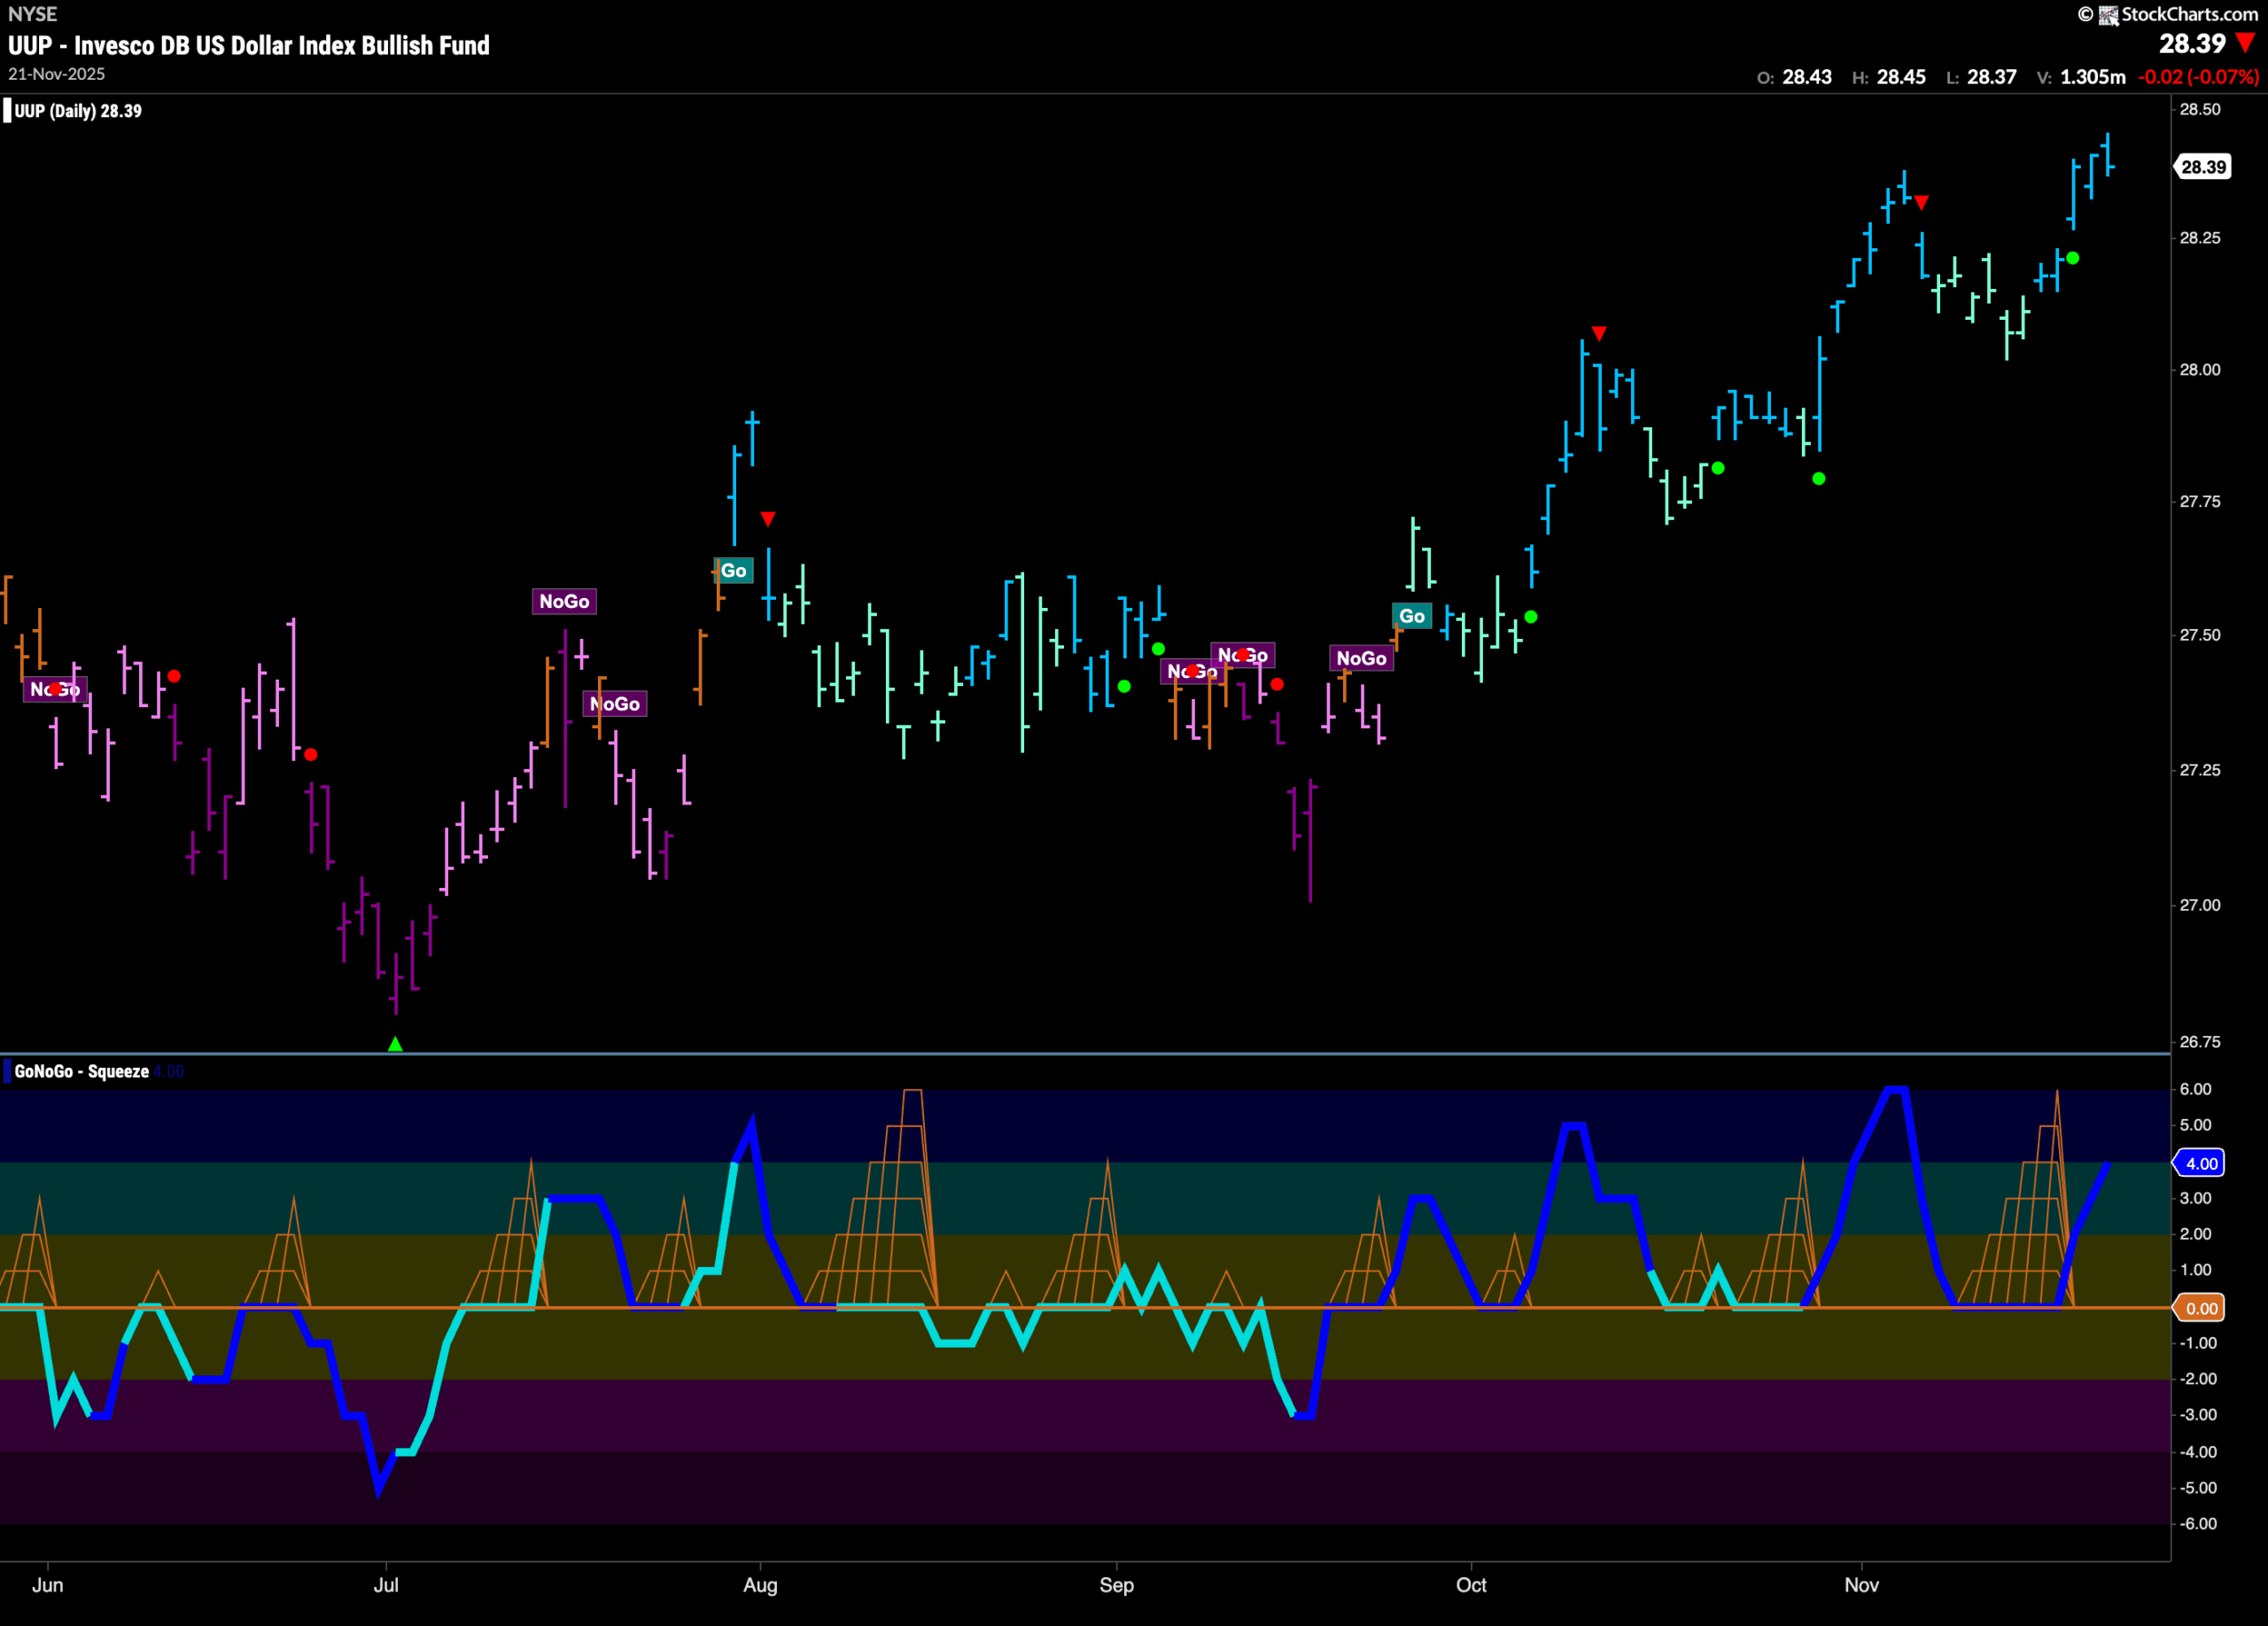
The chart below shows that the dollar remains in a “Go” trend. We saw price support at October’s high and GoNoGo Oscillator found support after breaking out of a Max GoNoGo Squeeze into positive territory. Now, we see price painting strong blue “Go” bars at new highs and GoNoGo Oscillator is in positive territory but not yet overbought at a value of 4 on heavy volume.
Oil Remains in Shaky “NoGo” Trend
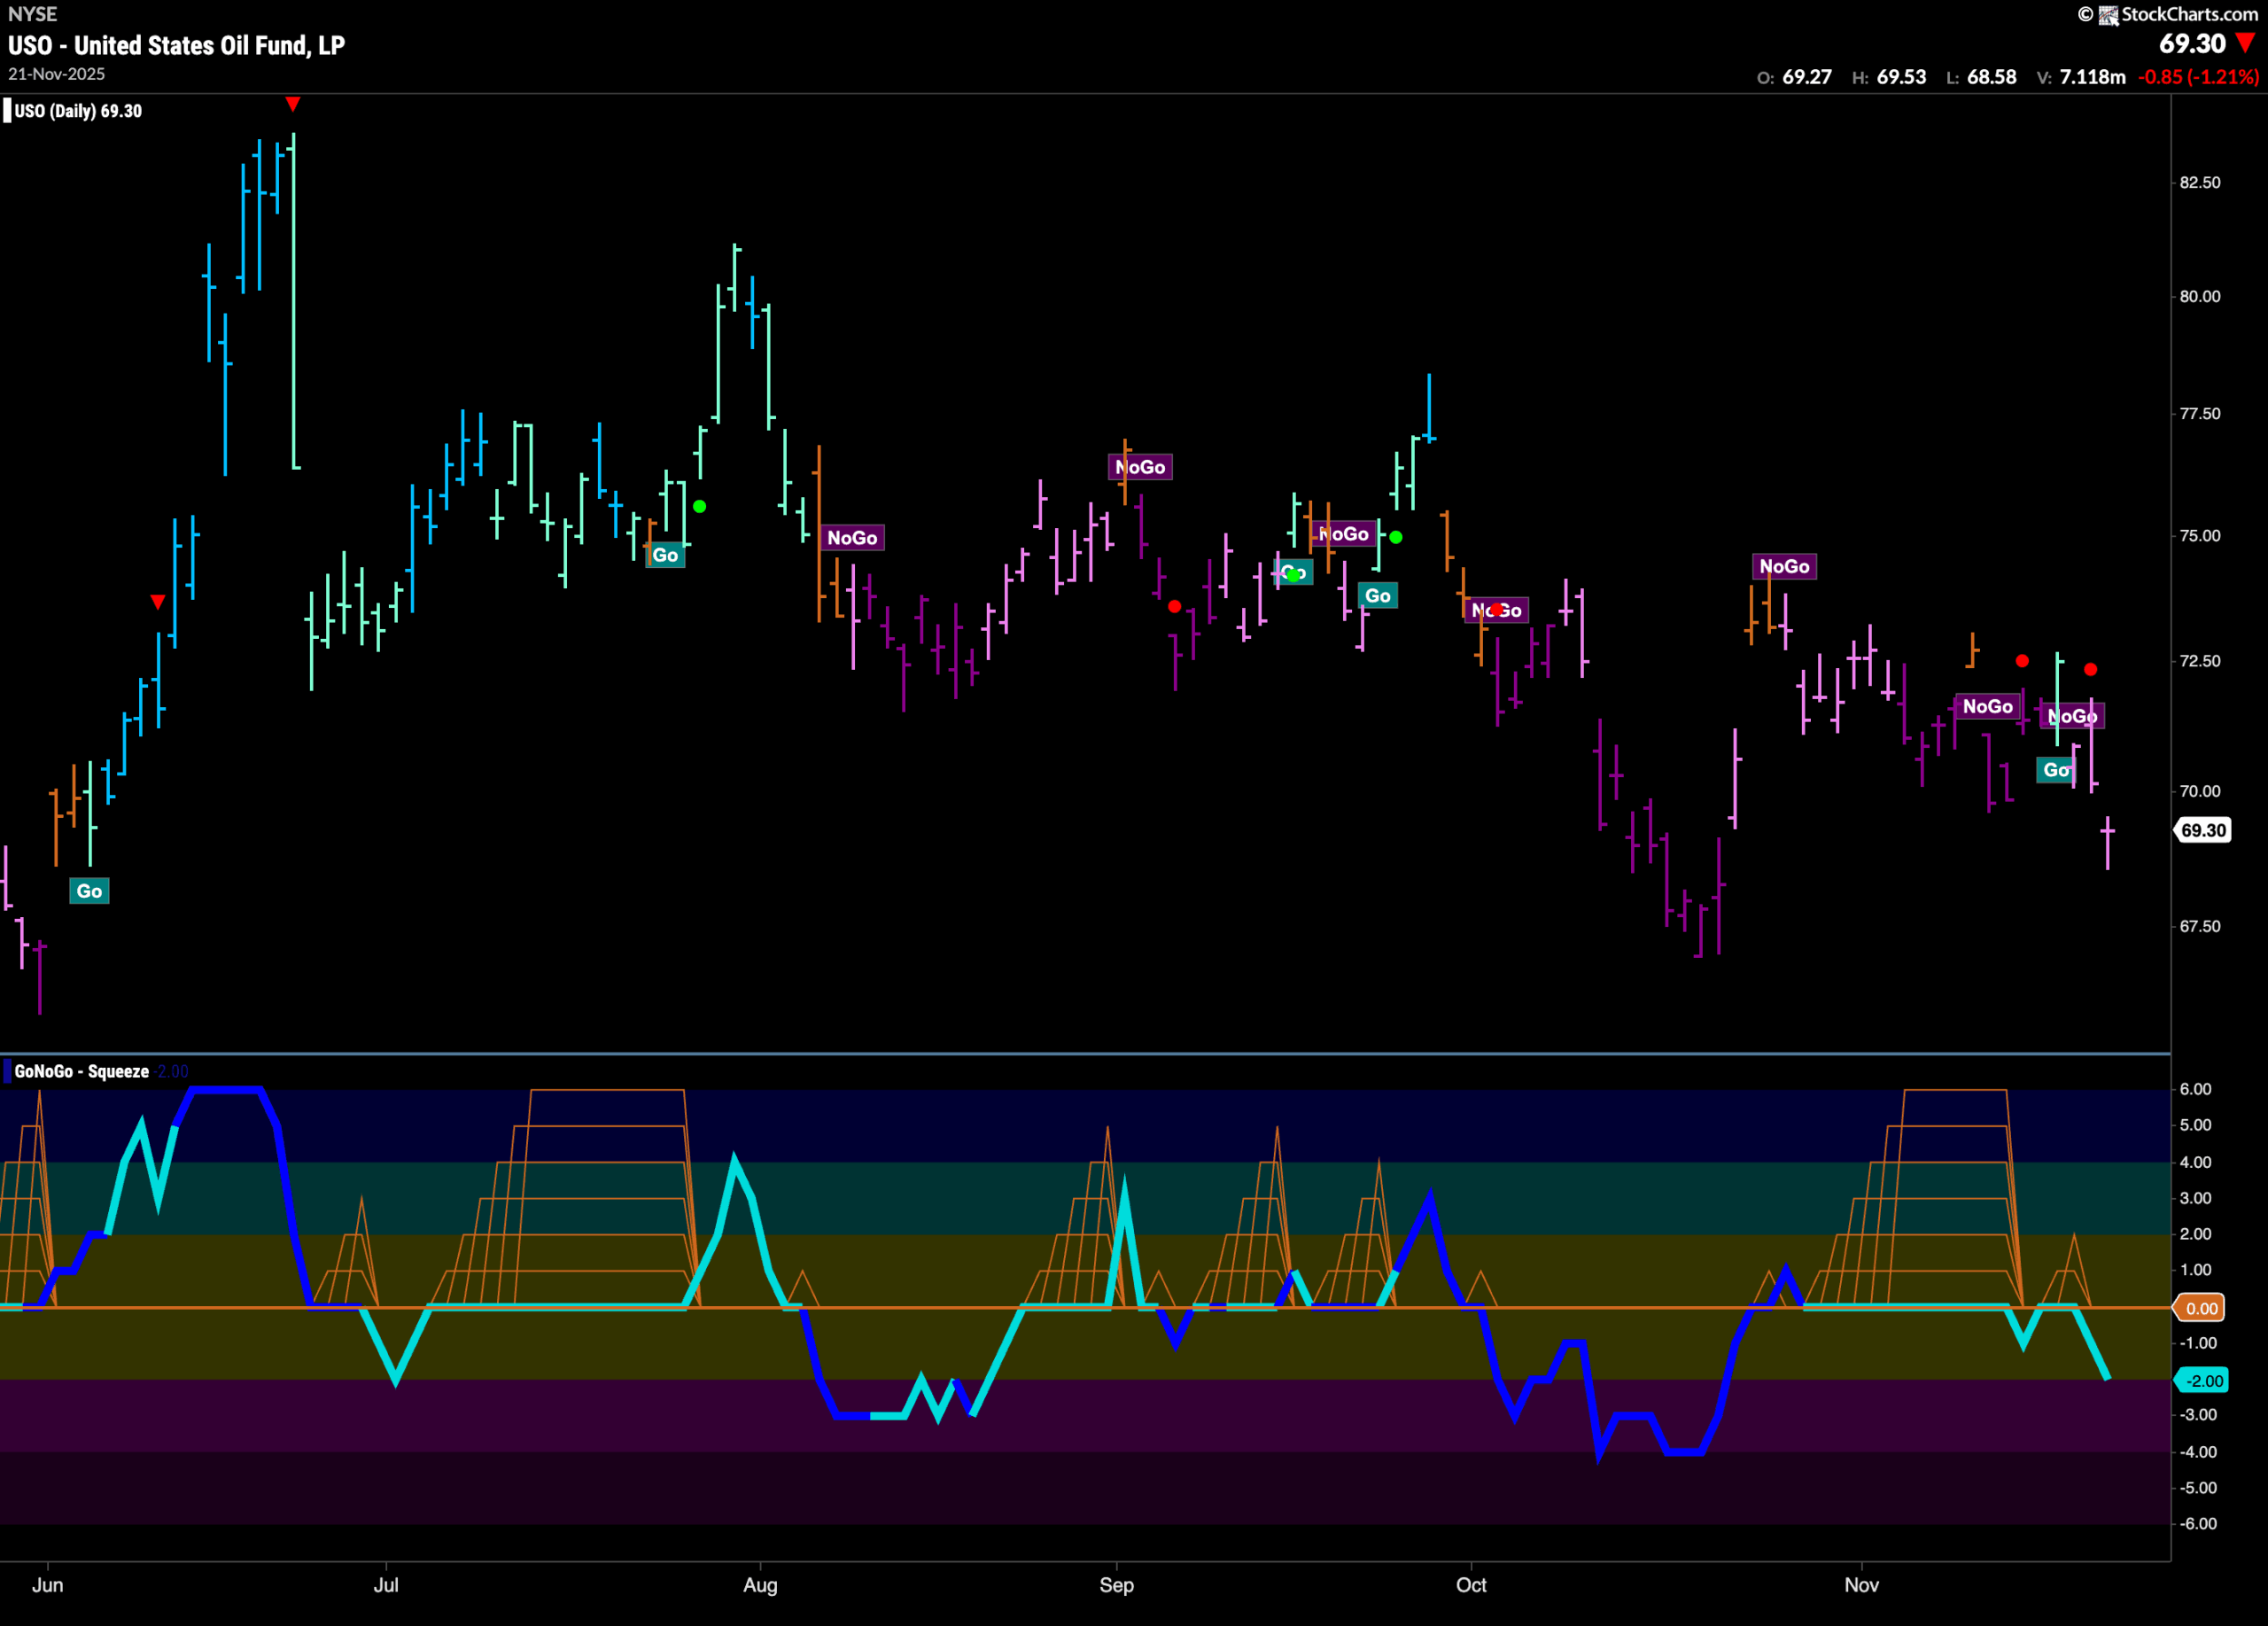
GoNoGo Trend shows that the “NoGo” trend returned after a single aqua “Go” bar. The trend is weak, with the indicator painting pink bars as price falls toward prior lows. GoNoGo Oscillator has decisively broken out of a Max GoNoGo Squeeze and is now falling further into negative territory after having retested the zero line from below. We will look to see if price falls further to challenge for a new lower low in the coming days.
Gold “Go” Trend Falters This Week
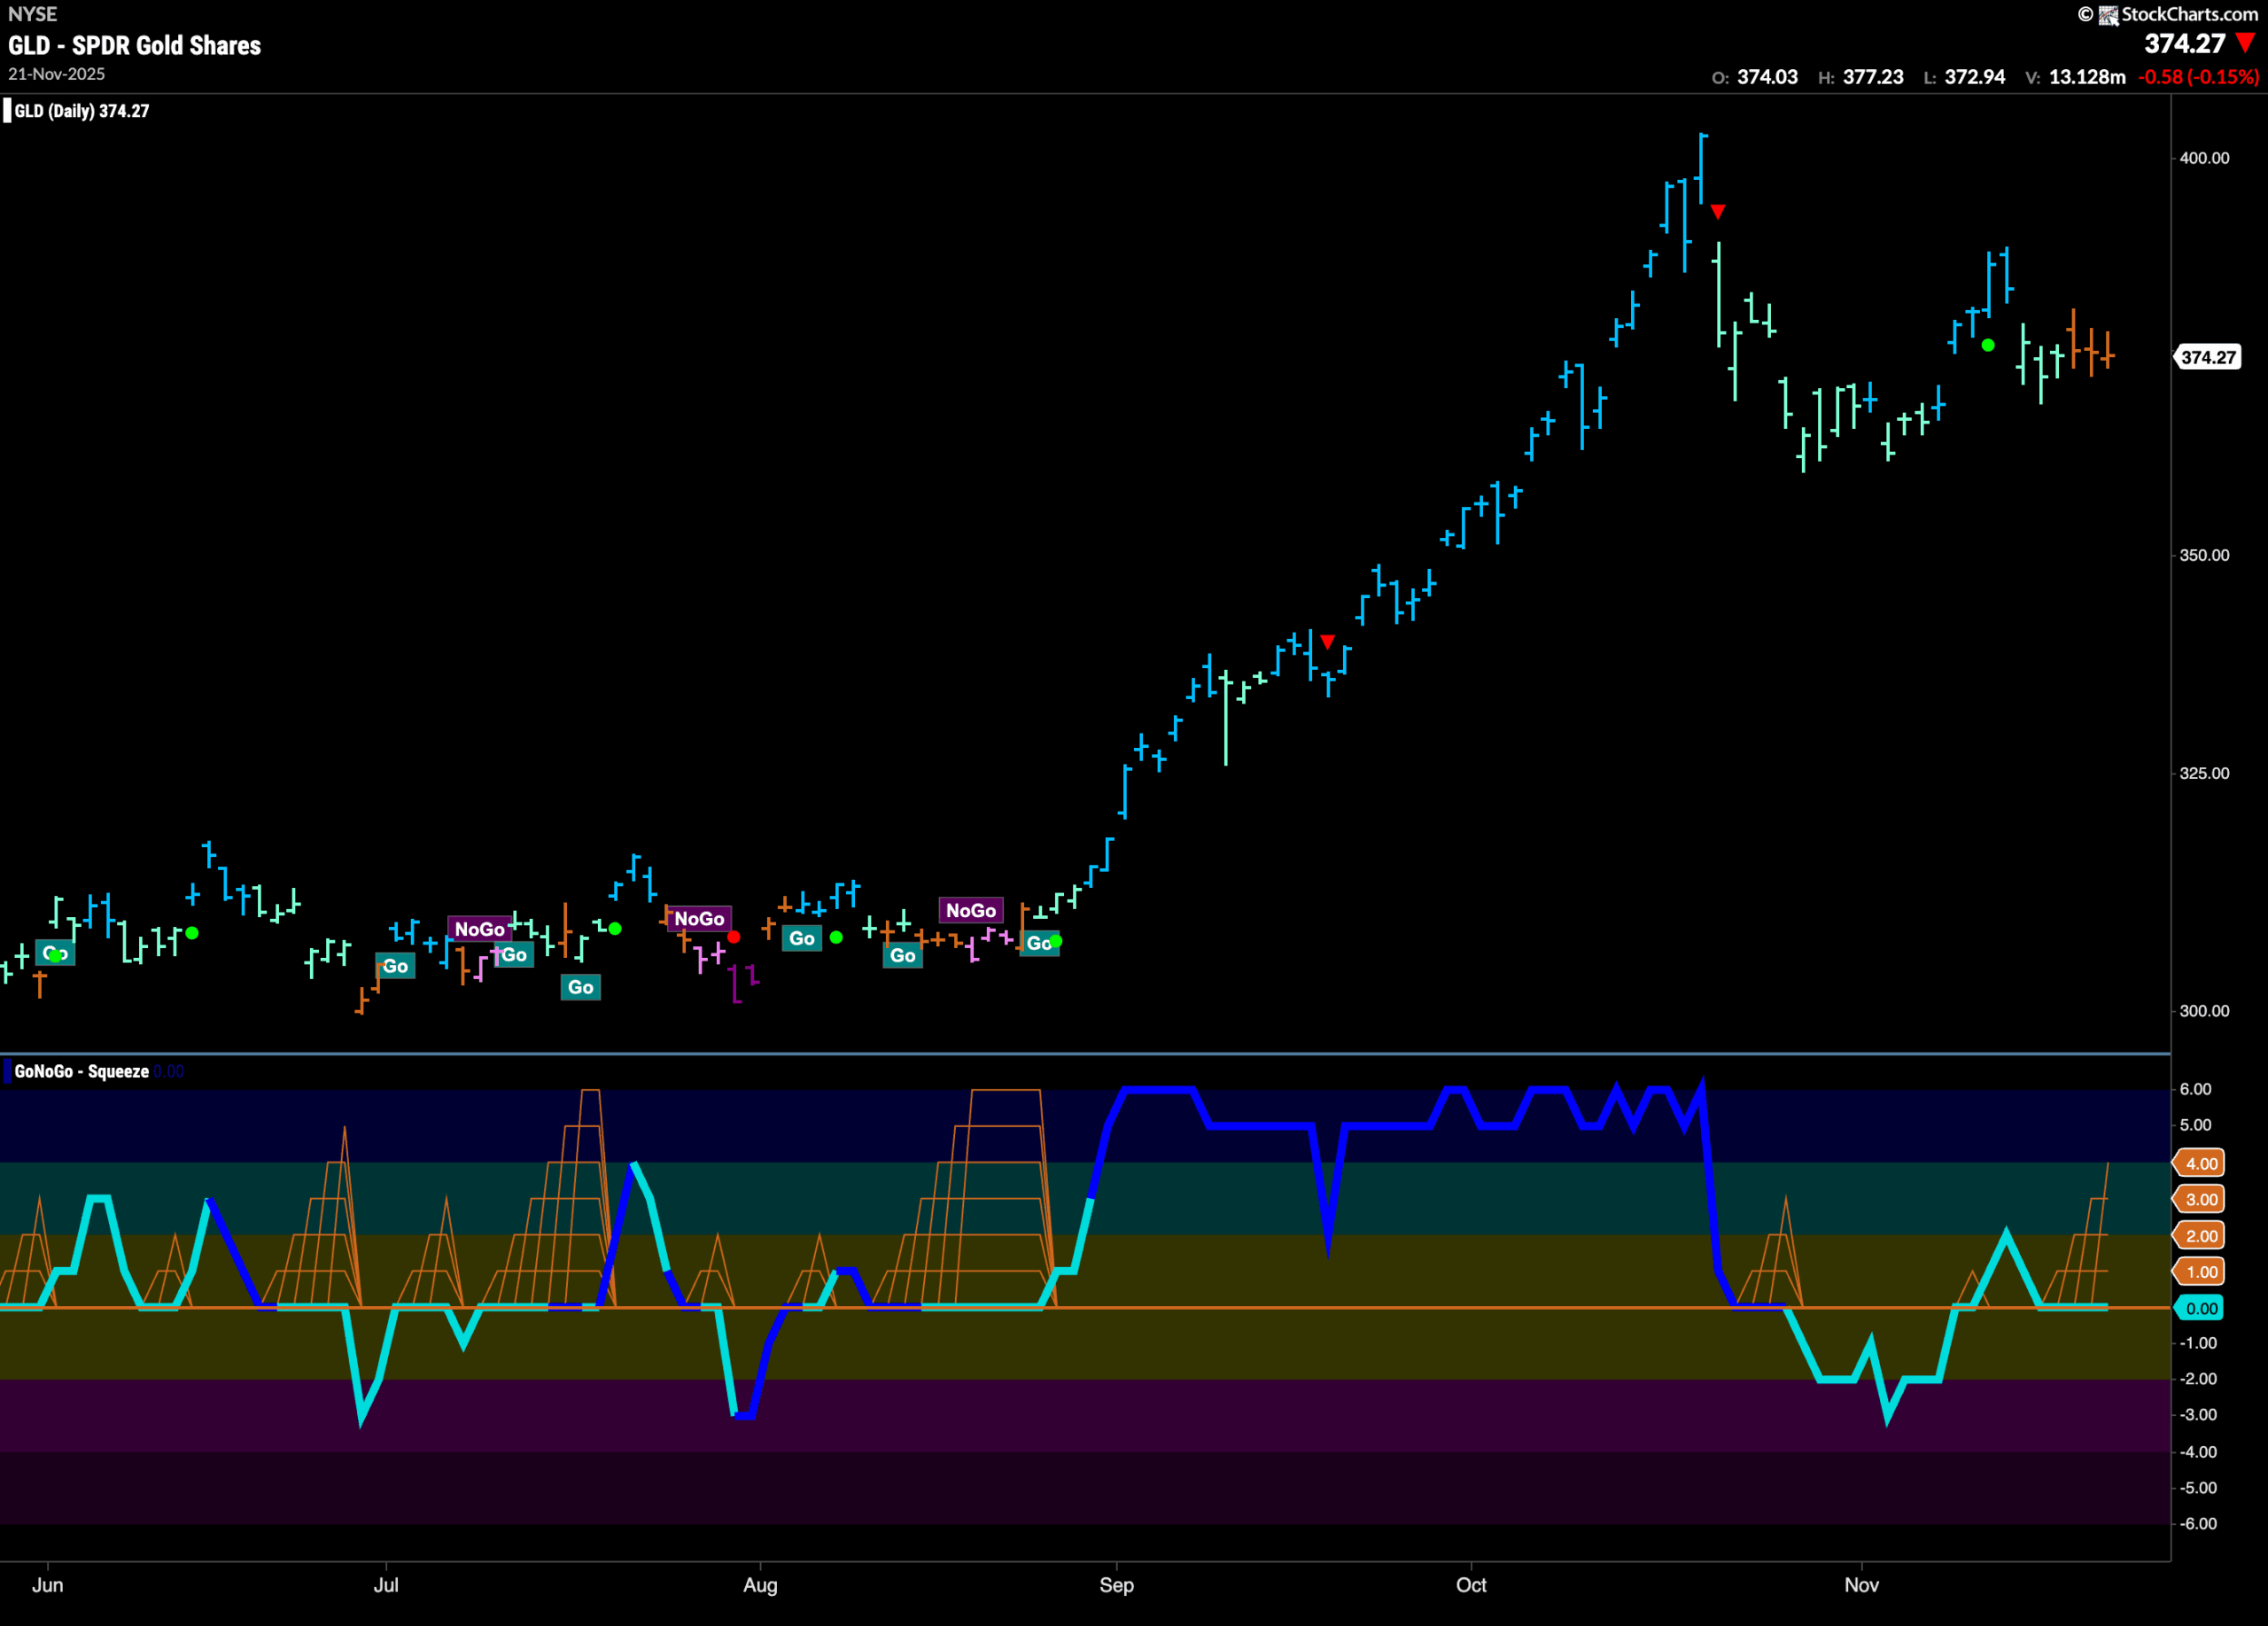
The chart below shows that the “Go” trend has fizzled out this past week. We see consecutive amber “Go Fish” bars as the market shows uncertainty as price moves sideways. GoNoGo Oscillator is testing the zero line and we see the beginnings of a GoNoGo Squeeze, reflecting the virtual tug of war between bulls and bears at this level. It will be important to see in which direction the GoNoGo Squeeze is broken as that will help us determine price’s next direction.
Sector RelMap
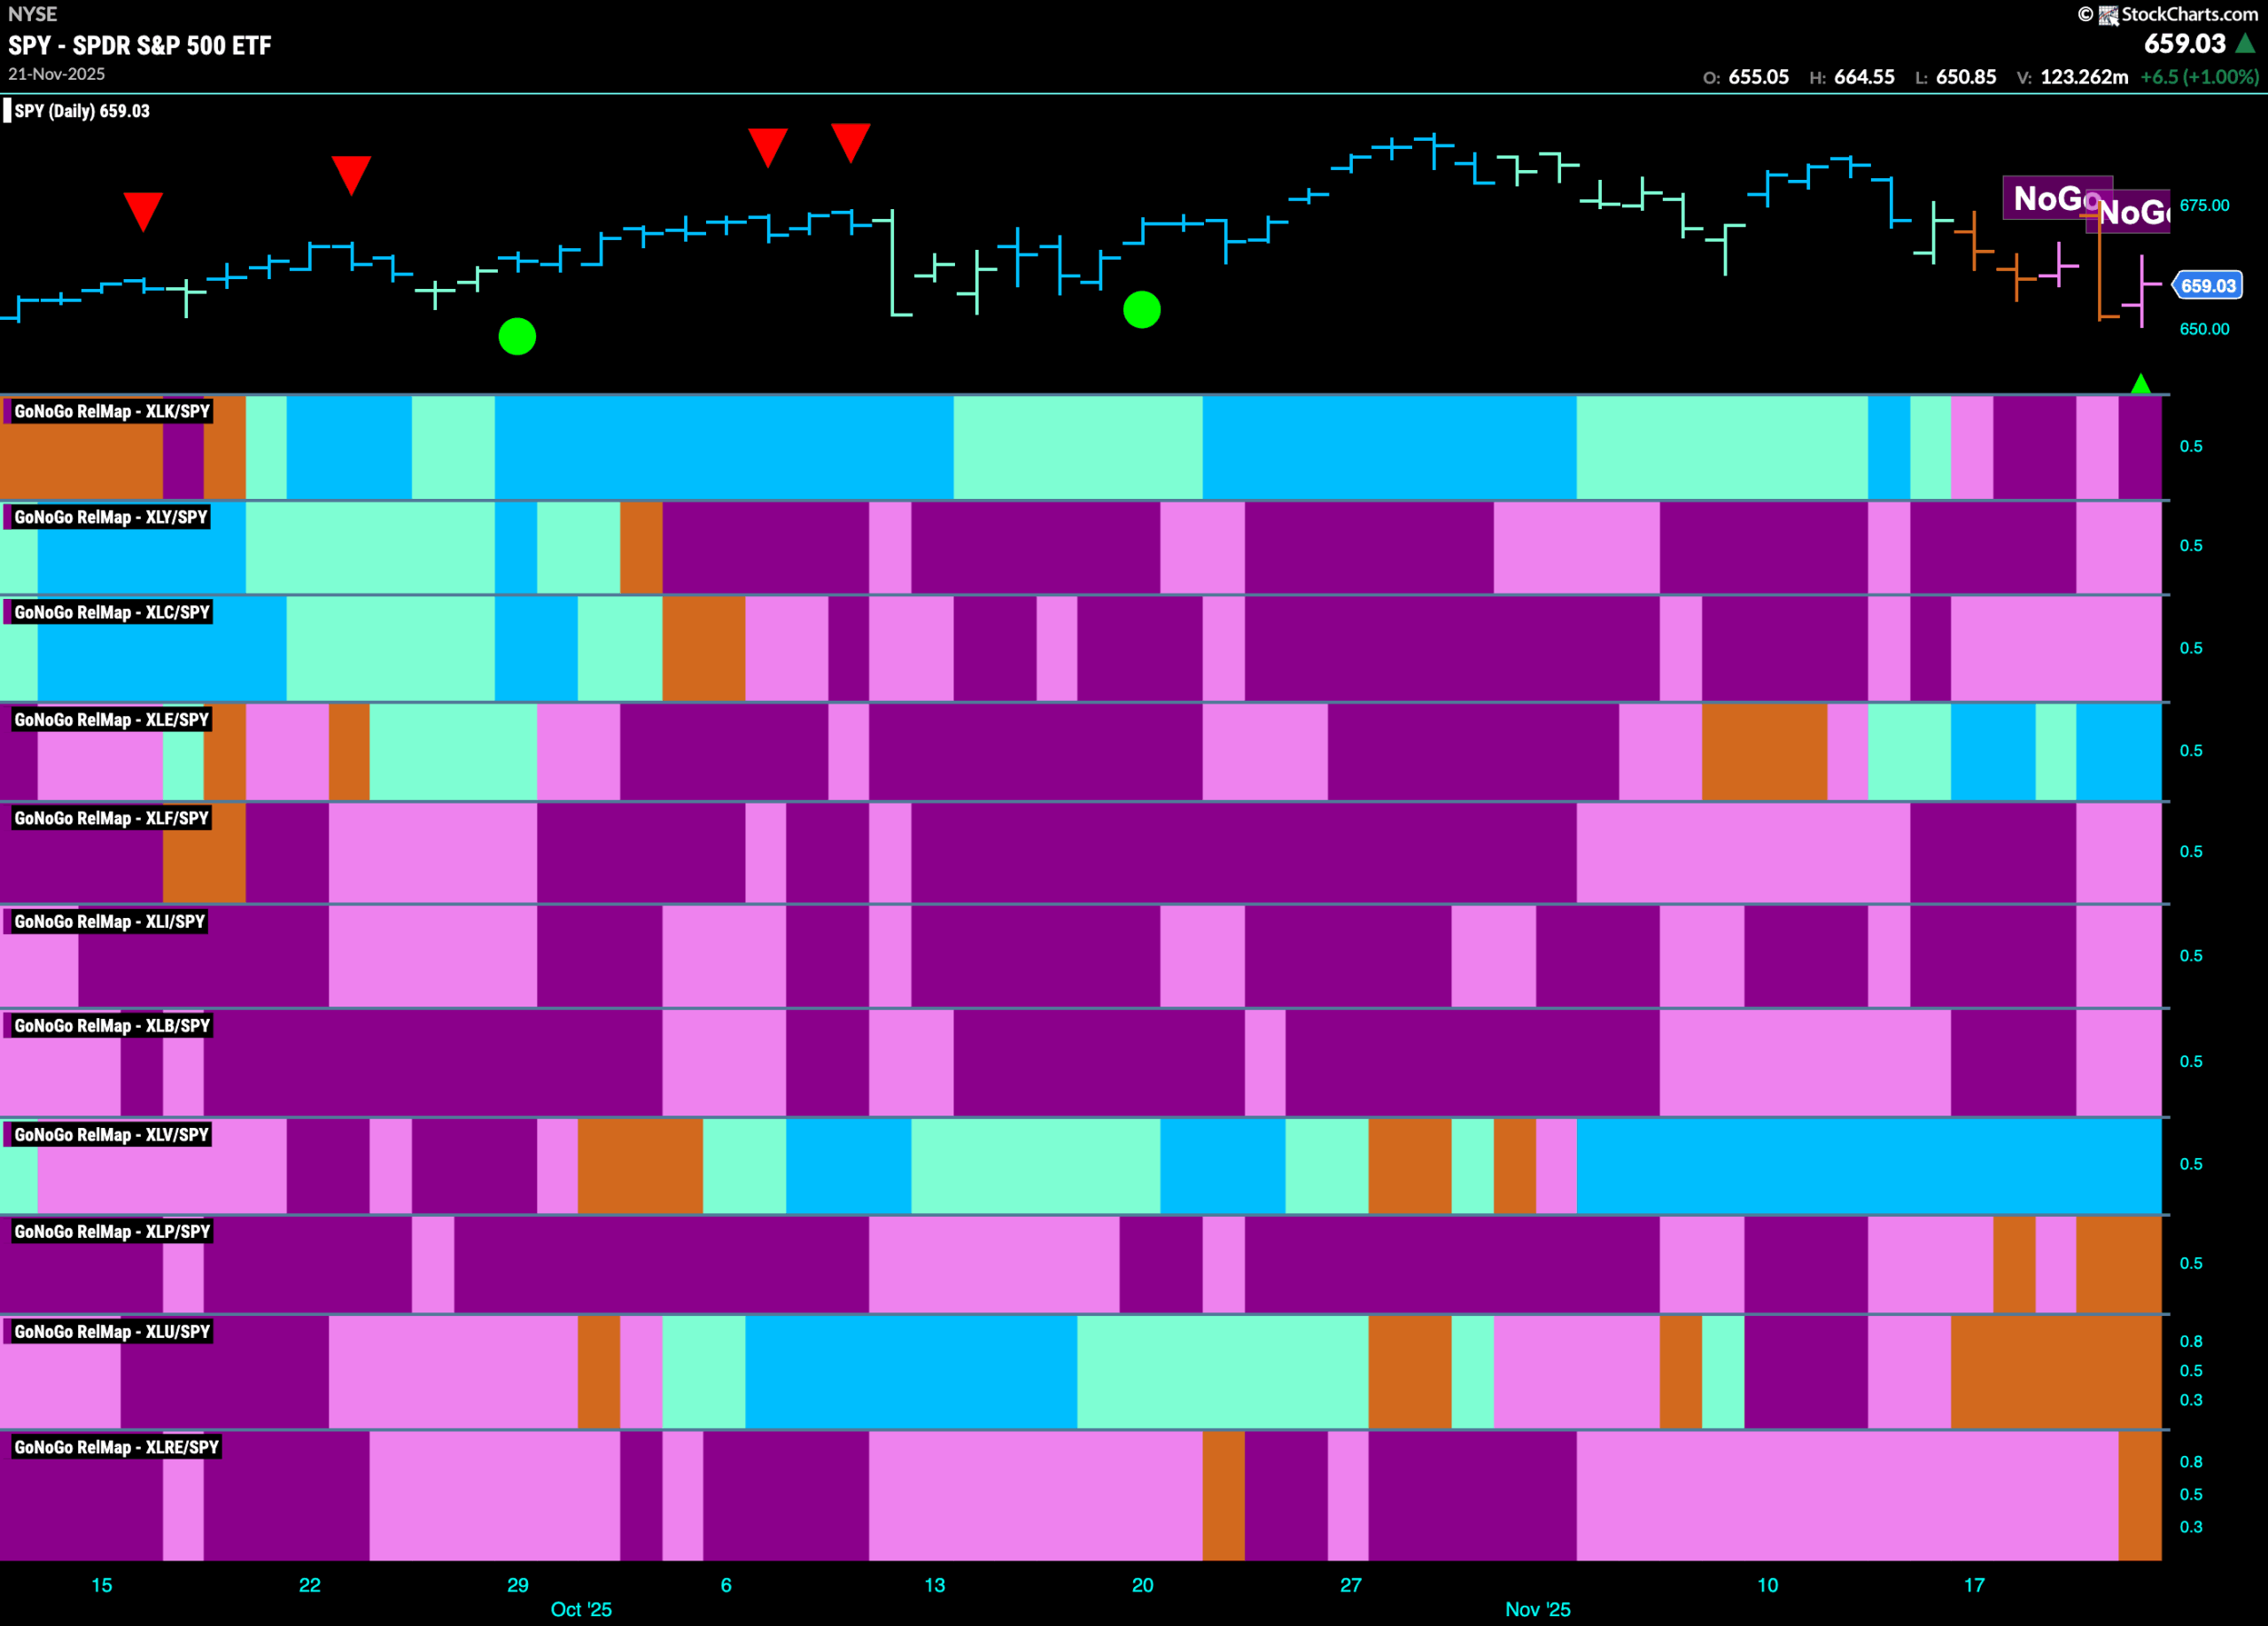
Below is the GoNoGo Sector RelMap. This GoNoGo RelMap applies the GoNoGo Trend to the relative strength ratios of the sectors to the base index. With this view we can get a sense of the relative out performance and relative underperformance of the sectors. 2 sectors are in relative “Go” trends. $XLE, and $XLV are painting relative “Go” bars.
Energy Sub-Group RelMap
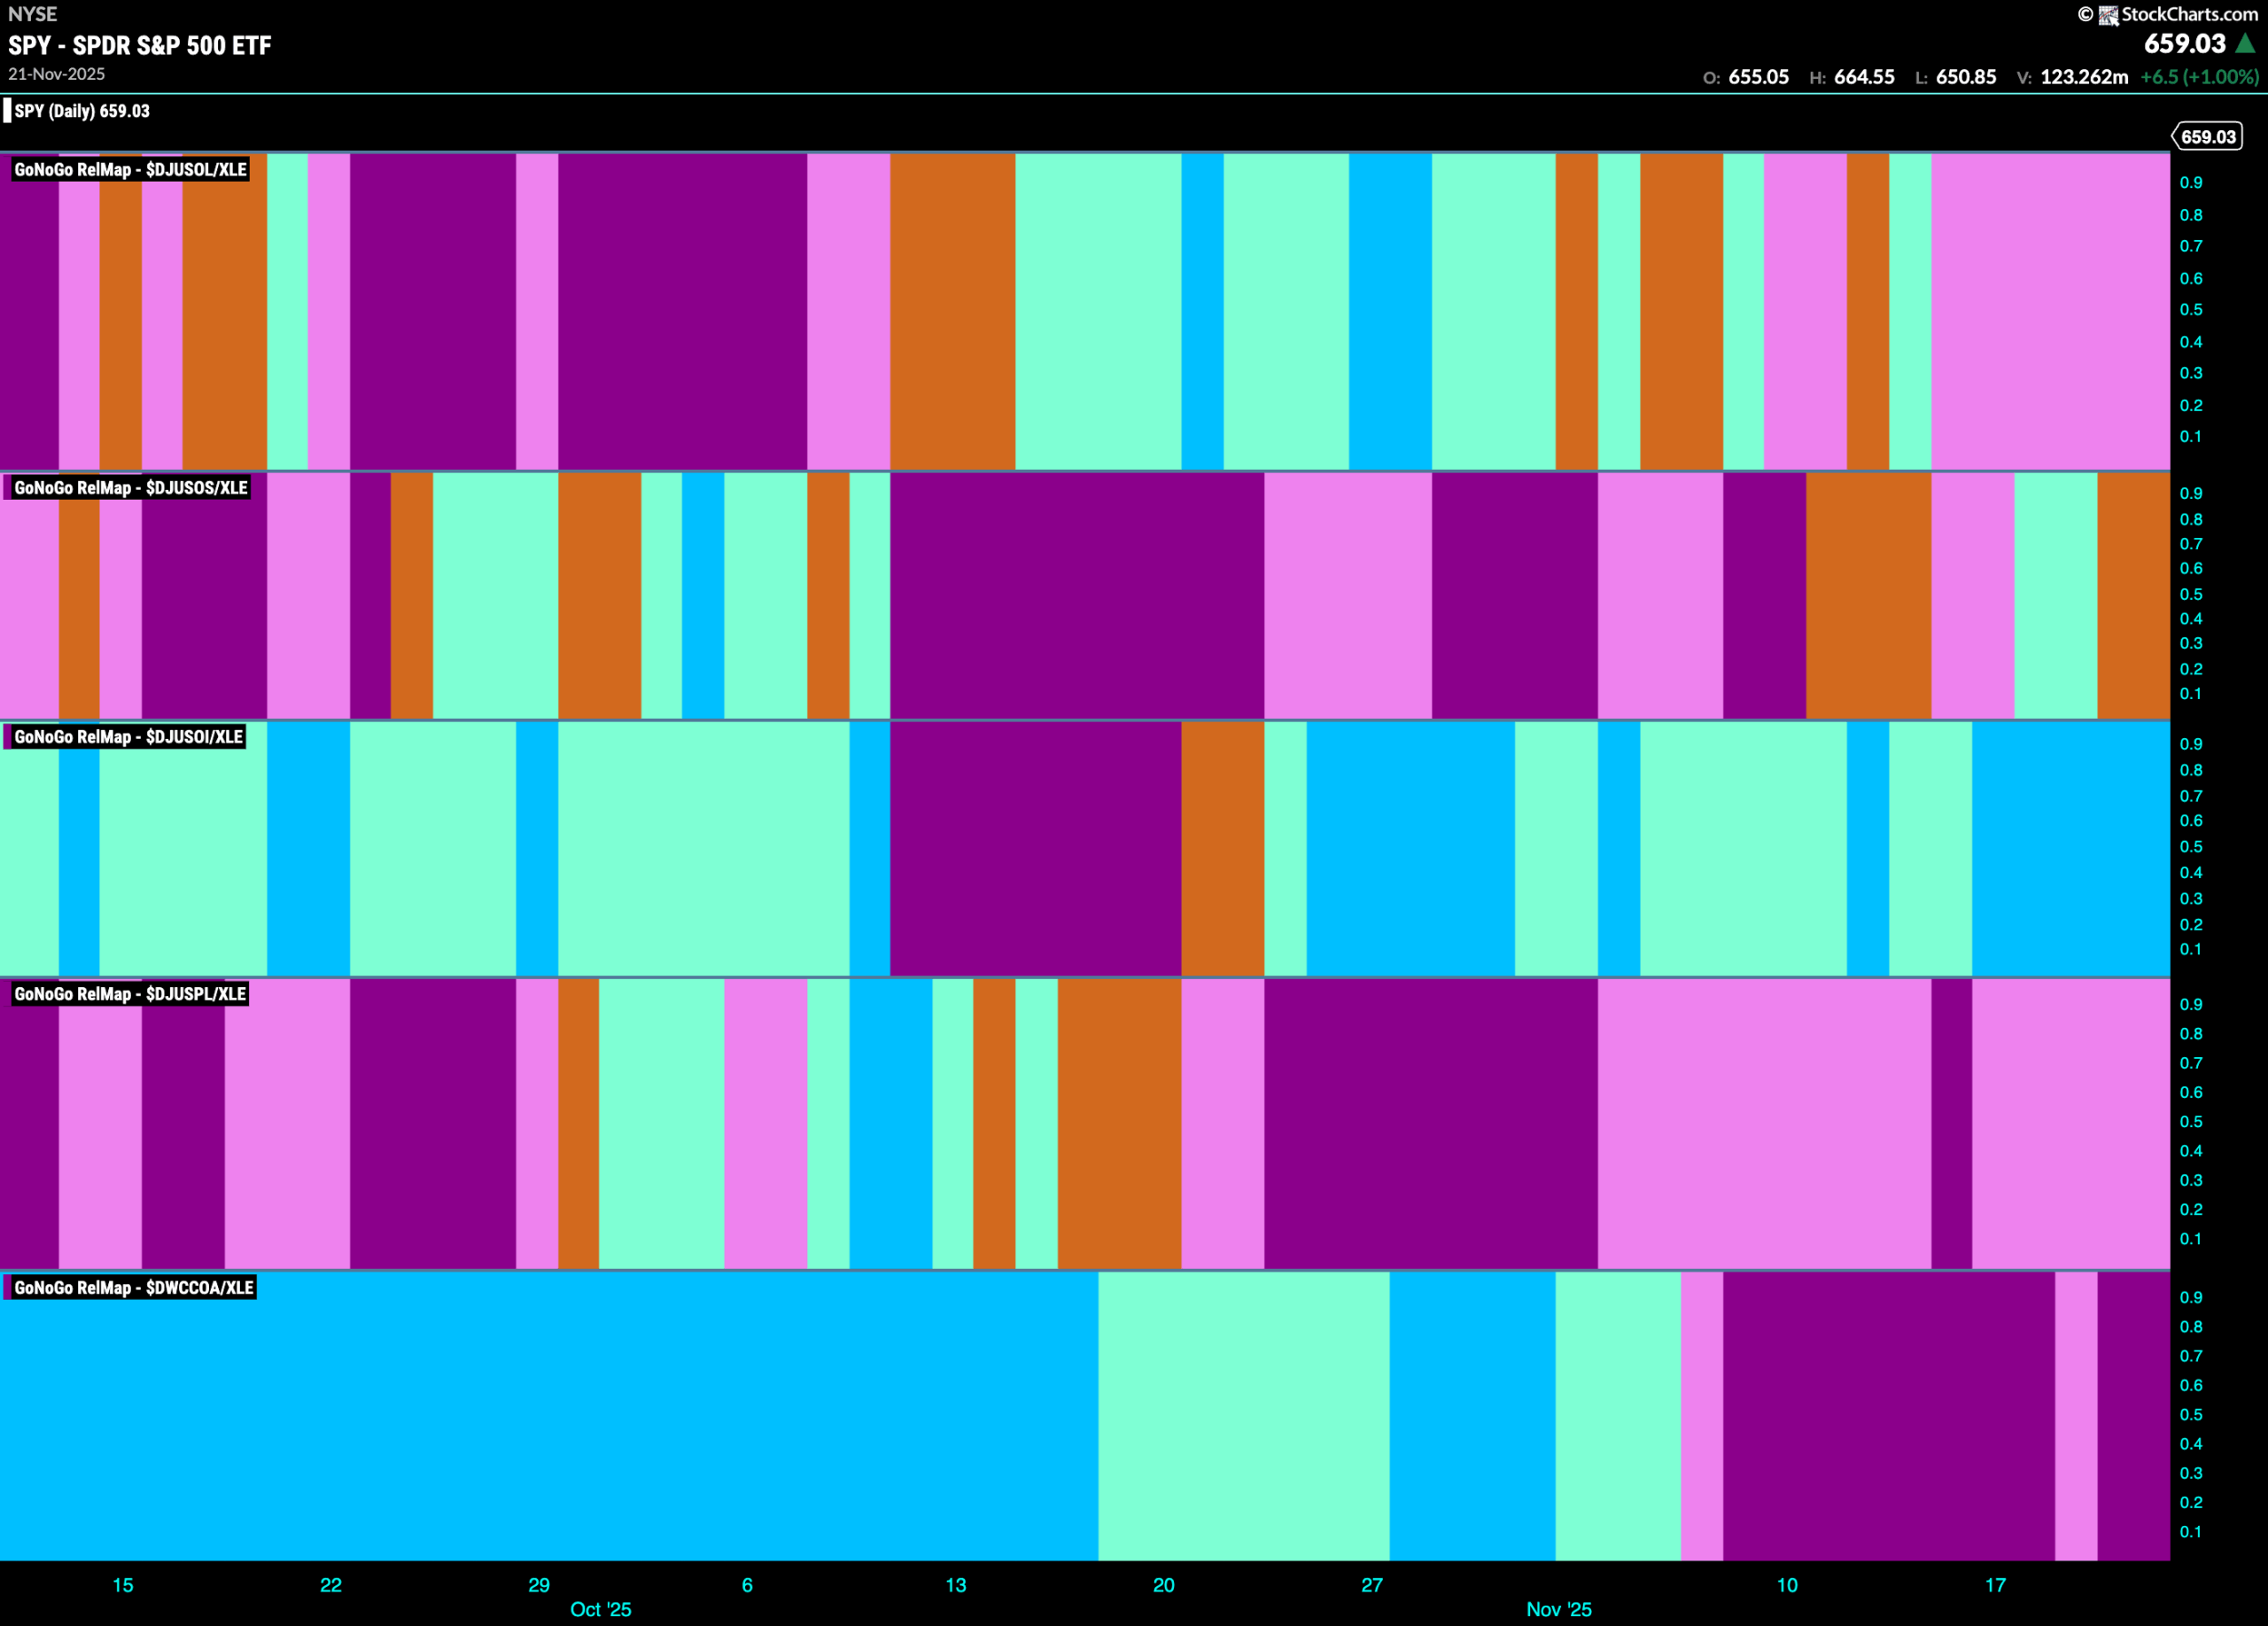
The chart below shows a relative trend breakdown of the sub groups within the energy sector this week. The Sub-Group RelMap plots the GoNoGo Trend of each sub index to the $XLE. We saw in the above GoNoGo Sector RelMap that $XLE is the new out-performing sector and paints strong relative “Go” bars. When we look at the below RelMap we can see that the oil equipment and services index in the lower panel is painting strong blue “Go” bars on a relative basis.
$HP Looks for Support in Strong “Go” Trend
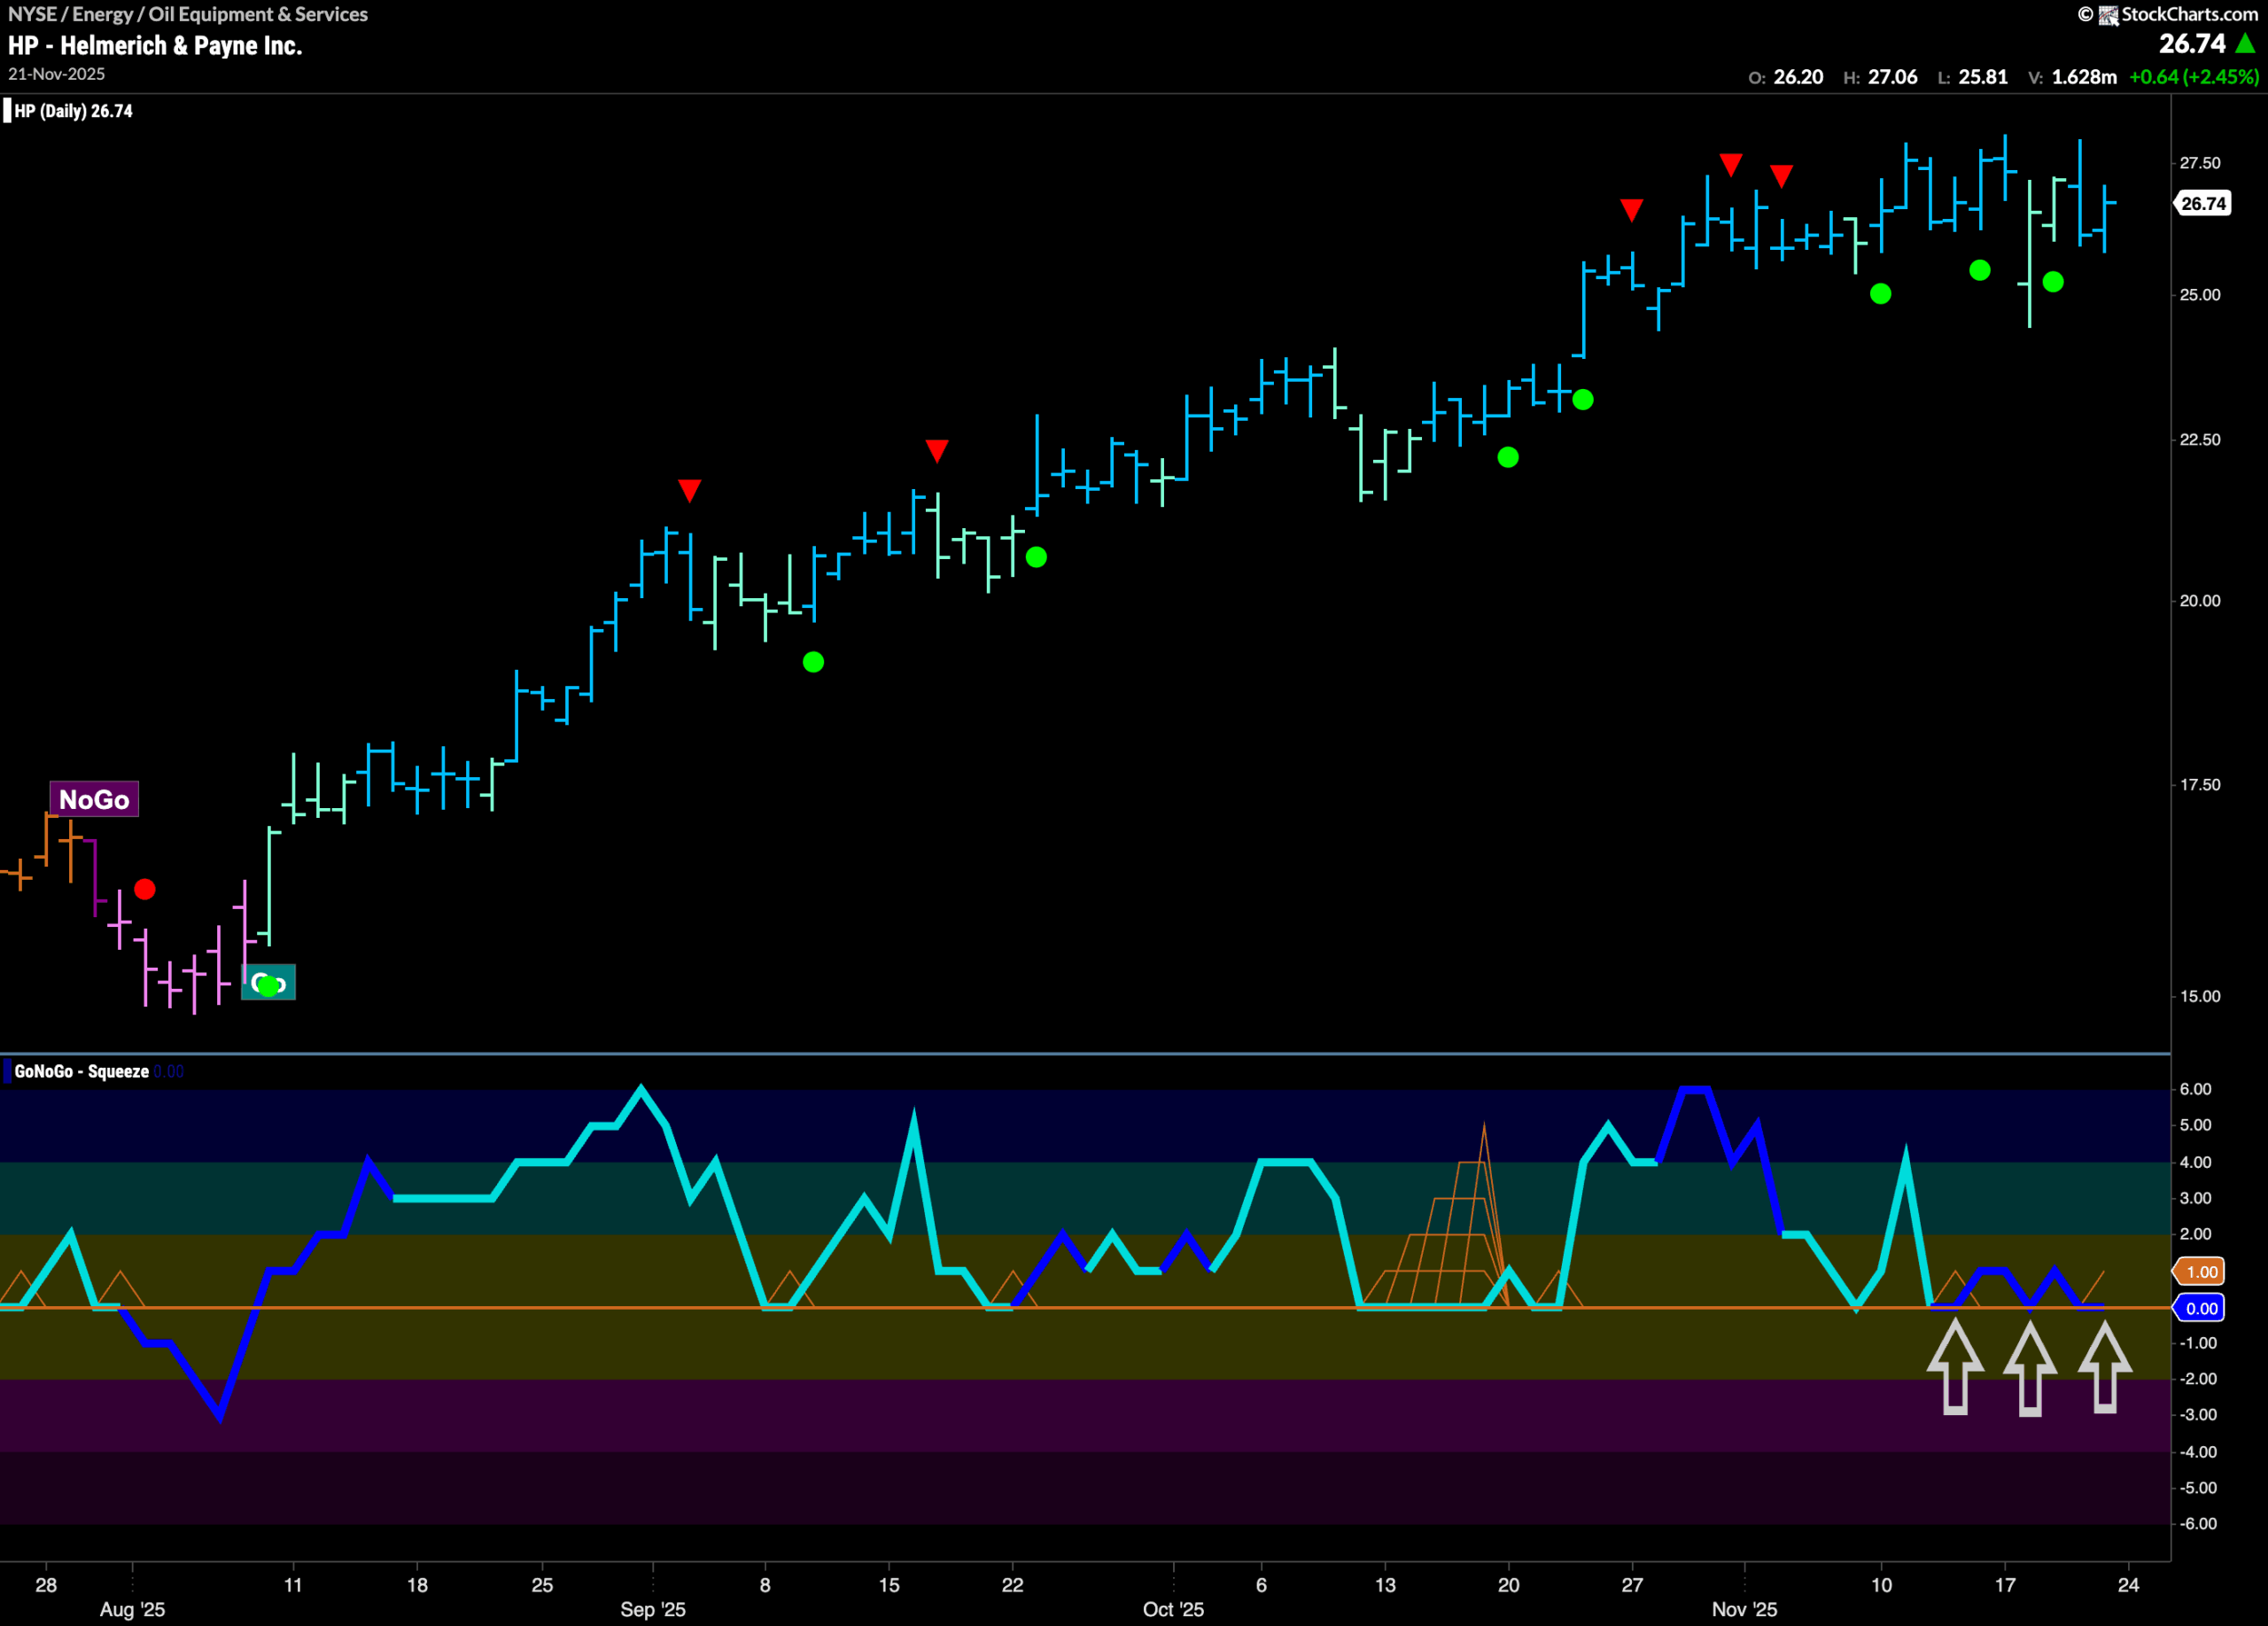
GoNoGo Trend shows that price has been in a “Go” trend since August, with GoNoGo Trend painting mostly strong blue bars as price has made a series of higher highs and higher lows. GoNoGo Oscillator has been at or above the zero line for the entire trend, providing momentum support each time it has rallied off the zero line back into positive territory. Most recently, we have seen price move mostly sideways and GoNoGo Oscillator has once again fallen to test the zero line from above. So far, the oscillator has been able to find support at that level, and we will watch again this week to see if that remains the case. Should GoNoGo Oscillator rally back into positive territory, we would likely see price make an attempt at a new higher high.
$TTI Setting Up For Big Move?
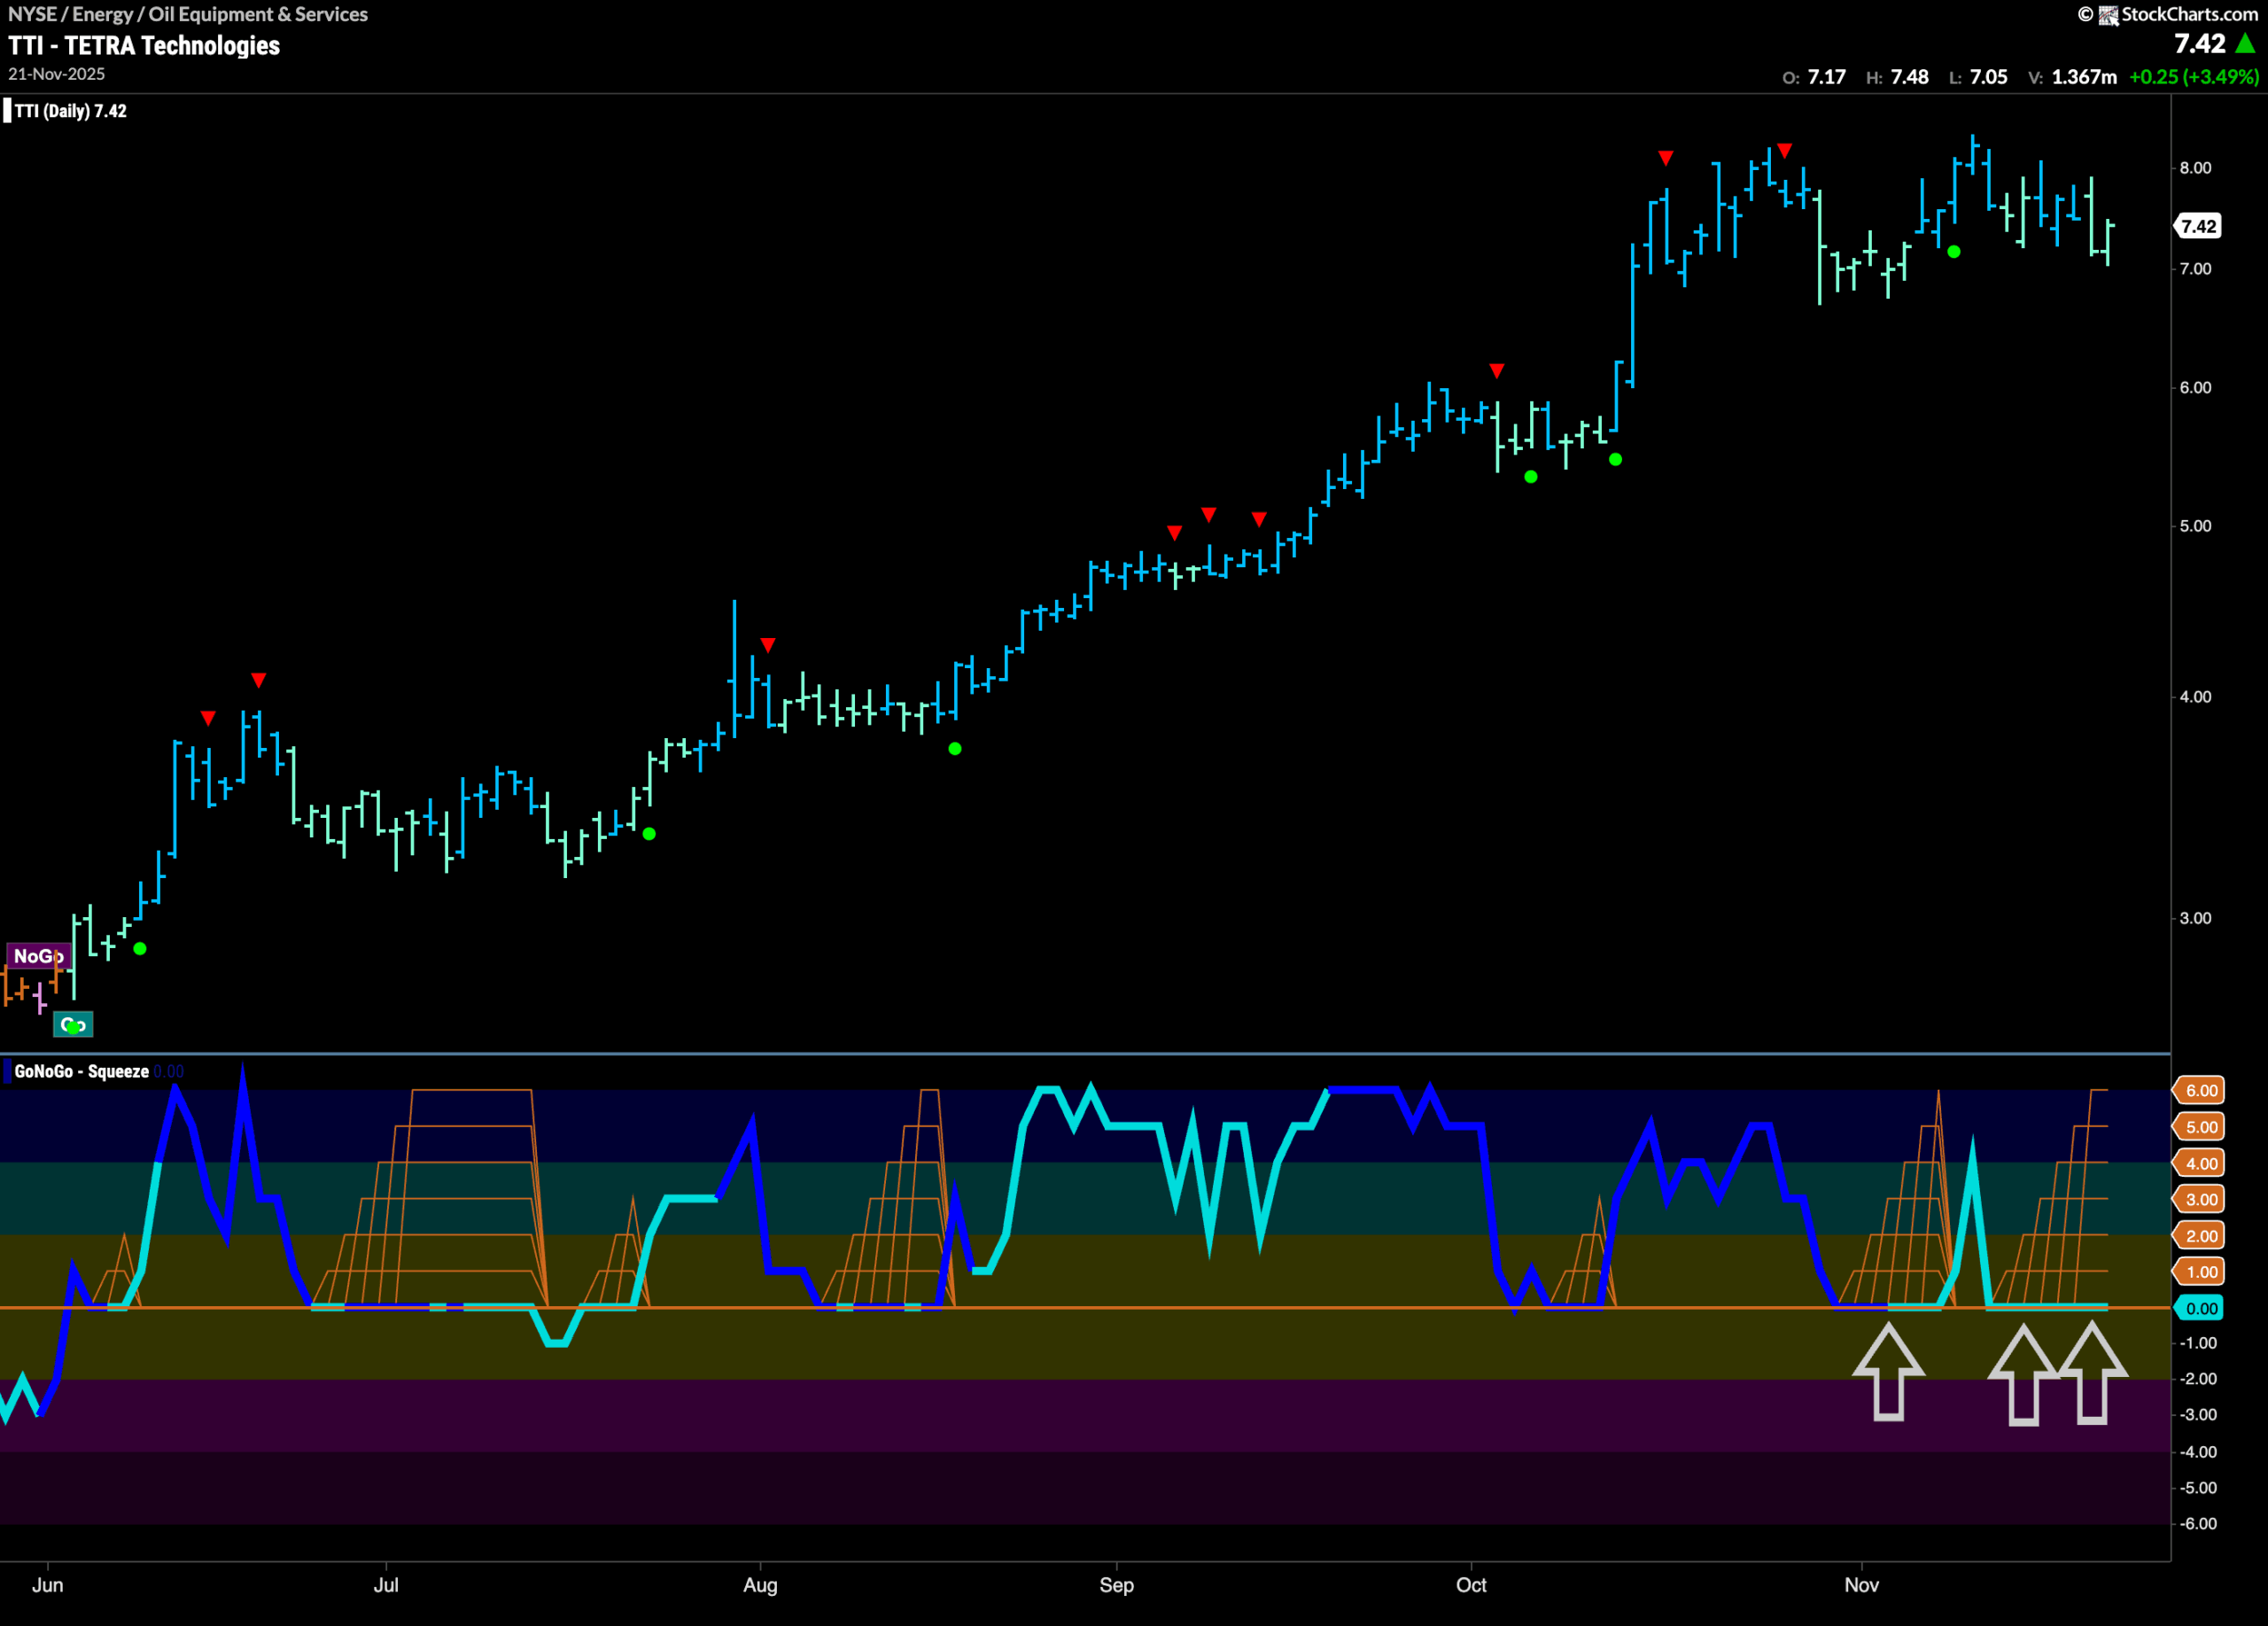
The chart below shows that $TTI has seen price move sideways since hitting highs in late October. This comes after a strong trend has seen a series of higher highs and higher lows. As we saw with $HP, GoNoGo Oscillator has provided momentum support rallying off zero each time it has been tested. Most recently, we have seen two Max GoNoGo Squeezes completed and this current one is extended. We will watch to see if the oscillator once again is able to break out of the Squeeze into positive territory. If it does, we will expect price to challenge for another higher high. Should it break down into negative territory we would likely see price struggle.