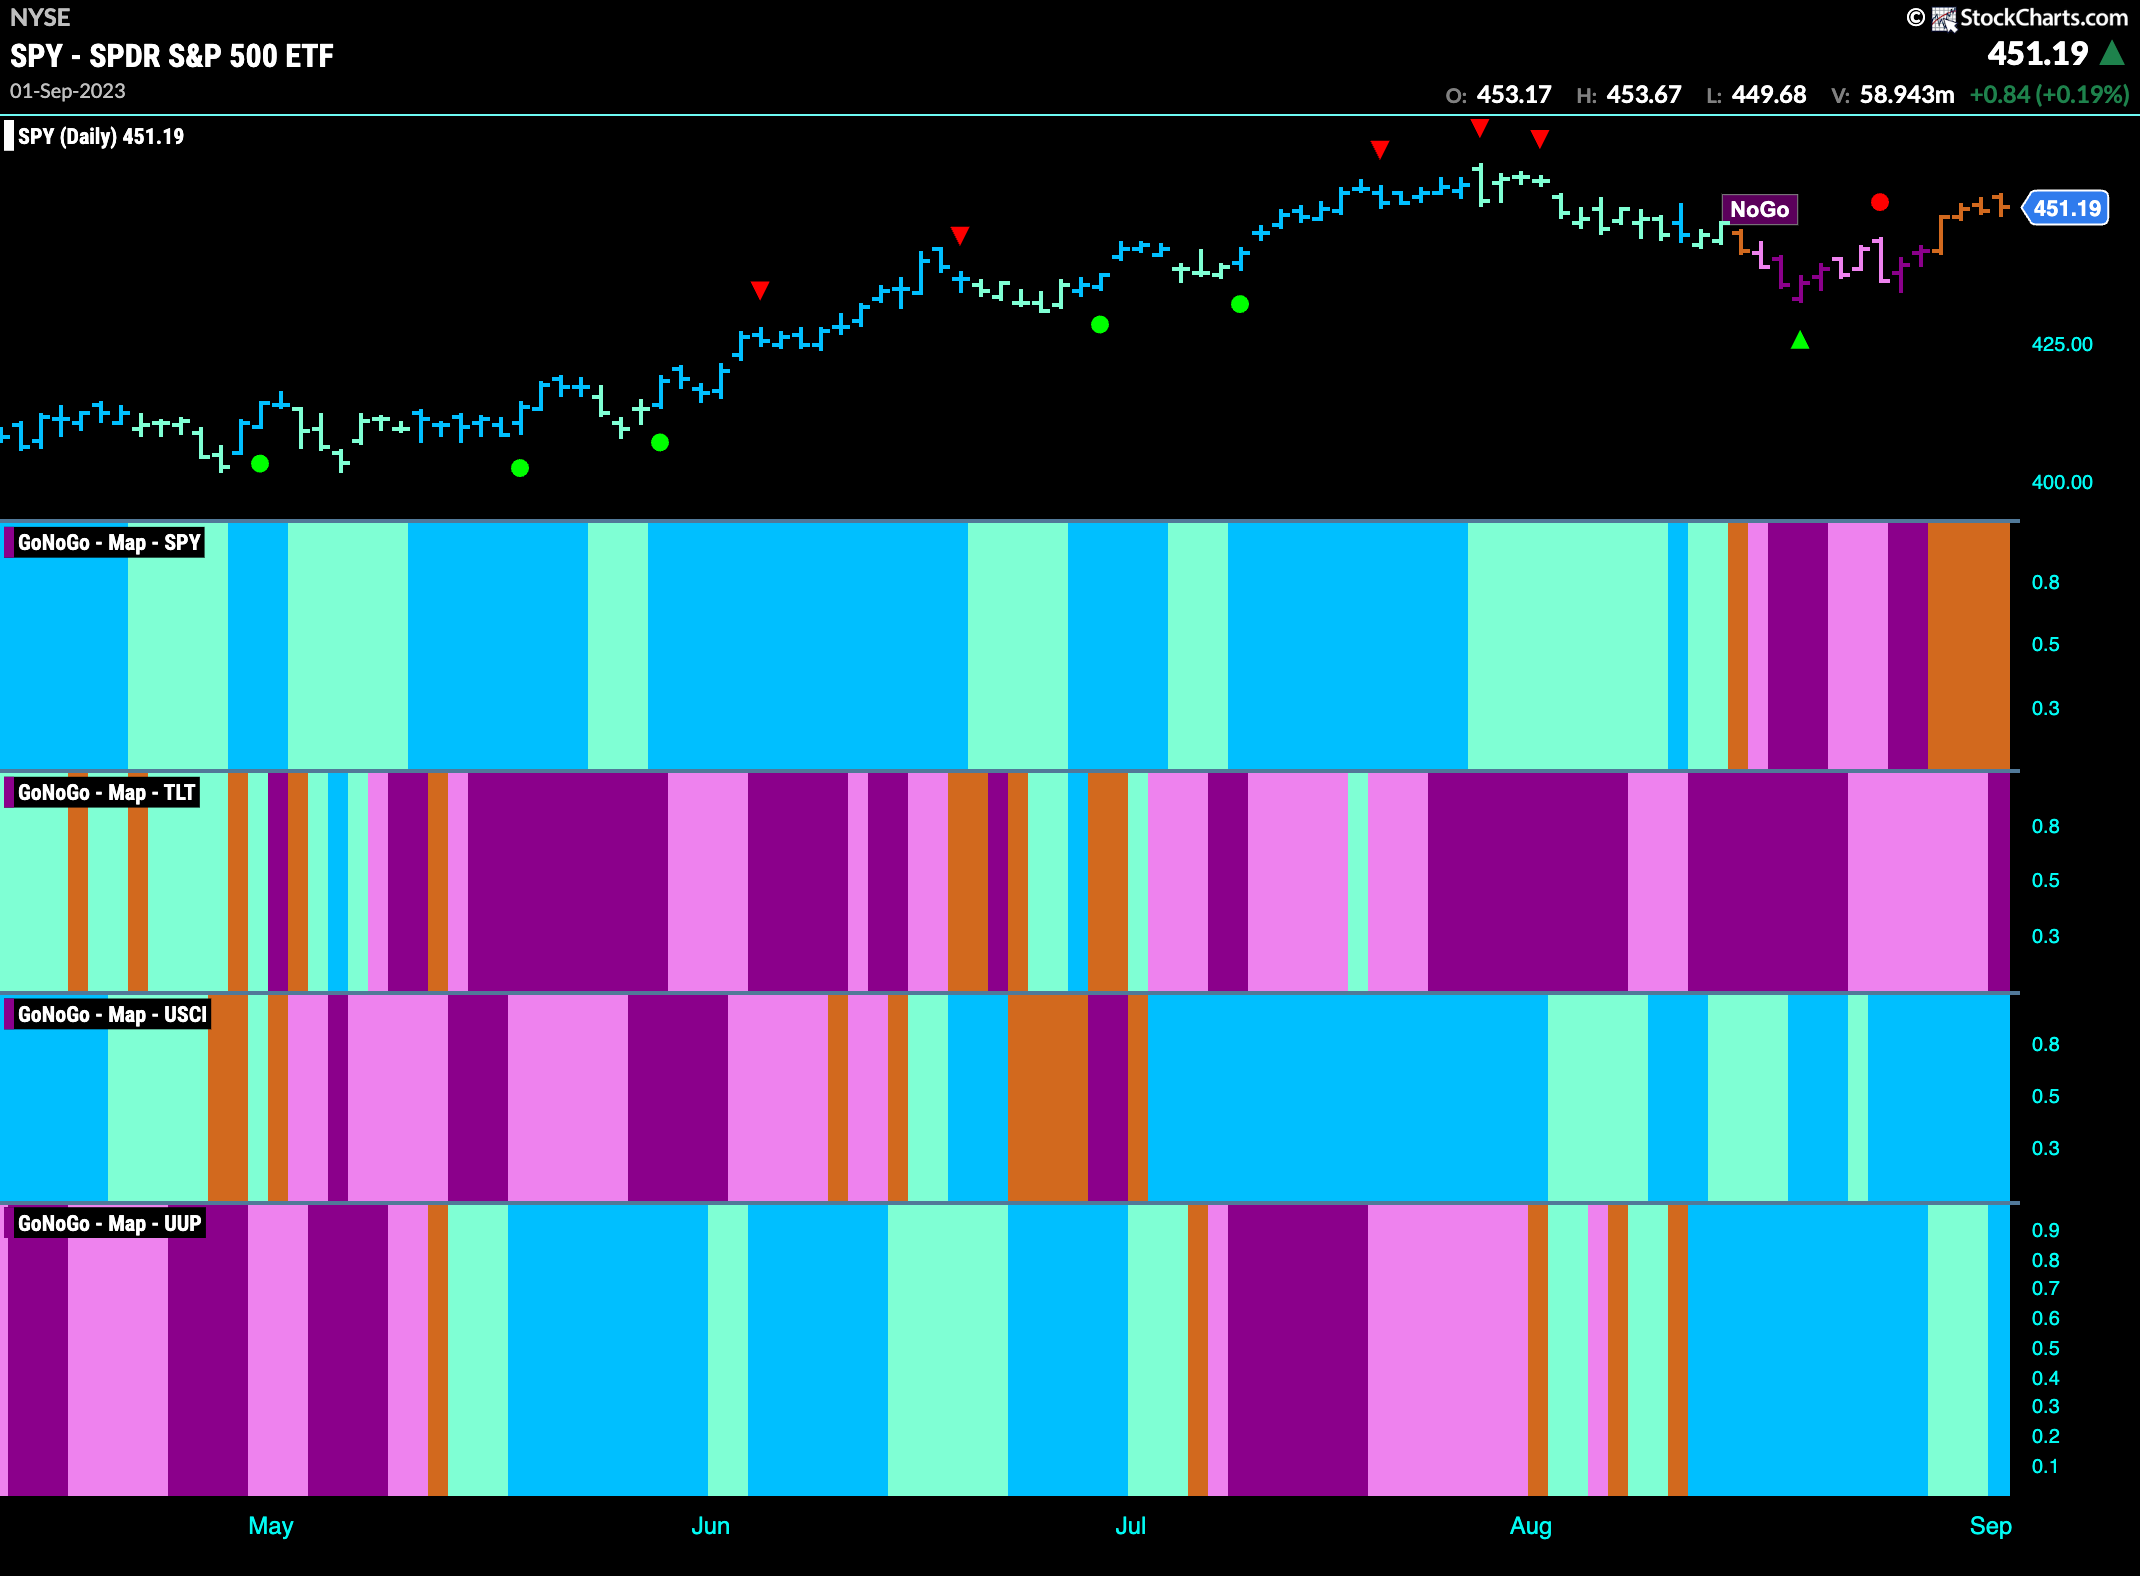
Good morning and welcome to this week’s Flight Path. We saw uncertainty this last week as price rallied from the lows it hit during the brief “NoGo”. Painting a string of amber “Go Fish” bars we can see that the market isn’t entirely convinced that we are out of the woods yet however the “NoGo” seems to have lost its hold for now. We see renewed strength in commodities and the dollar as well as we shall see later.
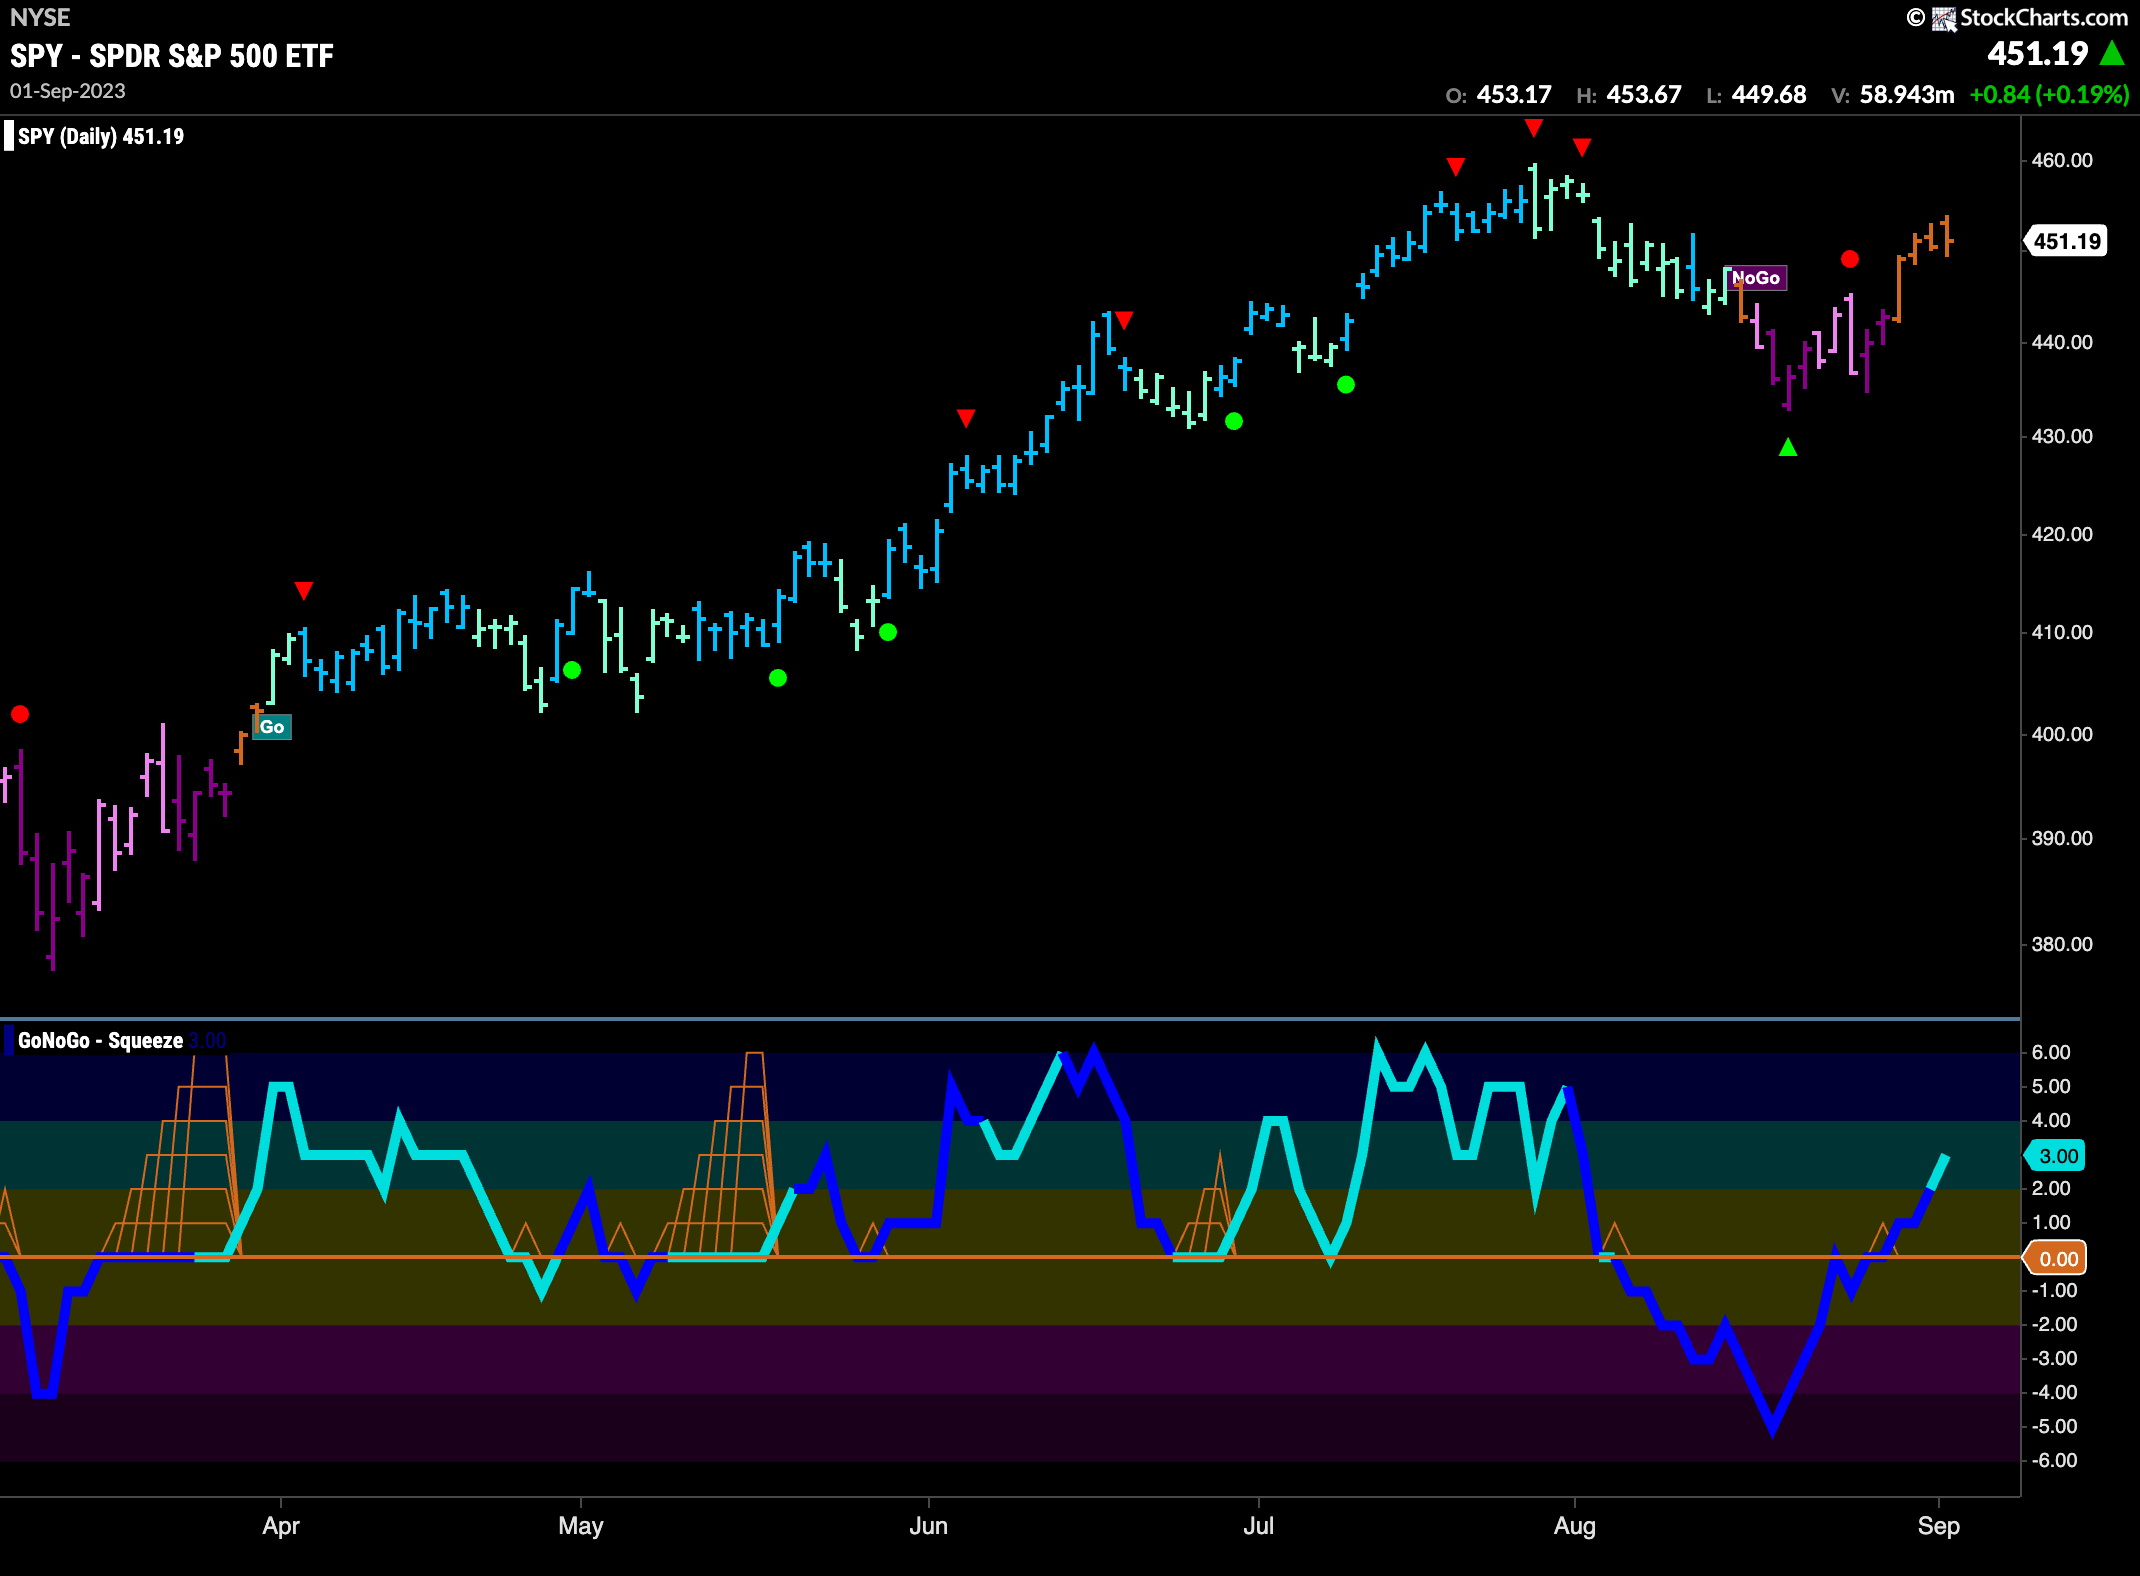
Time to “Go Fishing”?
Prices moved higher this week but did pull back on the last bar of the week. We will watch to see if the GoNoGo Trend indicator can move into “Go” colors. If it does, it will be on the back of surging positive momentum as GoNoGo Oscillator has crossed clearly above the zero line this week. Volume has cooled, although it was strong on the break.
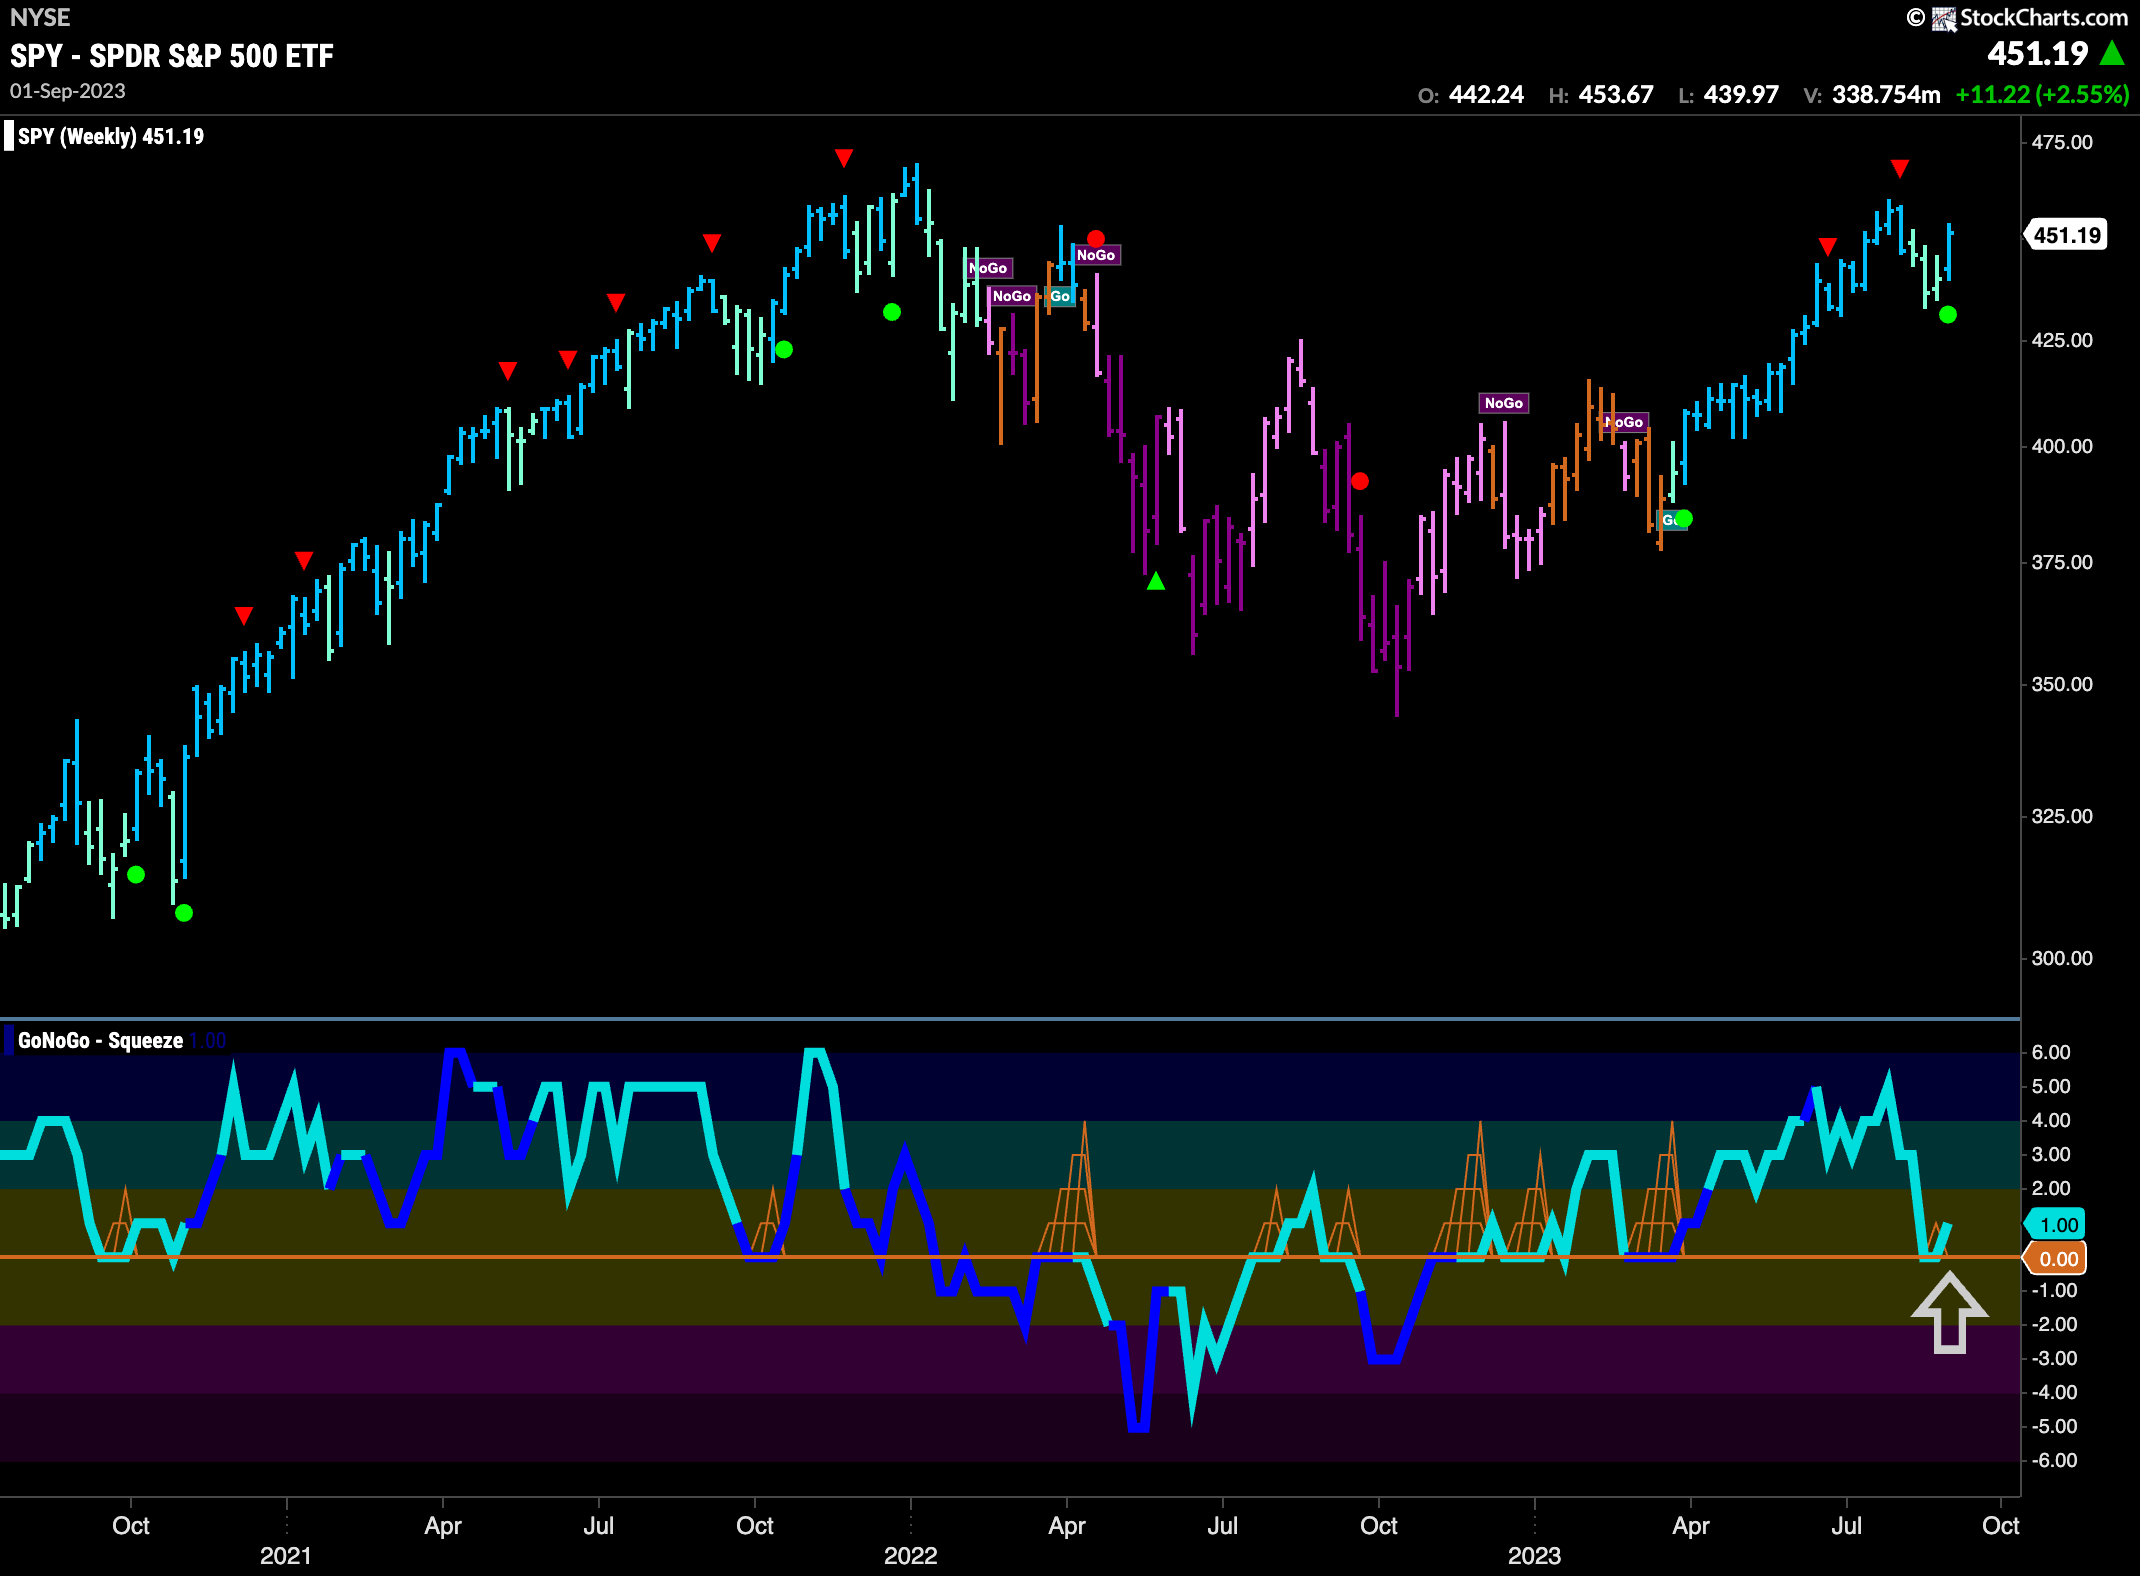
The longer term weekly chart remains in a “Go” trend. And, in a positive turn of events, we saw a strong blue “Go” bar this week as price rallied. This coincides with GoNoGo Oscillator finding support at the zero line and moving back into positive territory. On the weekly chart therefore, we can say that we have signs of Go Trend Continuation (green circle) as momentum is resurgent in the direction of the “Go” trend.
Treasury Rates Remain in “Go” Trend but Momentum Wanes
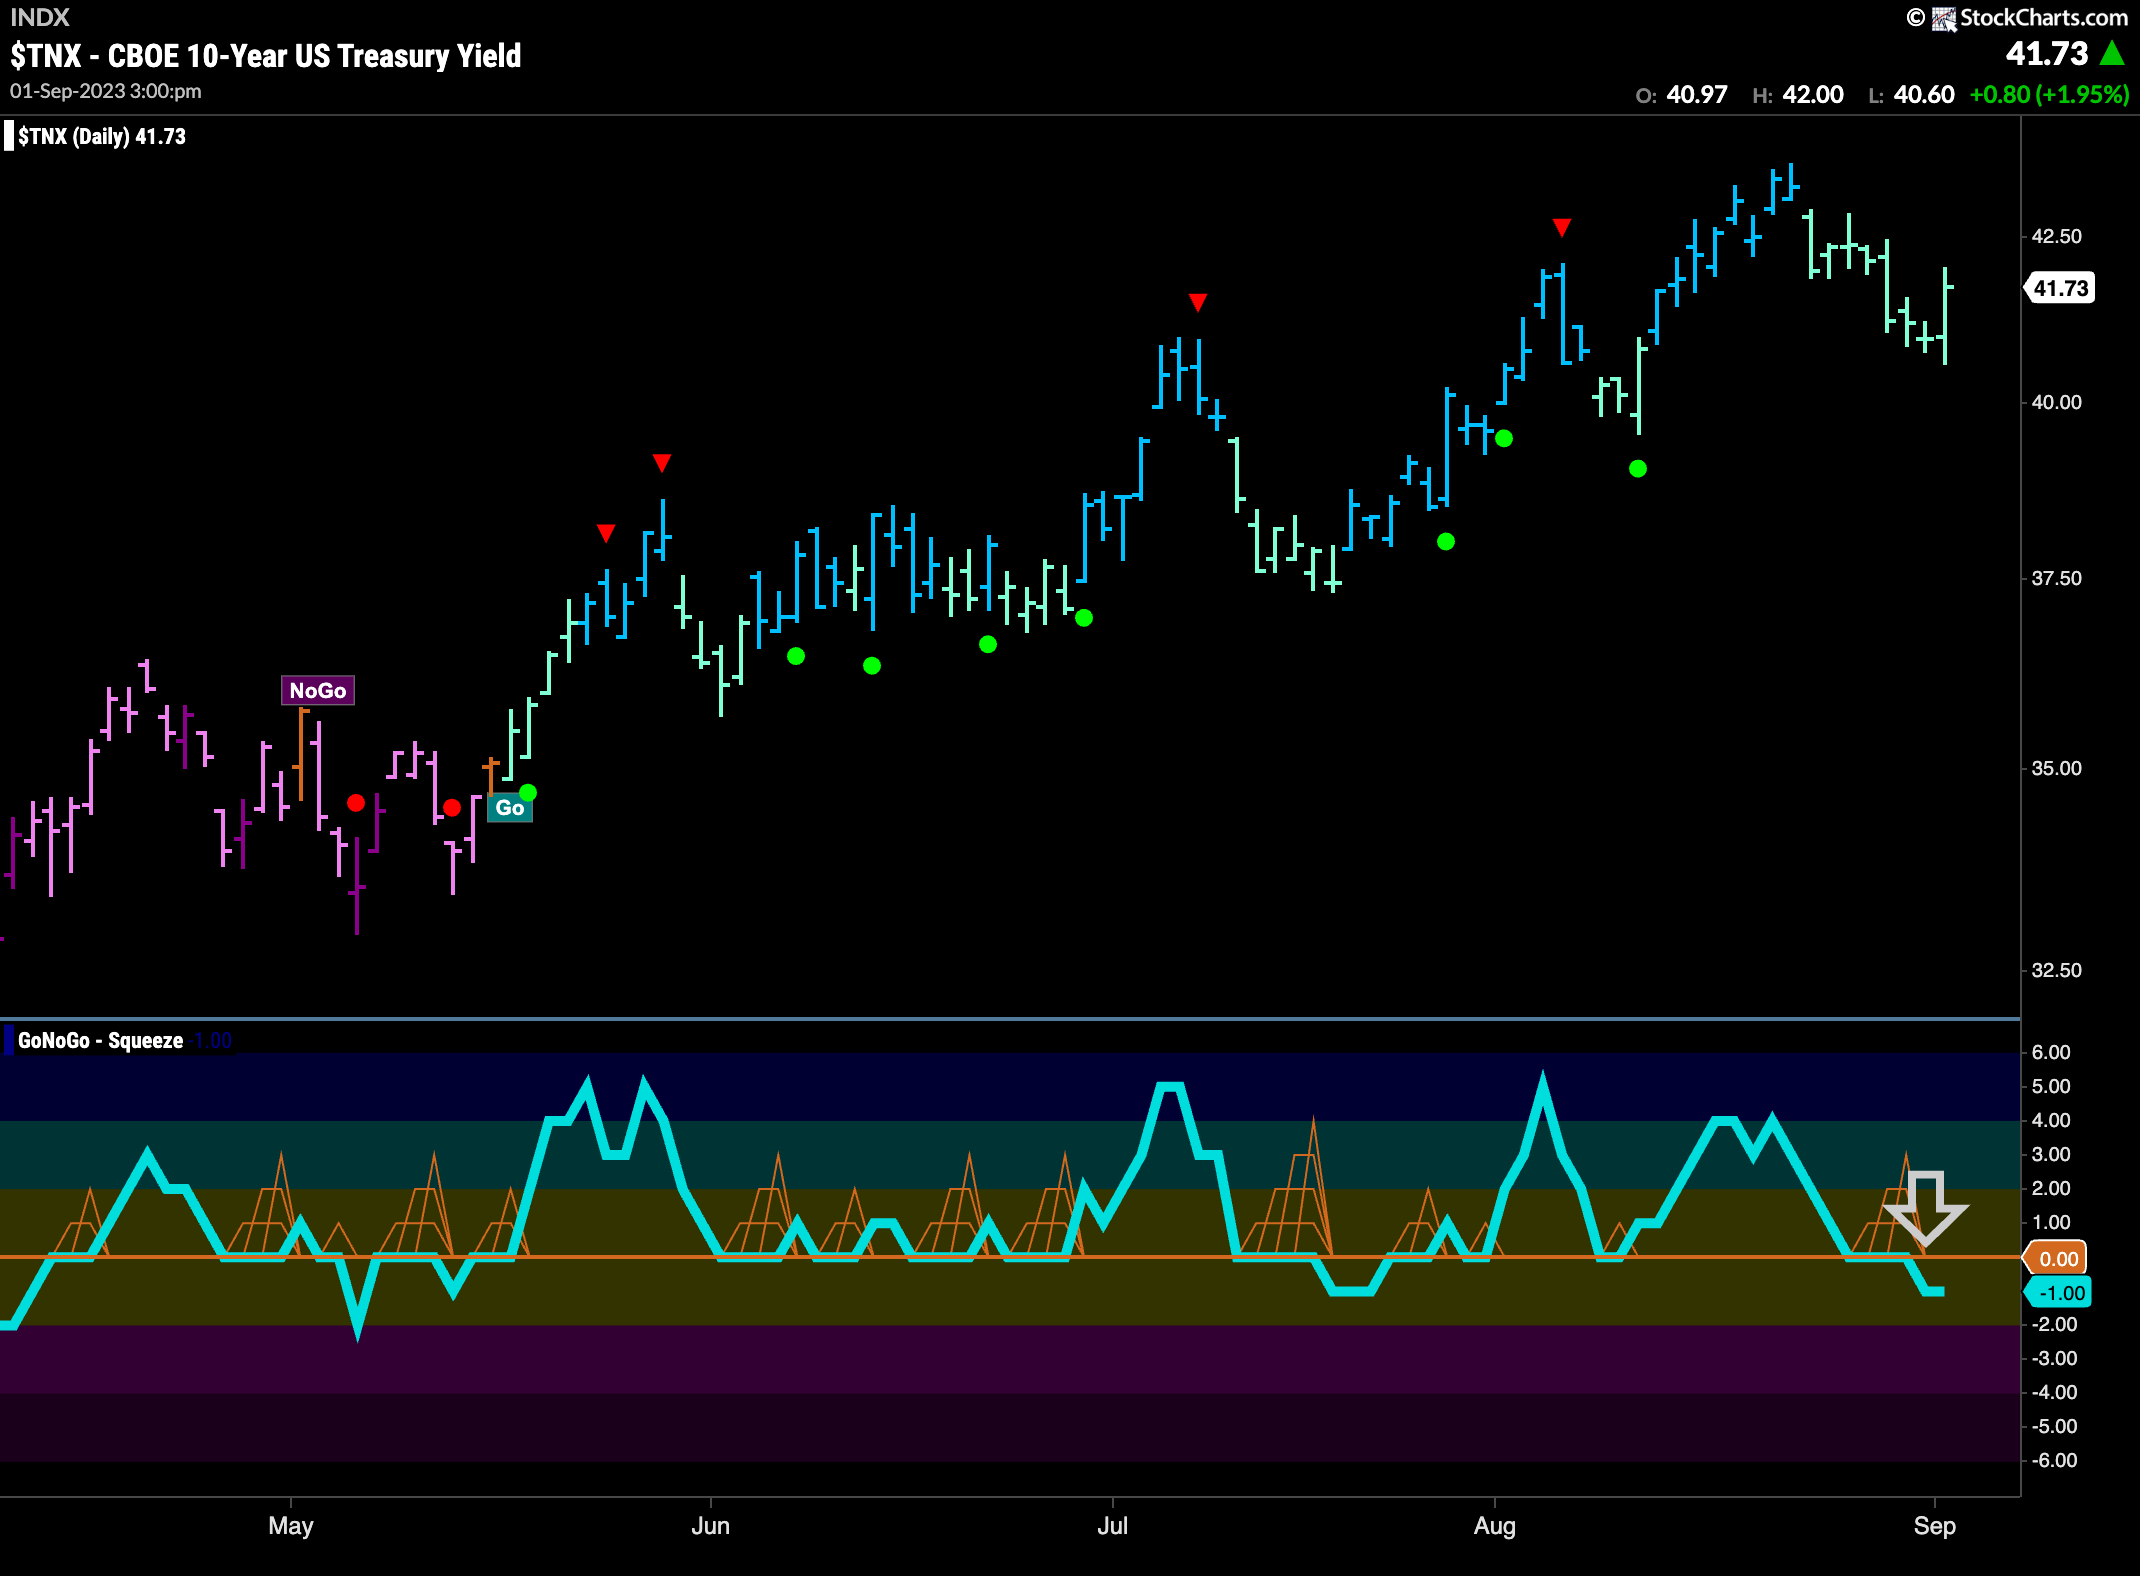
Treasury bond rates rallied a little on the last bar of the week but we see weaker aqua bars remain in favor. We haven’t seen strength in the “Go” trend since the recent high. GoNoGo Oscillator shows that momentum failed to find support at the zero line and we have dipped into negative territory. The oscillator will need to quickly get back into positive territory if it is looking to support the “Go” trend.
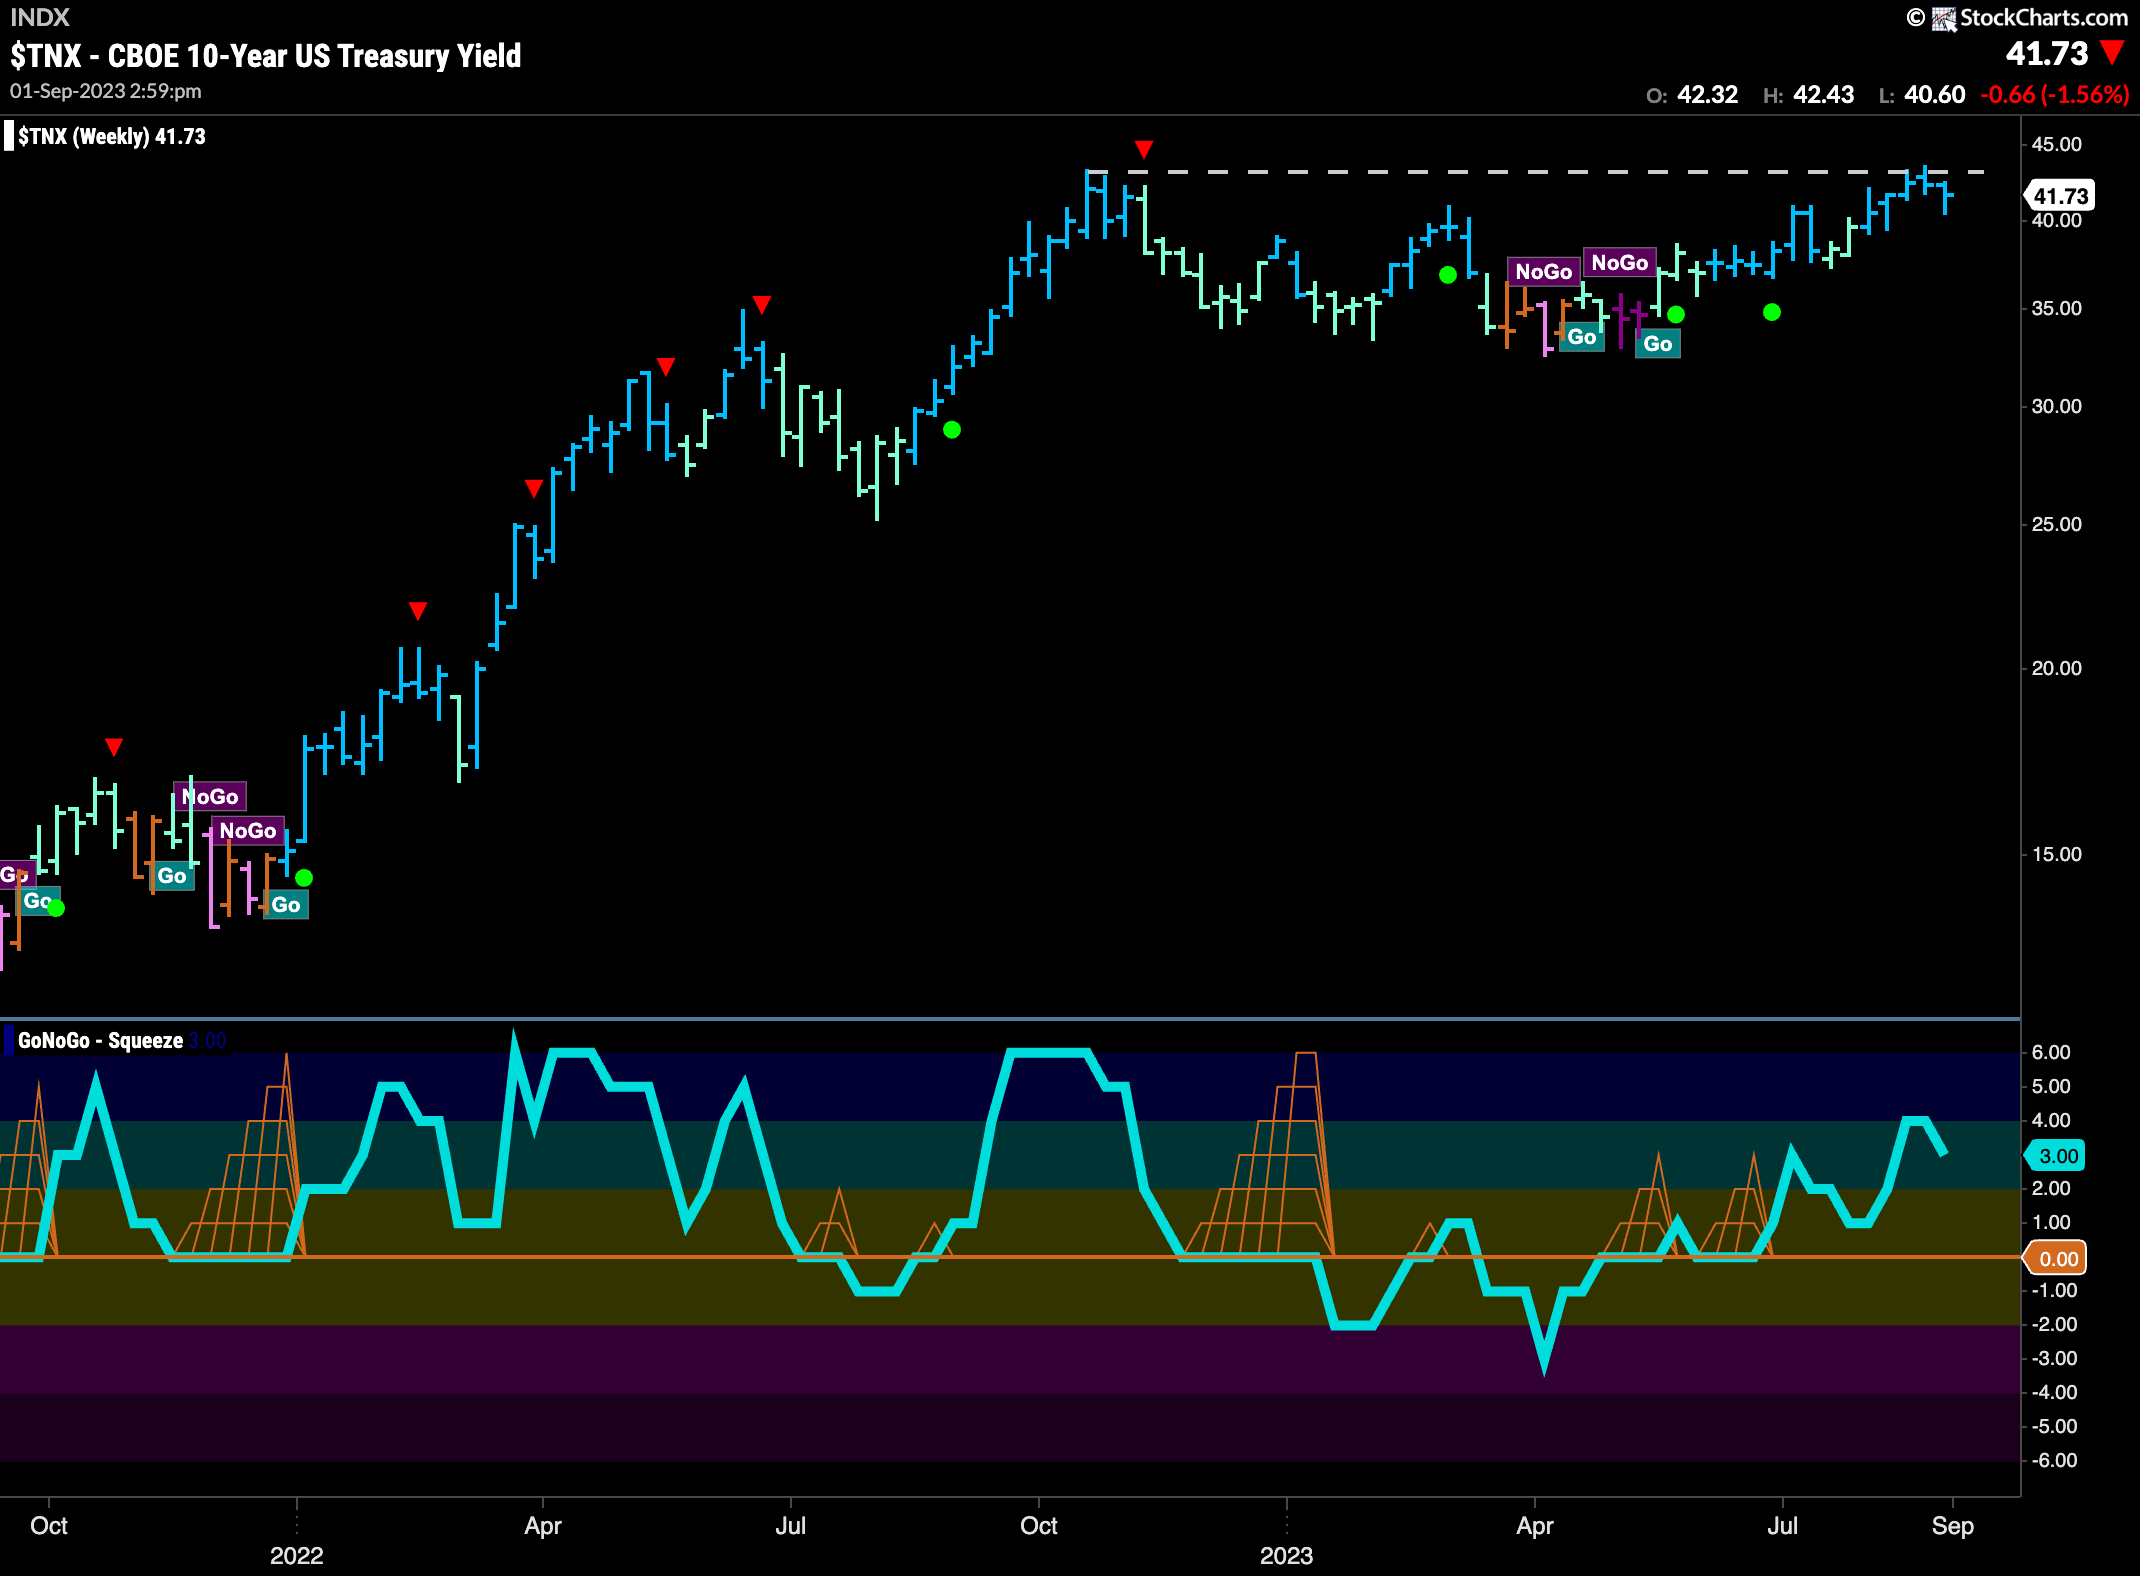
The weekly chart shows that while price is still in a strong “Go” trend it is struggling to deal with the overhead resistance we see on the chart. We have fallen away slightly from these levels and GoNoGo Oscillator shows that momentum is retreating as it heads lower toward the zero line. We will watch to see if momentum can stay positive as price tries to overcome this resistance.
Dollar Has Strong Week
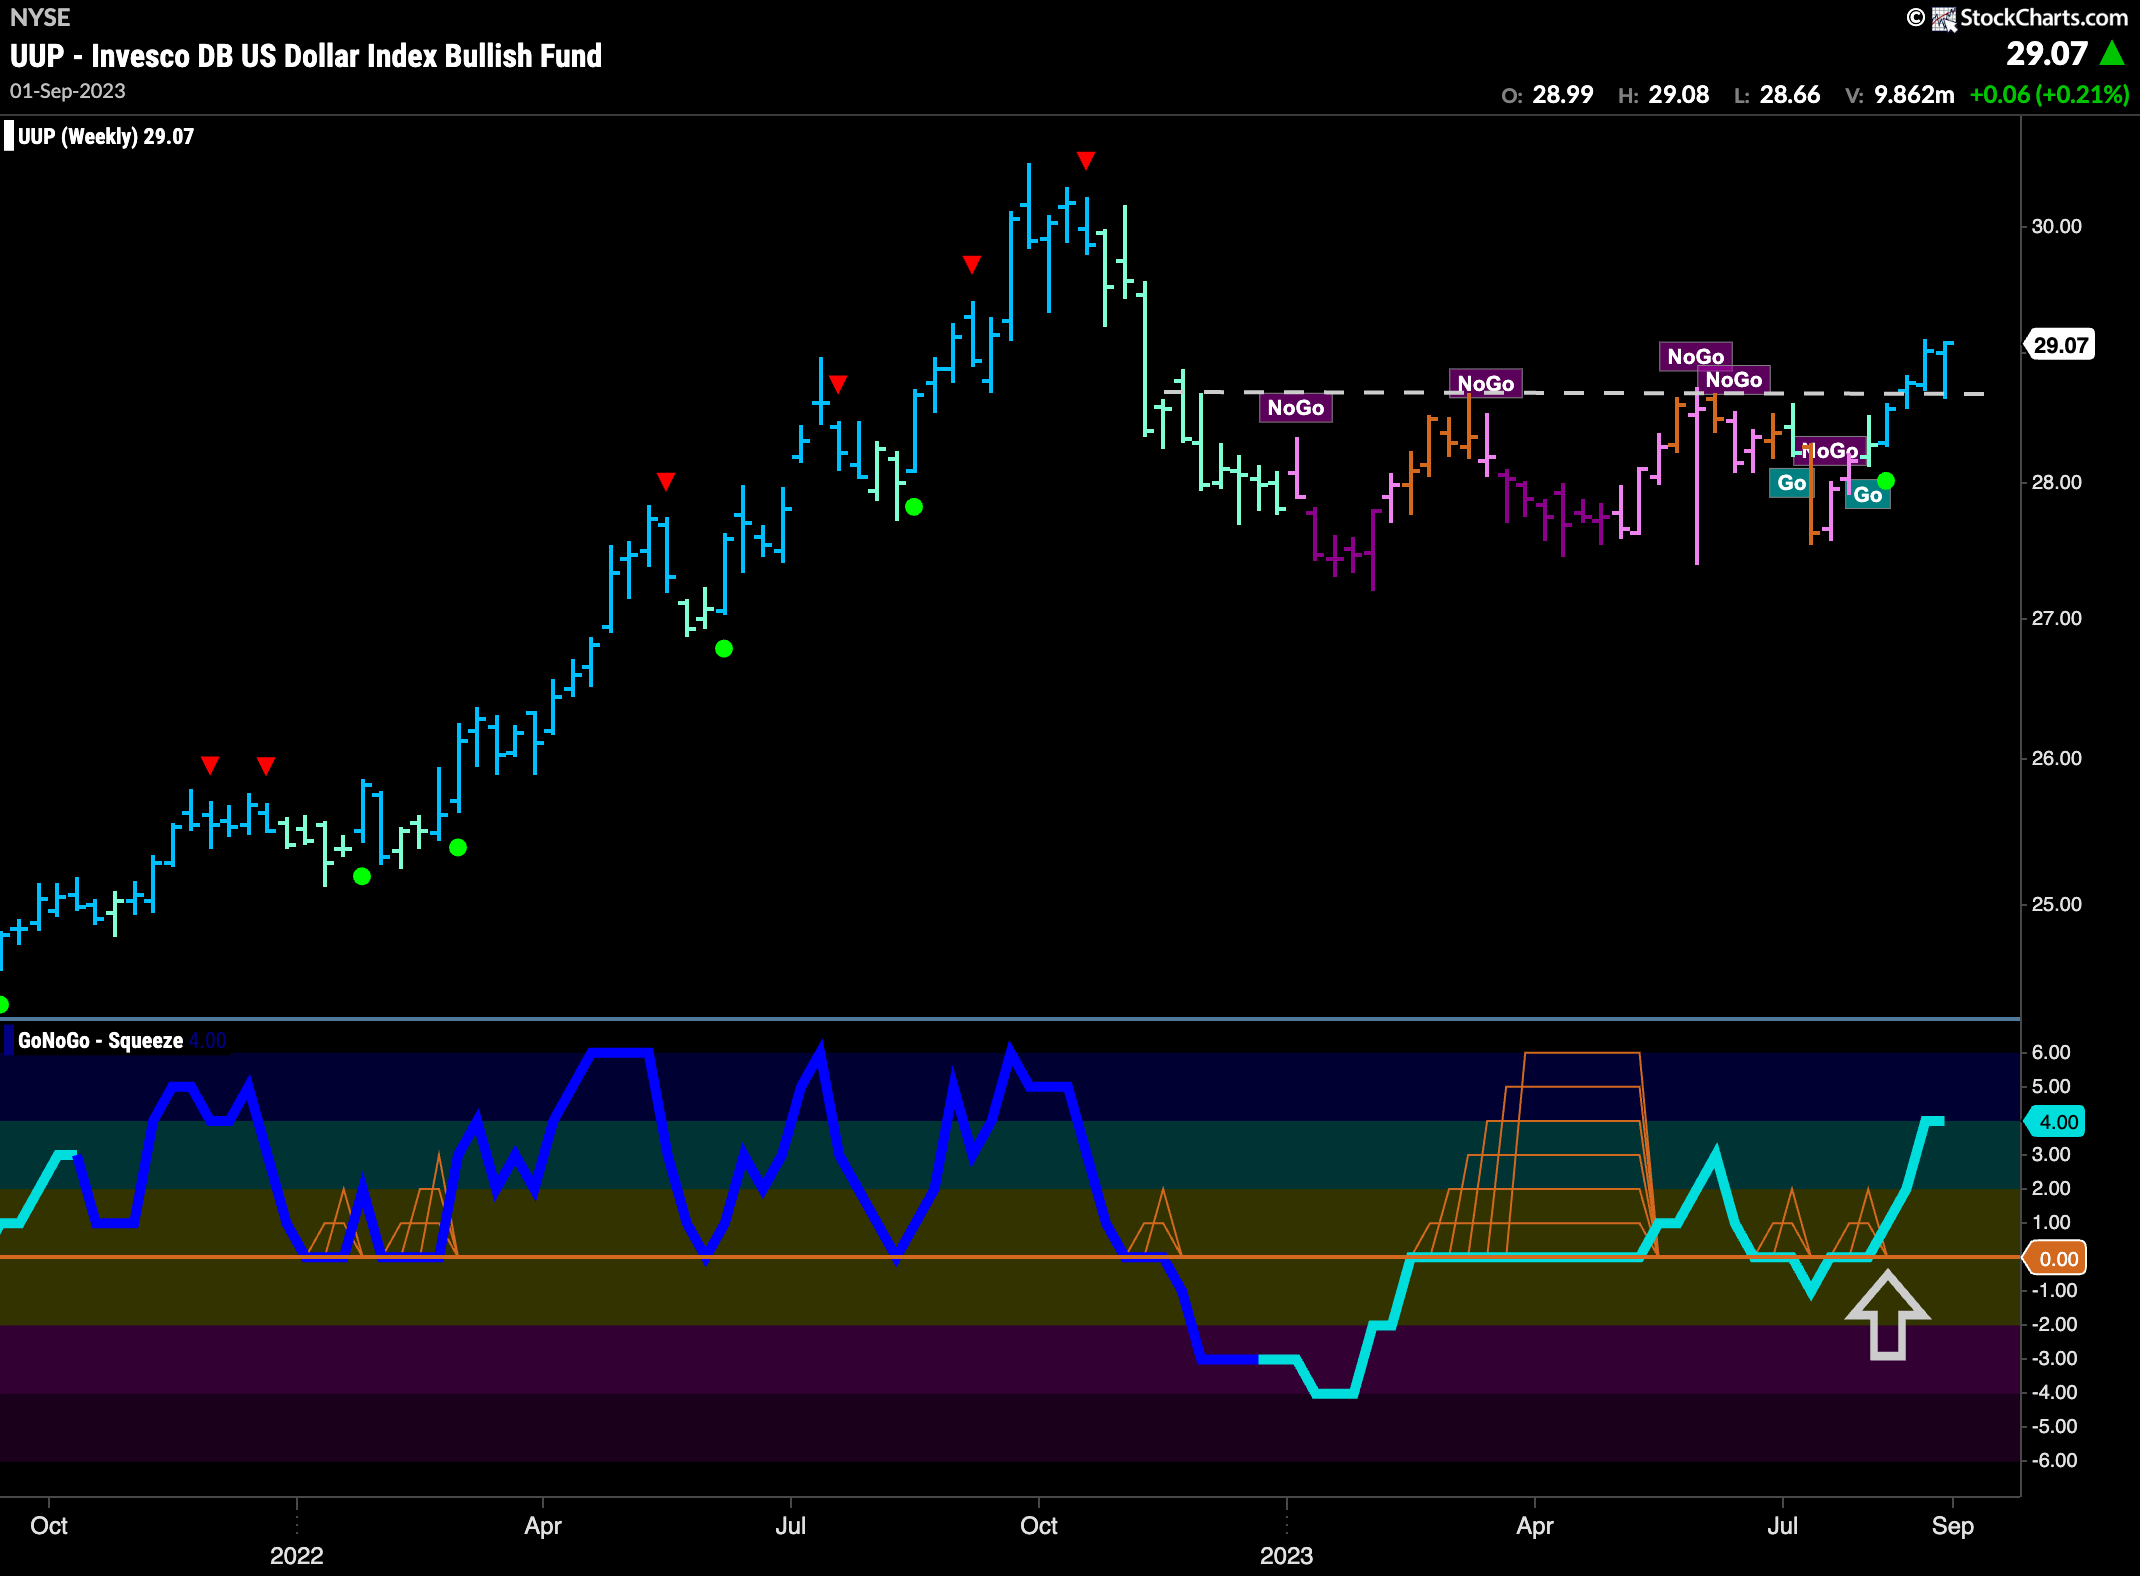
Looking at the weekly chart of the dollar below, we see that price had another strong week. Another strong blue “Go” bar is painted by GoNoGo Trend as price consolidates above resistance. We see that this comes after GoNoGo Oscillator forges higher into positive territory. This chart is therefore looking strongly bullish, with a powerful “Go” trend in place being confirmed by positive momentum.
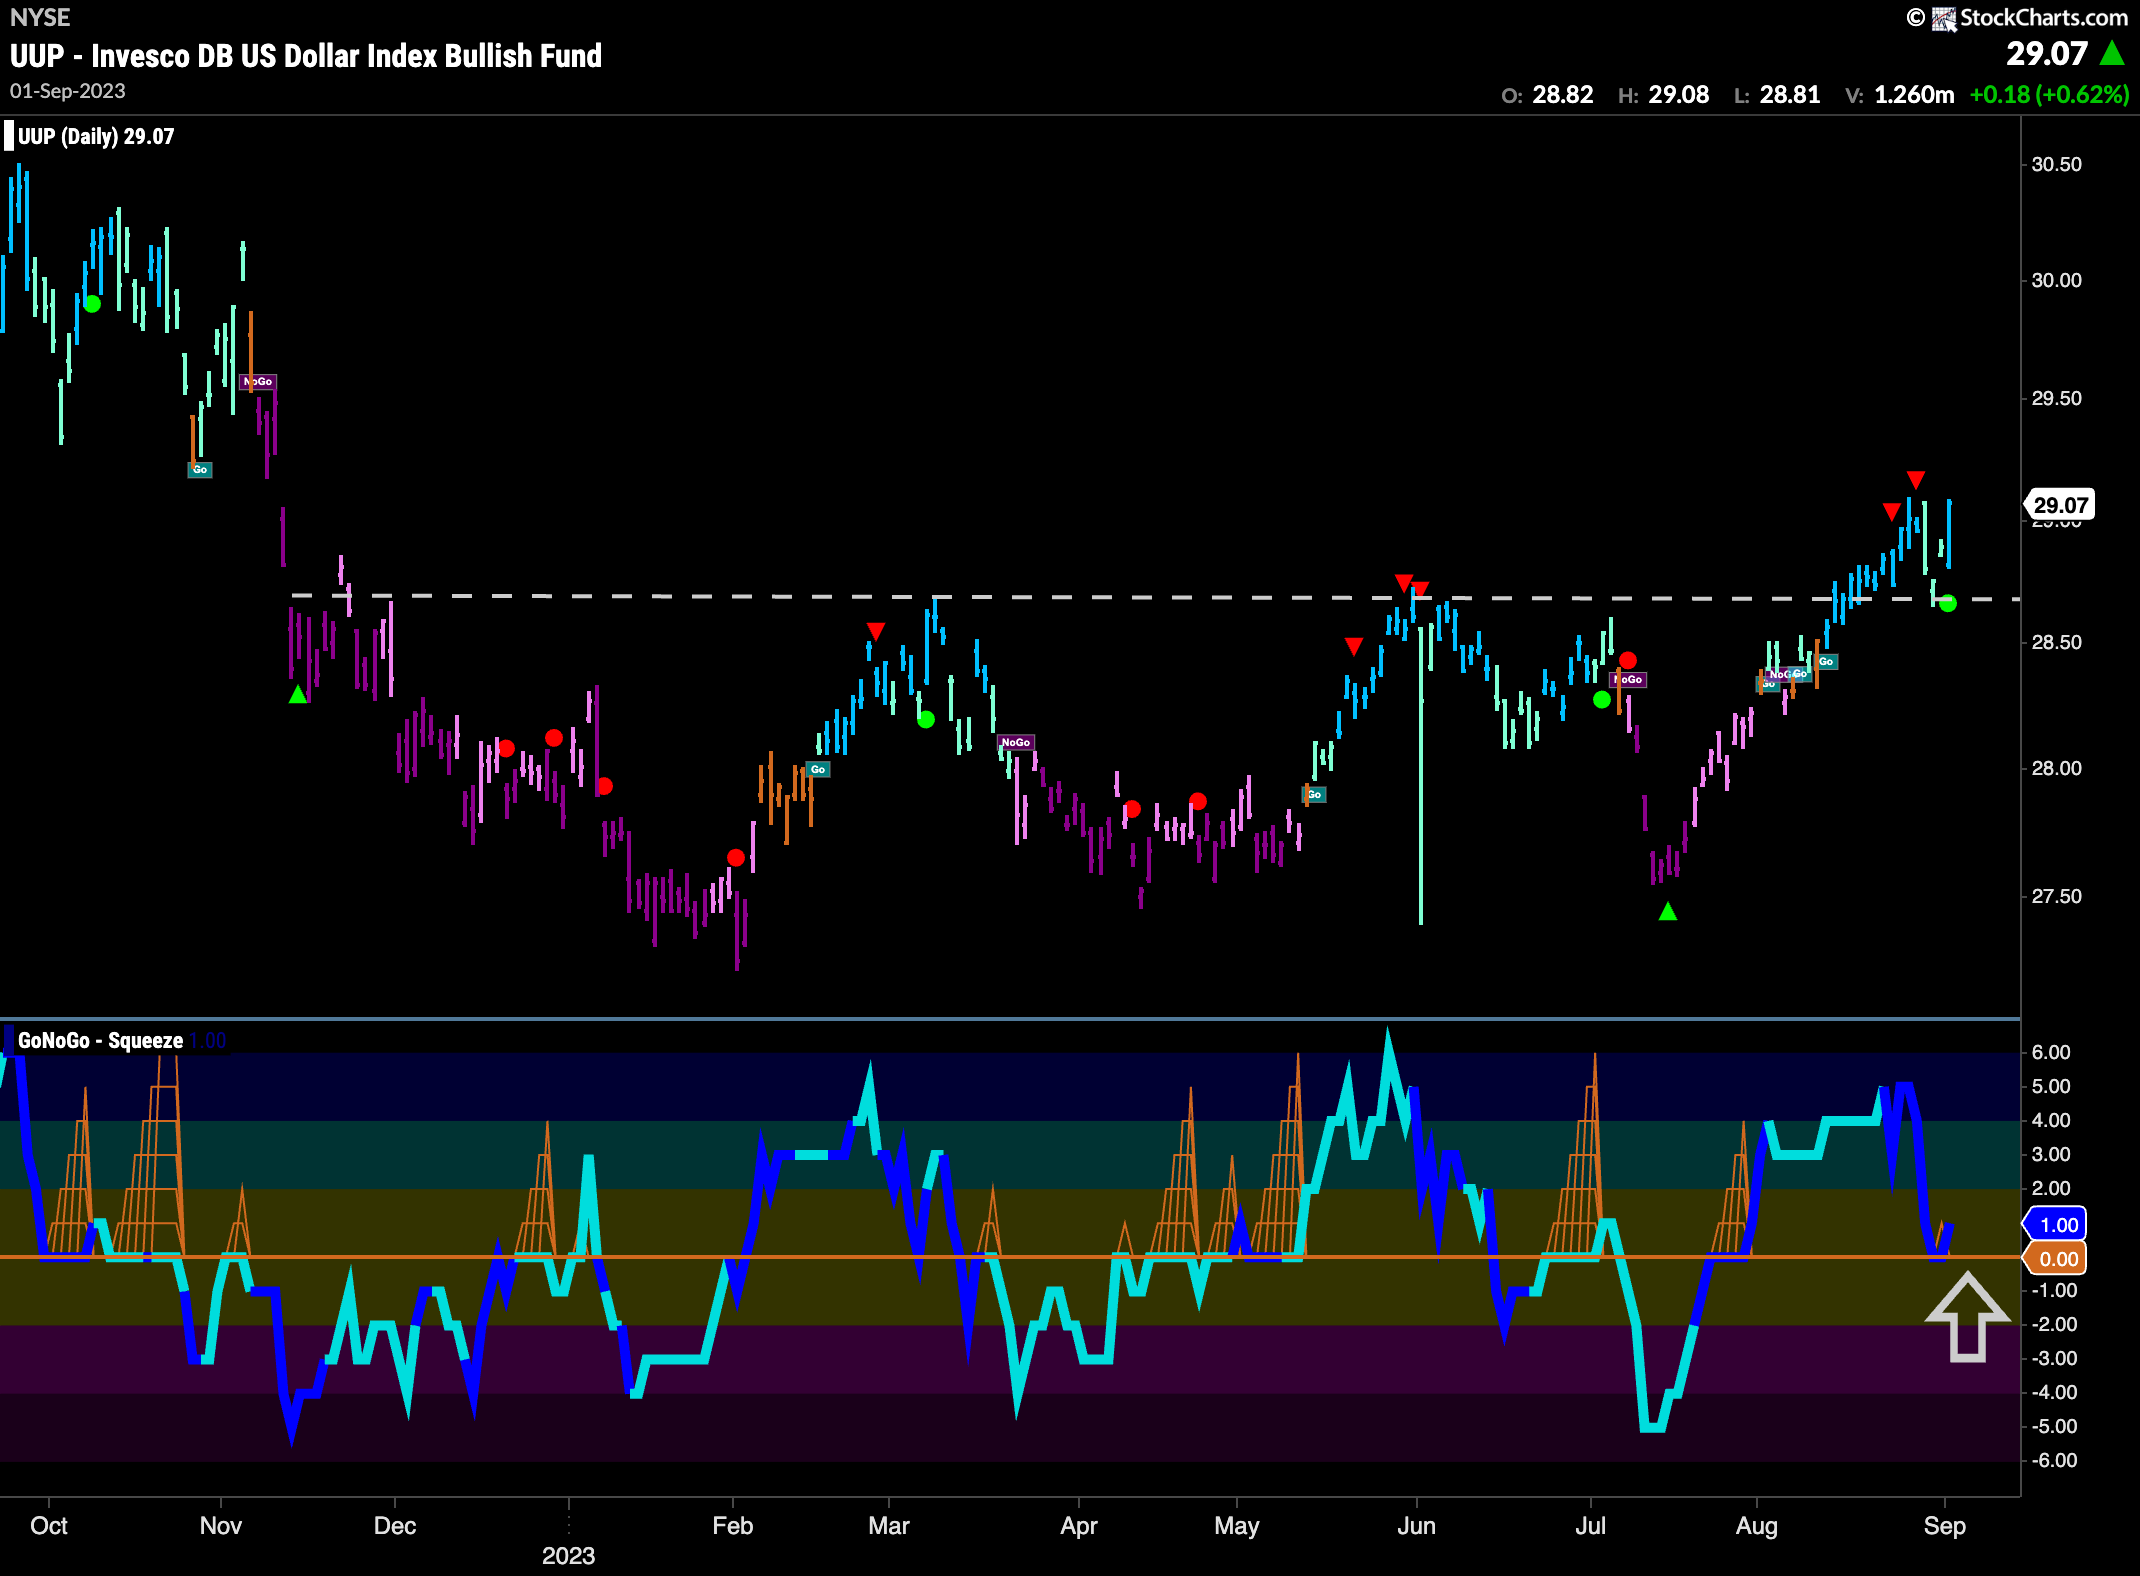
The daily chart below shows the price action that is driving the larger timeframe chart above. We can see that price quickly retested the support from what was horizontal resistance (concept of polarity) and has seen price once again move higher and GoNoGo Trend paints a strong blue “Go” bar as the week ends. GoNoGo Oscillator shows that it has found support at the zero line and volume is heavy. We will look for the greenback to make another higher high.
Oil Gaps Higher
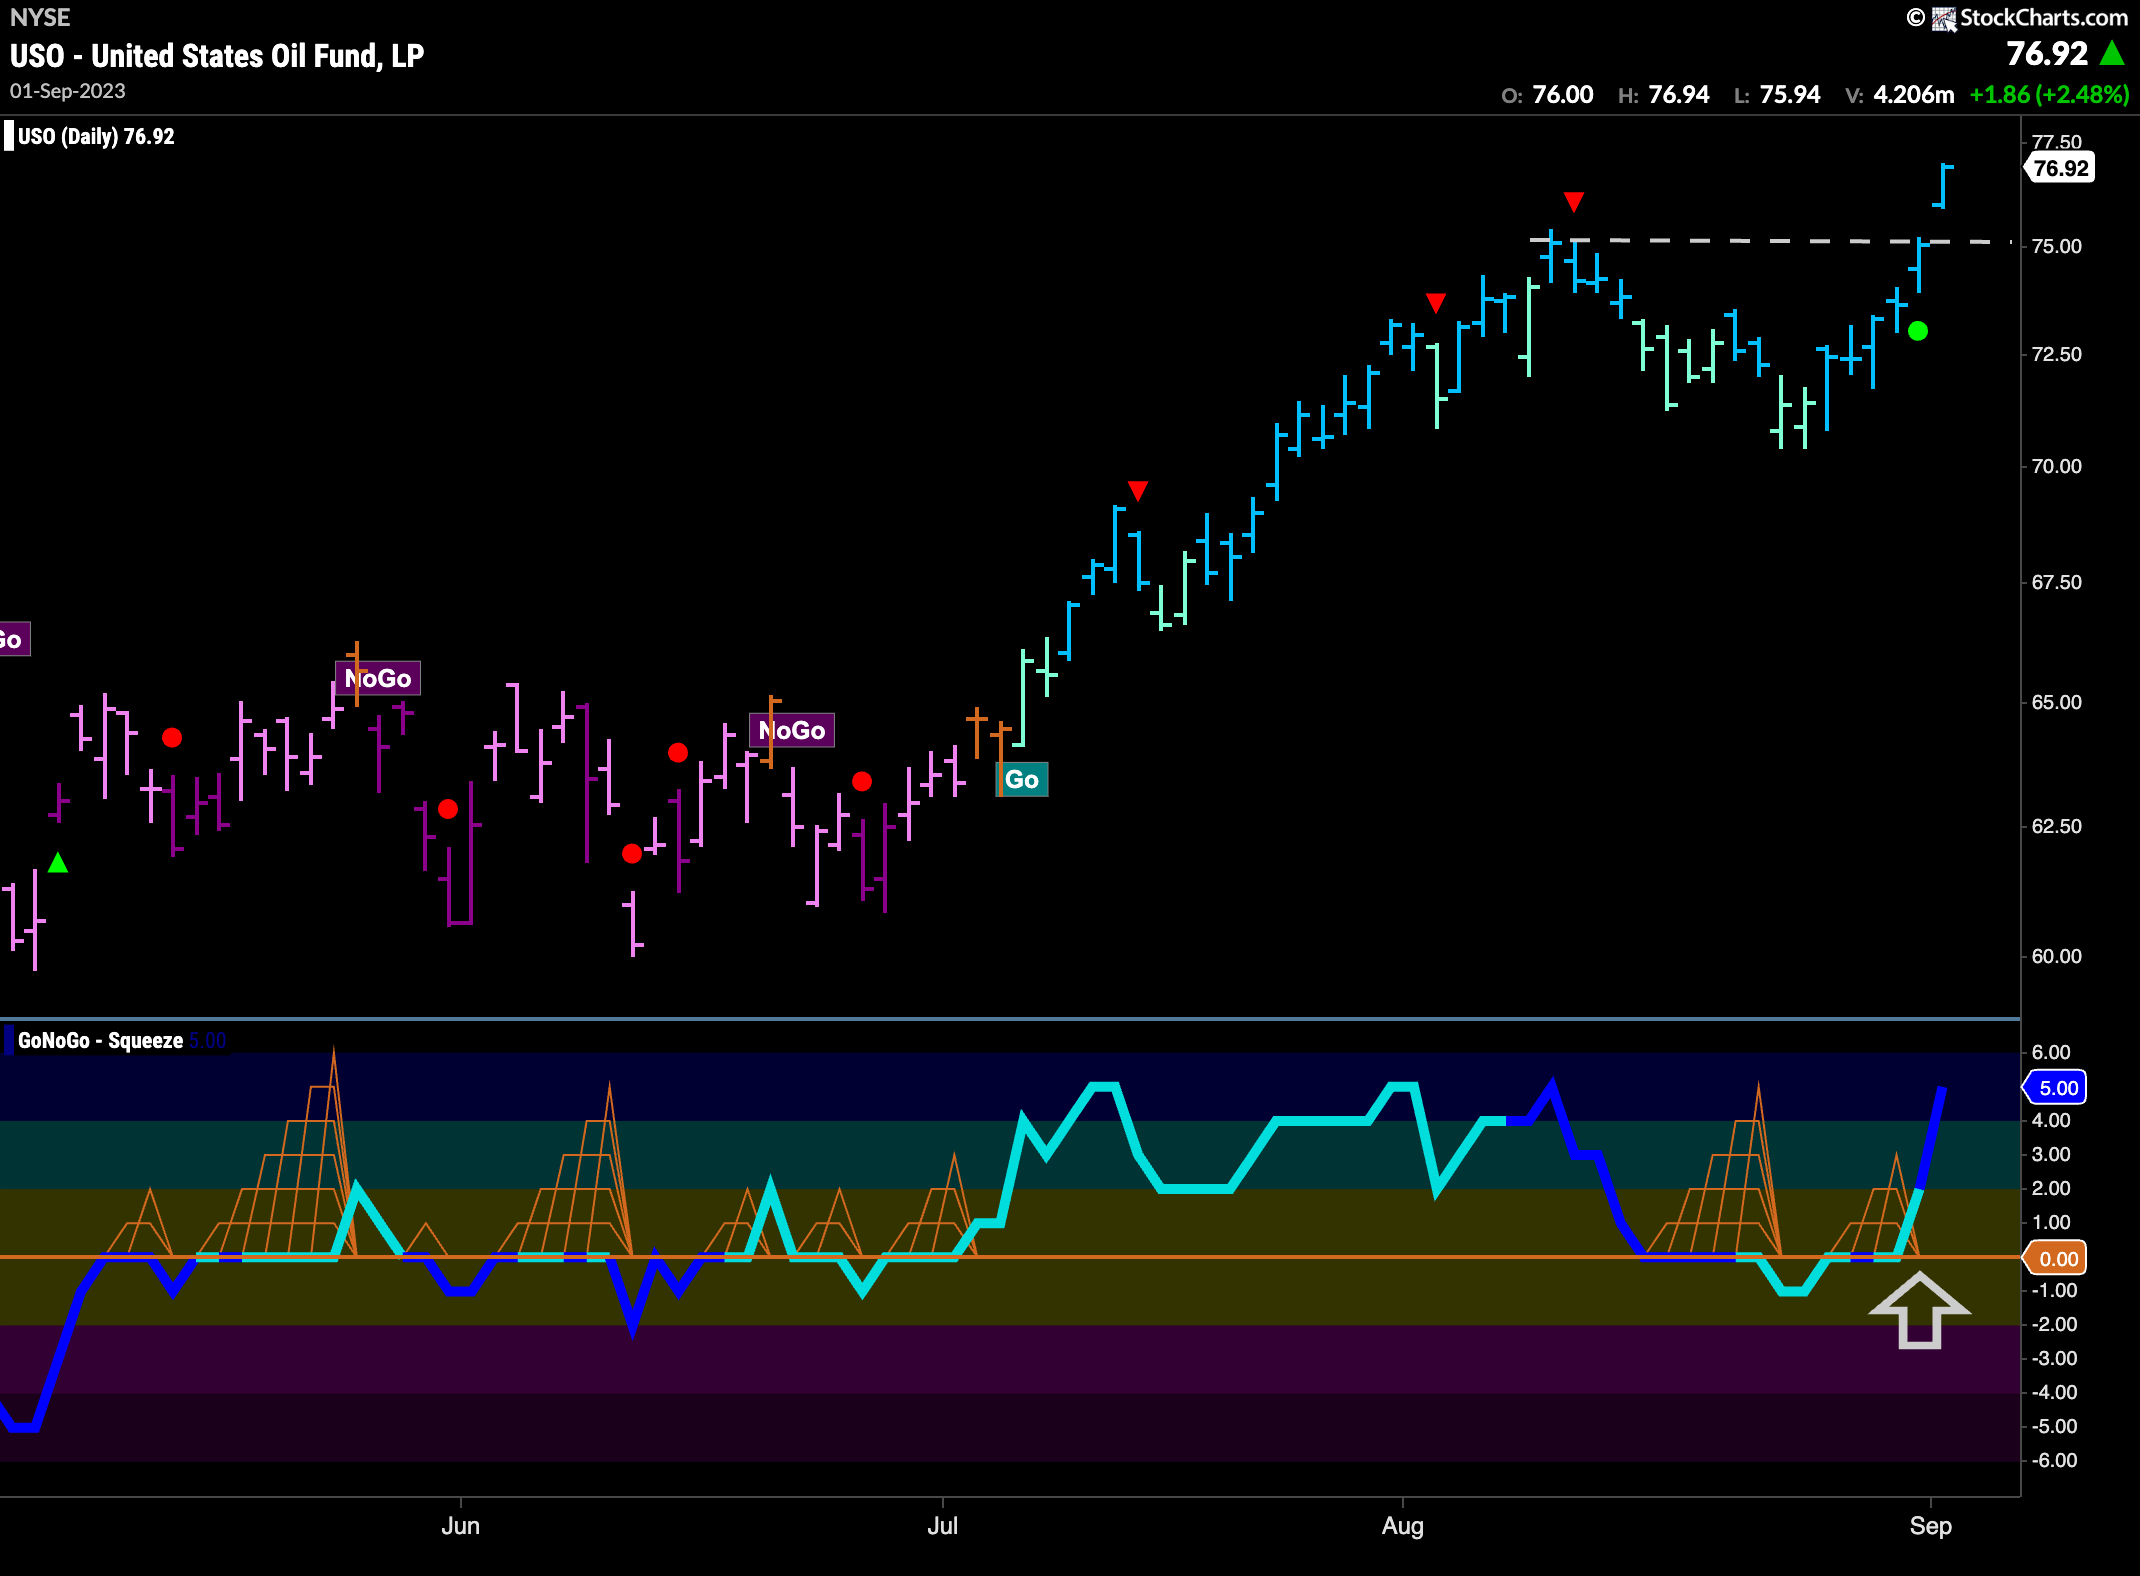
Now that oil has decided the path of least resistance is up, it is sailing higher. This week we saw price paint a string of strong blue “Go” bars as the final bar of the week gapped to new highs. GoNoGo Oscillator broke clearly into positive territory slightly ahead of the gap and that triggered a Go Trend Continuation Icon (green circle) under price that told us momentum was resurgent in the direction of the “Go” trend.
Gold in Moment of Uncertainty
GoNoGo Trend shows that investors are not convinced regarding the direction of the precious metal’s prices. We can see that the indicator has painted 4 amber “Go Fish” bars and the last bar saw price fall. We note that GoNoGo Oscillator has broken above the zero line this past week so that suggests a bullishness that could steer gold toward a “Go” trend.
Sector RelMap
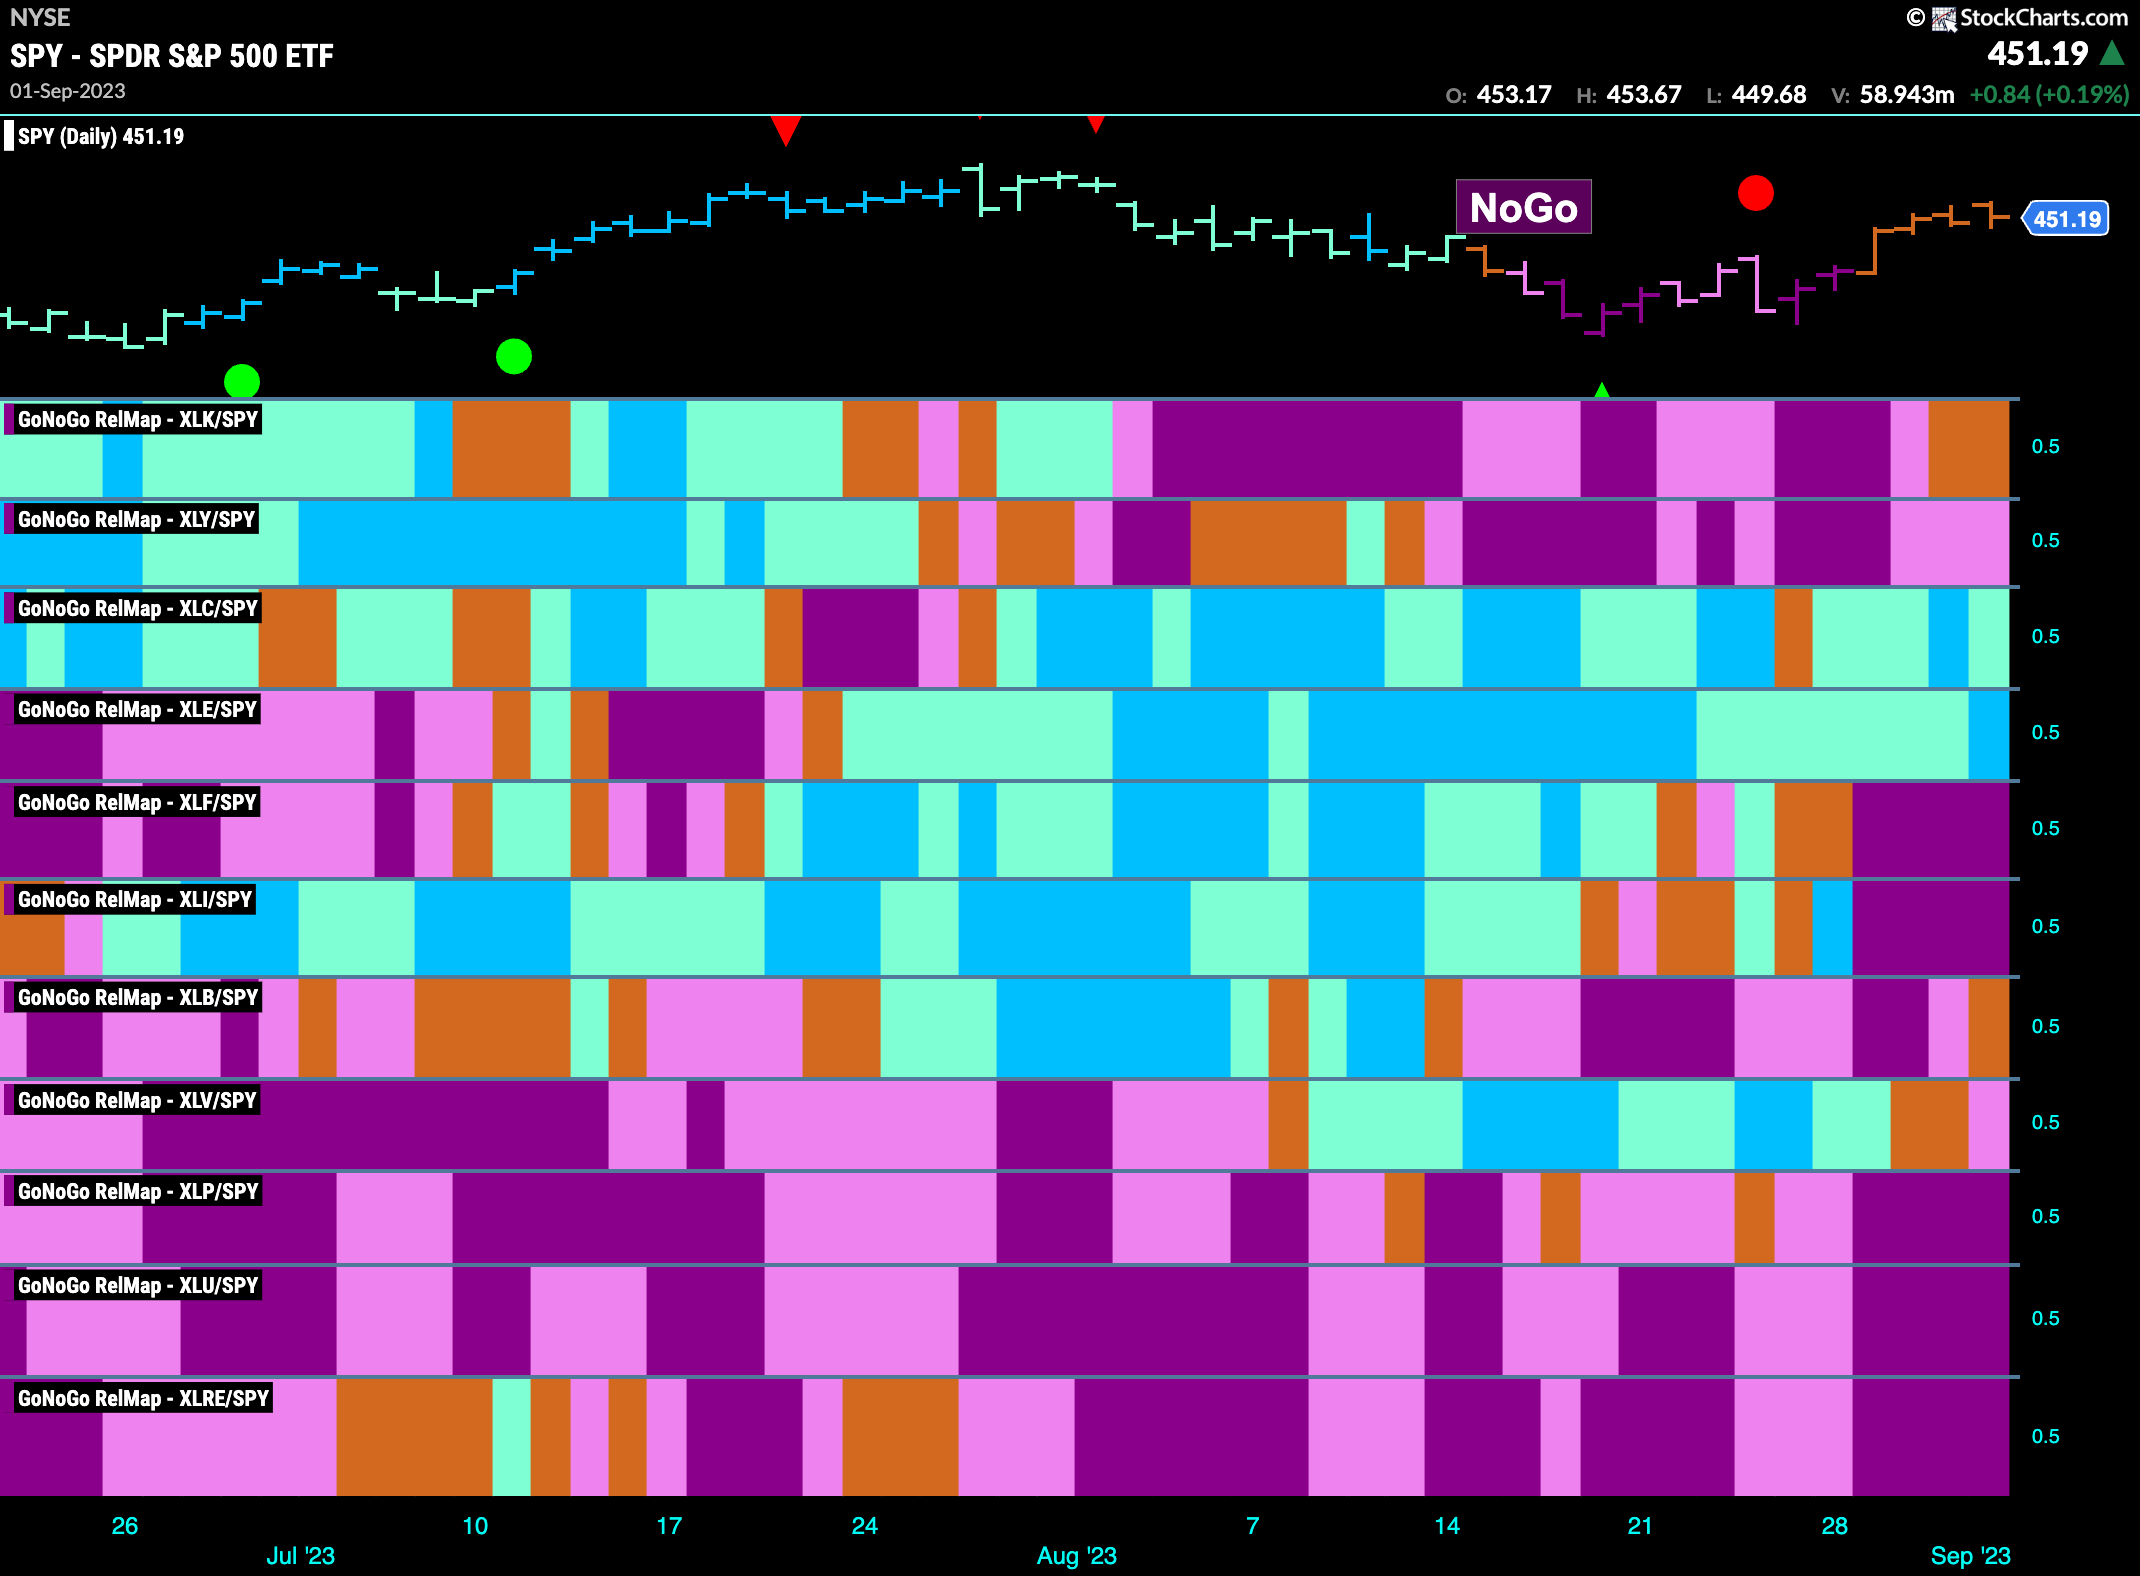
Below is the GoNoGo Sector RelMap. This GoNoGo RelMap applies the GoNoGo Trend to the relative strength ratios of the sectors to the base index. Looking at this map, we can quickly see where the relative outperformance is coming from as well as which sectors are lagging on a relative basis. 2 sectors are outperforming the base index this week. $XLC, and $XLE are painting “Go” bars.
Energy Looking Strong in Leadership Role
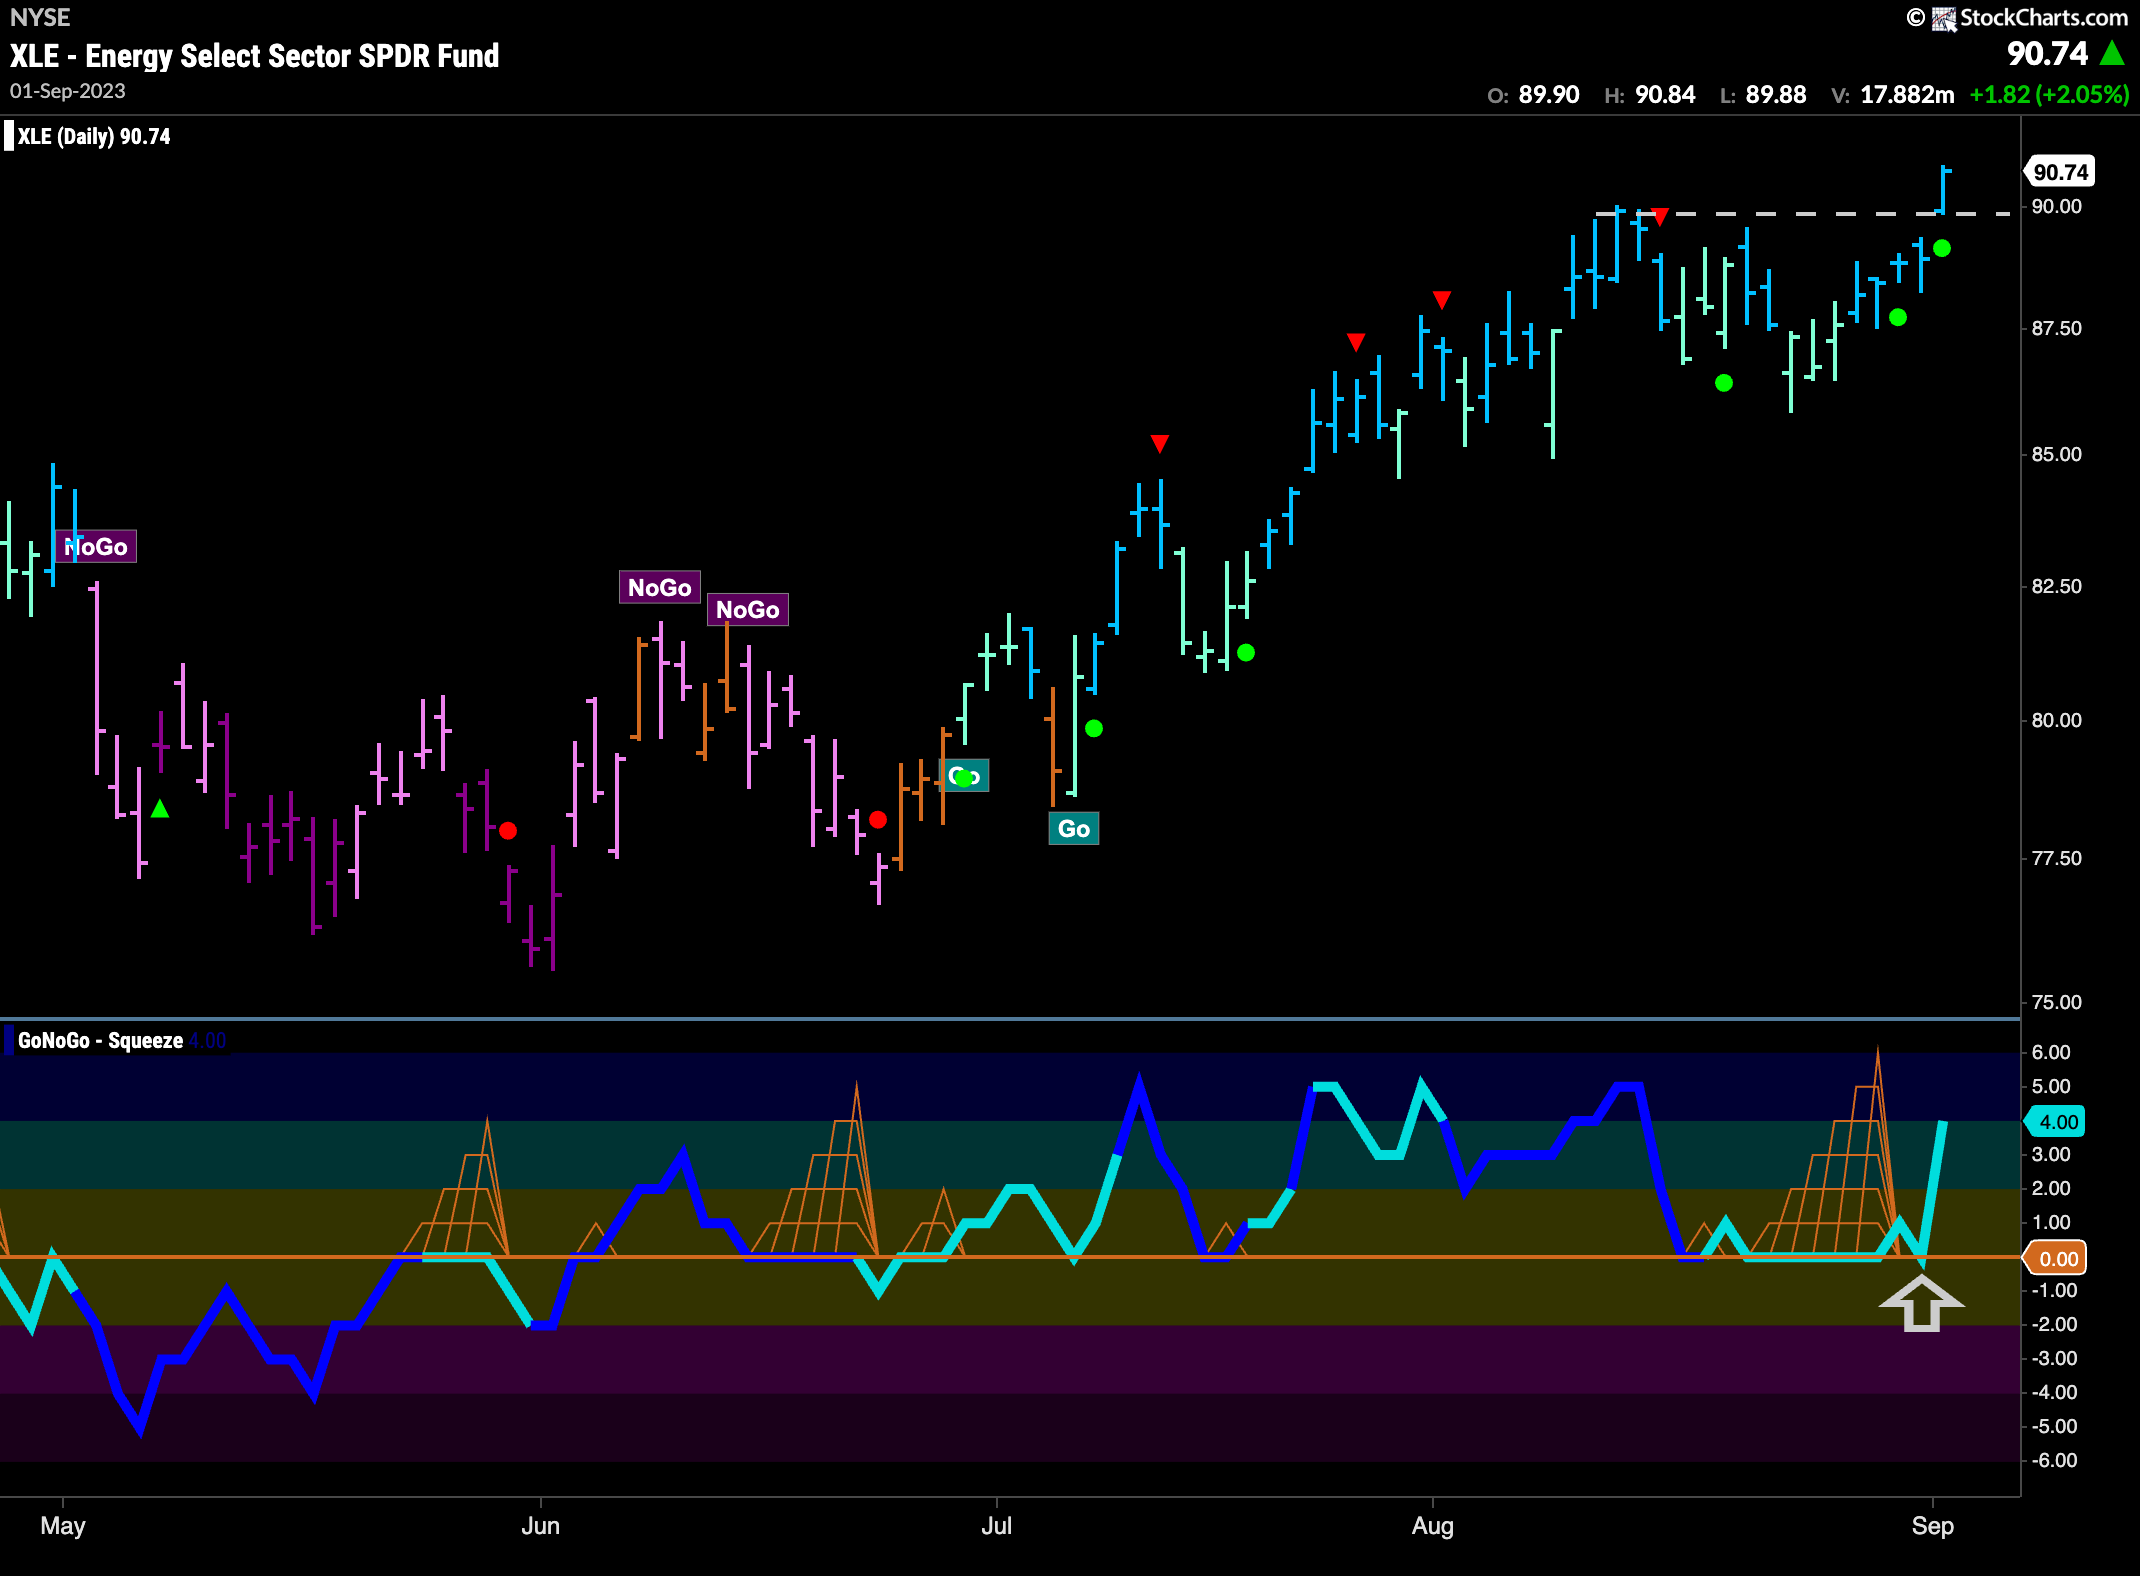
The GoNoGo Sector RelMap continues to show that energy is leading. We looked into the sub groups last week but let’s take a deeper dive into the $XLE itself. The chart below shows the GoNoGo Chart with daily prices. We can see that much like the $USO chart the energy sector saw price gap to a new high this week as GoNoGo Oscillator rallied out of a Max GoNoGo Squeeze. We now have signs of Go Trend Continuation as price is in a “Go” trend with positive momentum.
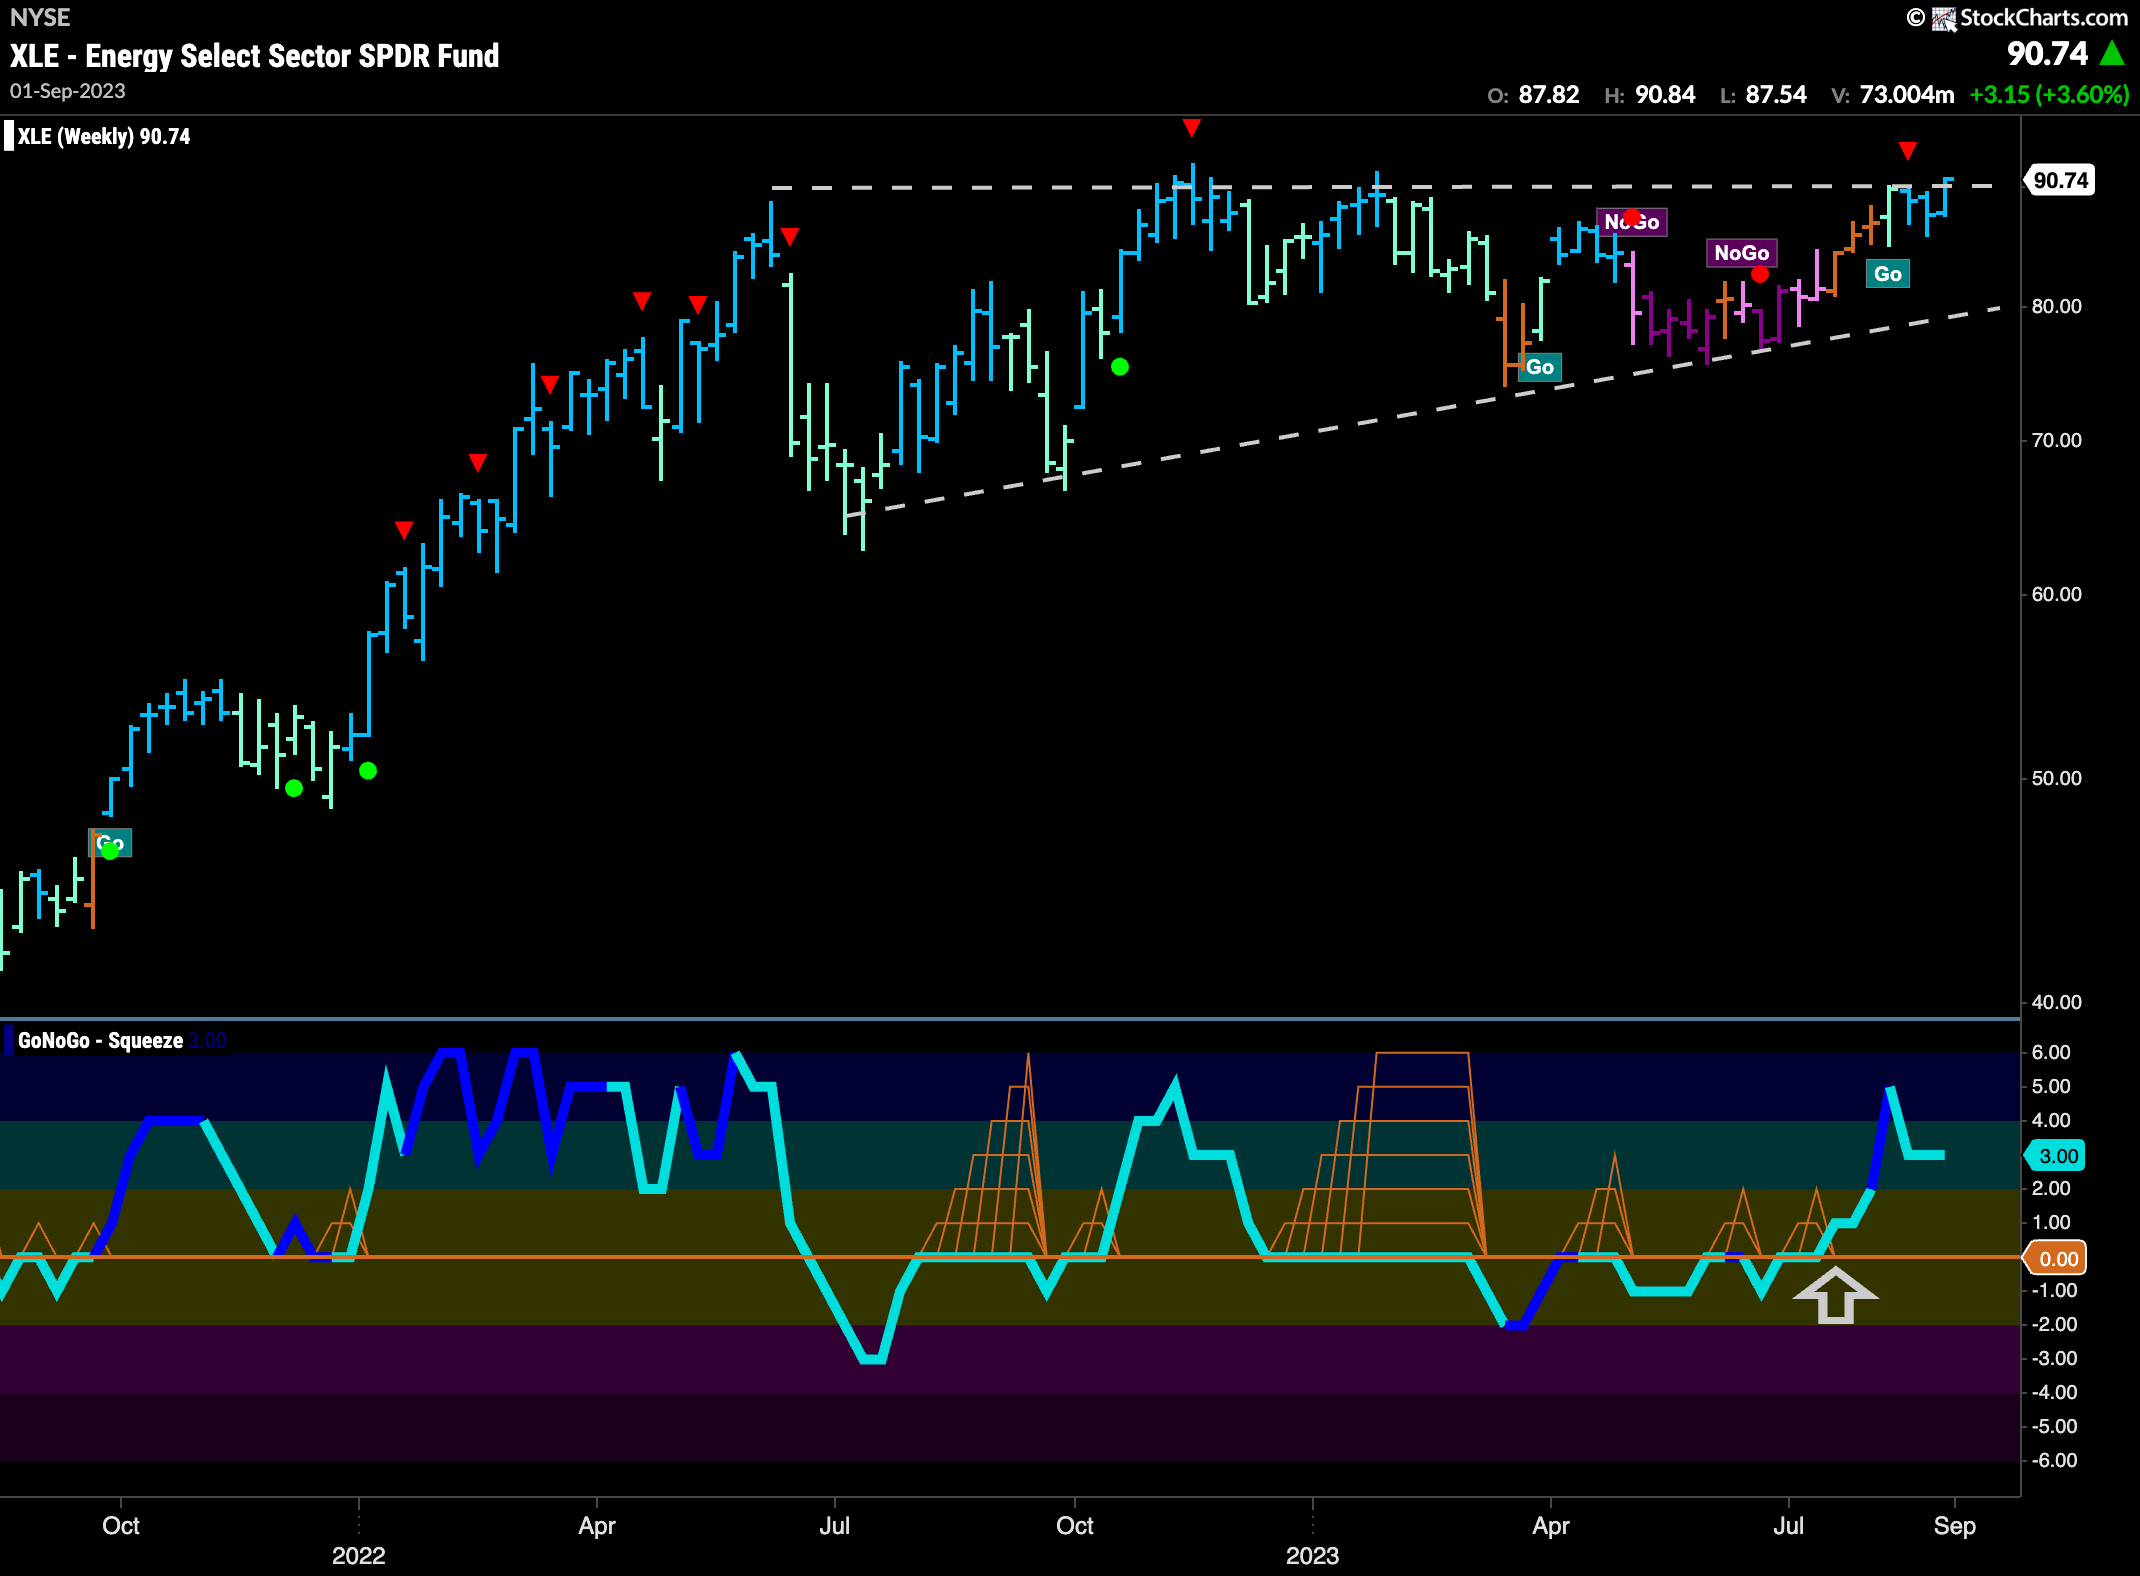
The weekly chart of $XLE shows a large ascending triangle that could be setting up to be a continuation pattern. The signs are there. Price has rallied to the right side of the pattern with higher lows and GoNoGo Trend has been able to start painting “Go” bars after a brief “NoGo” correction. Now, testing the upper bound, we see strong “Go” bars and GoNoGo Oscillator in positive territory confirming the move.
Energy Relative Strength
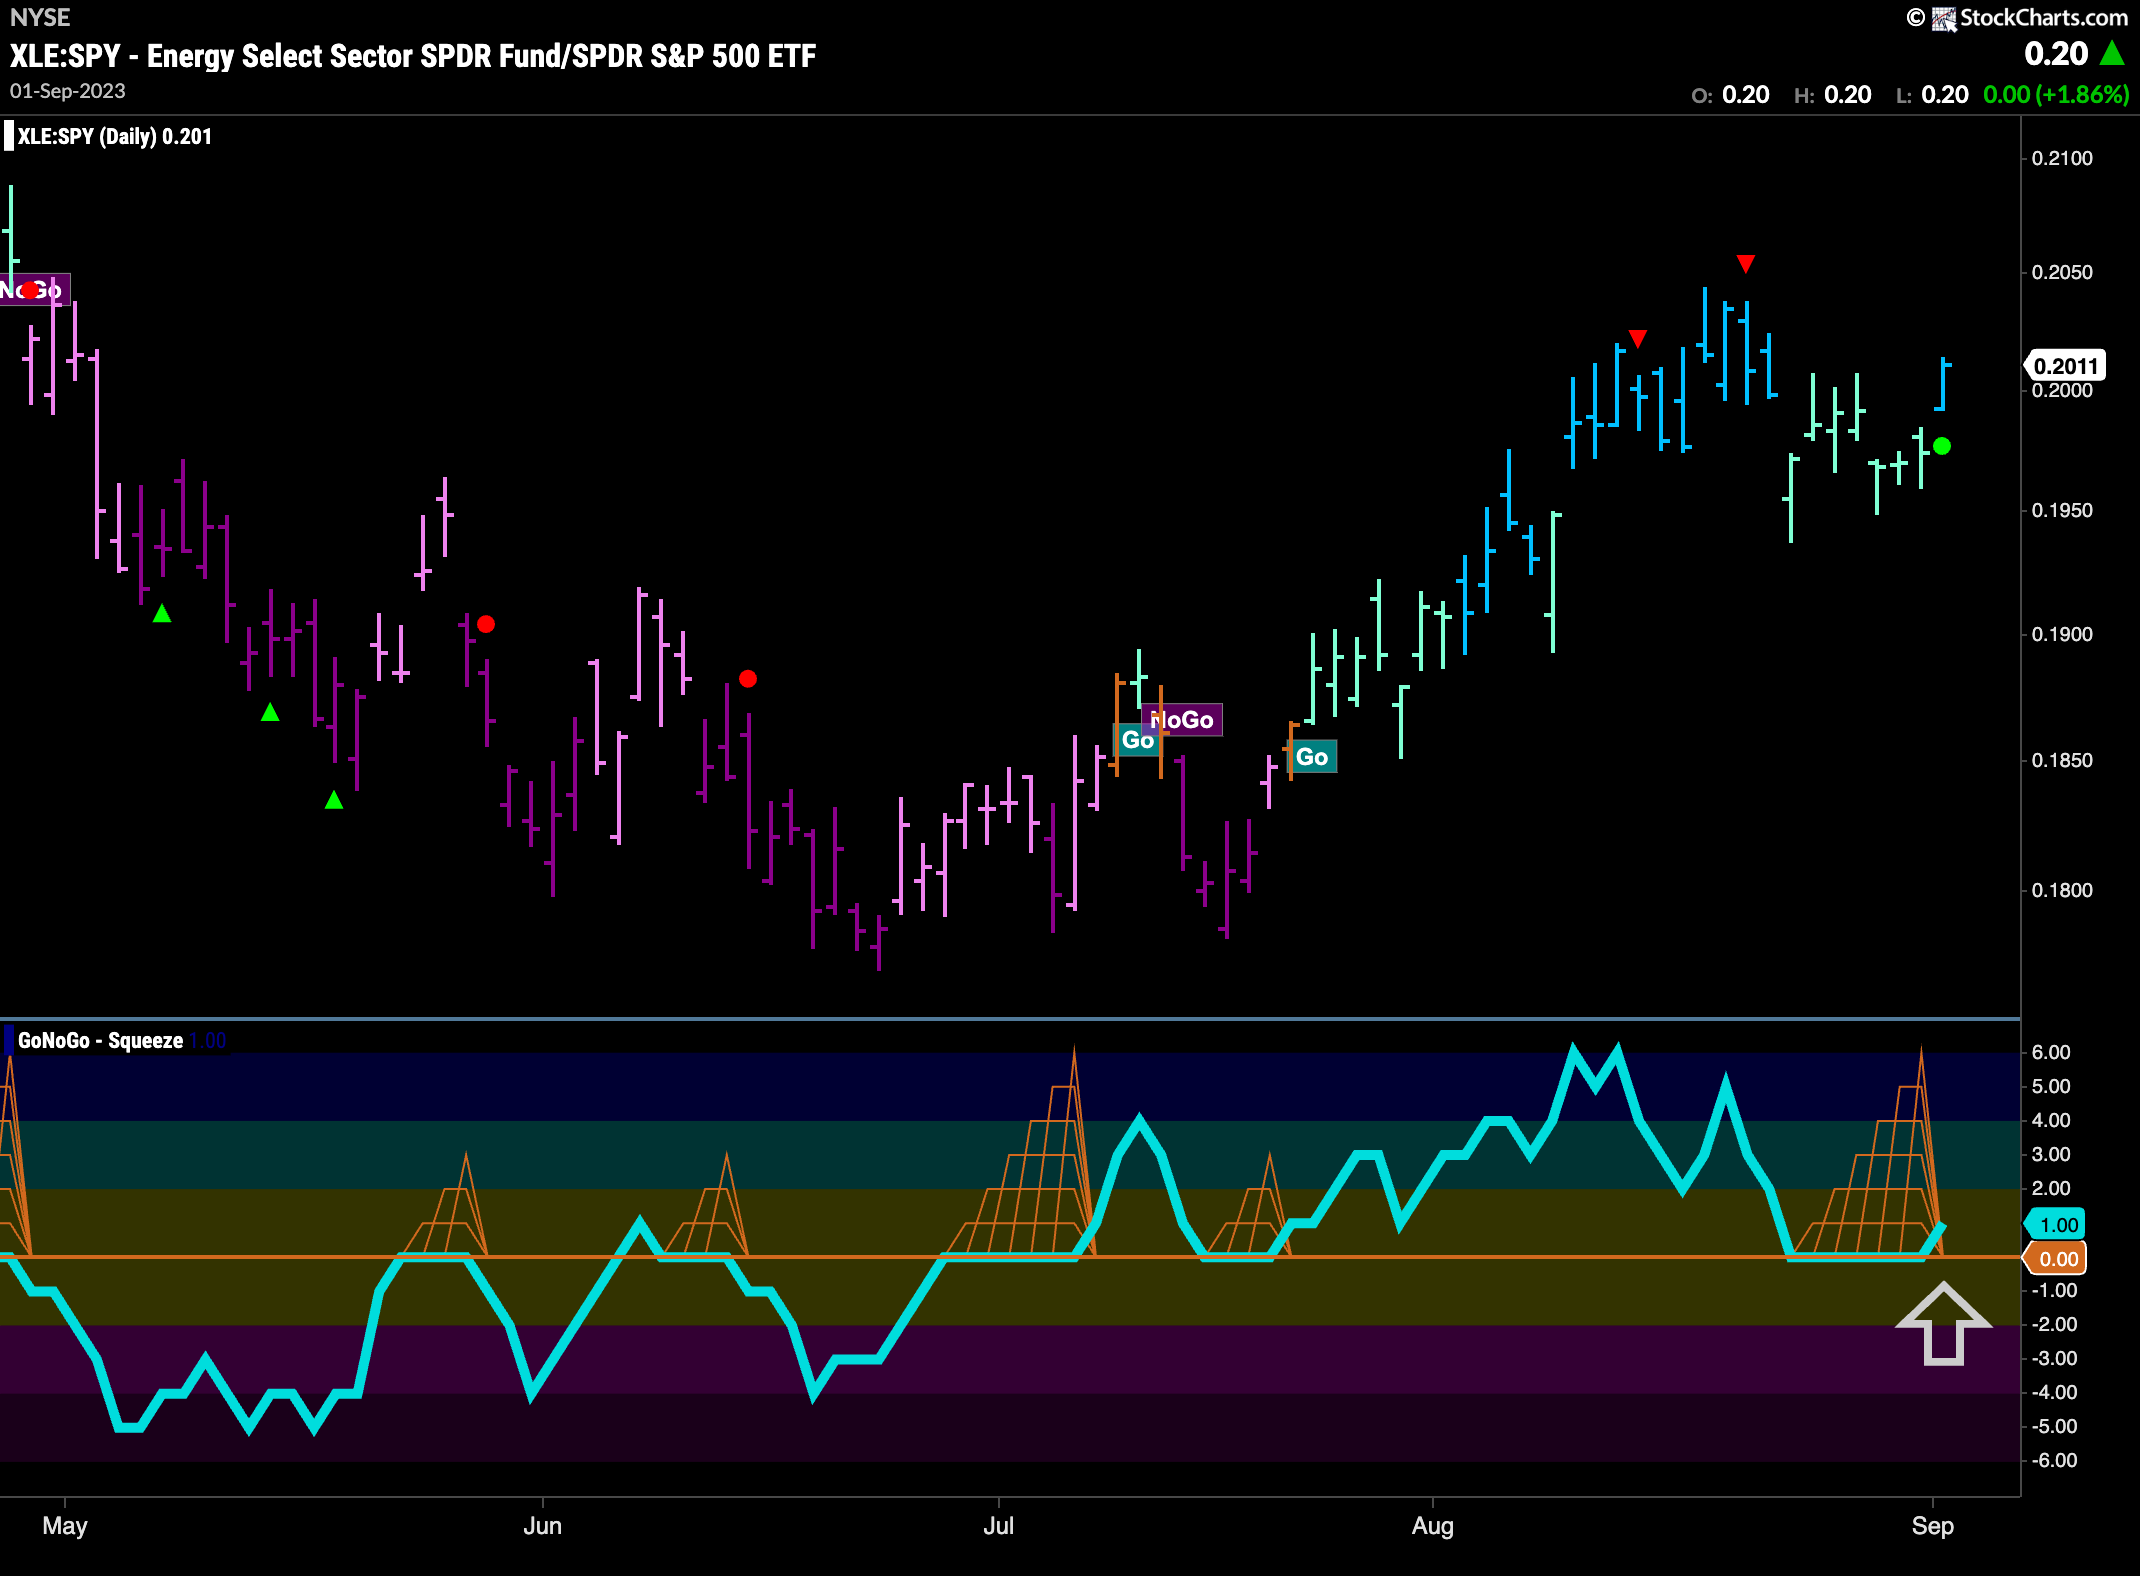
The chart below shows the GoNoGo Chart on the relative strength ratio of $XLE to $SPY. We can see that GoNoGo Trend is painting a strong blue “Go” bar as the oscillator breaks out of a max GoNoGo Squeeze into positive territory. This suggests Go Trend Continuation for the ratio as well. We will look for the ratio to make an attempt at a new high.
$VLO Remains in Max GoNoGo Squeeze
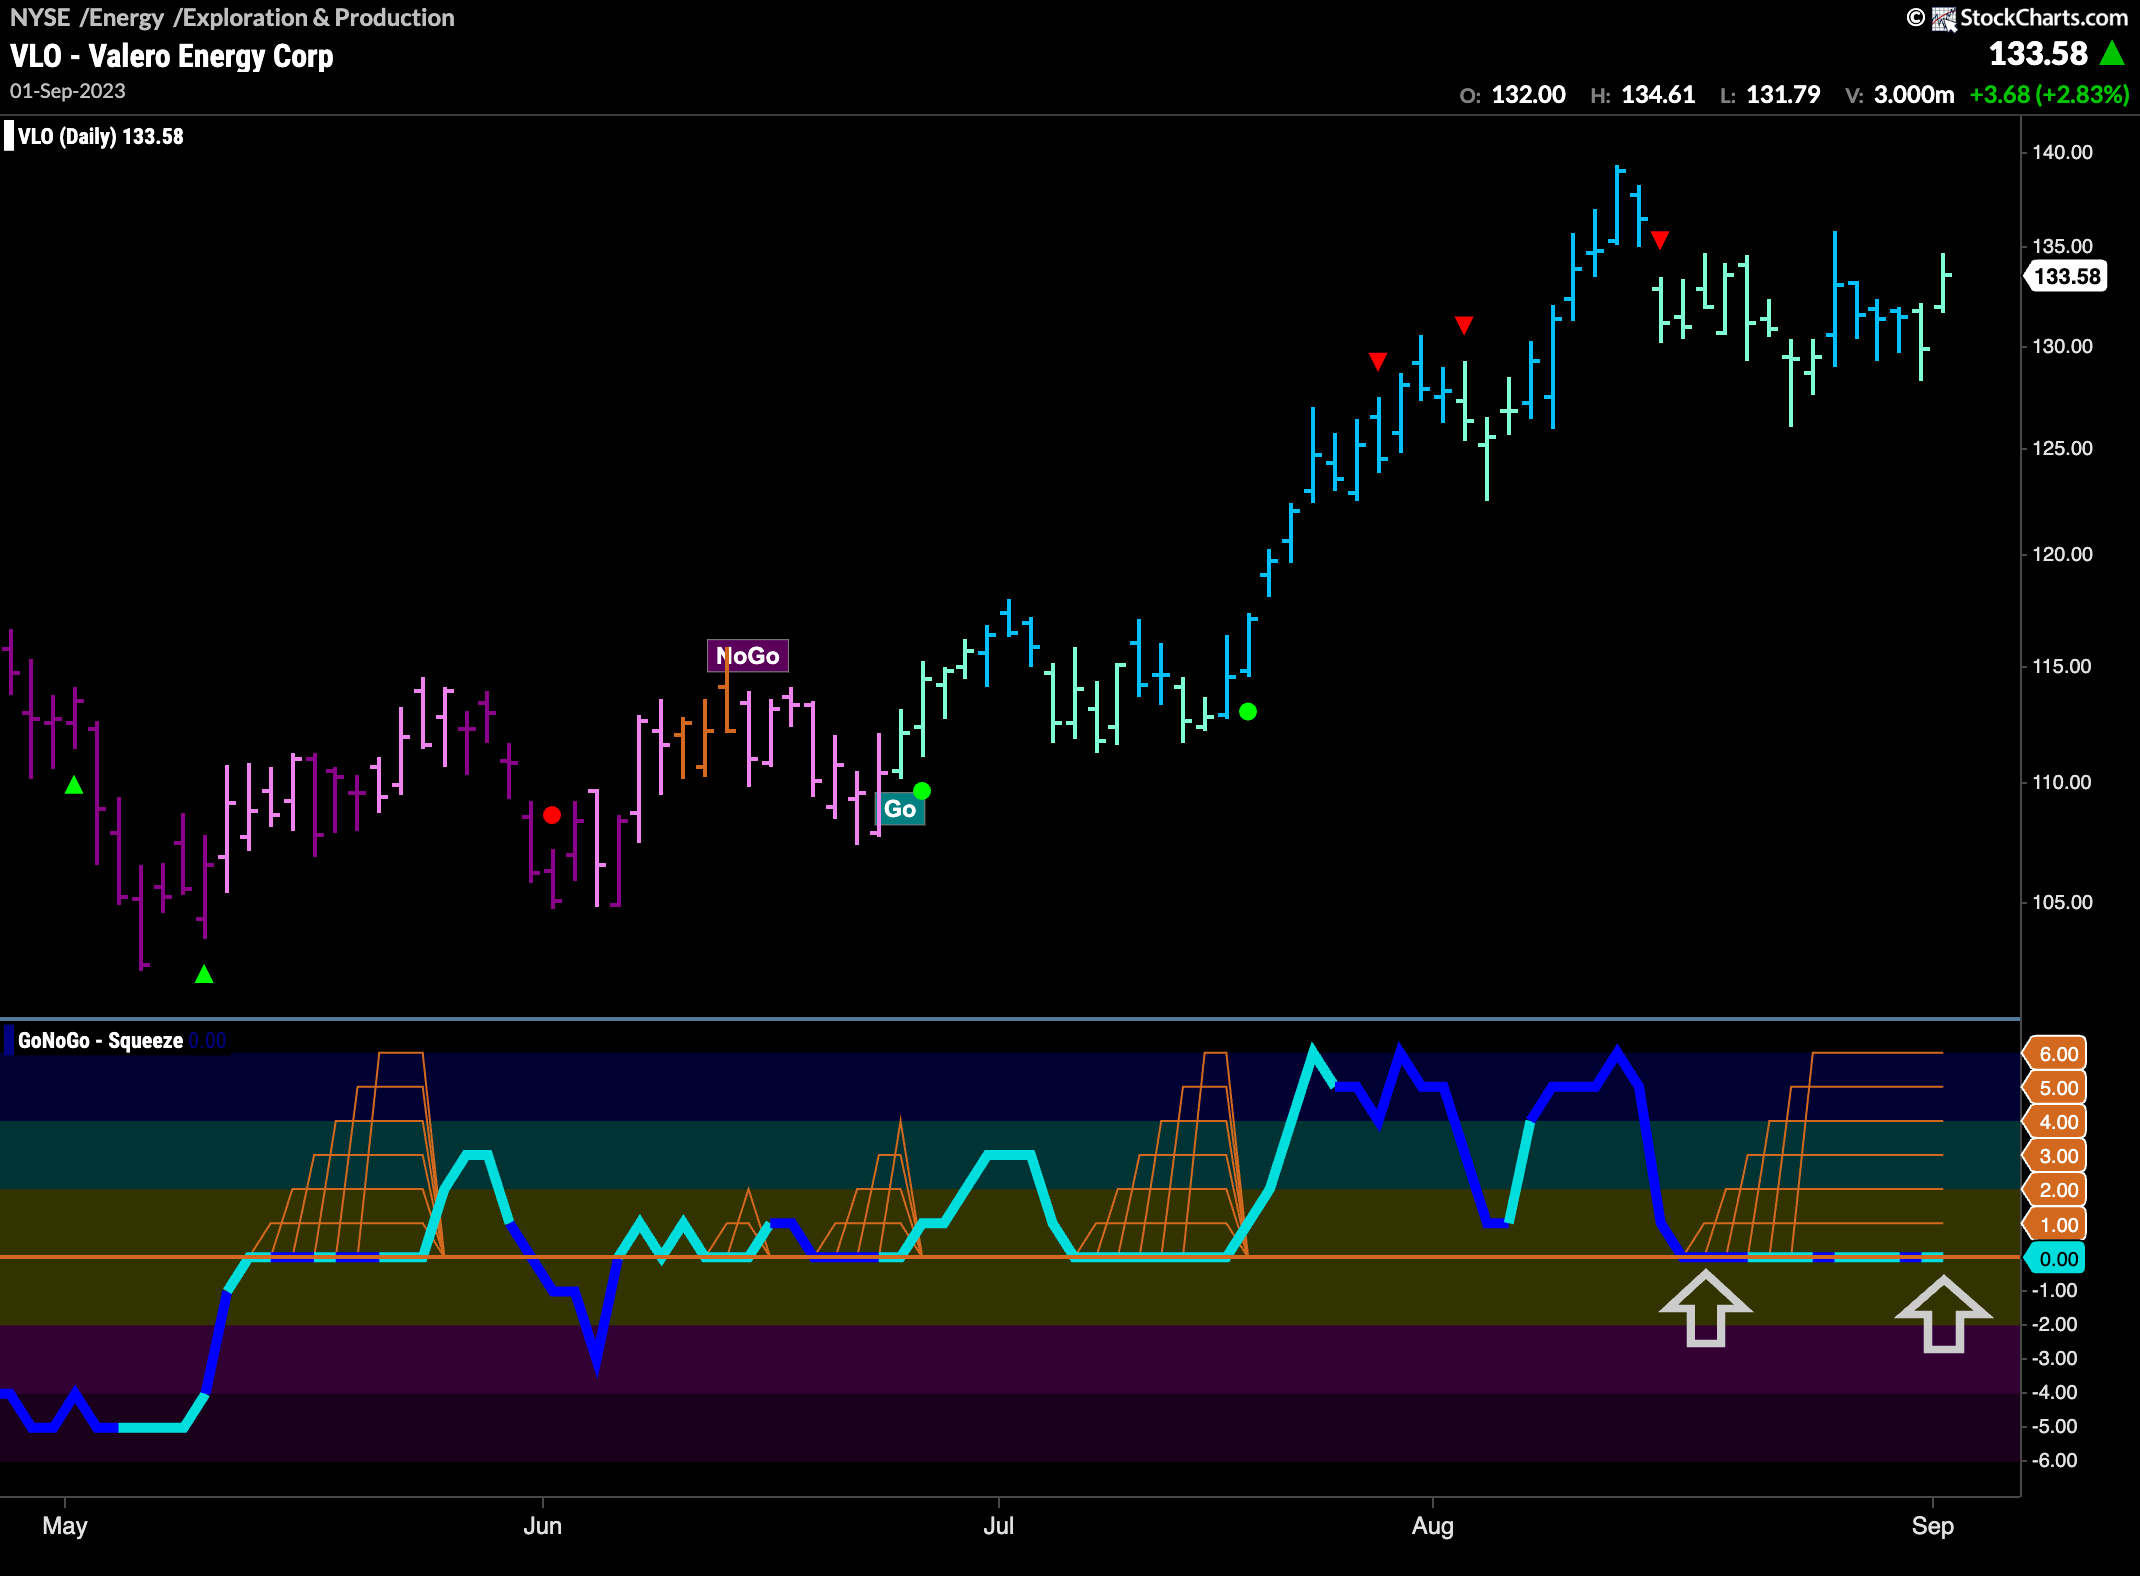
Last week we identified $VLO as a possible opportunity as we noted it was in a Max GoNoGo Squeeze. We are still waiting for Trend Continuation! As price continues to move sideways we see that the oscillator remains stuck at zero with a Max GoNoGo Squeeze in place. Given the strength of the energy sector we still favor the possibility of a break of the Squeeze into positive territory which would give us a Trend Continuation Green Circle.
$MRO Breaks Free
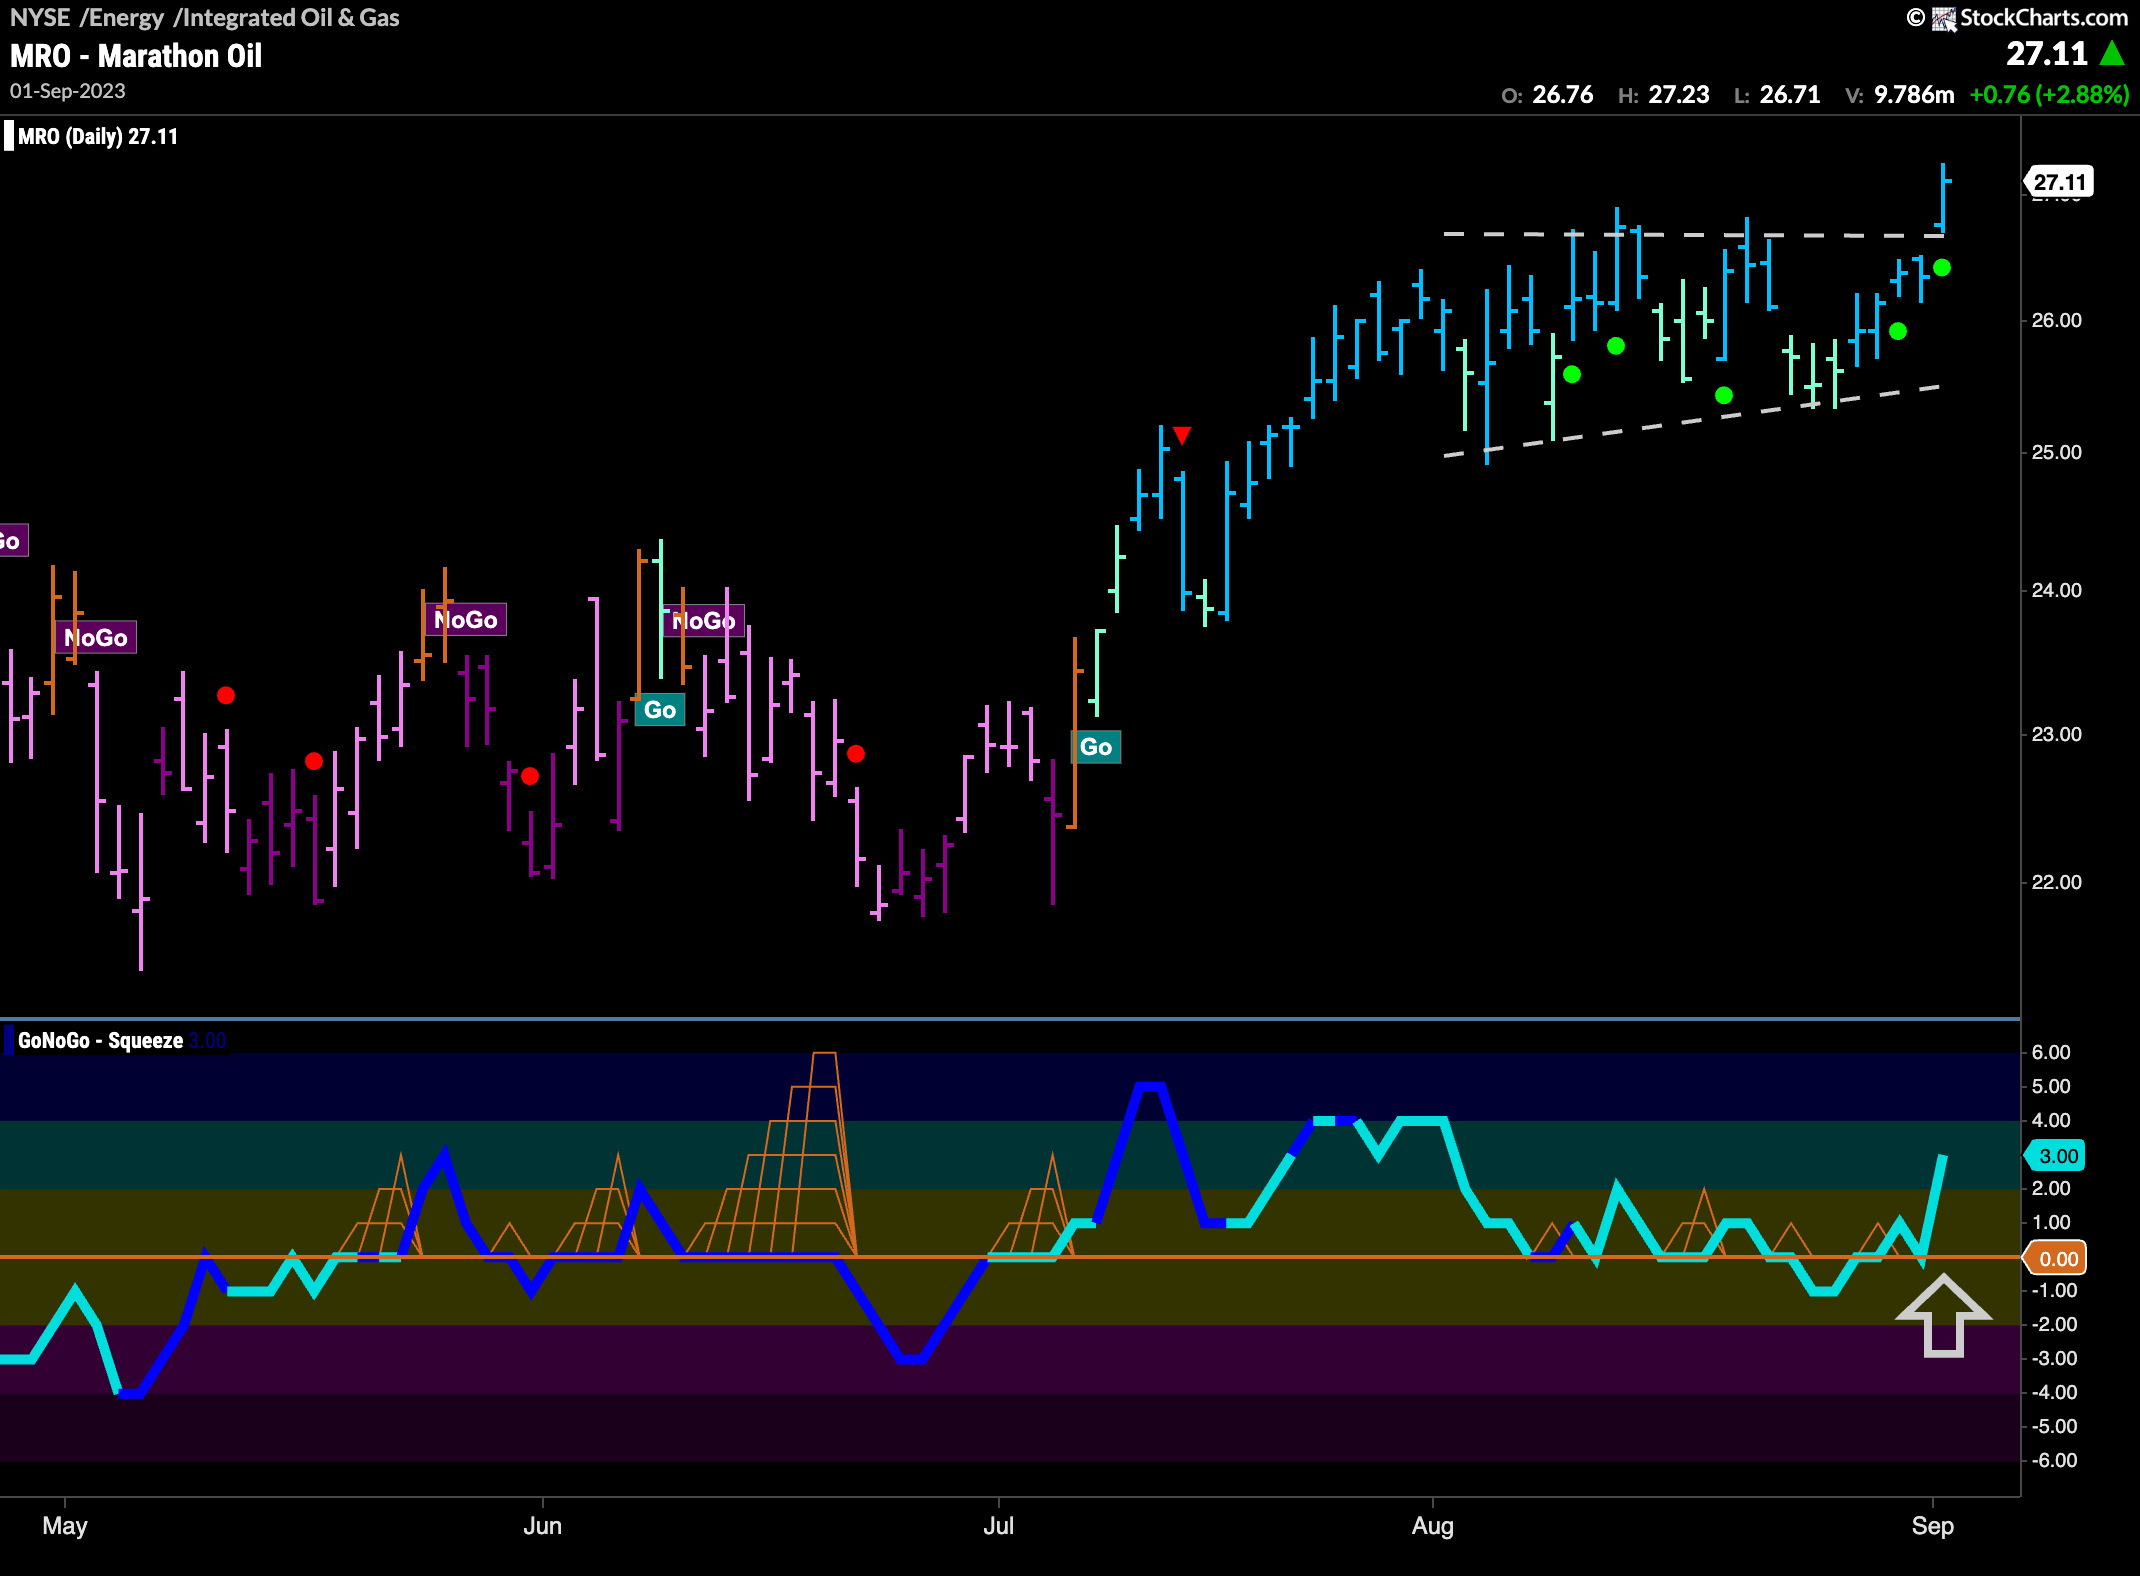
Scanning the sector, we find $MRO giving us a fresh Go Trend Continuation Icon (green circle). This is a security that is in a “Go” trend and last bar flagged resurgent momentum in the direction of the trend. This suggests price will likely go higher. We also note that price has broken out of the upper bound of an ascending triangle; another good sign.
