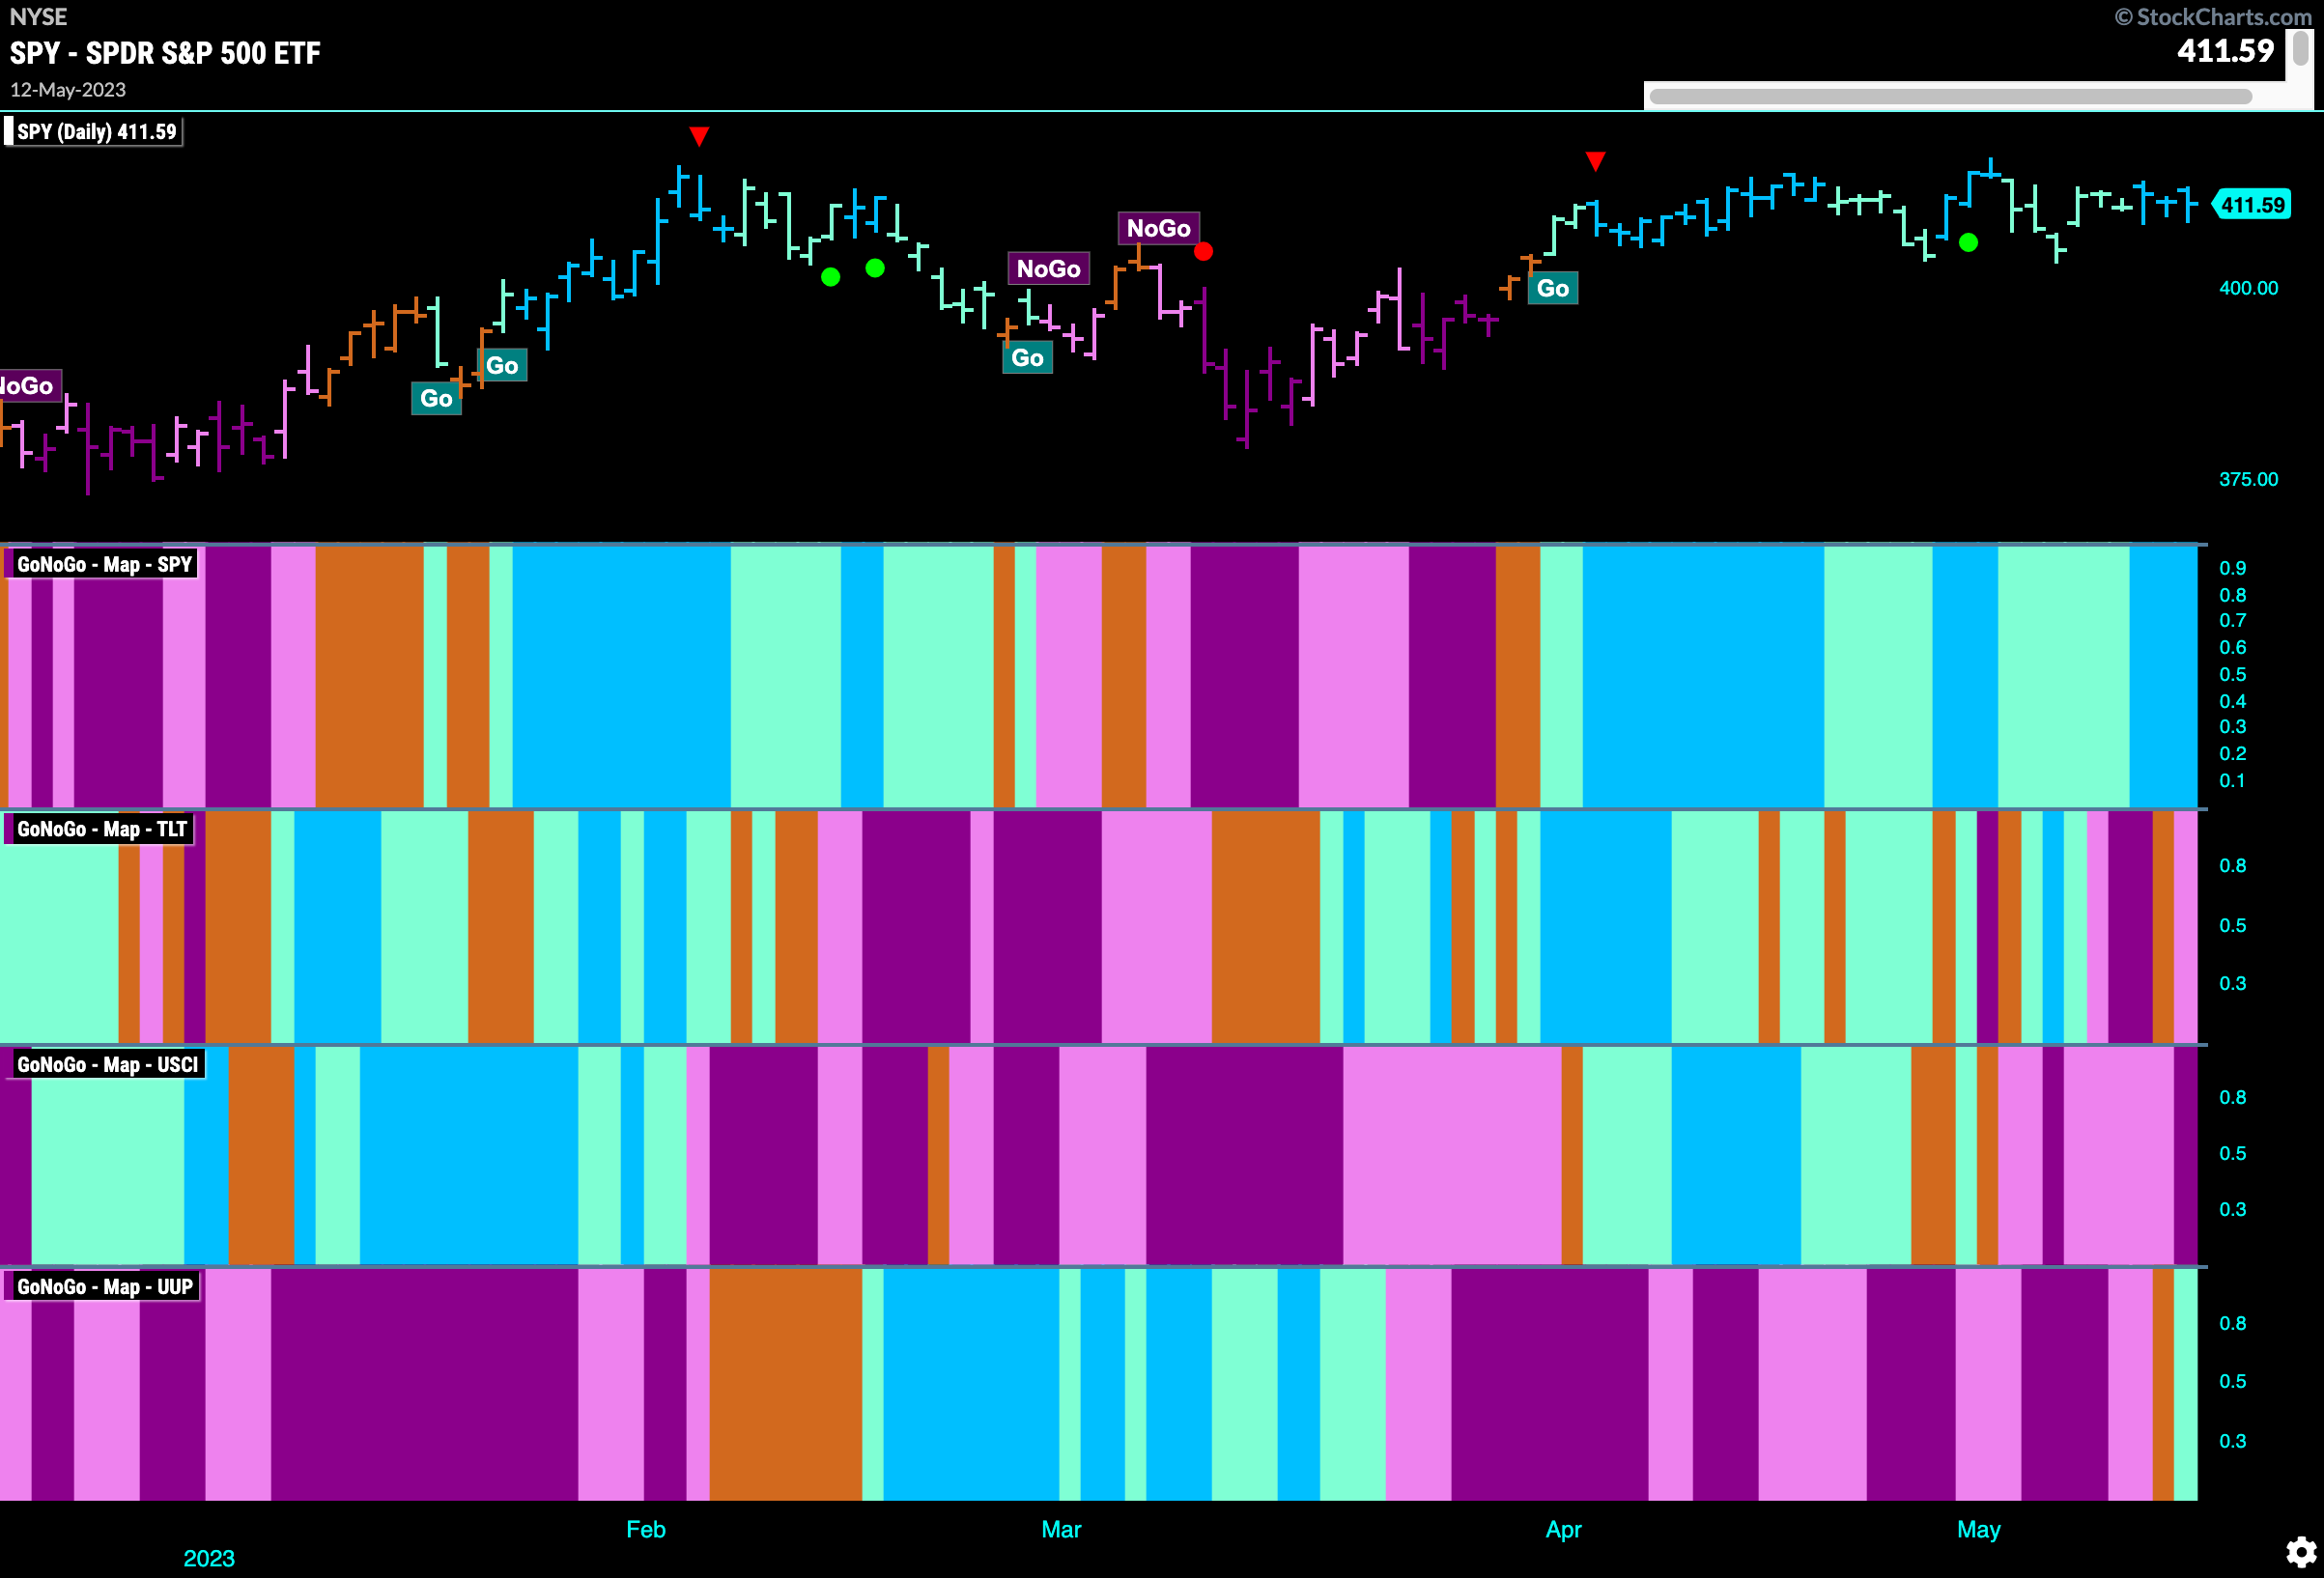
Good morning and welcome to this week’s Flight Path. As we can see from the Asset Map below, equities have managed to maintain the “Go” trend although as we will see later, the price has moved mostly sideways. Treasury bond prices are in a fresh “NoGo” and commodities continue to be in a “NoGo” trend. The dollar is the big change this week as strong price action over the last few trading sessions saw $UUP (the dollar fund) enter a new “Go”
Equities Continue to Move Sideways in “Go” trend
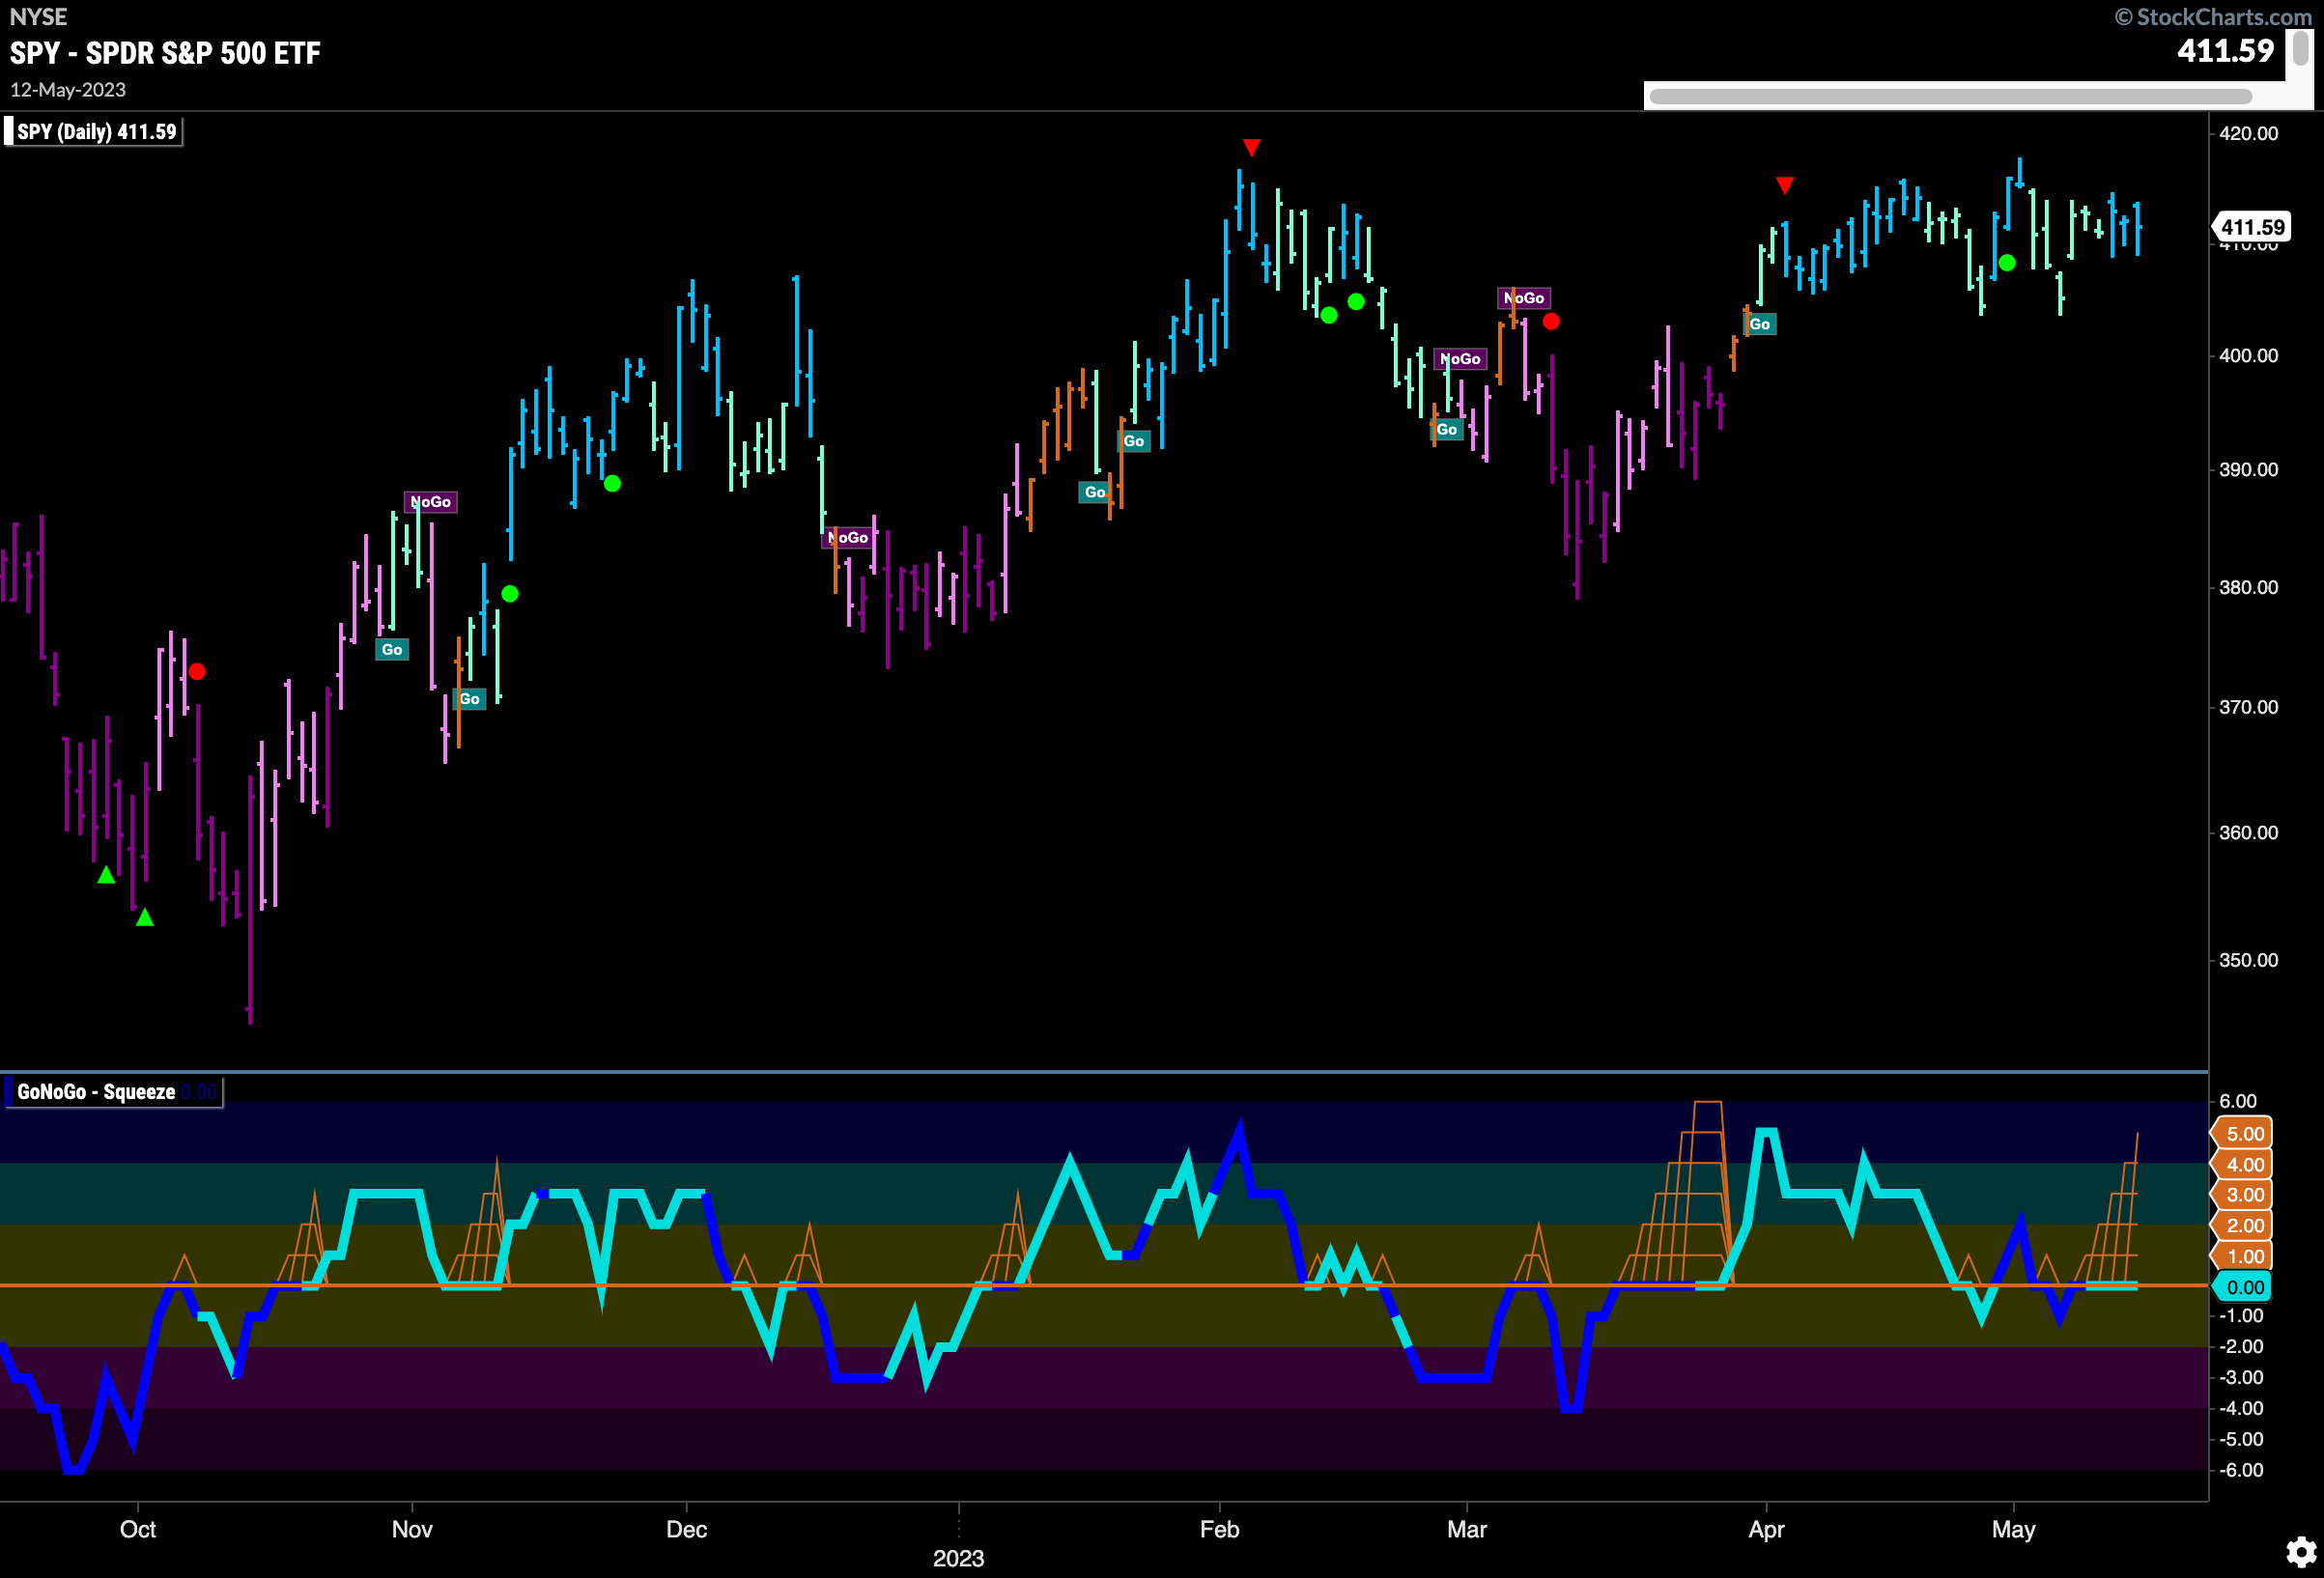
The resistance we mentioned last week is still making itself felt on the chart of $SPY this week. Price continues to ove mostly sideways but is able to hold on to “Go” colored bars. We will watch the lower panel for a hint at price’s next direction. What we see is that there is a tug of war happening as GoNoGo Oscillator finds itself stuck at the zero line again. We will watch to see in which direction the Oscillator breaks out of the GoNoGo Squeeze. A move back into positive territory could indicate an attack on new highs.
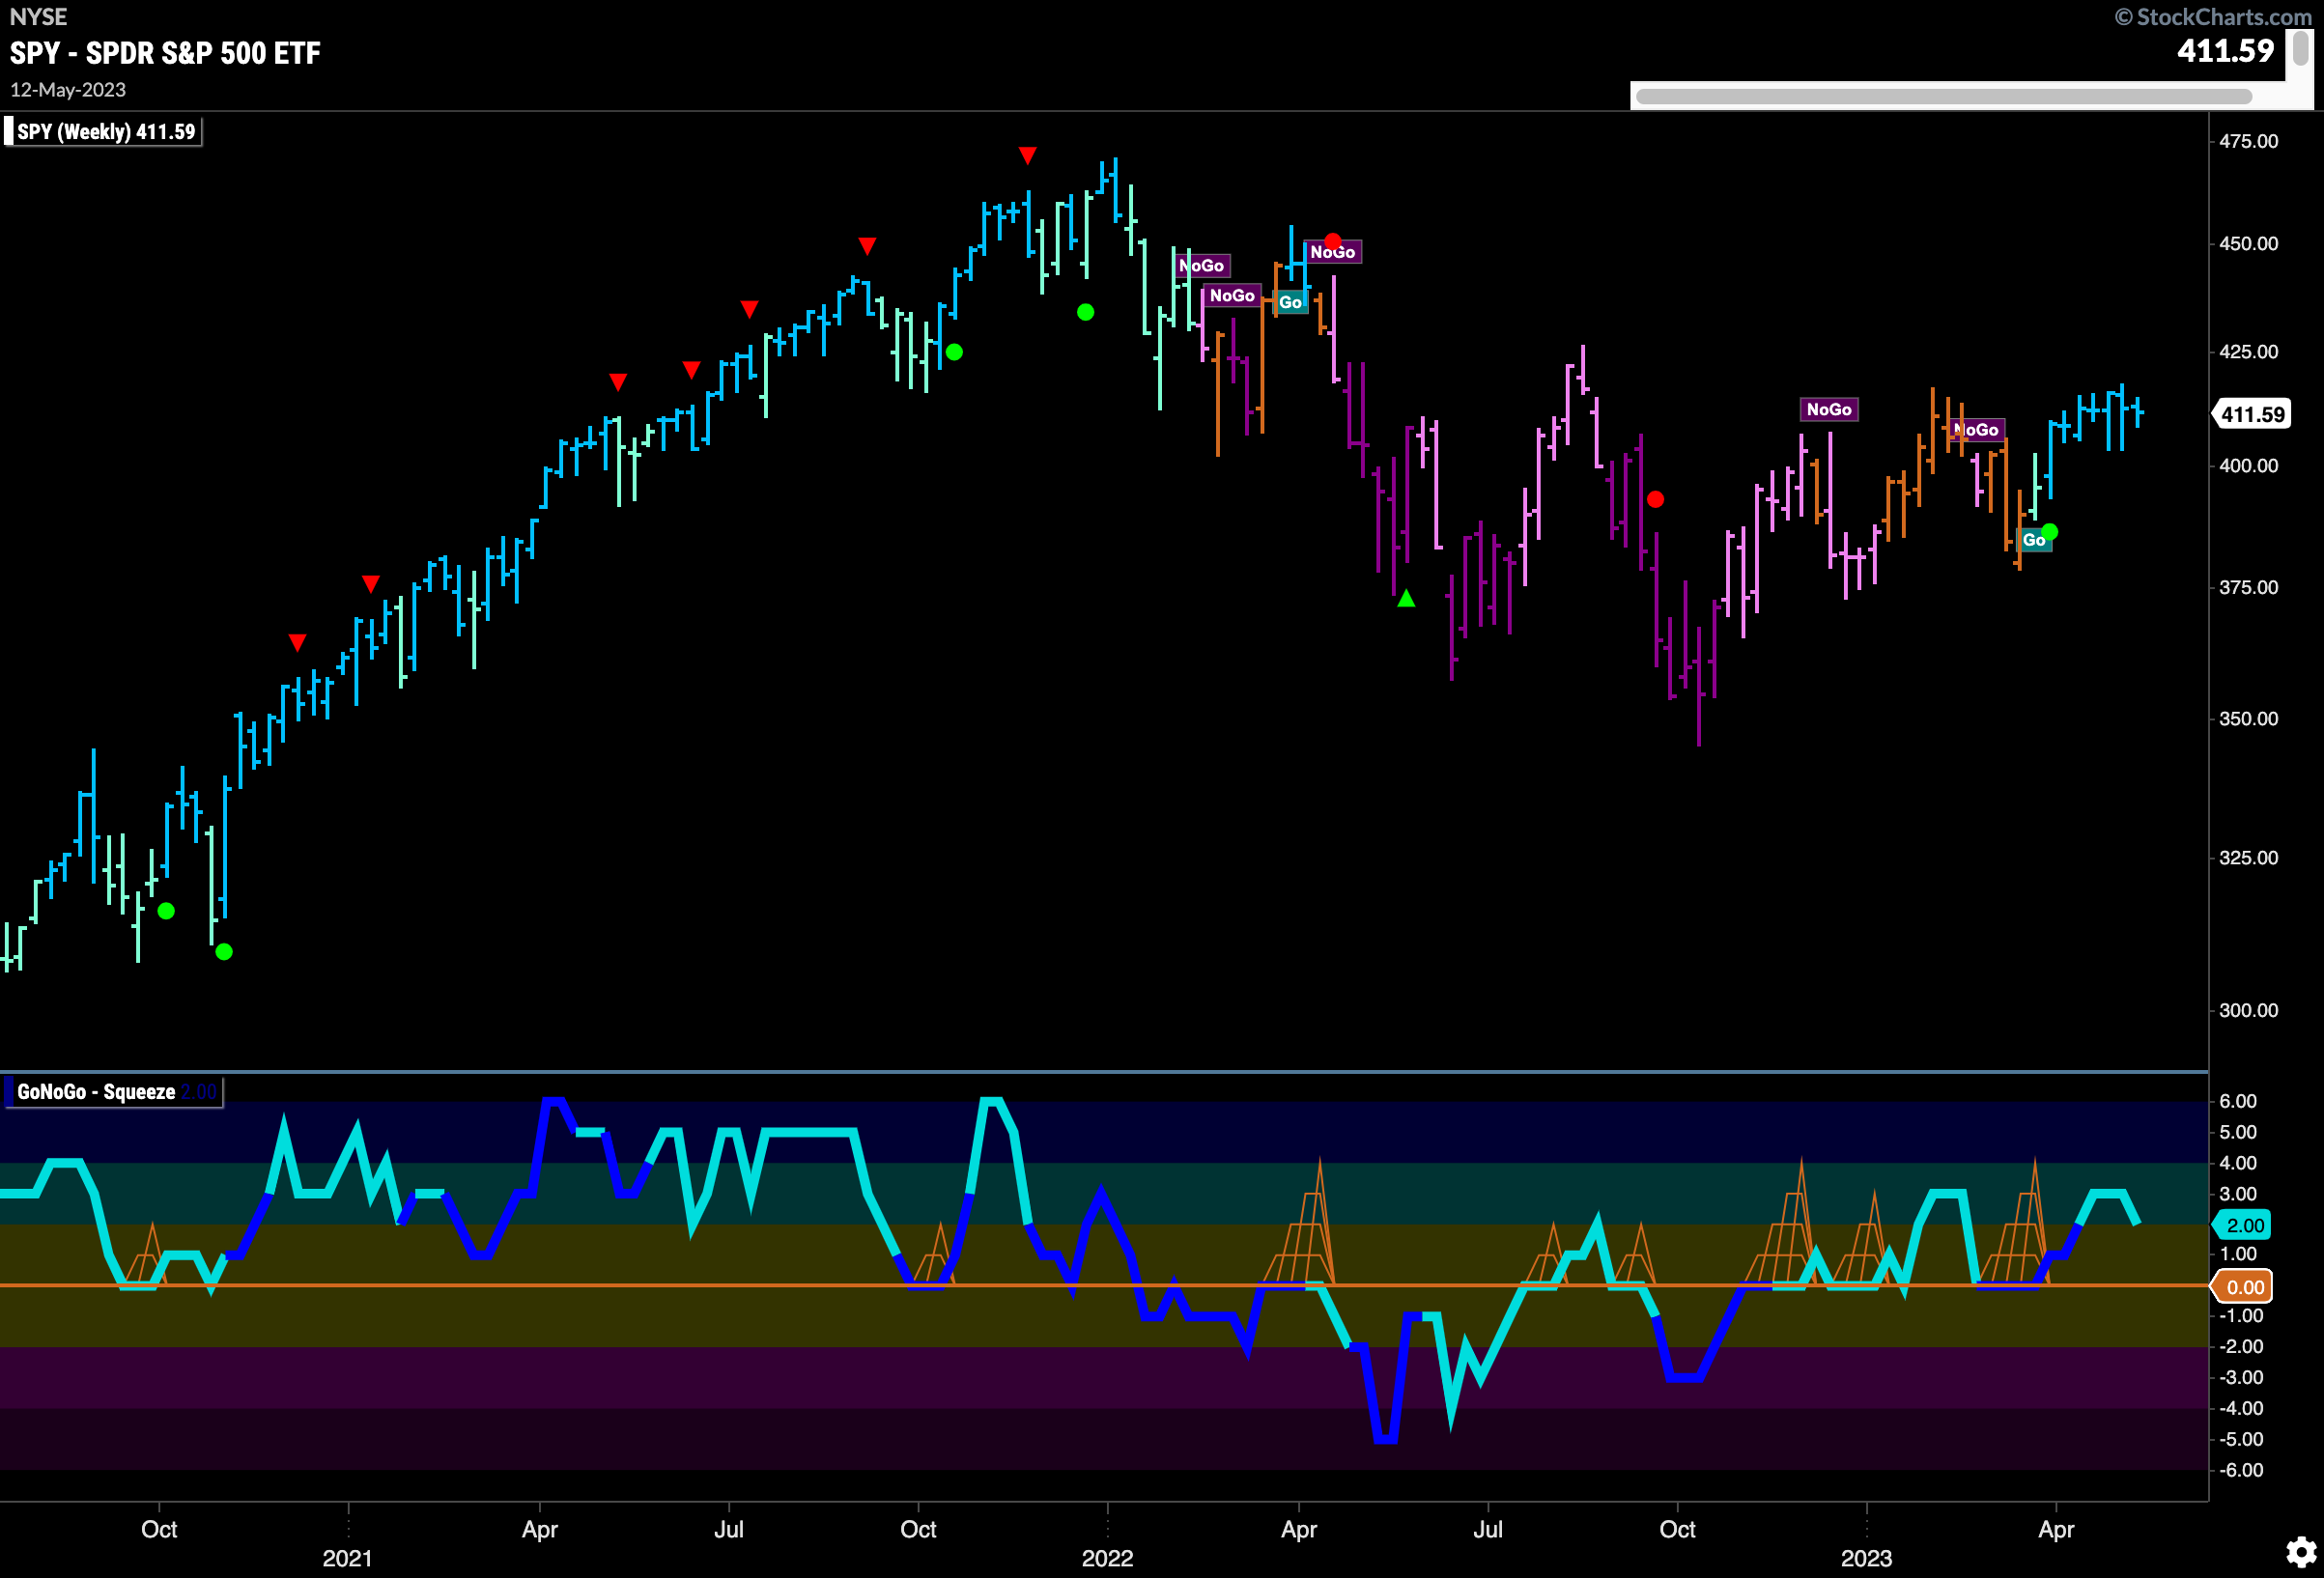
The longer term weekly chart continues to be bullish. Another strong blue bar was painted this week but price was not able to advance. We see that GoNoGo Oscillator is in positive territory but not overbought. We will watch to make sure that the zero line continues to provide support as price tries to continue in its “Go” trend.
Treasury Prices Stay in “NoGo”
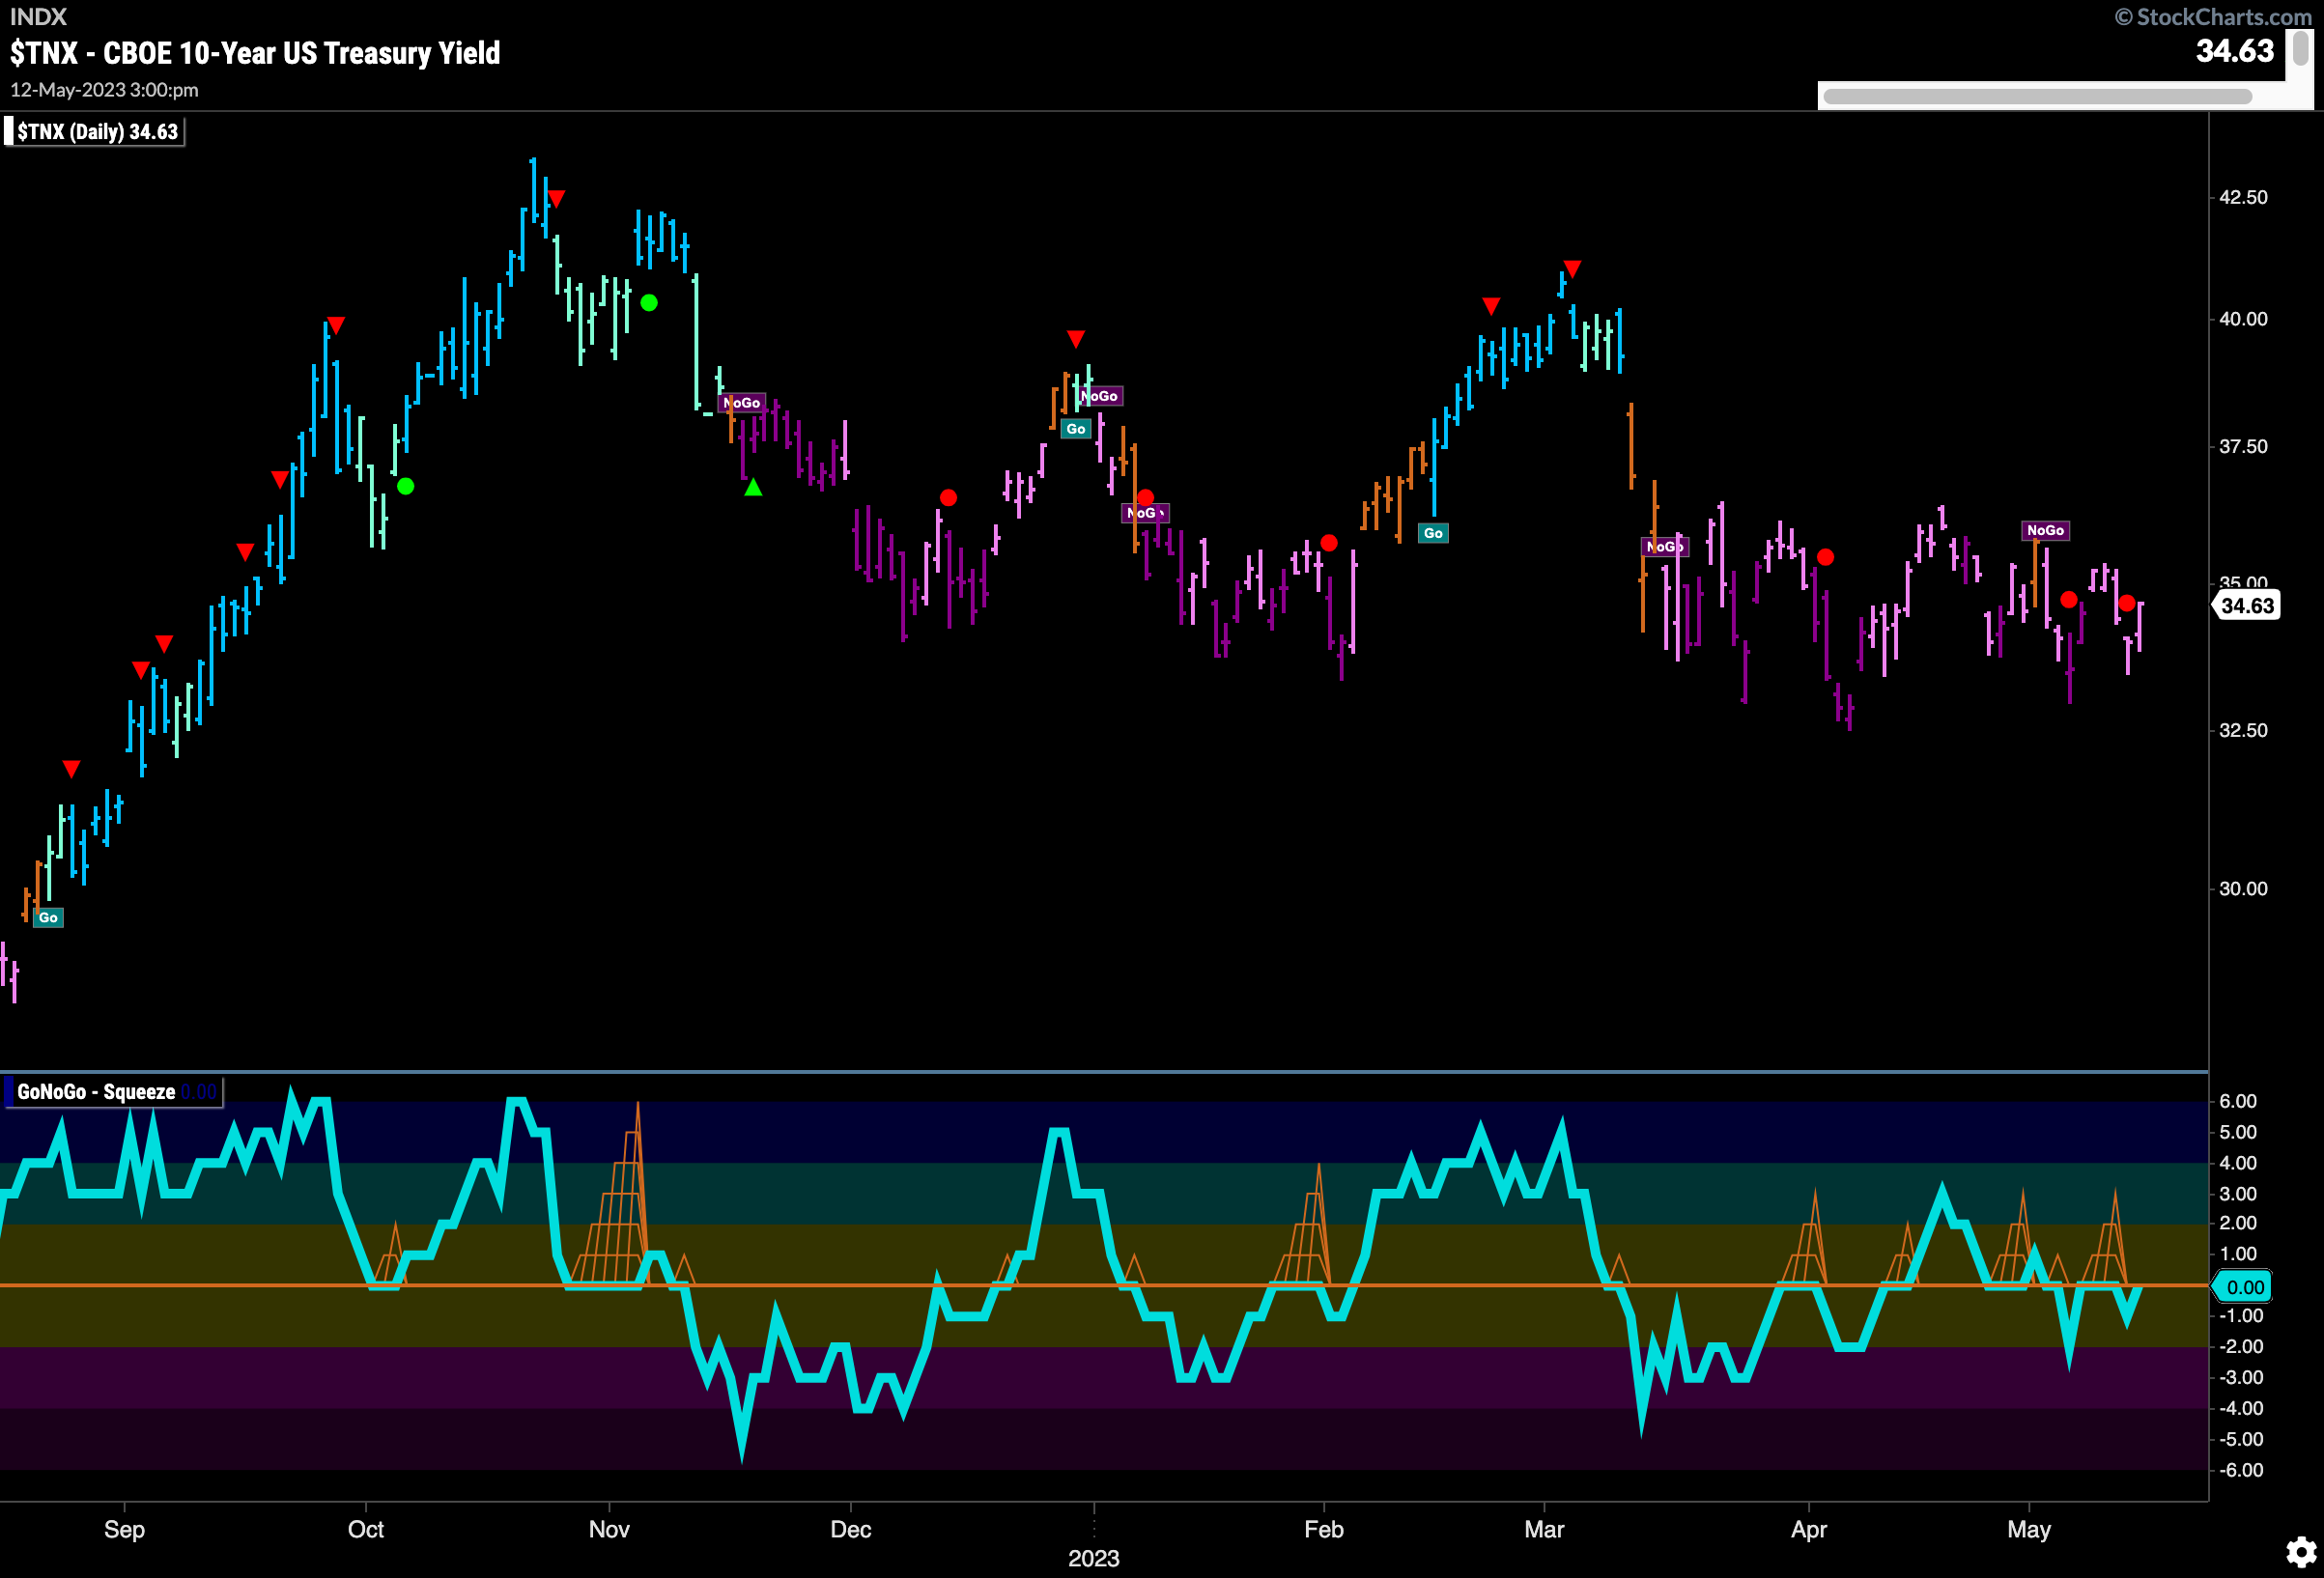
Treasury rates show little direction this week as we see price move mostly sideways with no new high or new low set for several weeks now. Pink bars show the trend is not that strong and GoNoGo Oscillator has been unable to move any distance away from the zero line. Currently, the oscillator is back testing the zero line from below where we will watch to see if it finds resistance.
Dollar Makes a Move as the Week Ends
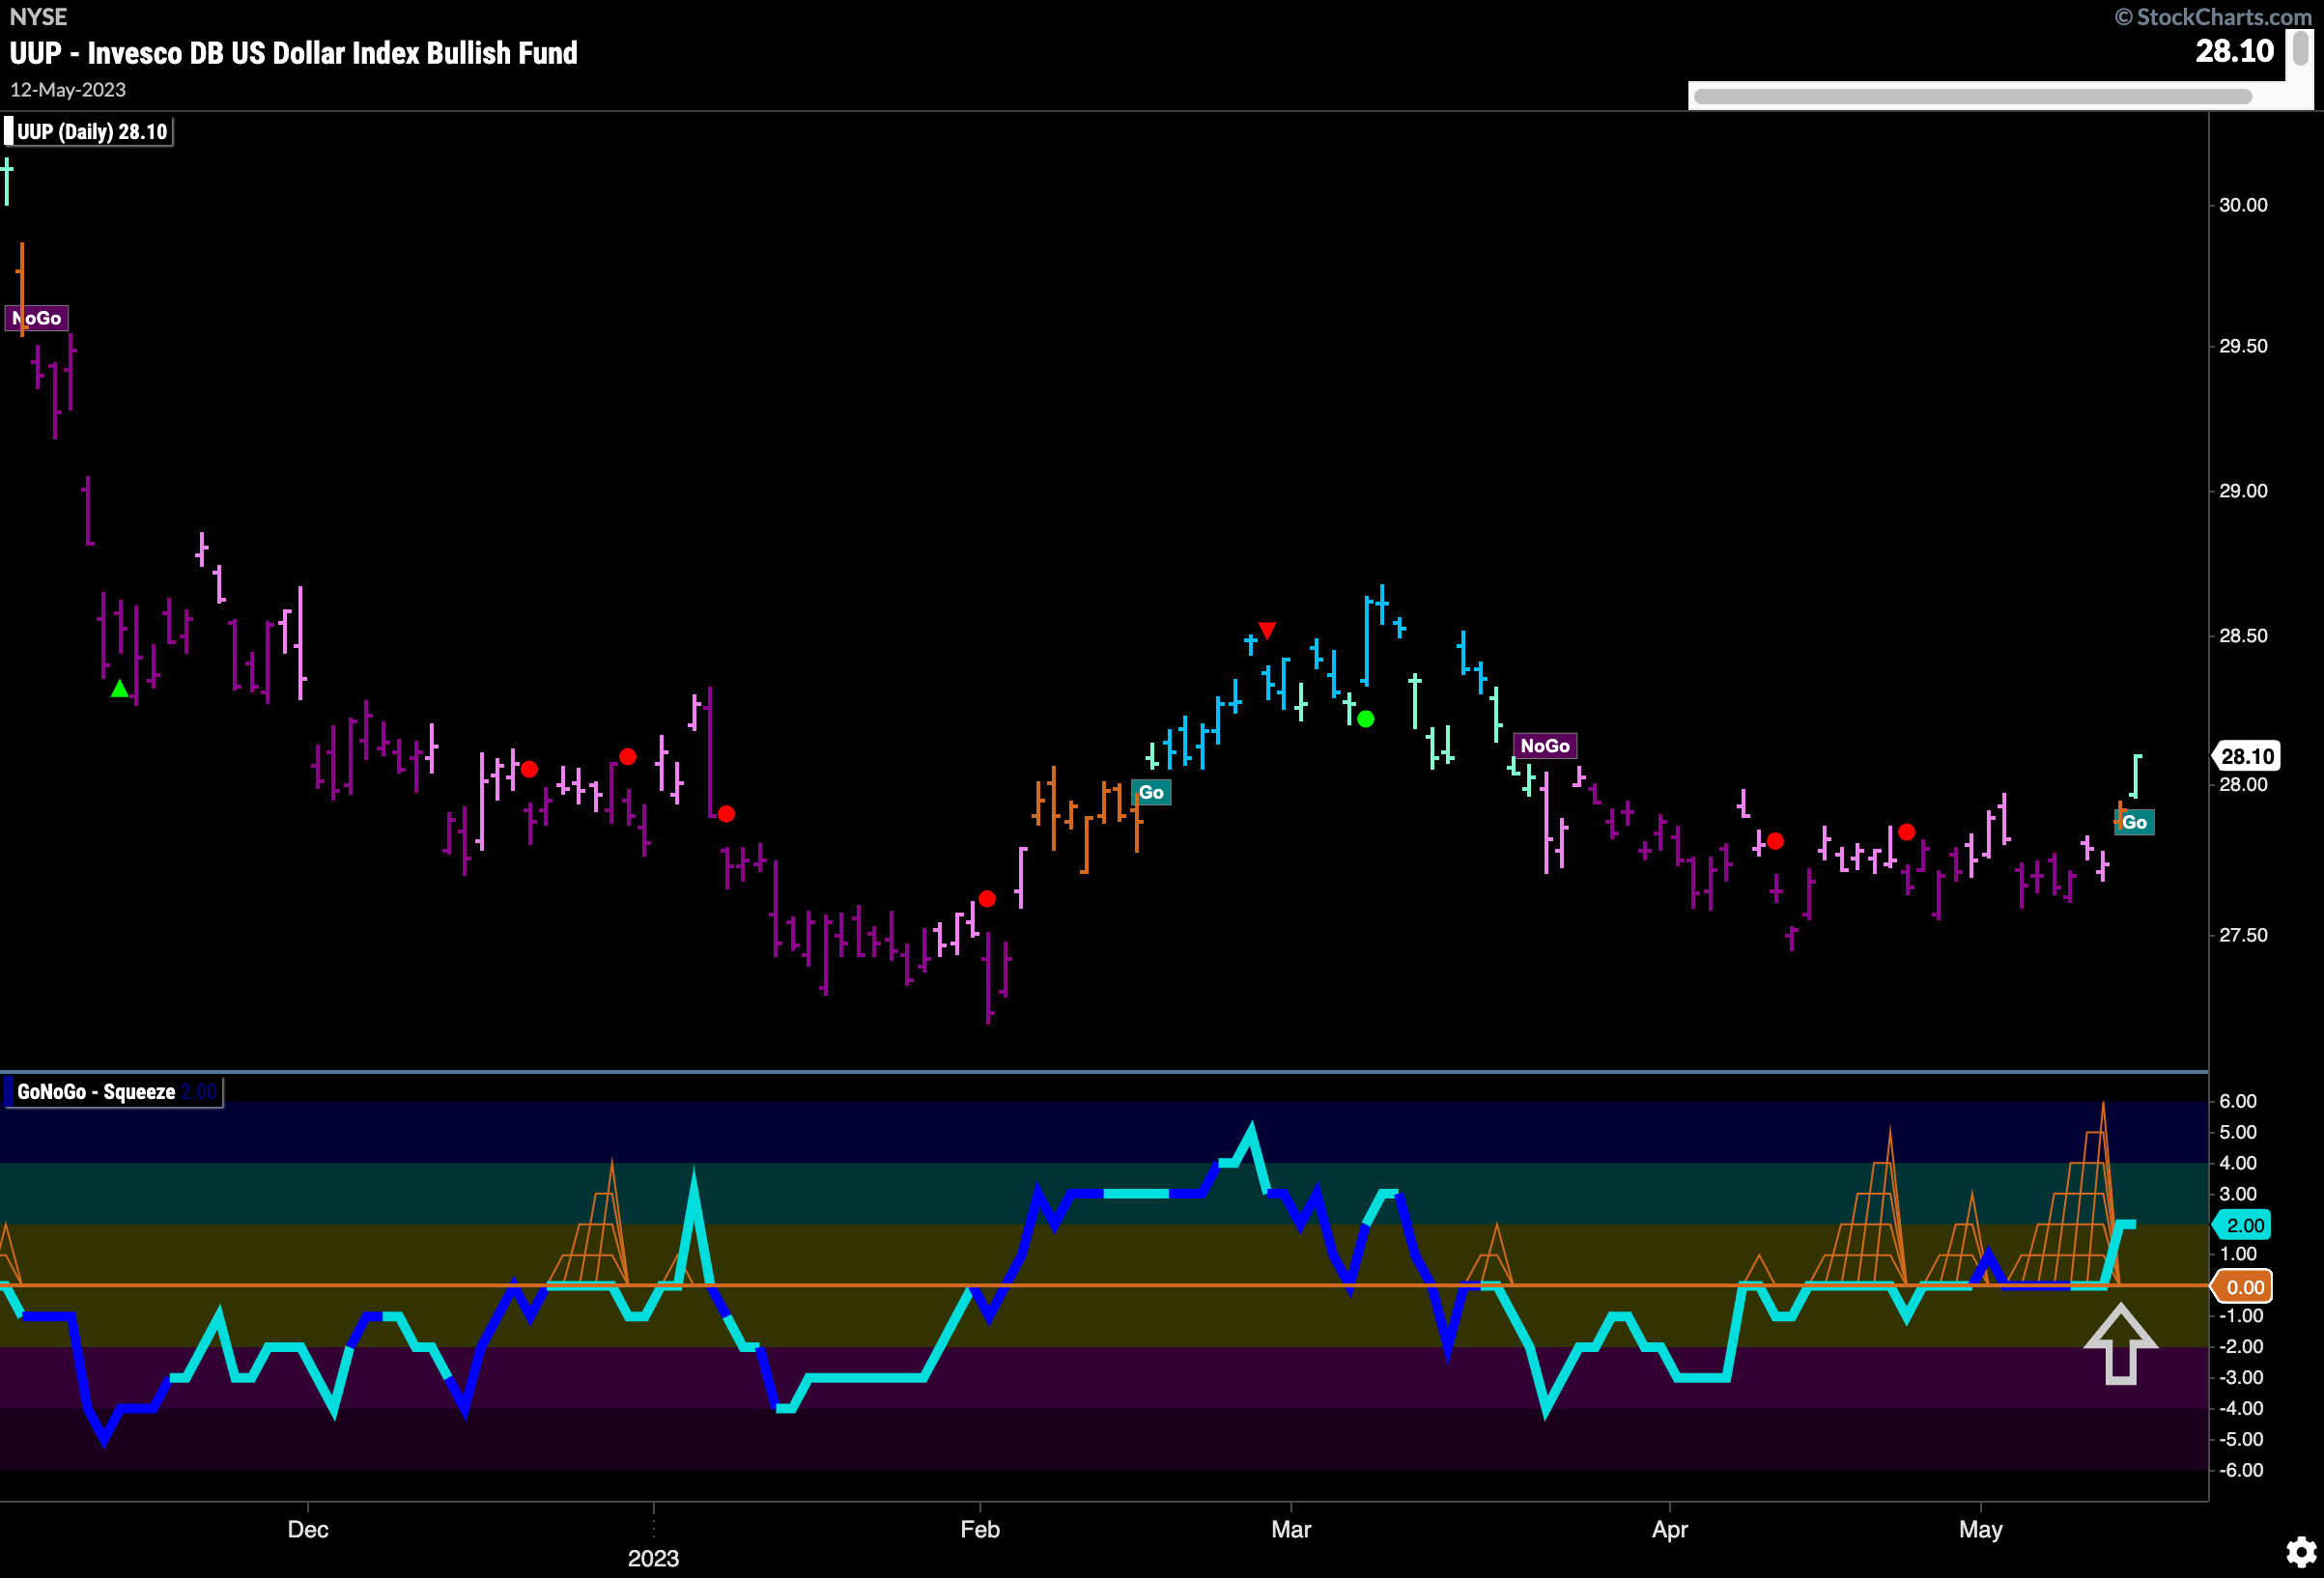
GoNoGo Trend shows that price action was strong enough on $UUP to first paint an amber “Go Fish” bar and then follow that with an aqua “Go” bar on Friday. This happens as GoNoGo Oscillator was able to finally break free of the zero line and a Max GoNoGo Squeeze was broken to the upside. We will see if this renewed momentum which is in line with the new “Go” trend helps push price higher.
Oil Prices Stuck in Slow Moving “NoGo”
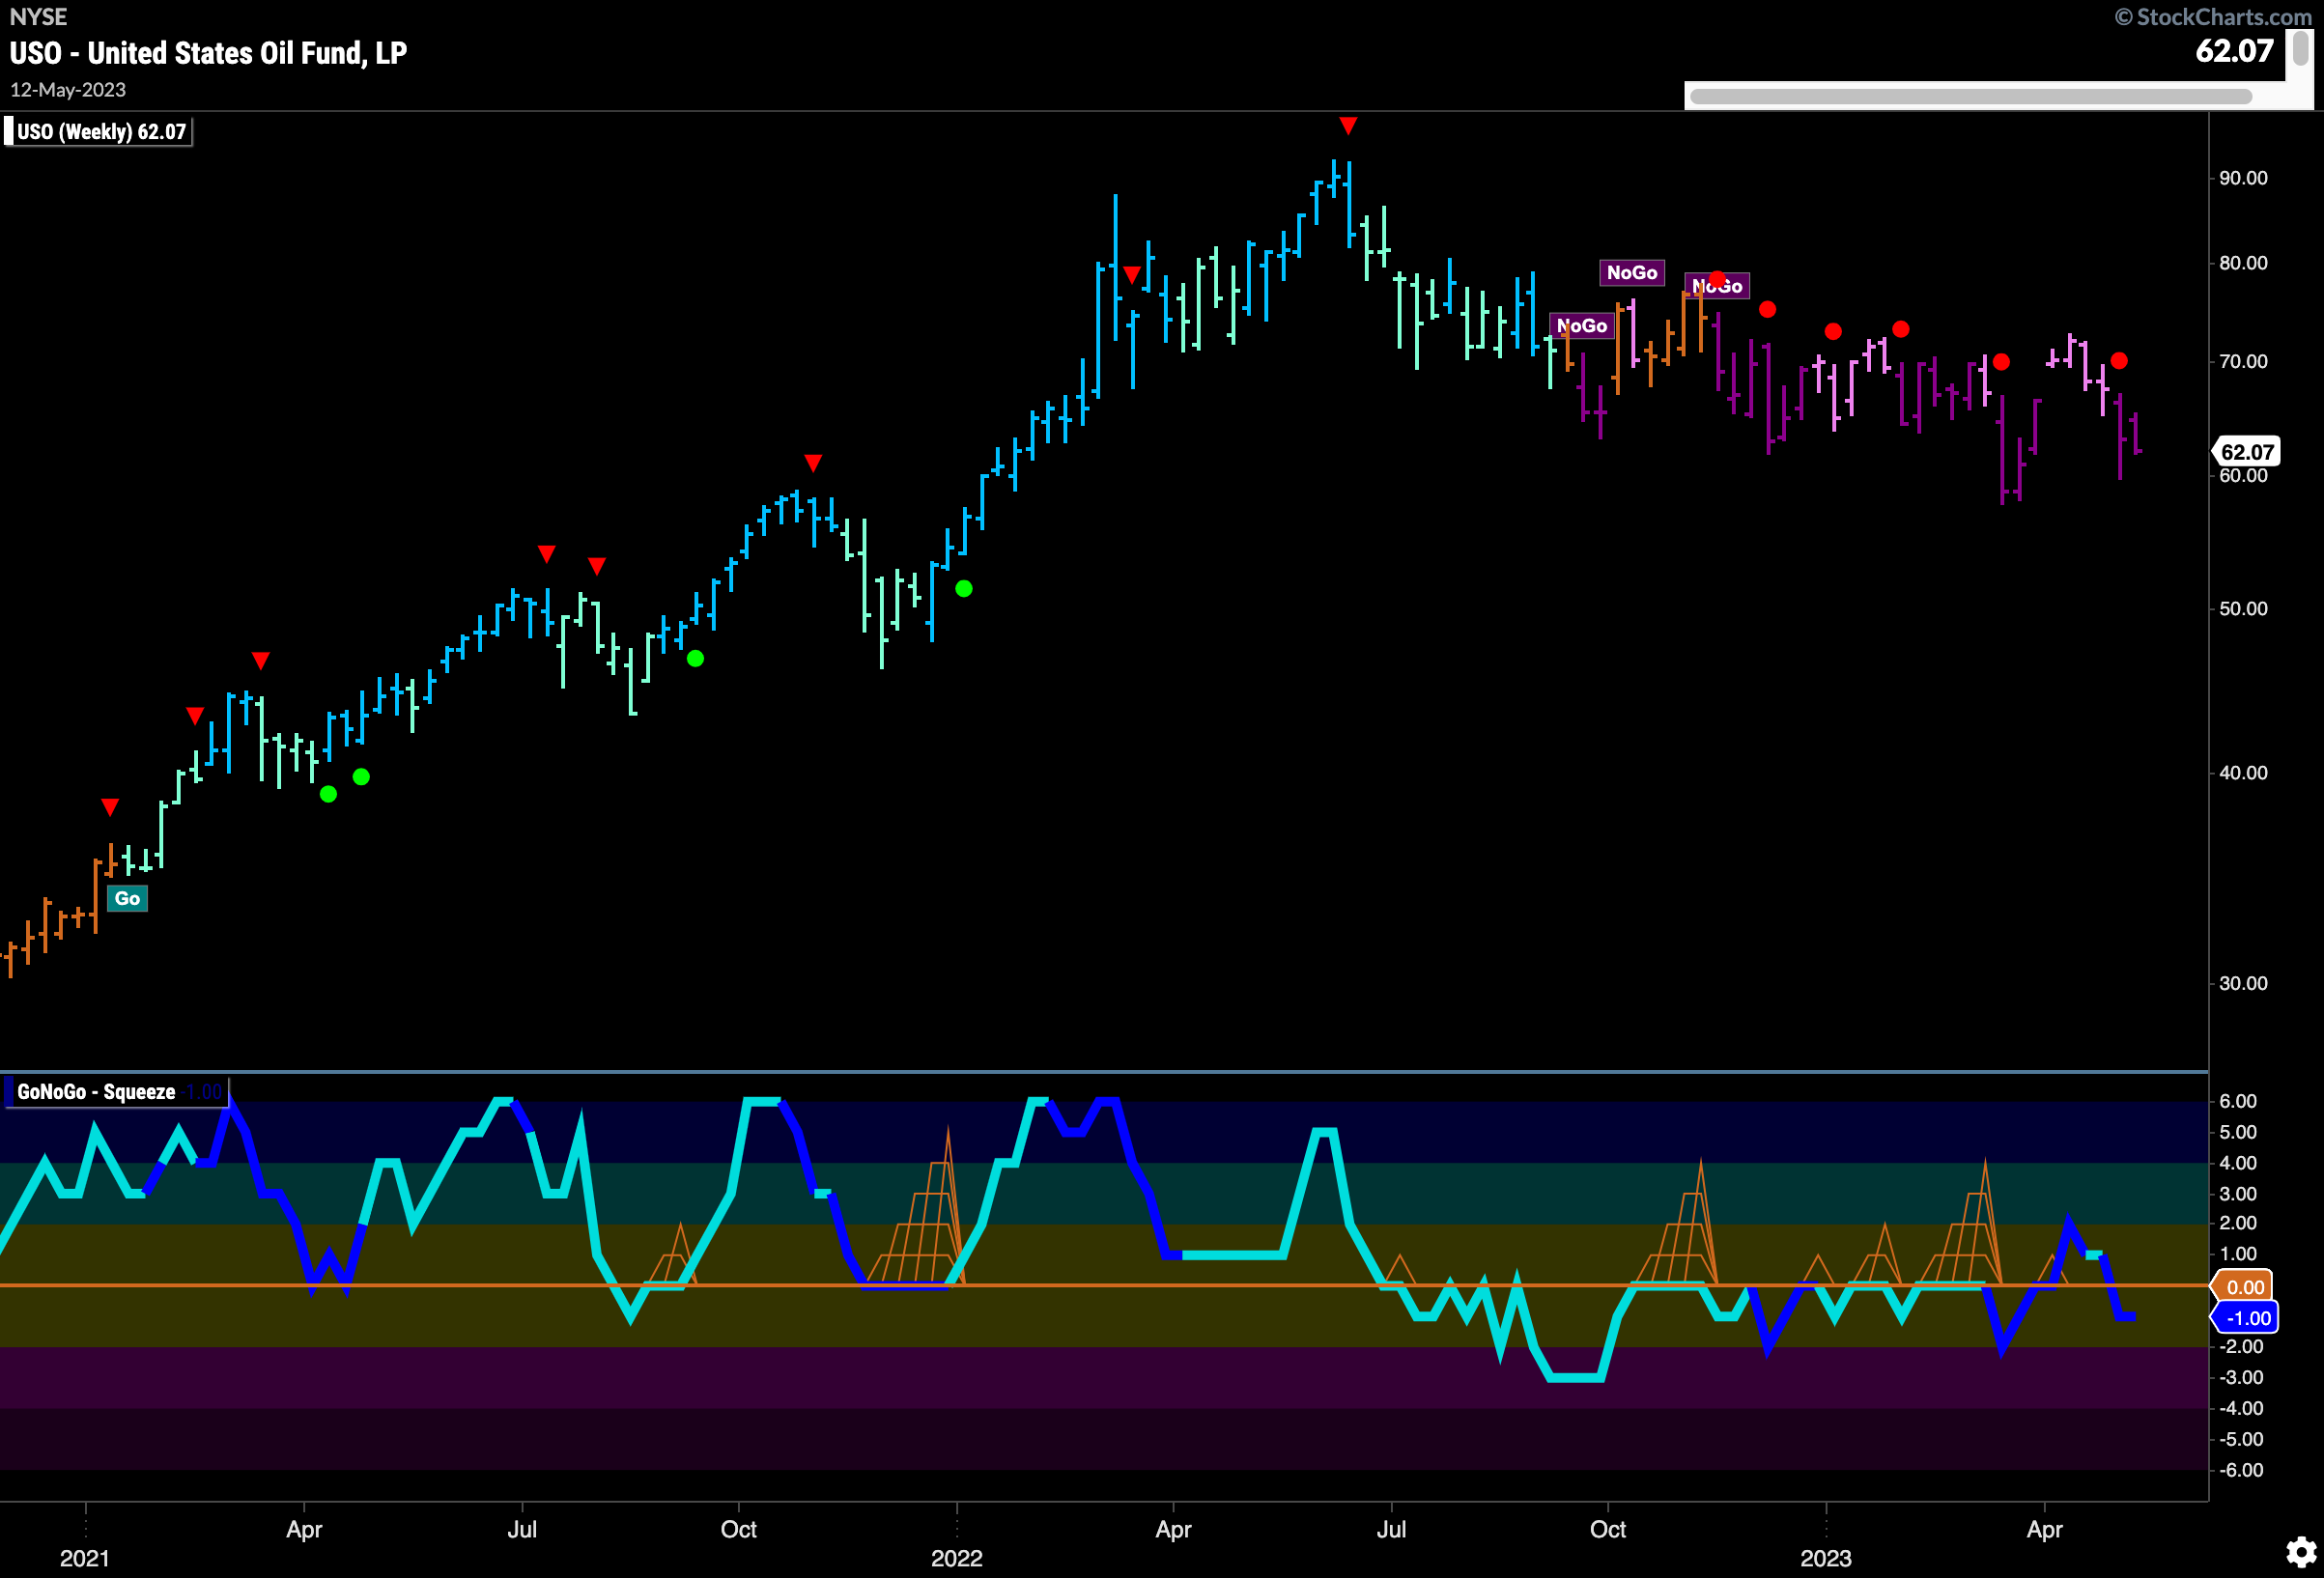
$USO sees the “NoGo” trend paint another strong purple bar this week as price continues to be depressed. GoNoGo Oscillator has swung back below the zero line on heavy volume. This tells us that momentum is once again on the side of the “NoGo” trend so in the short term we would expect further trouble for price.
Gold Makes Little Headway
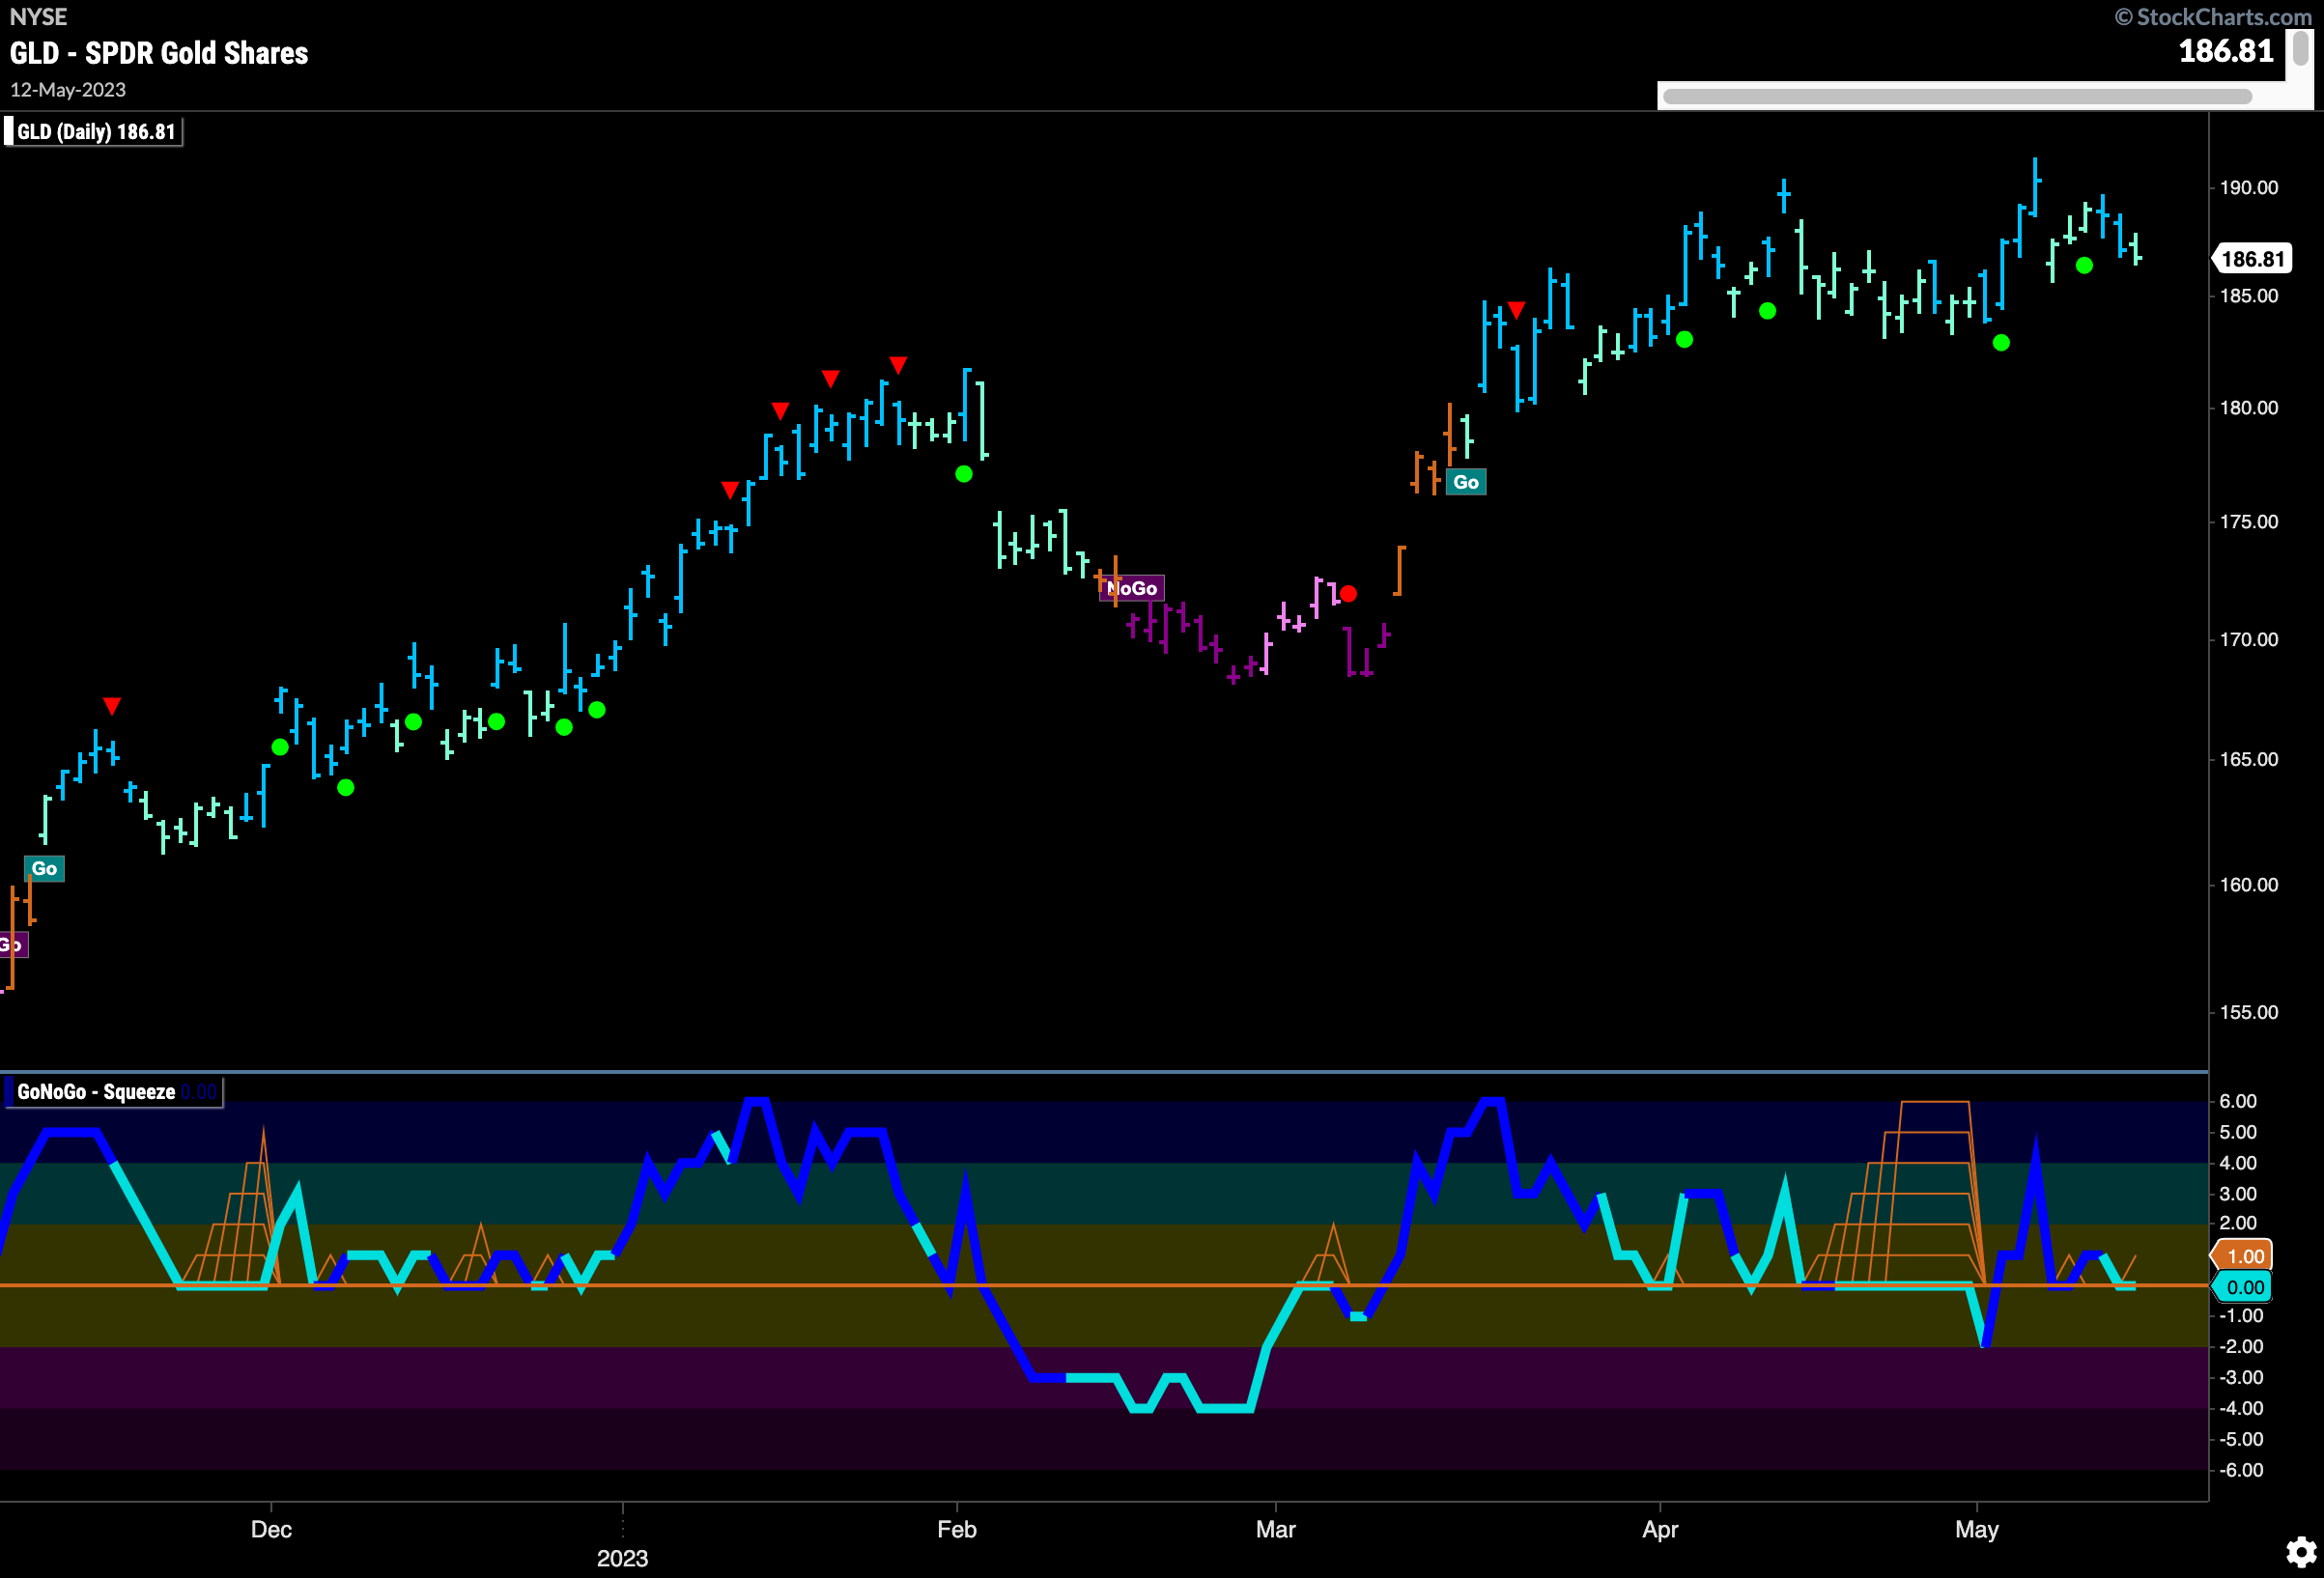
$GLD failed to reach last week’s highs as it struggled a little and moved mostly sideways. GoNoGo Oscillator shows that after the push at higher highs last week momentum has dried up this week and is now testing the zero line from above where we will look to see if it finds support. If momentum remains on the side of the “Go” trend then we can expect the “Go” trend to continue and even see a push for a new high.
Sector RelMap
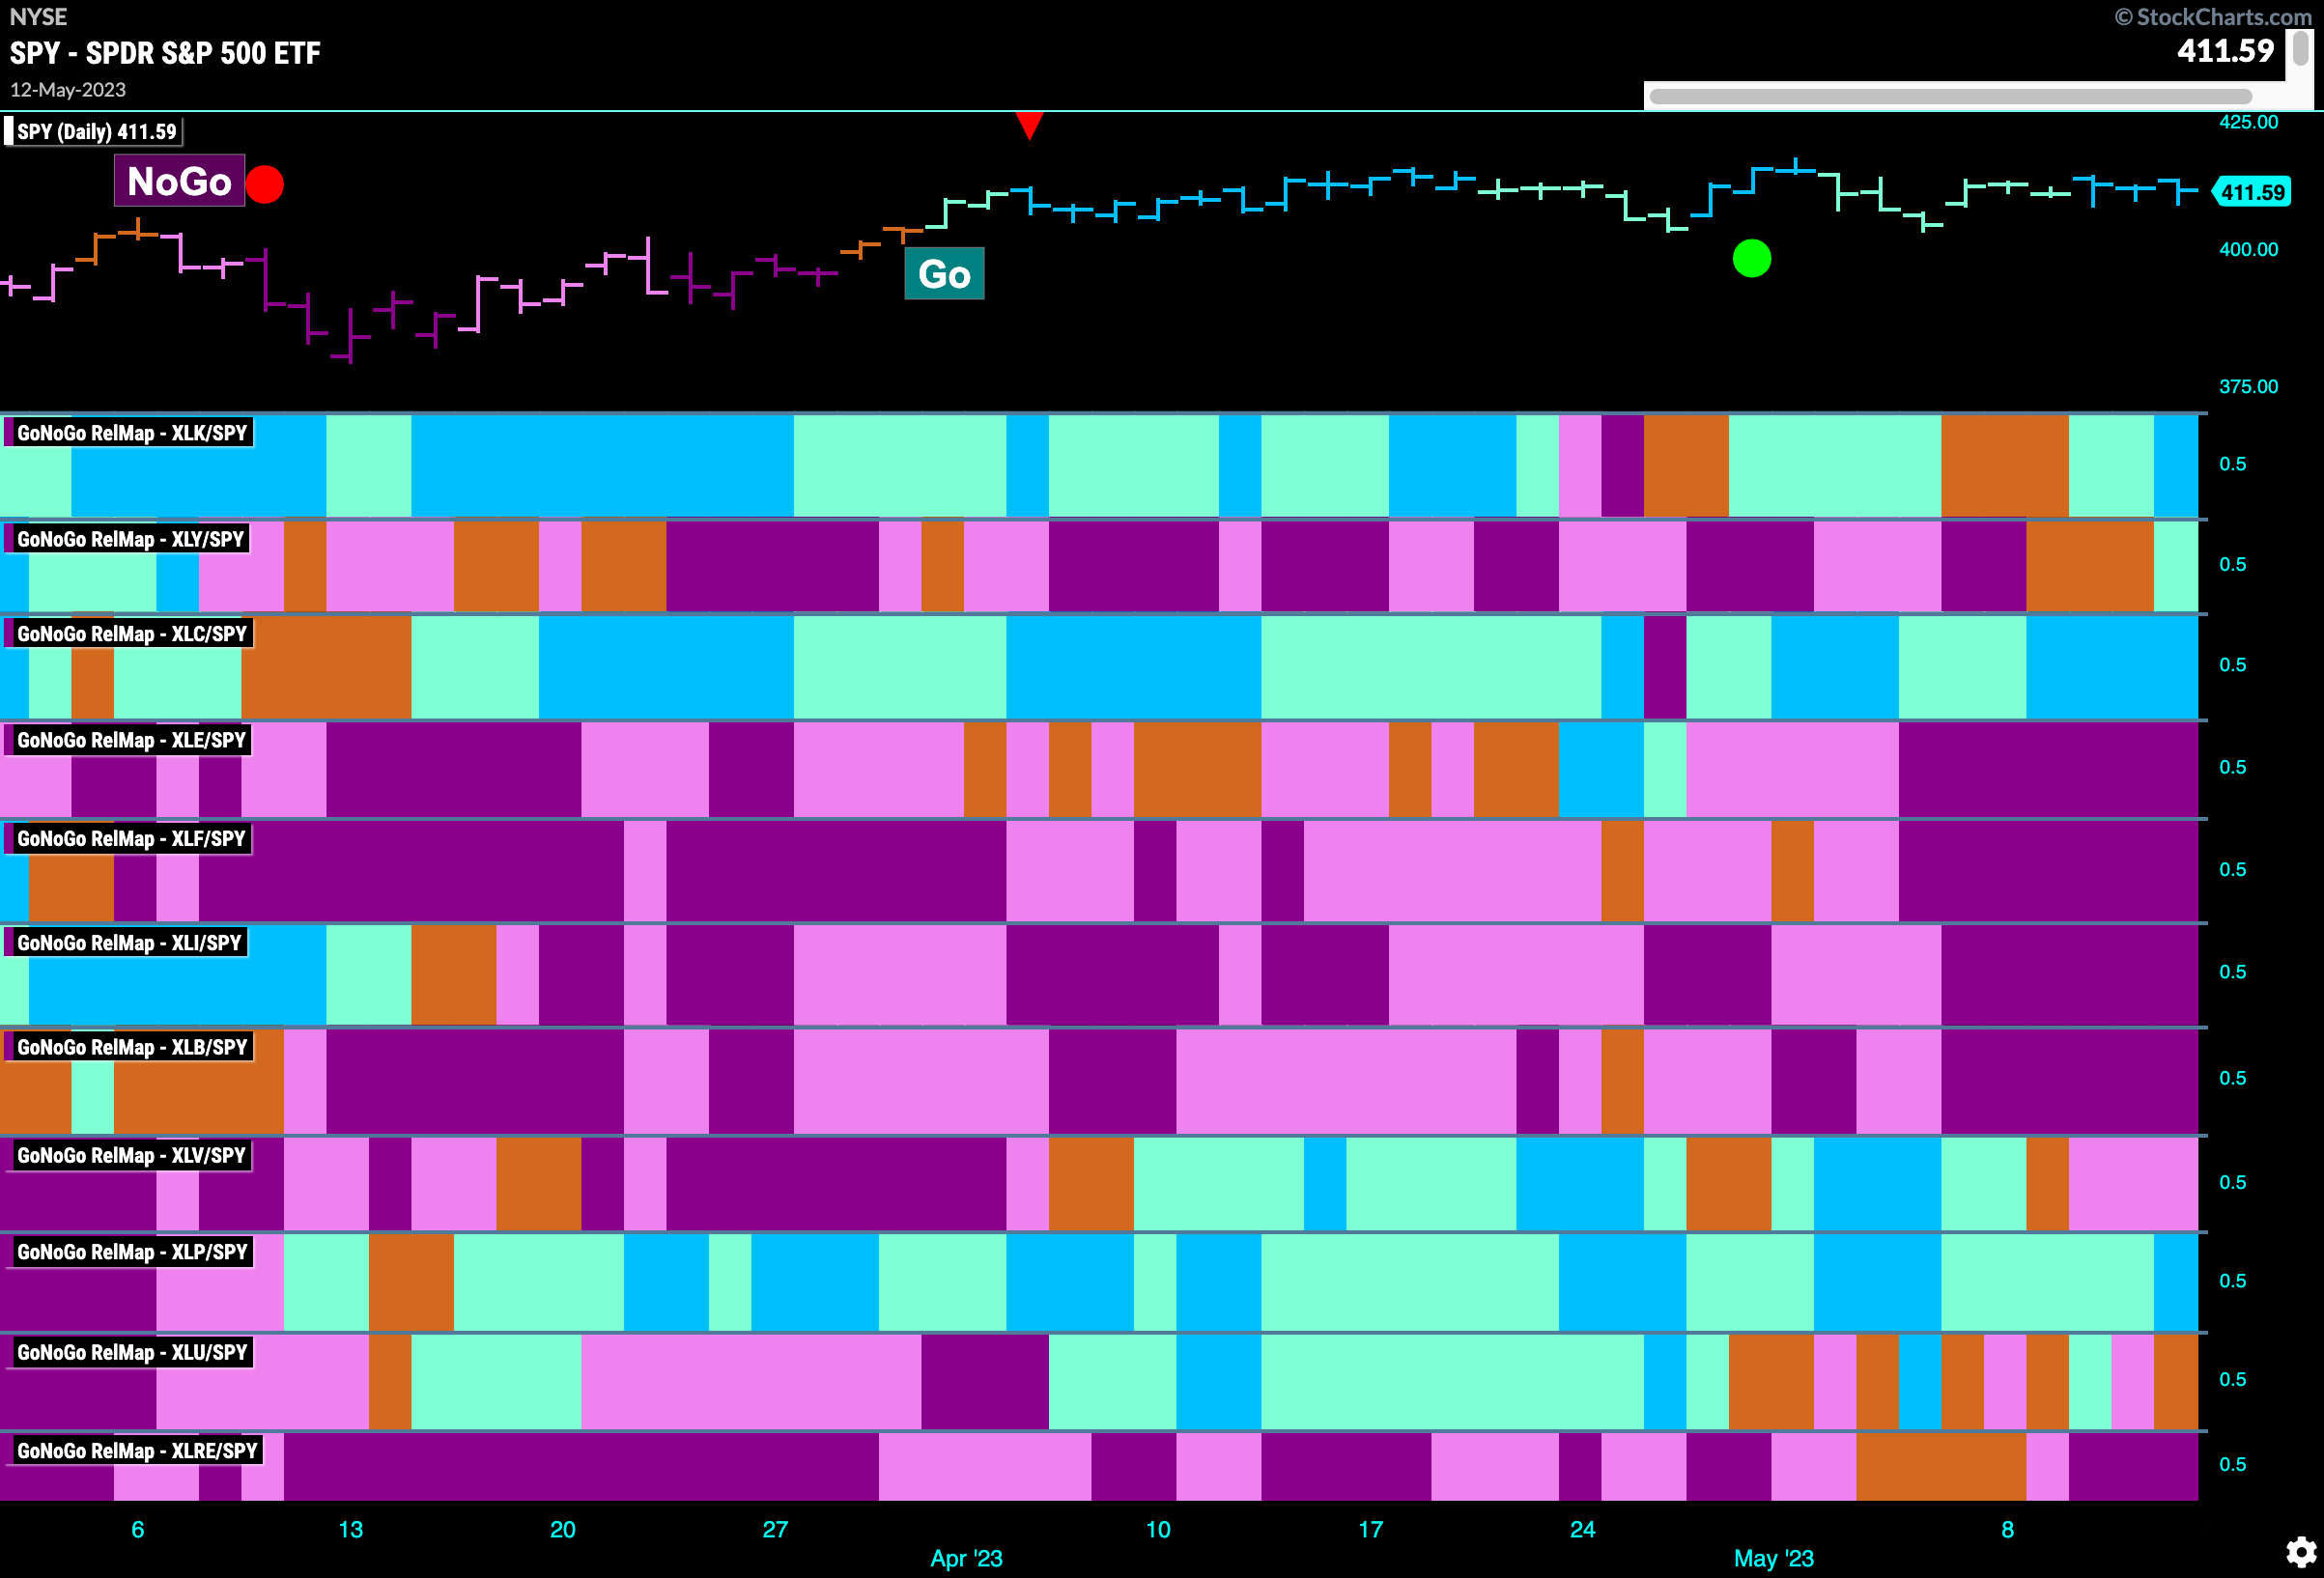
Below is the GoNoGo Sector RelMap. This GoNoGo RelMap applies the GoNoGo Trend to the relative strength ratios of the sectors to the base index. Looking at this map, we can quickly see where the relative outperformance is coming from as well as which sectors are lagging on a relative basis. 4 sectors are outperforming the base index this week. $XLK, $XLY, $XLC, and $XLP are painting “Go” bars.
$XLC Breaking Out?
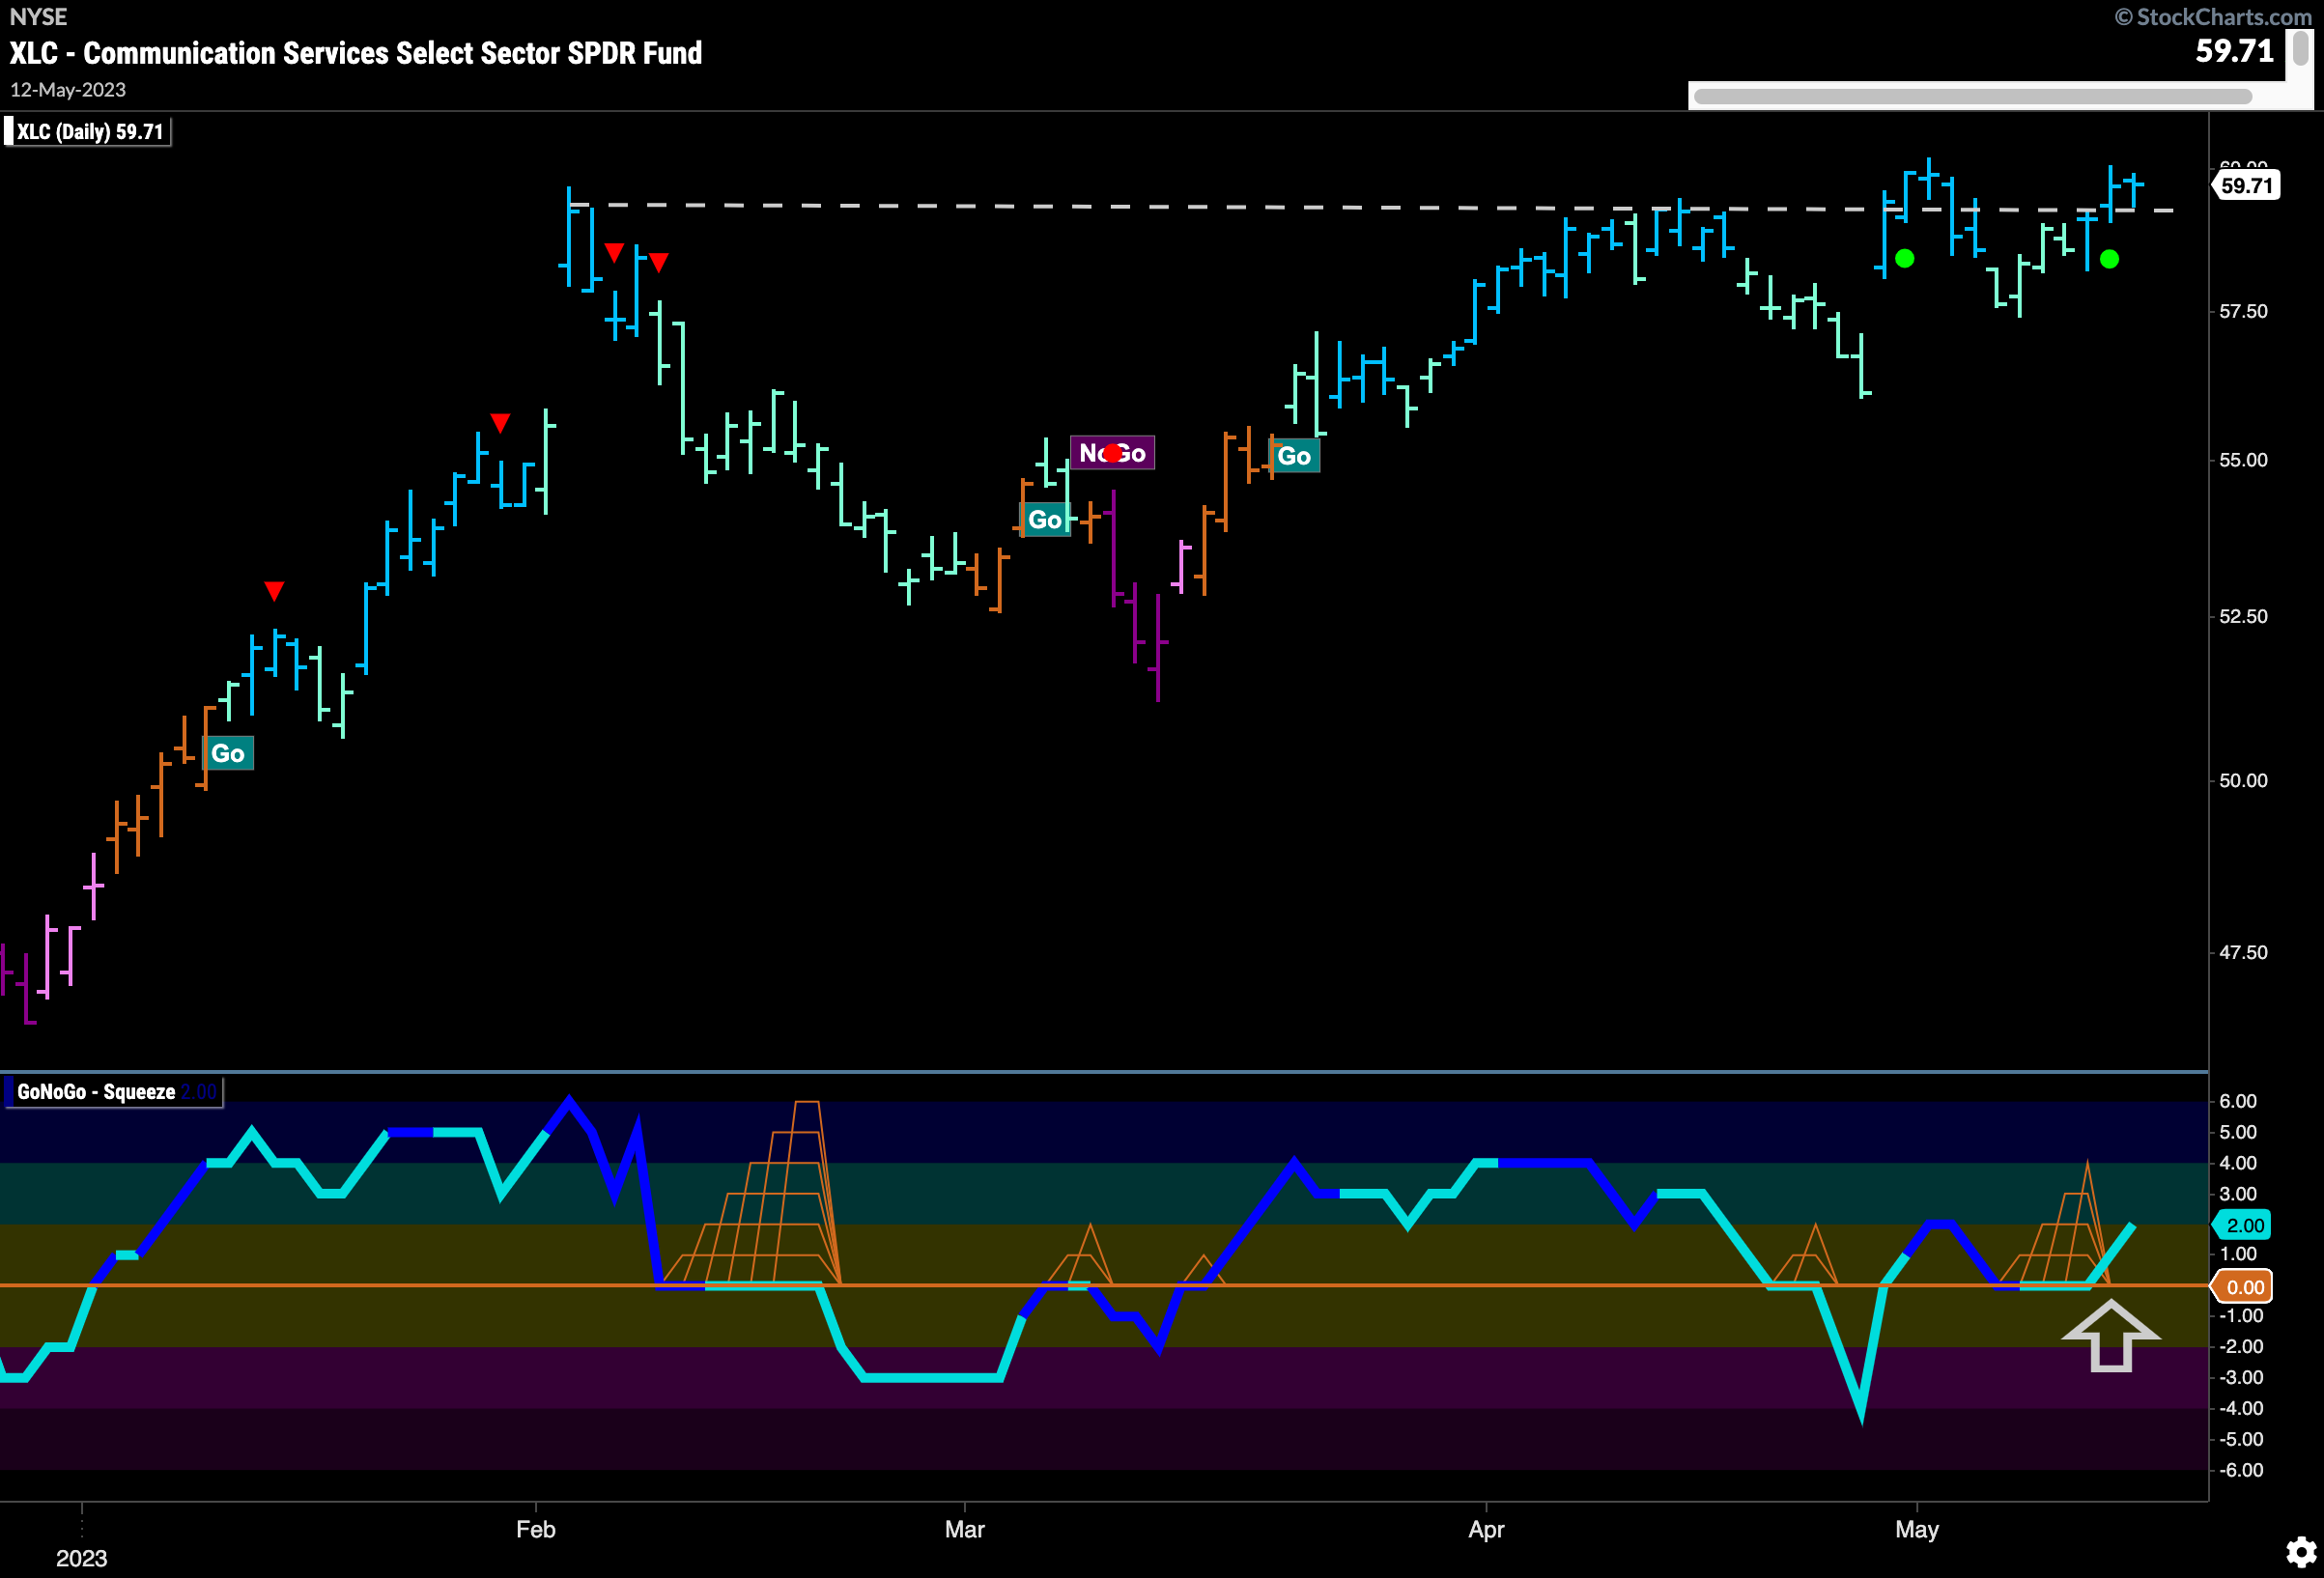
The GoNoGo RelMap of the sectors above shows that on a relative basis $XLC painted a string of stronger blue “Go” bars last week. The chart below, showing the GoNoGo full suite of tools on $XLC itself tells us that the price trend remained in place and even strengthened painting strong blue bars in the second half of the week. We can see that the prior high from February is being honestly tested and not for the first time. Higher lows as price pushes up against this resistance shows that buyers are being more aggressive and GoNoGo Oscillator is finding support at the zero line. This suggests that price will have the momentum it needs to remain elevated and we will look for price to consolidate above resistance this week.
Communications Sub Group Map
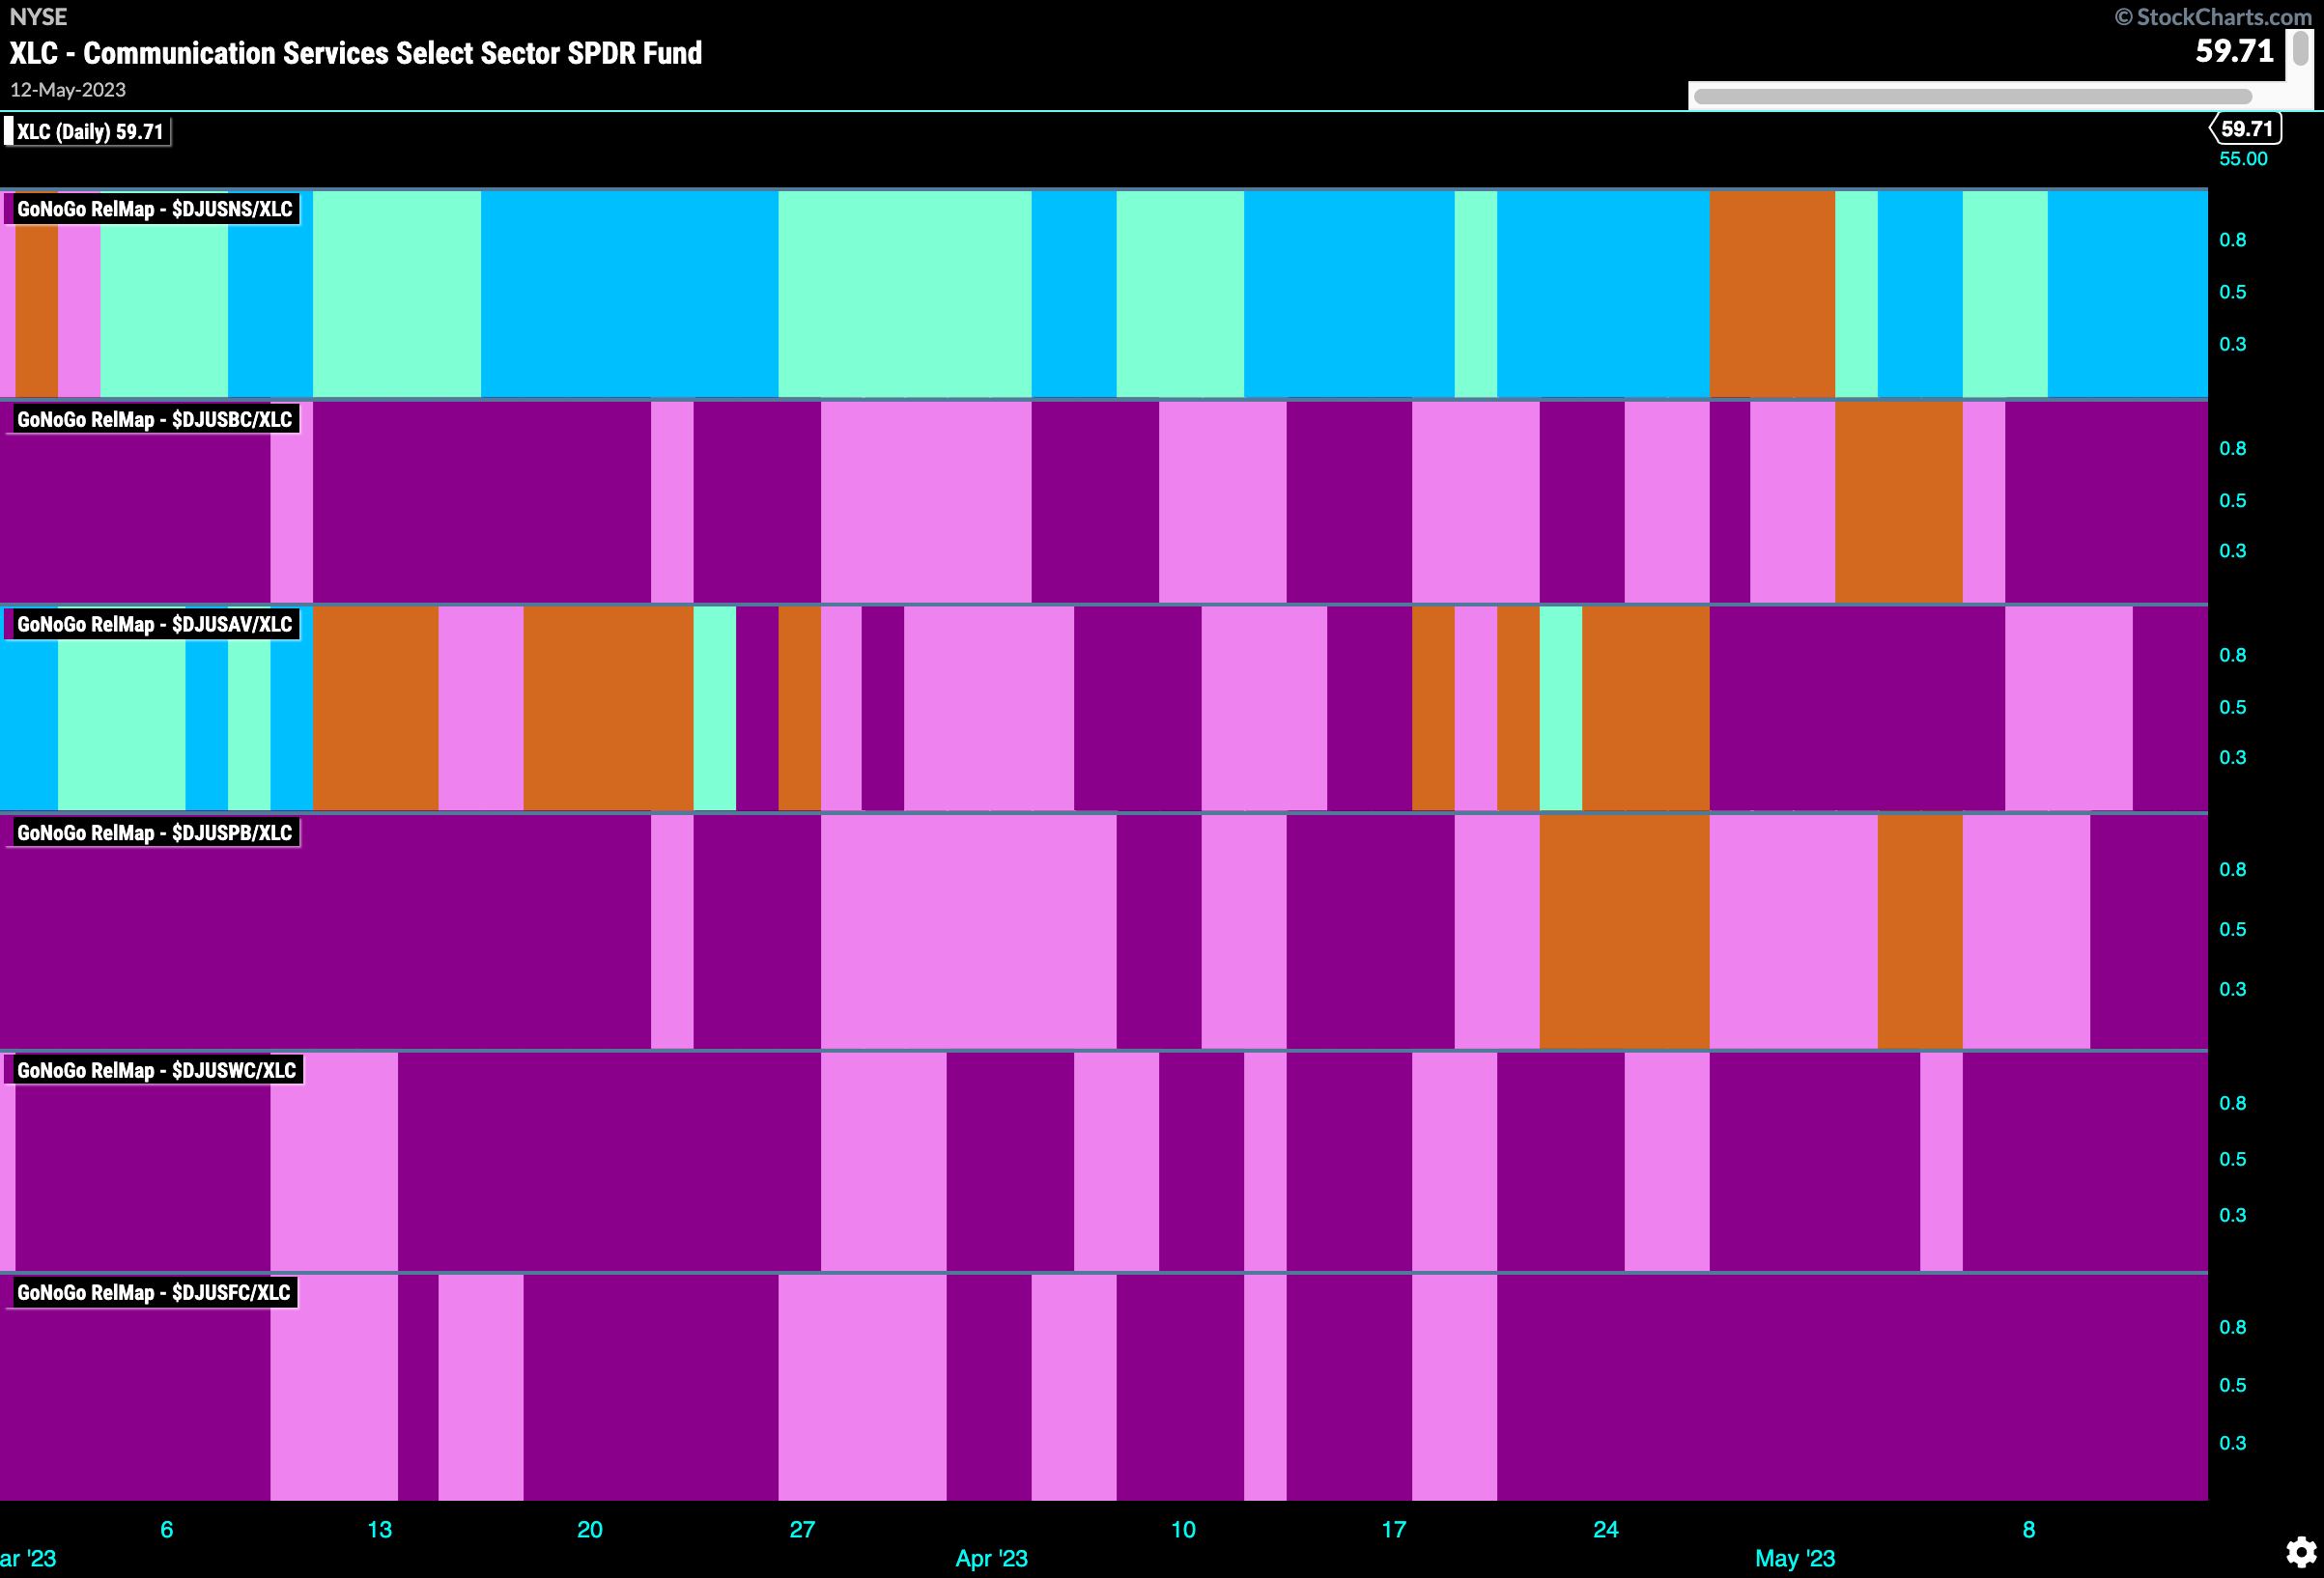
This map shows us clearly that it is the Internet index (top panel) that is driving the outperformance of the Communications sector. It is the only one in a “Go” trend and that trend has strengthened this week as we see strong blue “Go” bars.
$SY ready to move higher?
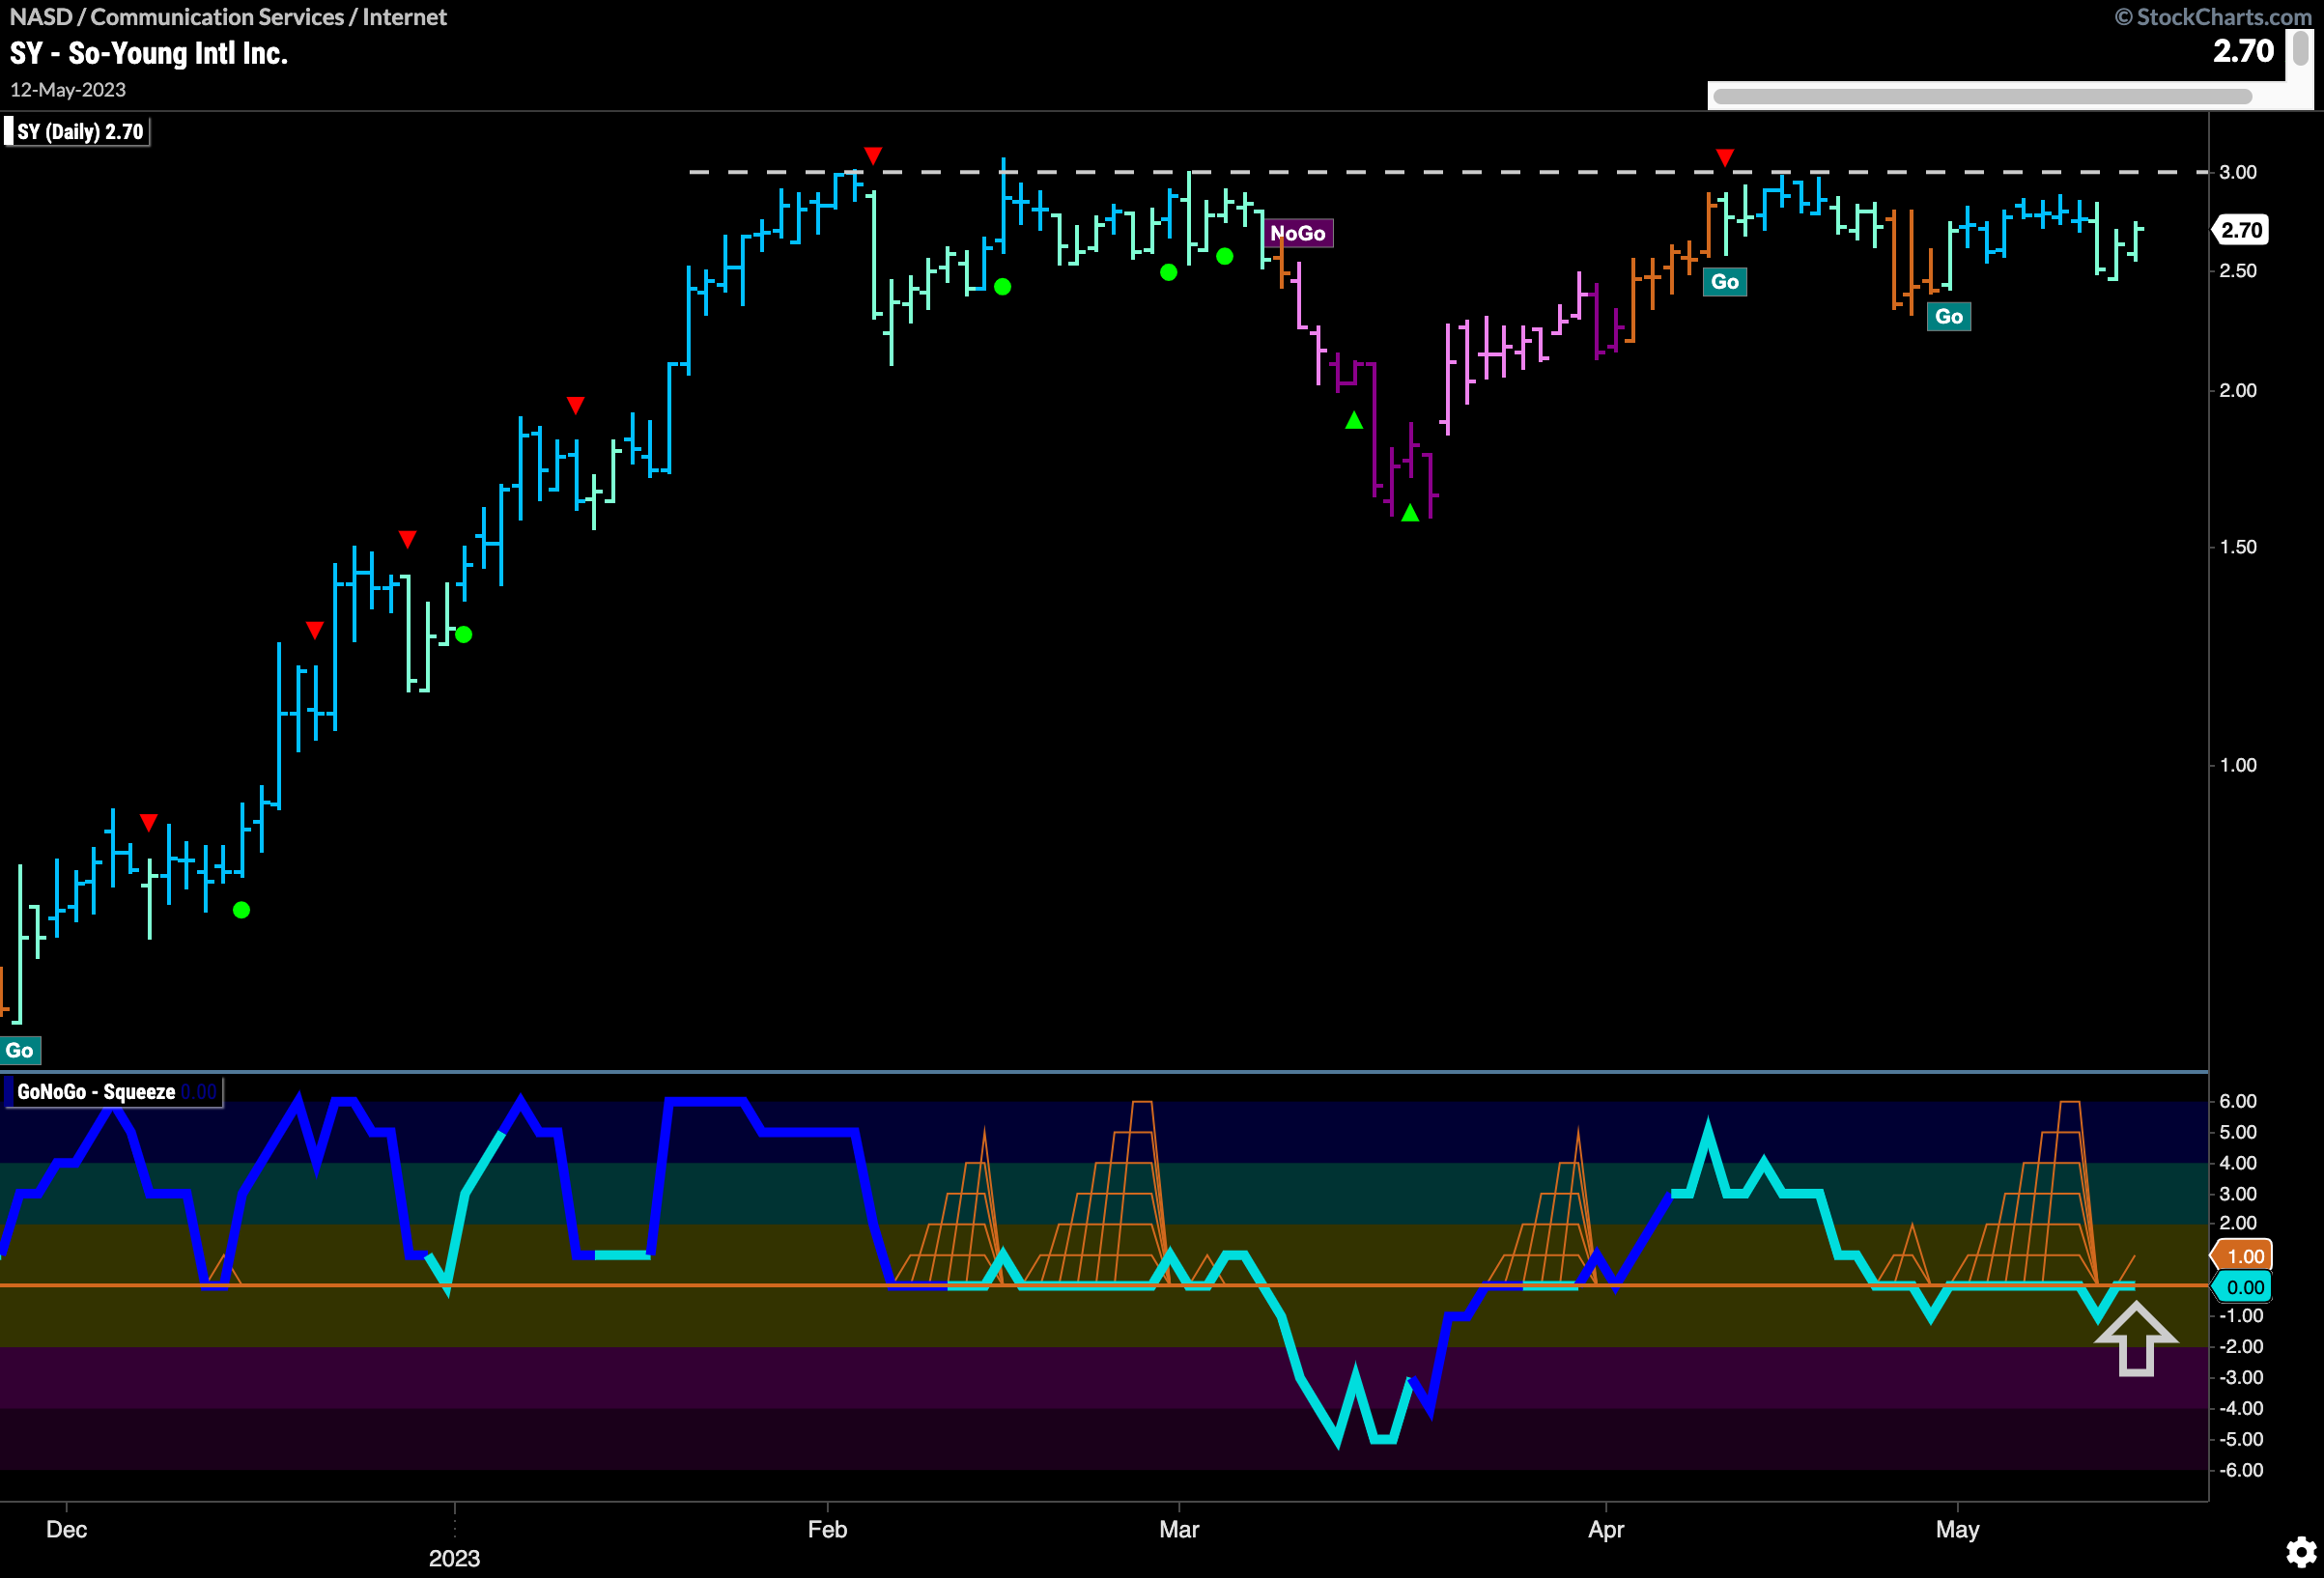
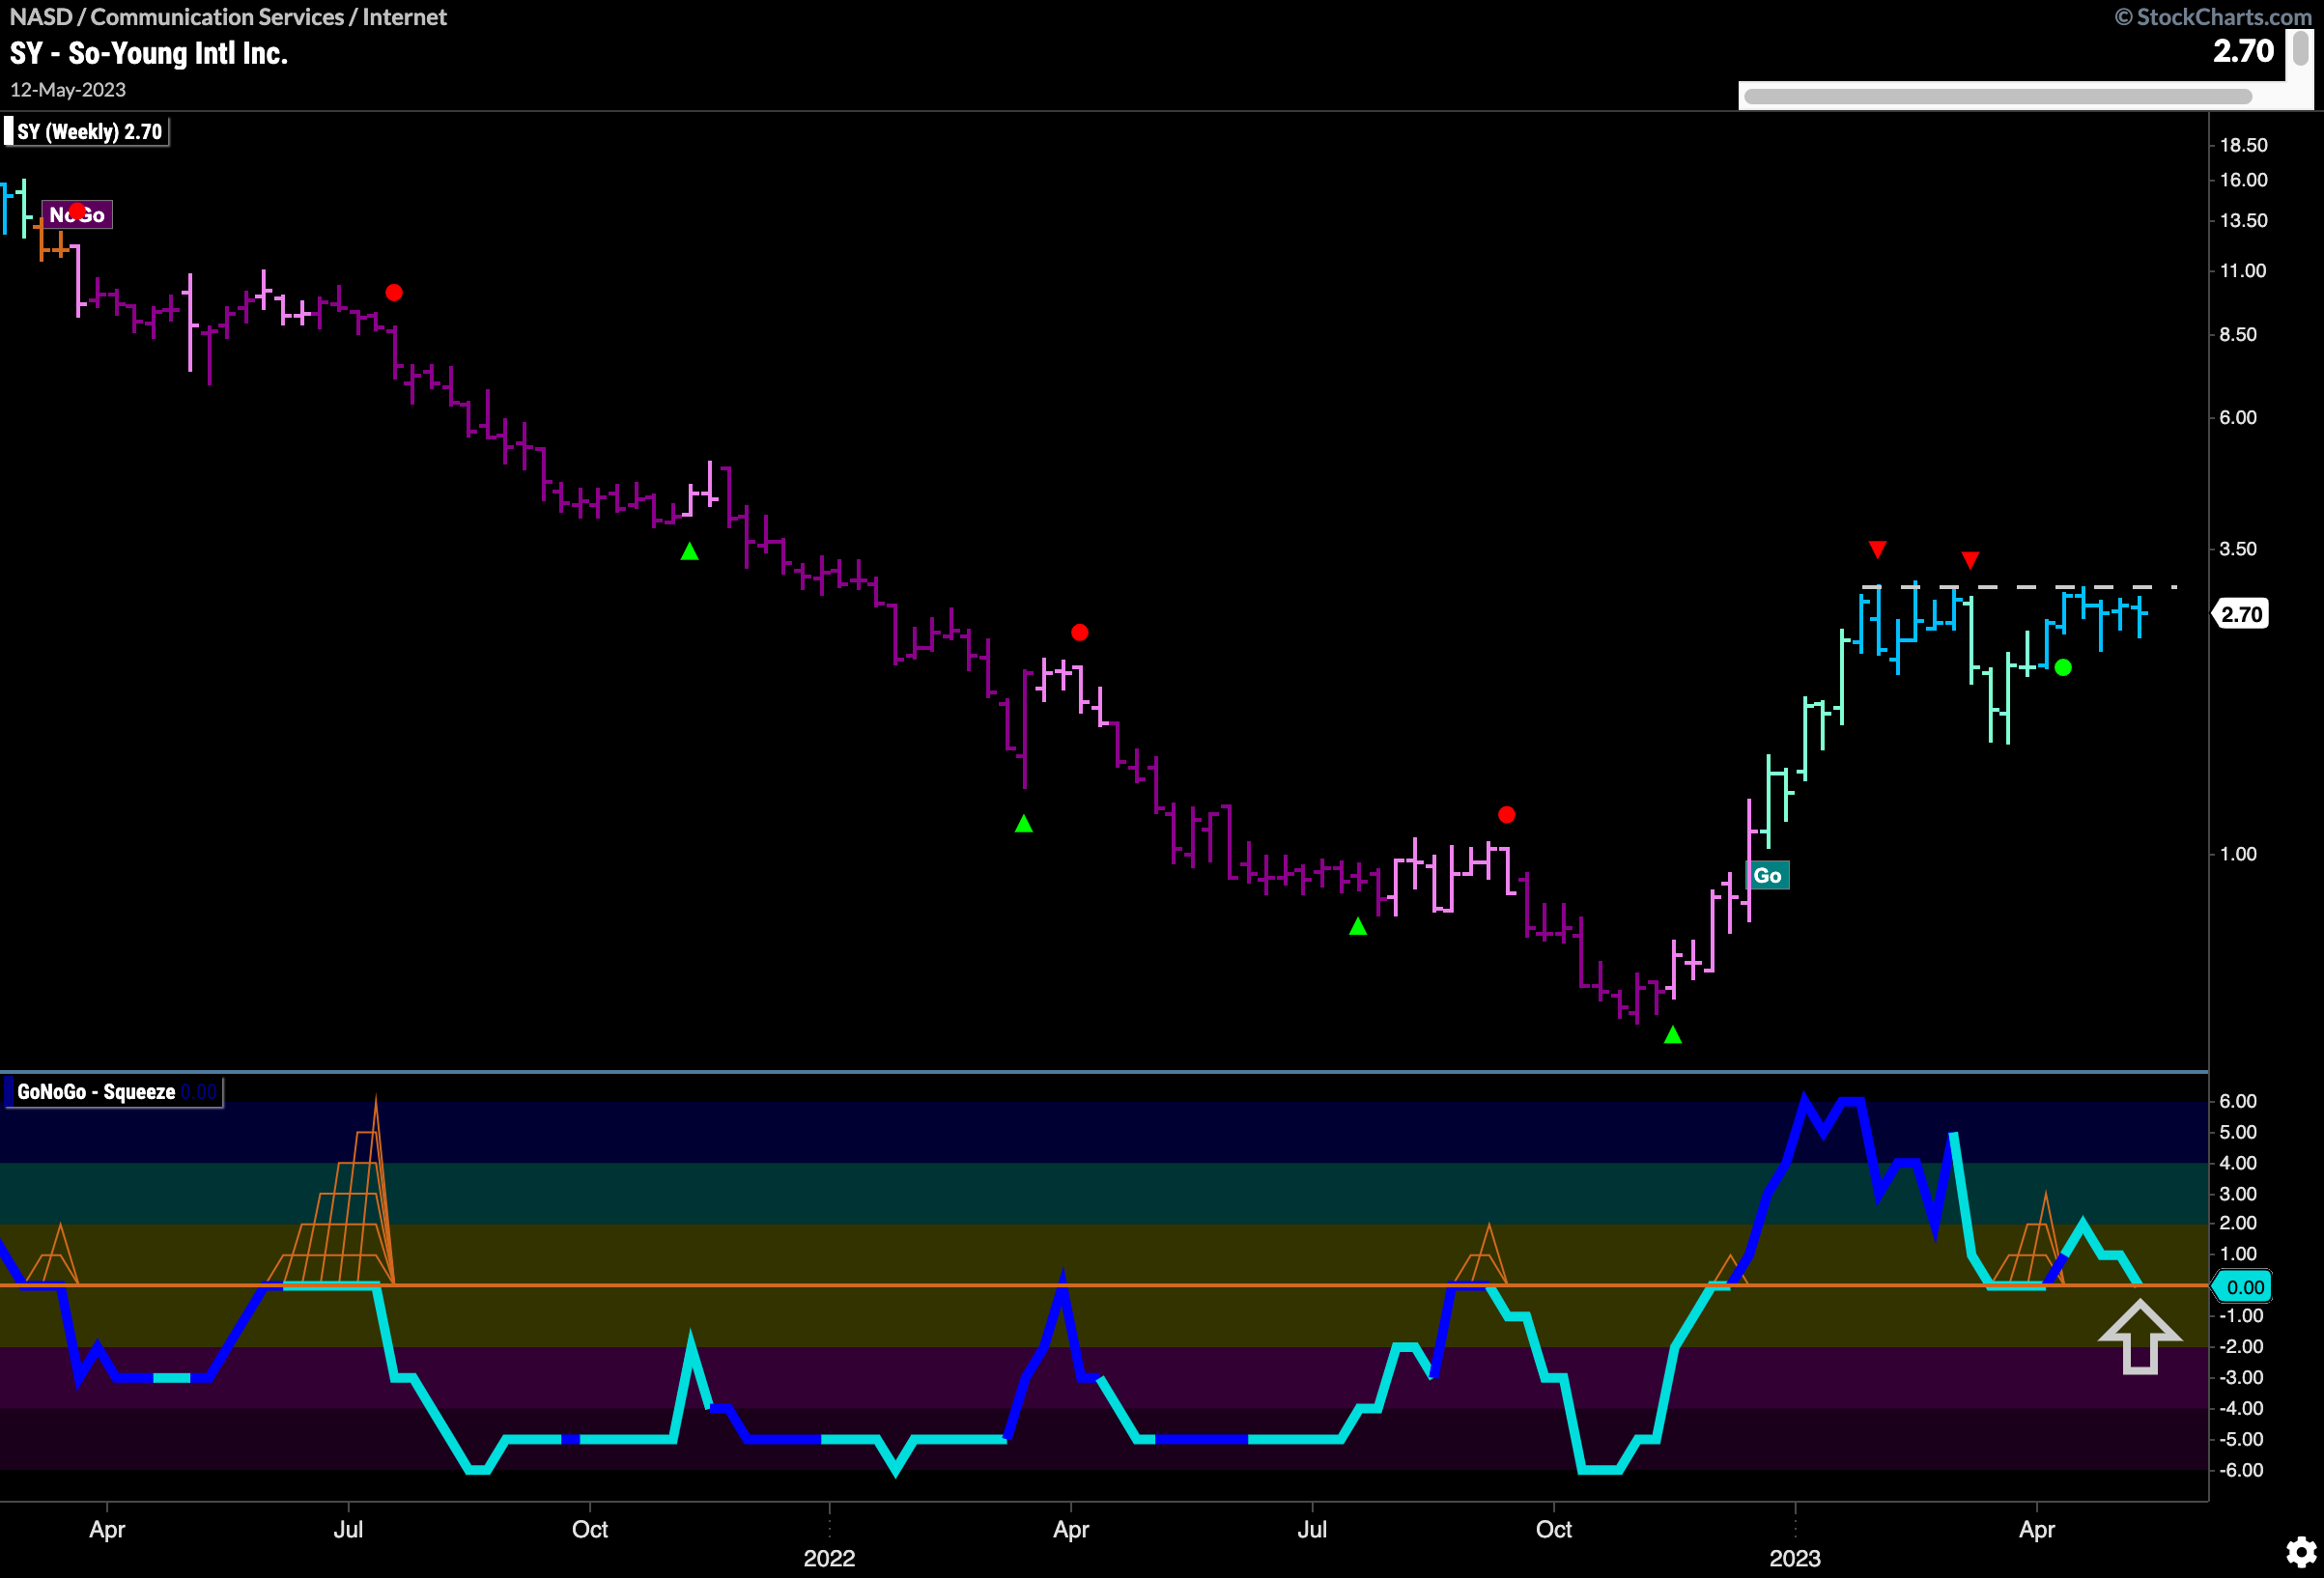
Looking at a stock in the internet index would allow us to be fishing where the fish are so to speak. The chart below shows the weekly chart of $SY. We can see that it is in a “Go” trend and after a strong move has been consolidating since the Go Countertrend Correction Icons (red arrows) we saw a little while ago. We will turn our eye to the GoNoGo Oscillator and we can see that it is testing the zero line from above again. We will want to see this level hold as support and that would allow the price trend to continue.
The daily chart below shows us just what price is up against. There is a lot of overhead supply and so breaking higher will not be easy. However, the weight of the evidence says that a “Go” trend is in place and that GoNoGo Oscillator is testing the zero line again. Should it find support here and break through into positive territory that would be a great sign for $SY.
