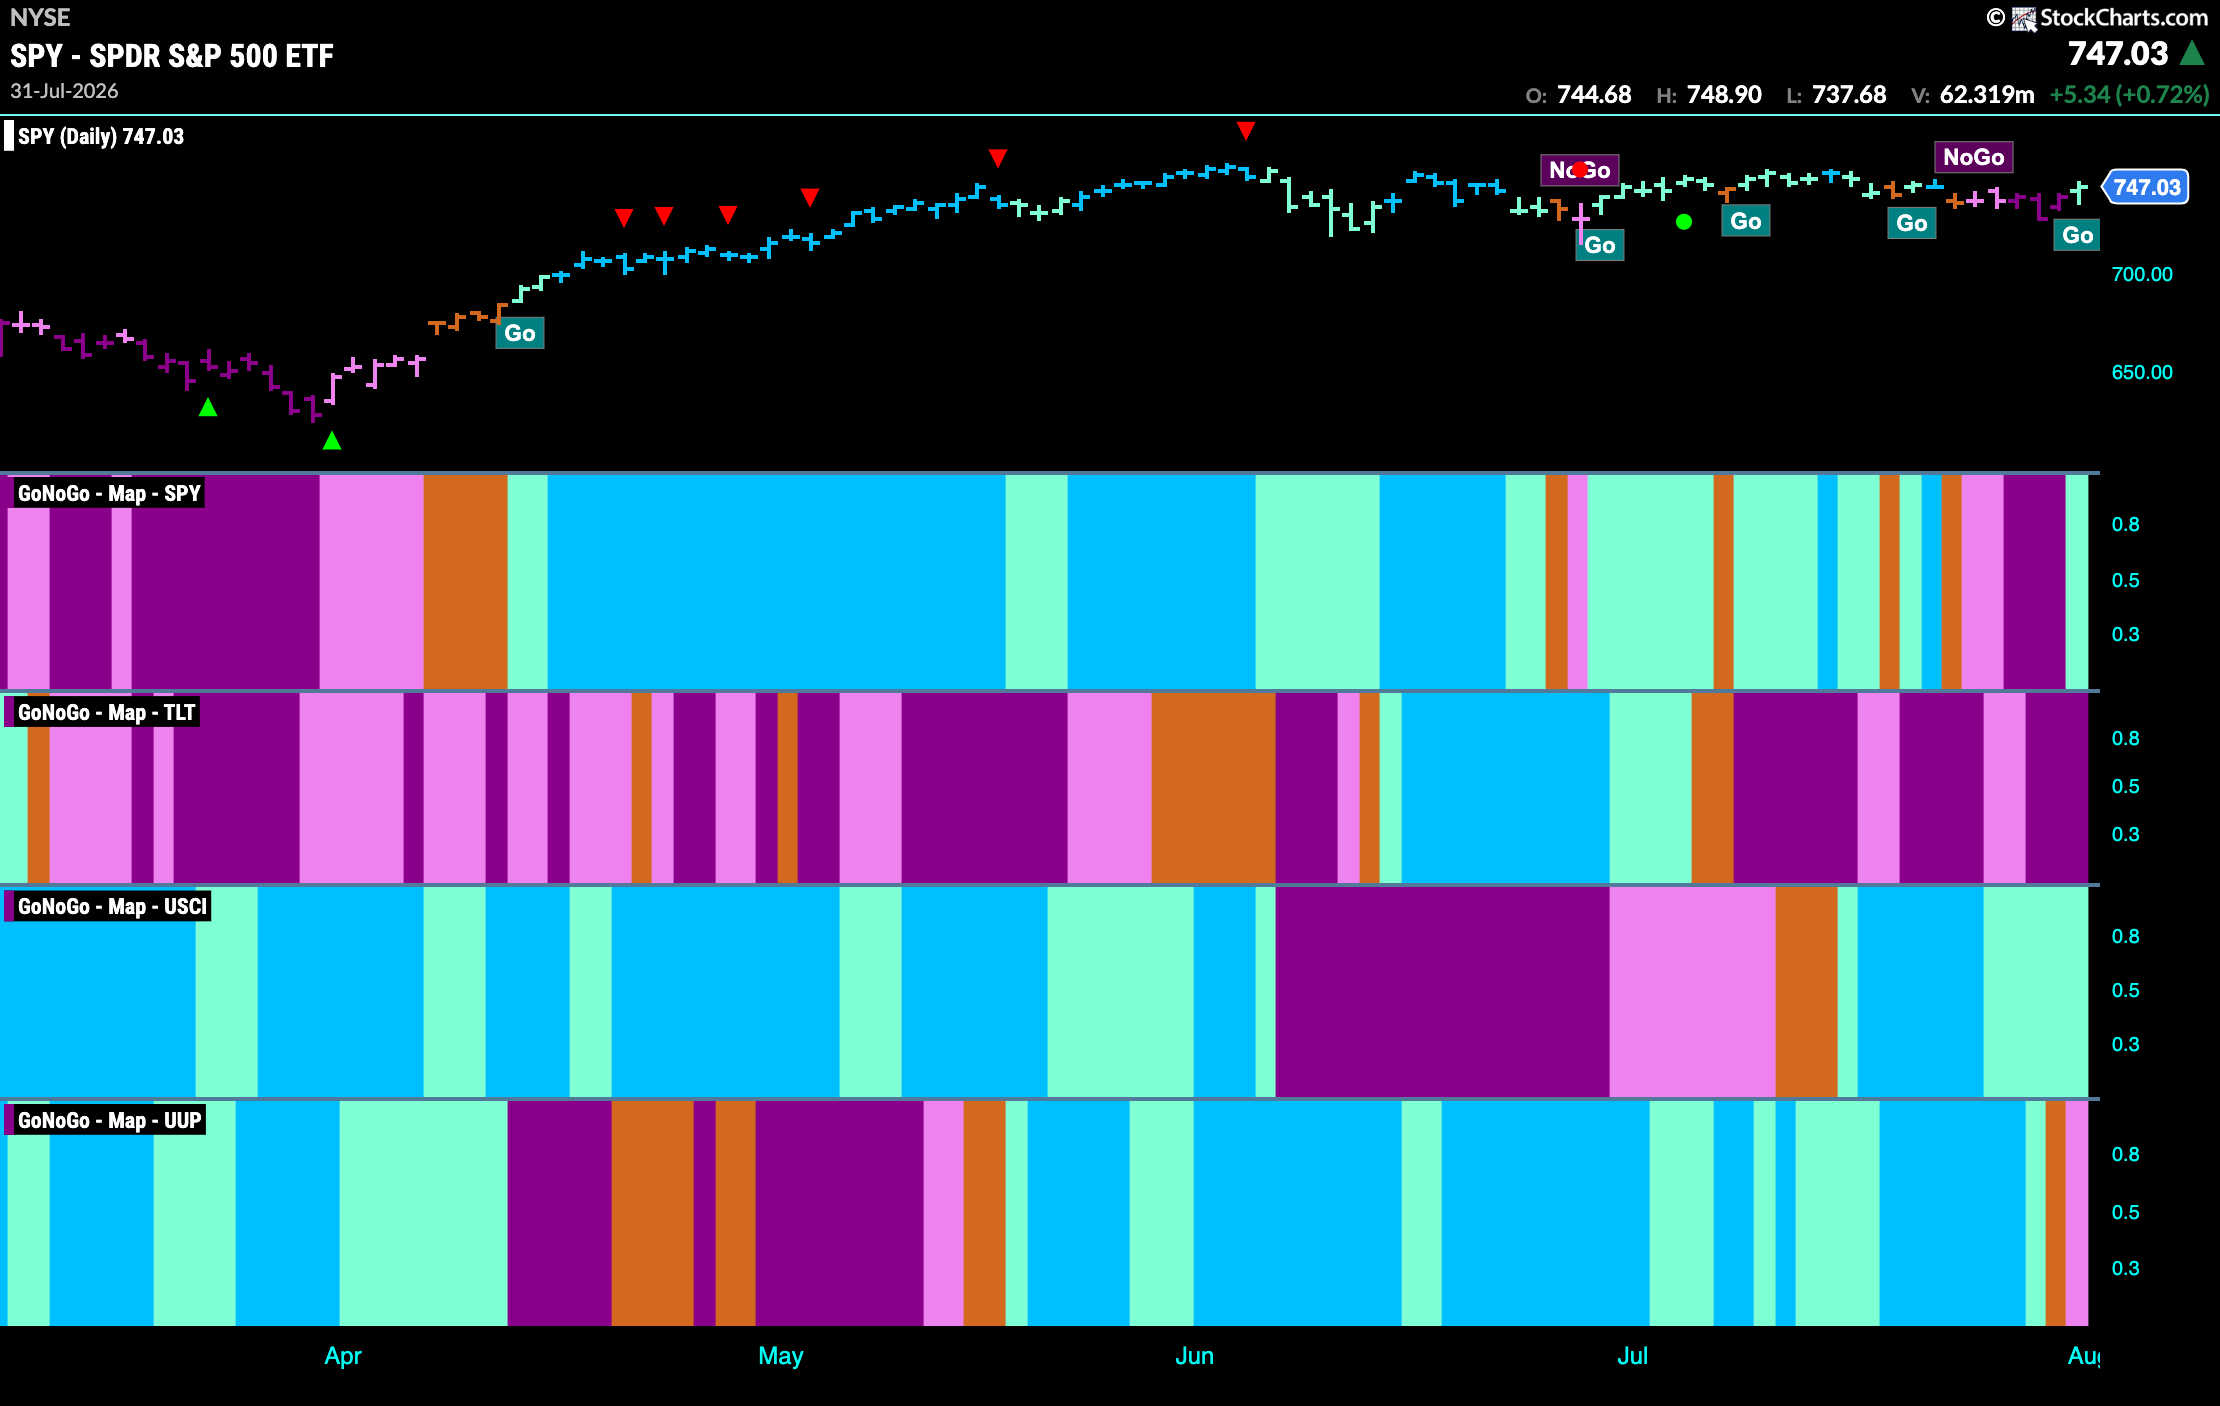
Good morning and welcome to this week’s Flight Path. The equity trend changed this week and we see the indicator painting a pale aqua “Go” bar. Treasury bond prices remain in a “NoGo” trend and we saw mostly strong purple bars this week. U.S. commodities also stayed in the trend they were in and we see a string of weaker aqua bars. The dollar saw a change in trend as it painted first an amber “Go Fish” bar of uncertainty and then a pink “NoGo” bar.
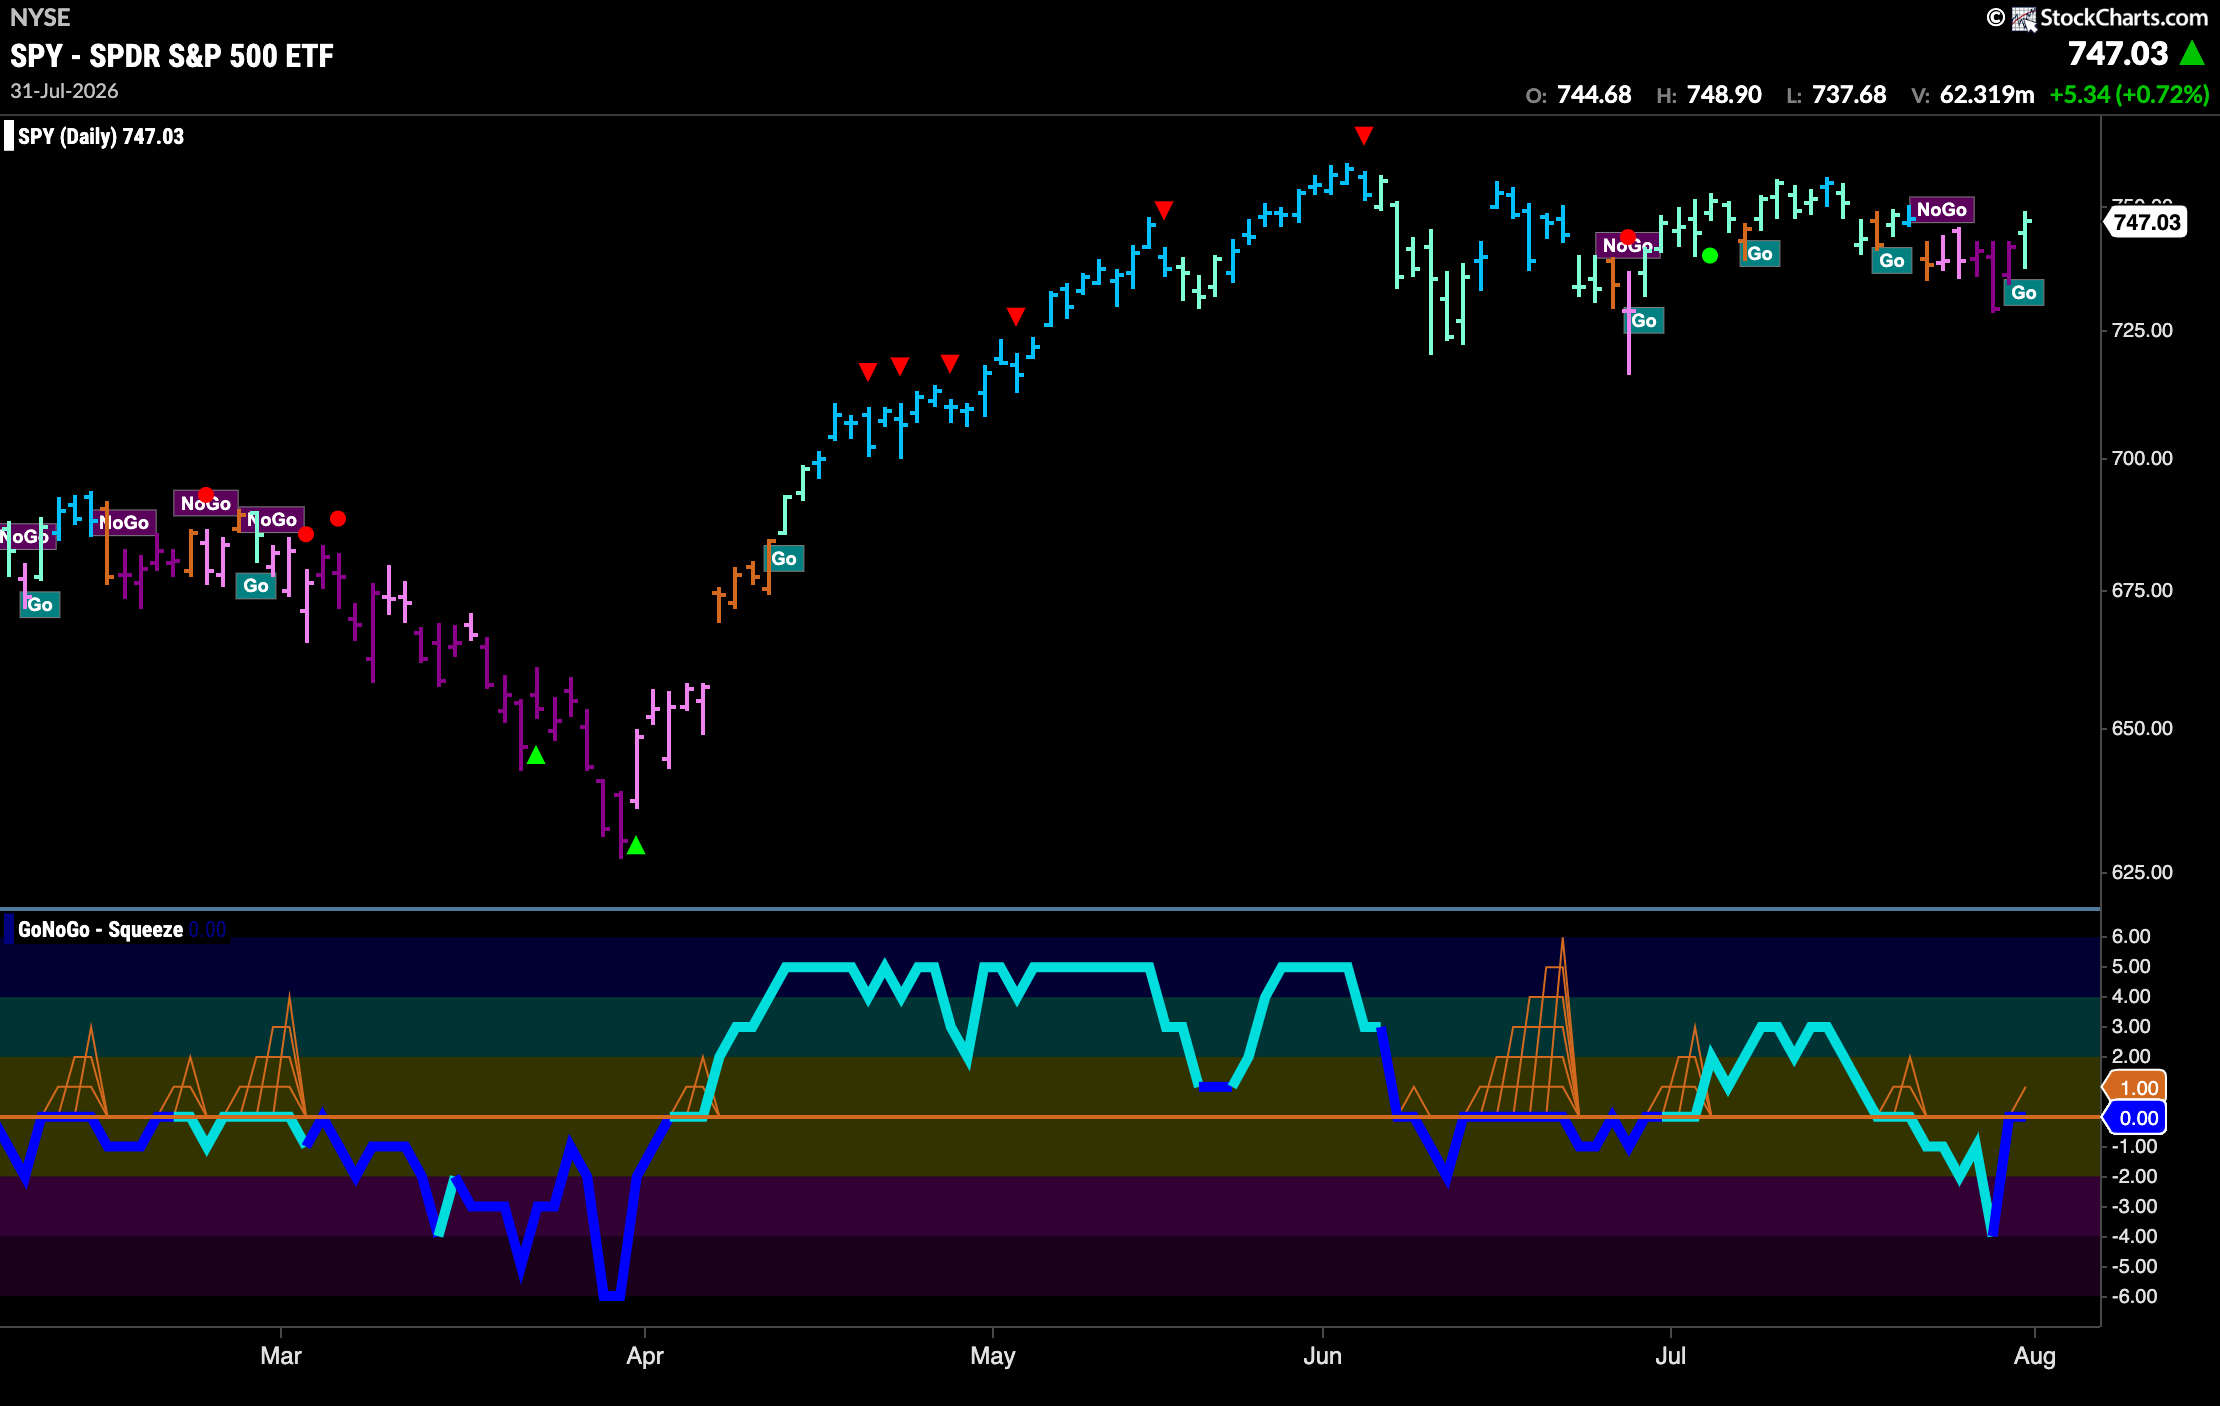
$SPY Jumps Out of “NoGo” Trend to Paint an Aqua Bar
The GoNoGo chart below shows that after only a week of “NoGo” bars a “Go” trend returned as the indicator paints an aqua bar. We will watch to see if this new trend holds and if so whether it can threaten new highs from months ago. GoNoGo Oscillator is back testing the zero line from below and we will watch to see if finds resistance at this level or if it can regain positive territory.
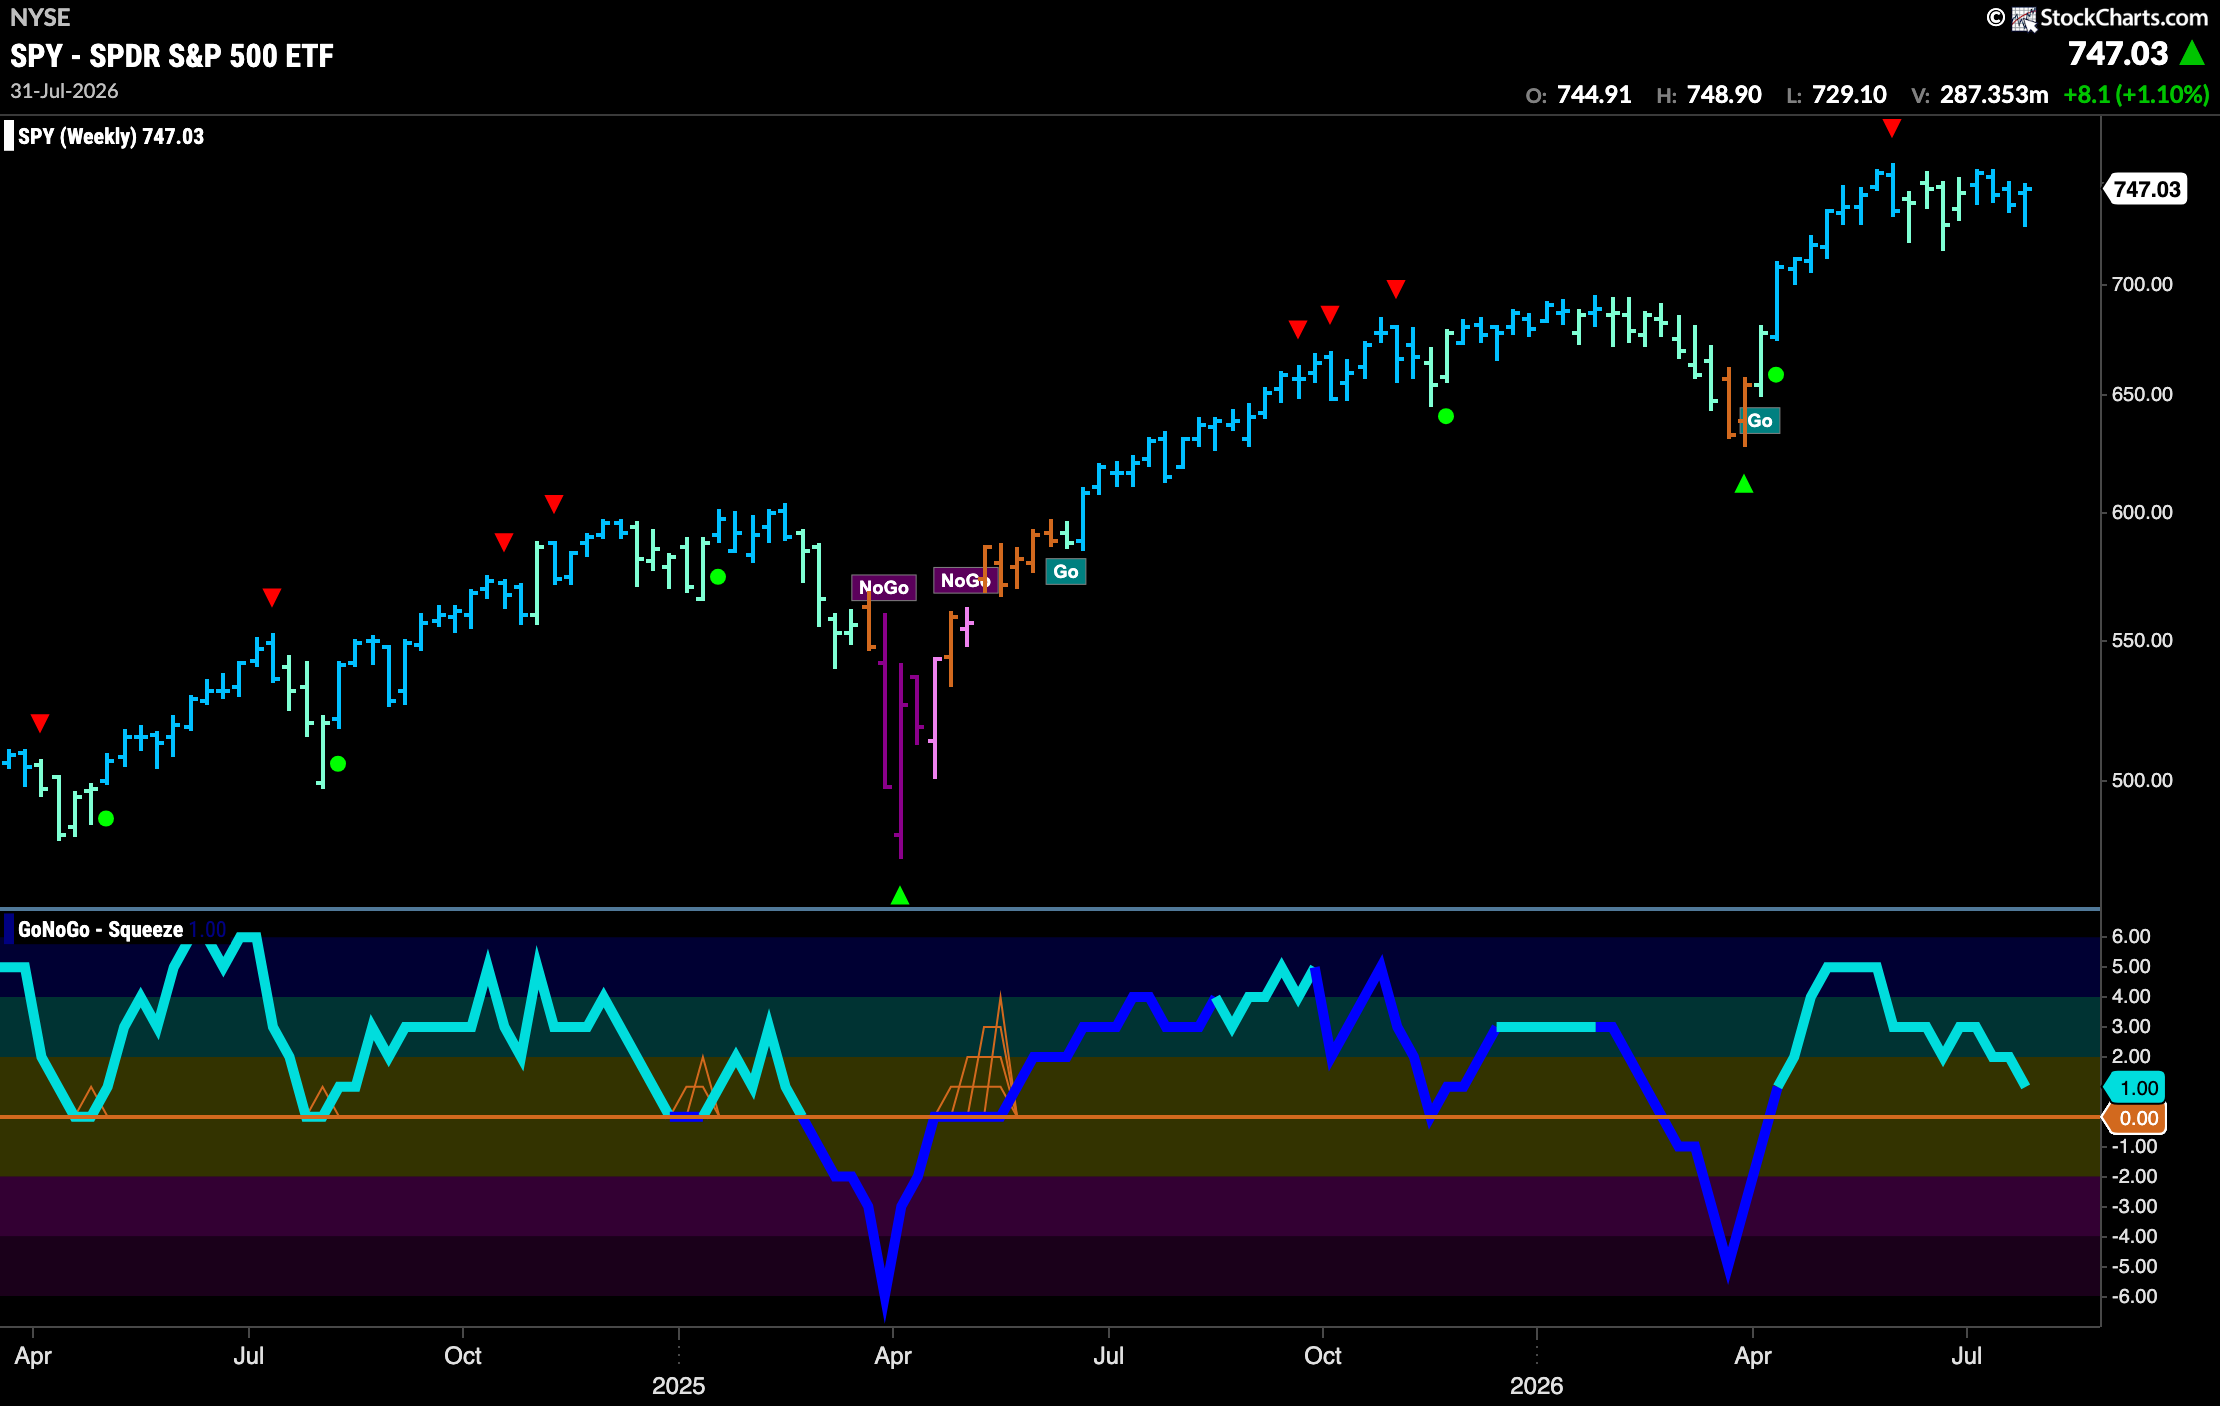
The weekly chart shows that the “Go” trend continues and again there is a strong blue bar painted while price stays below recent highs. GoNoGo Oscillator is falling to test the zero line from below and we will watch to see if it finds support at this level to confirm the trend.
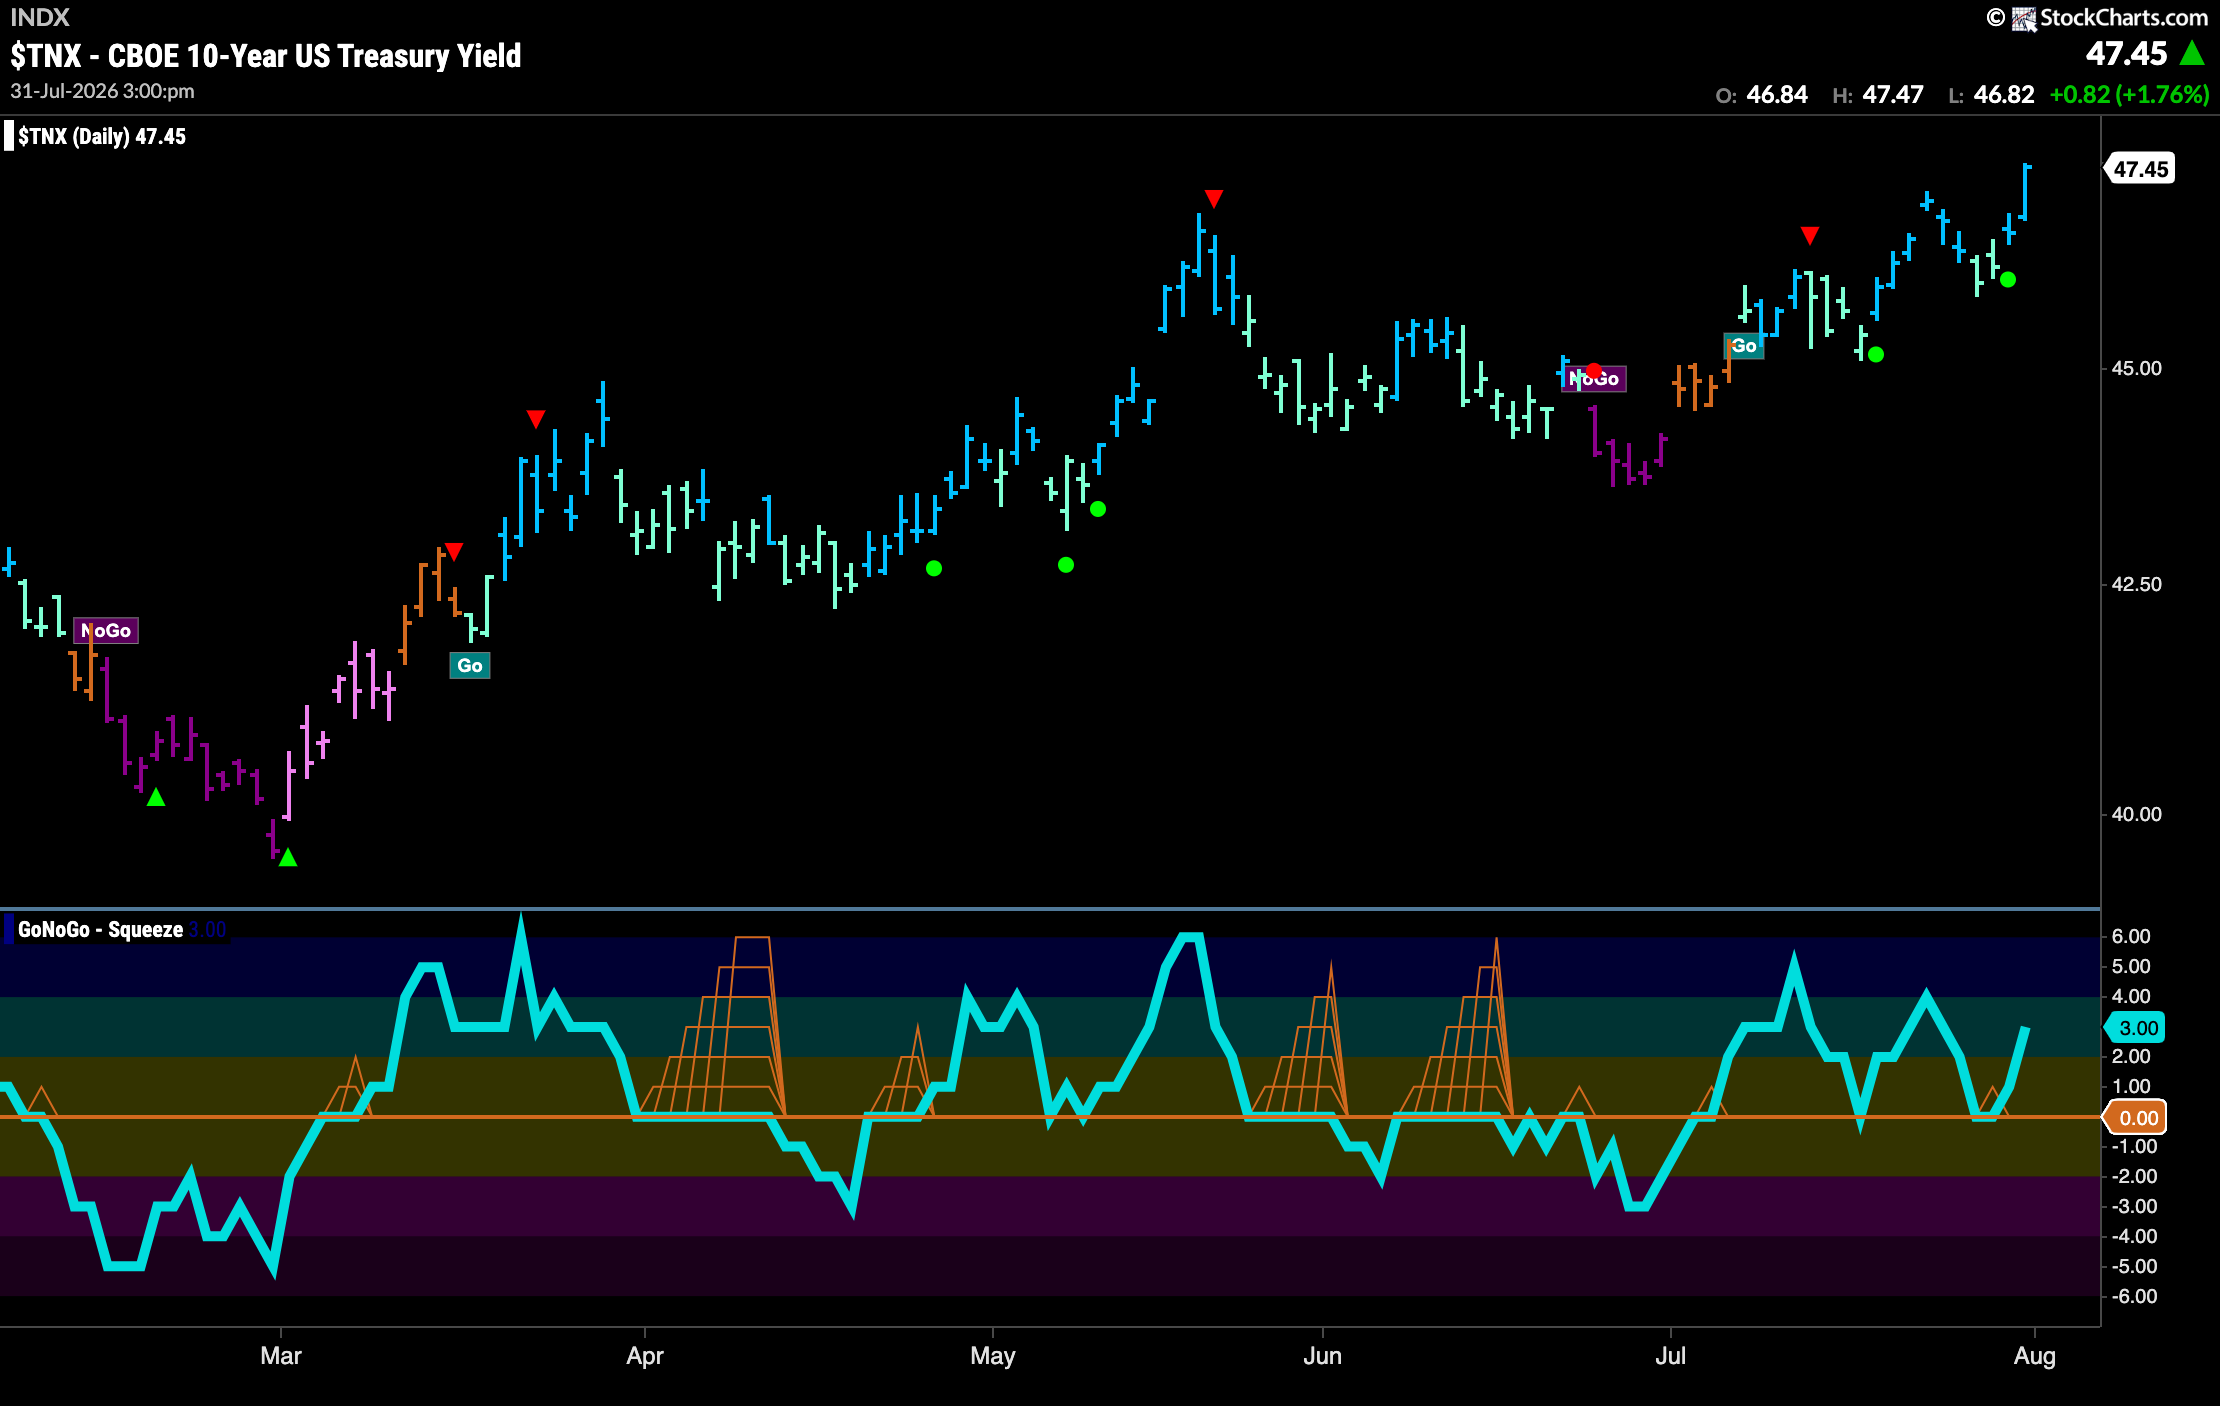
Treasury Rates Post New High in “Go” Trend
GoNoGo Trend shows that the “Go” trend has stayed strong this week and we see a new higher high as the indicator paints strong blue bars. This comes after GoNoGo Oscillator bounced off the zero line back into positive territory. This momentum boost saw the trend stay strong and hit new highs.
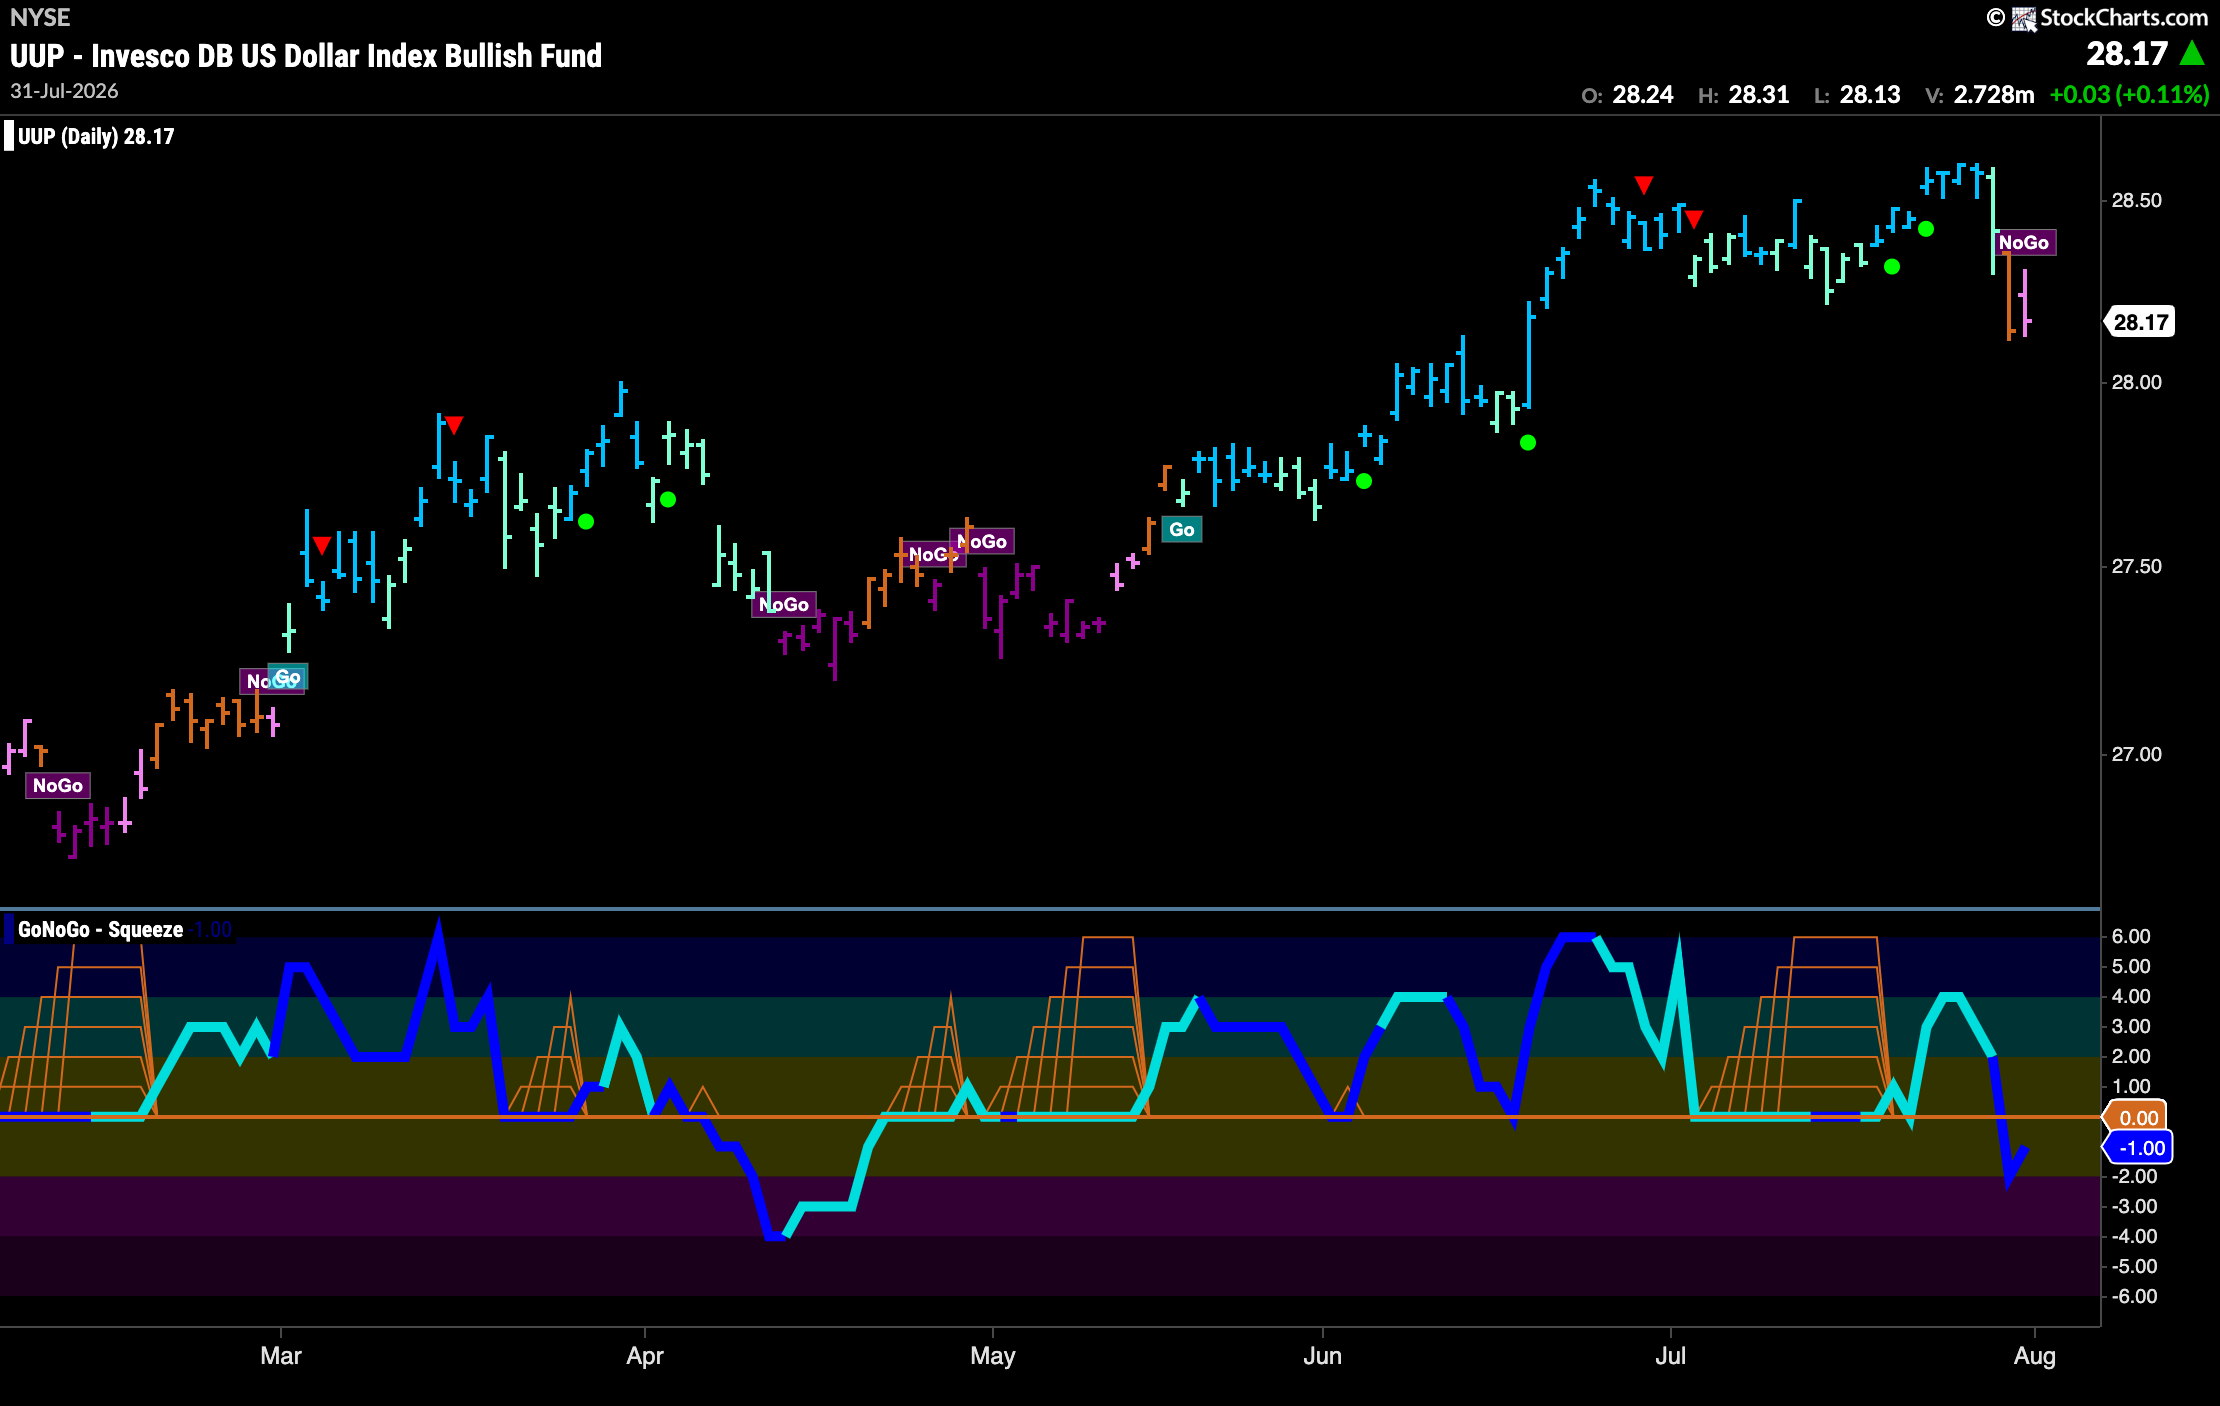
Dollar ($UUP) Falls out of “Go” Trend
The chart below shows that the “Go” trend has given way first to an amber “Go Fish” bar and then a weak pink “NoGo”. This has happened as price falls to a new lower low and GoNoGo Oscillator crashes through the zero line into negative territory. With heavy volume, we will watch to see if there continues to be downside pressure on price in the coming days.
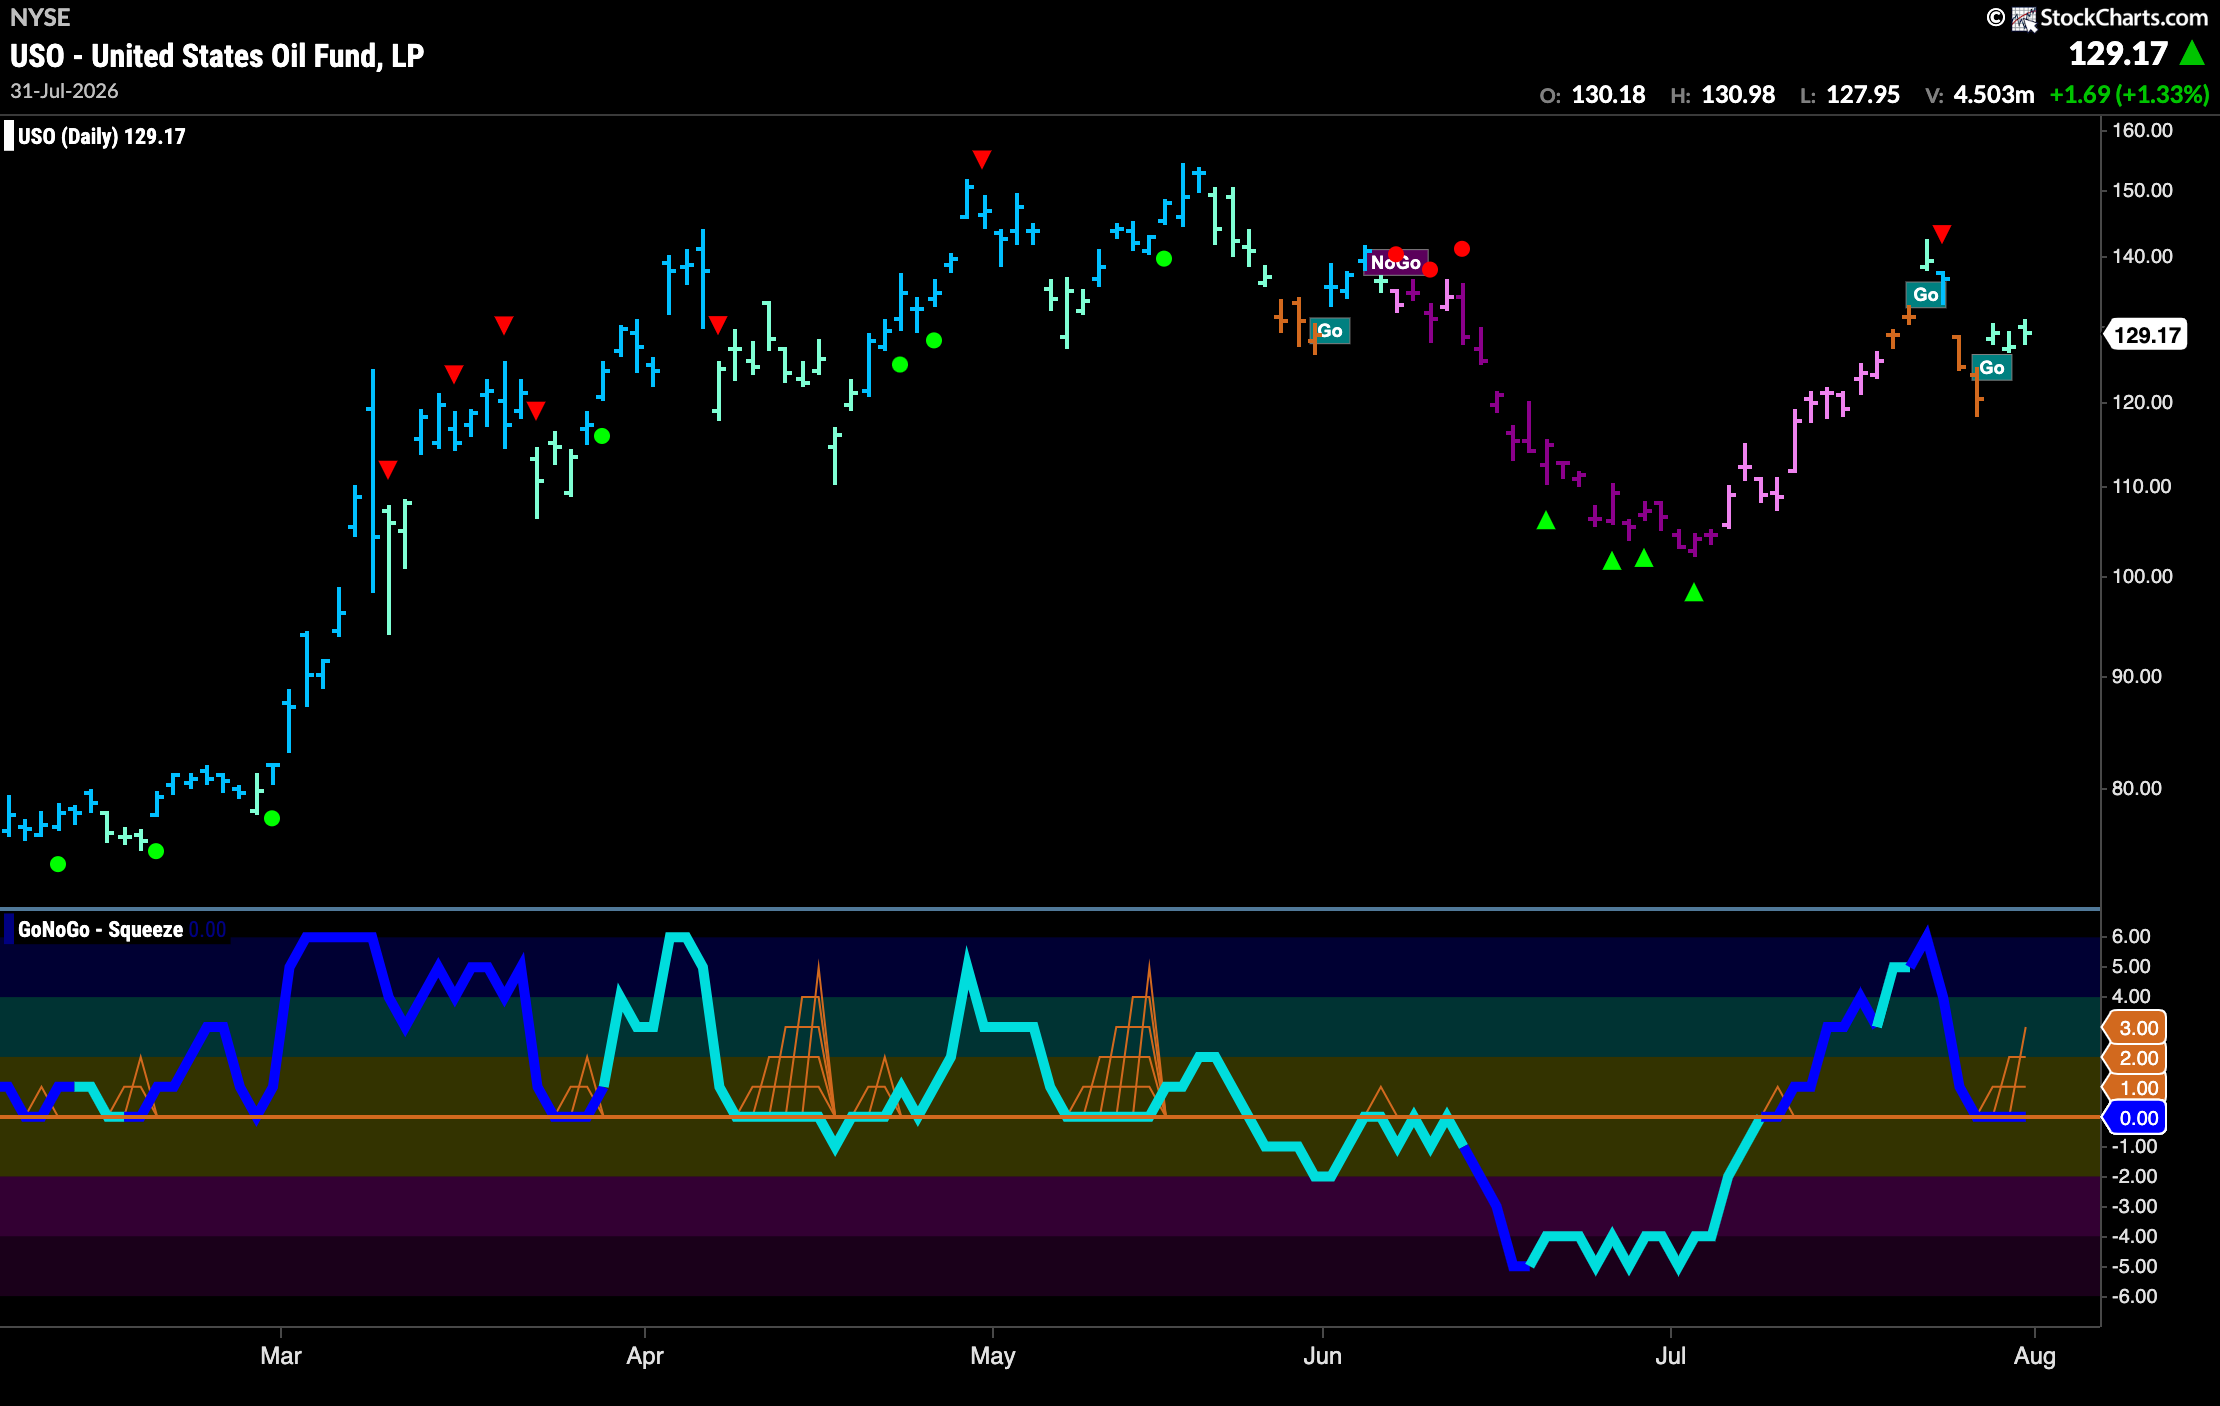
“Go” Trend Returns After Uncertainty
GoNoGo Trend shows that the “Go” trend has returned after a few bars of uncertainty reflected with amber “Go Fish” bars. Price looks to have set a new higher low and we will watch to see if the “Go” trend can take hold. GoNoGo Oscillator is testing the zero line from above and we will watch to see if it finds support. If it can rally into positive territory that may give price the push it needs to climb higher.
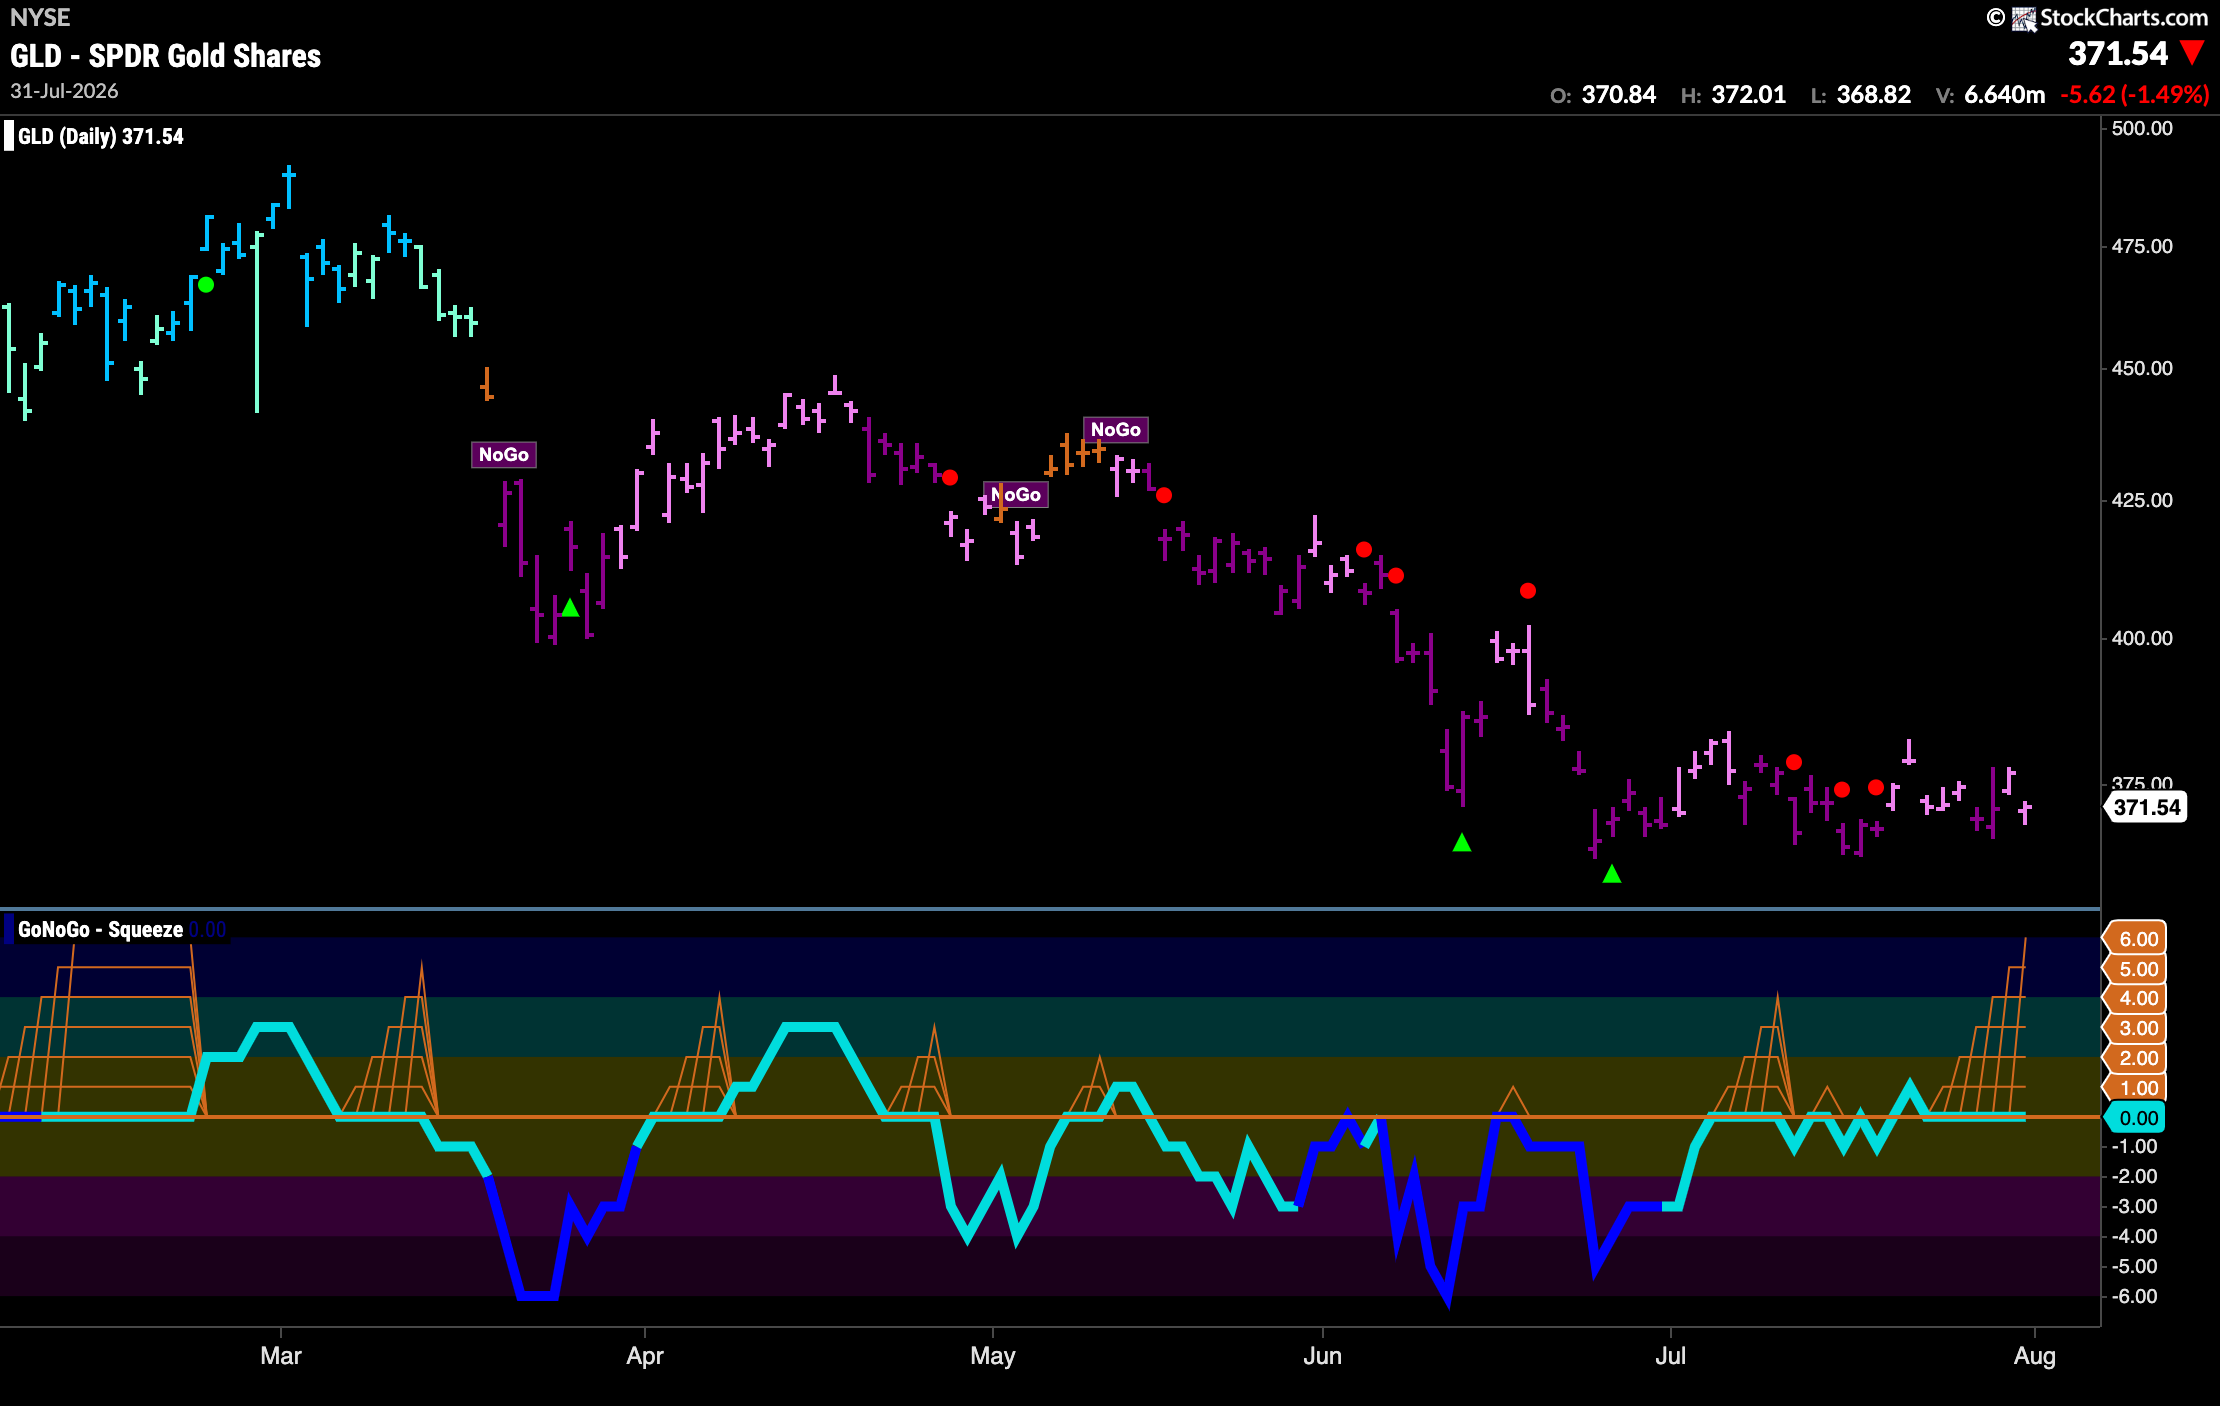
Gold ($GLD) “NoGo” Remains But Moves Sideways
The “NoGo” trend continues for gold but we see price of the precious metal move mostly sideway for several weeks now. GoNoGo Trend paints a mixture of pink and purple bars but trading range has shrunk as no new lows are made. GoNoGo Oscillator has been captured by the zero line and we see a Max GoNoGo Squeeze representing the virtual tug of war between buyers and sellers at this level.
Sector RelMap
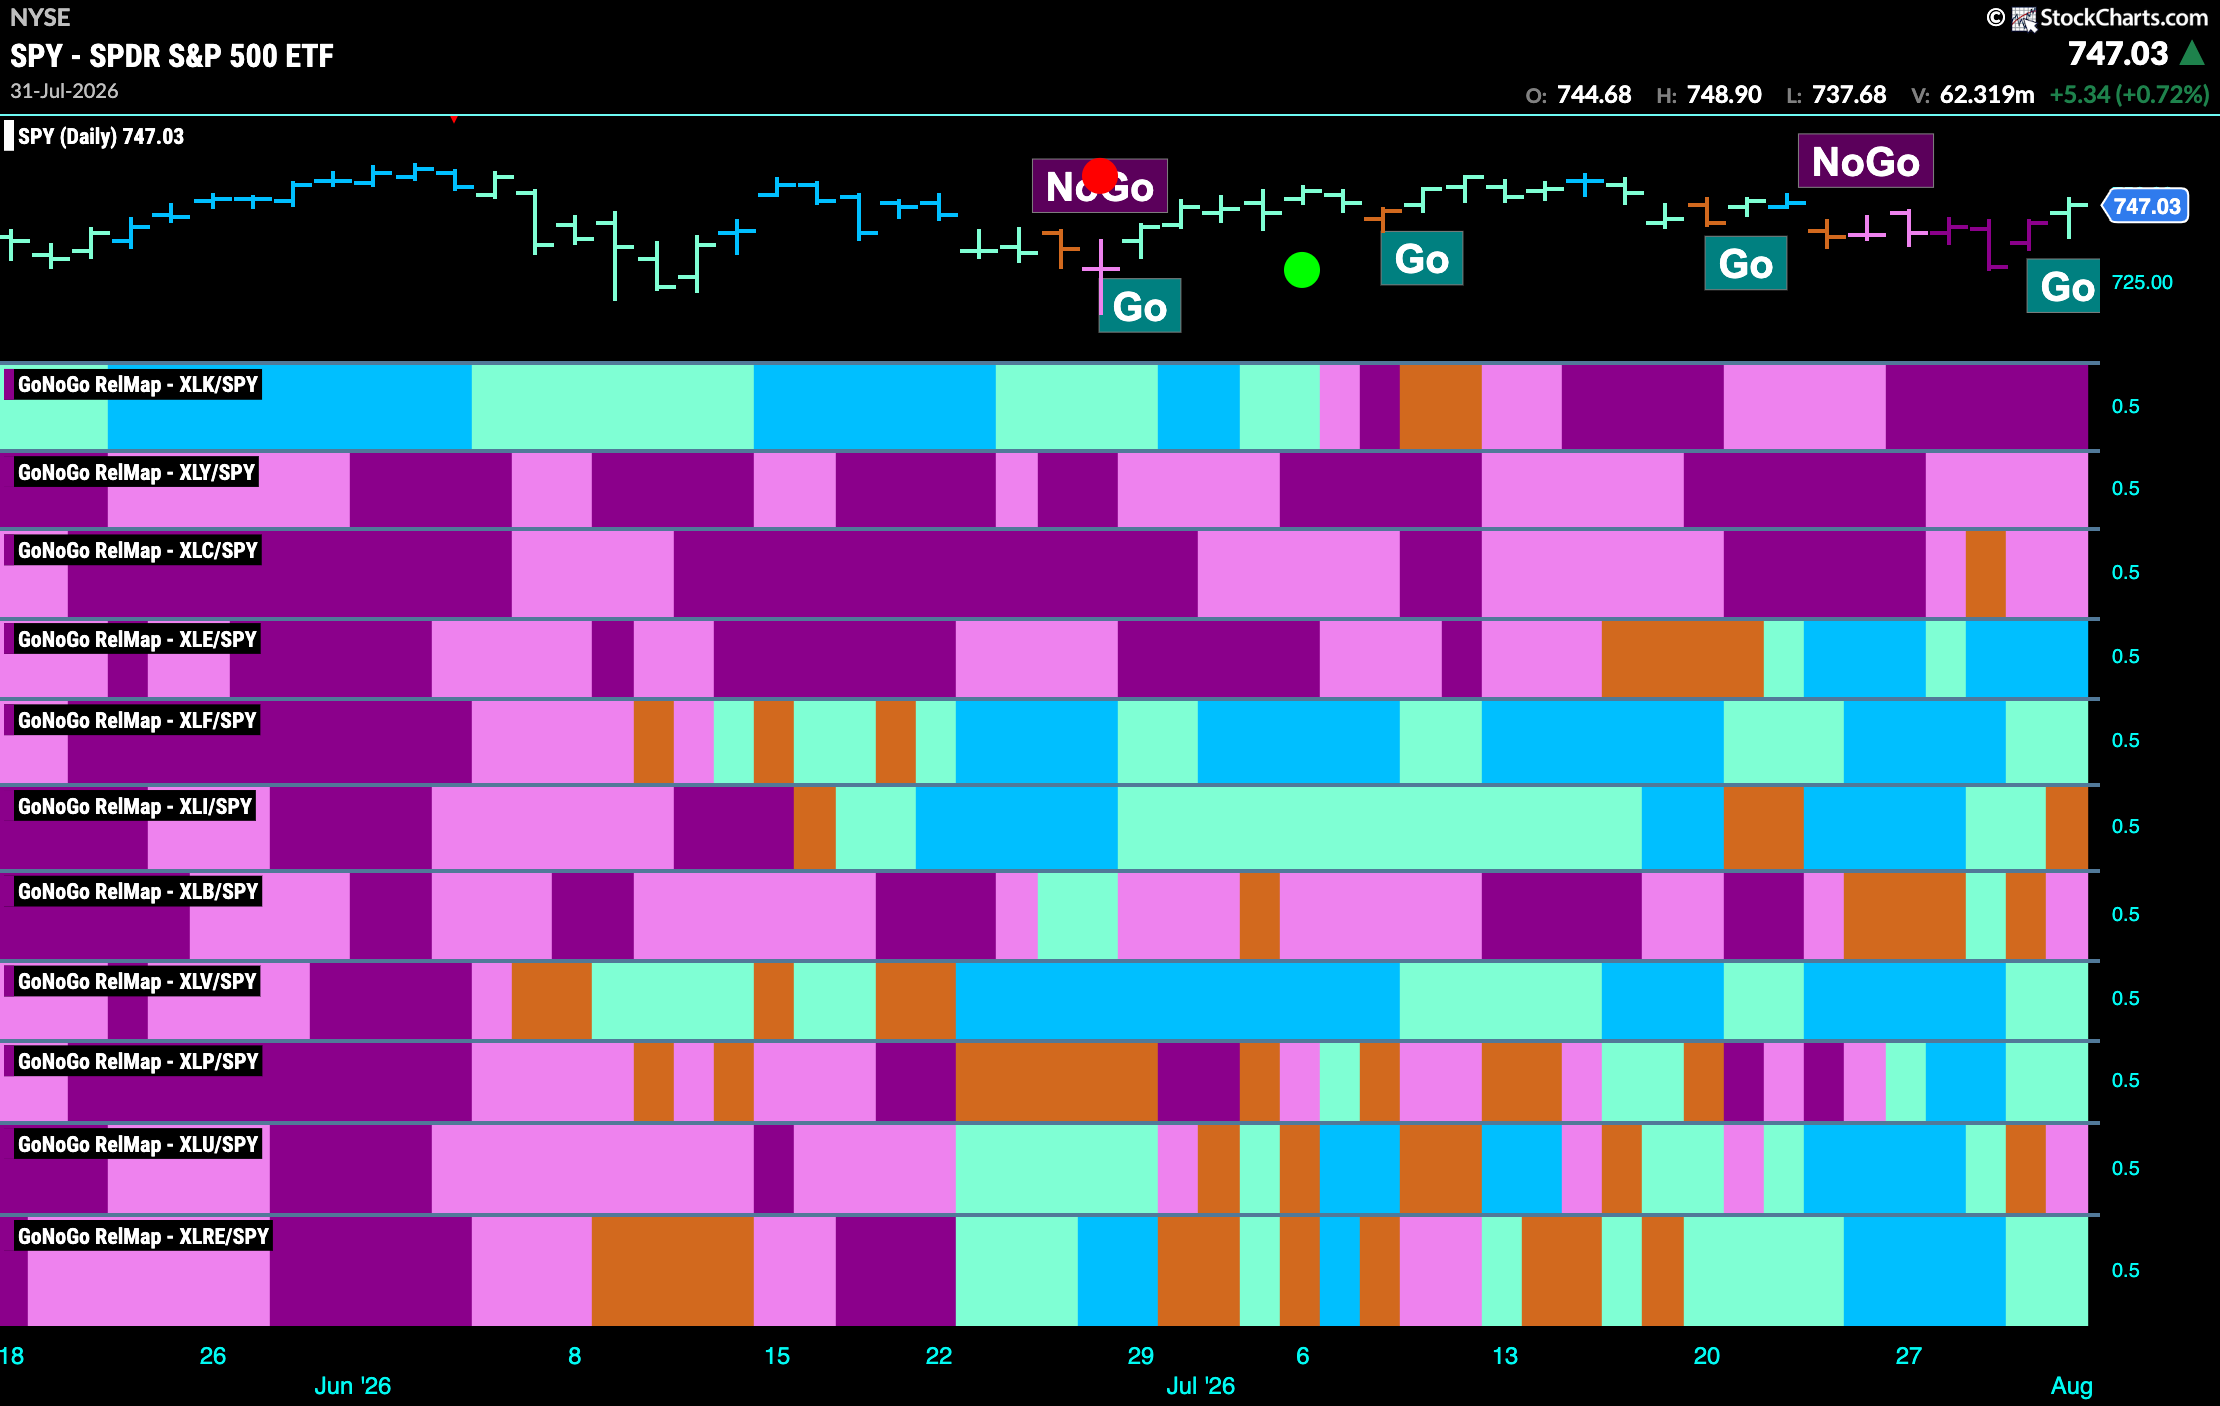
Below is the GoNoGo Sector RelMap. This GoNoGo RelMap applies the GoNoGo Trend to the relative strength ratios of the sectors to the base index. With this view we can get a sense of the relative out performance and relative underperformance of the sectors. 5 sectors are in a relative “Go” trend. $XLE, $XLF, $XLV, $XLP, and $XLRE are painting blue relative “Go” bars.
Energy Sub-Group RelMap
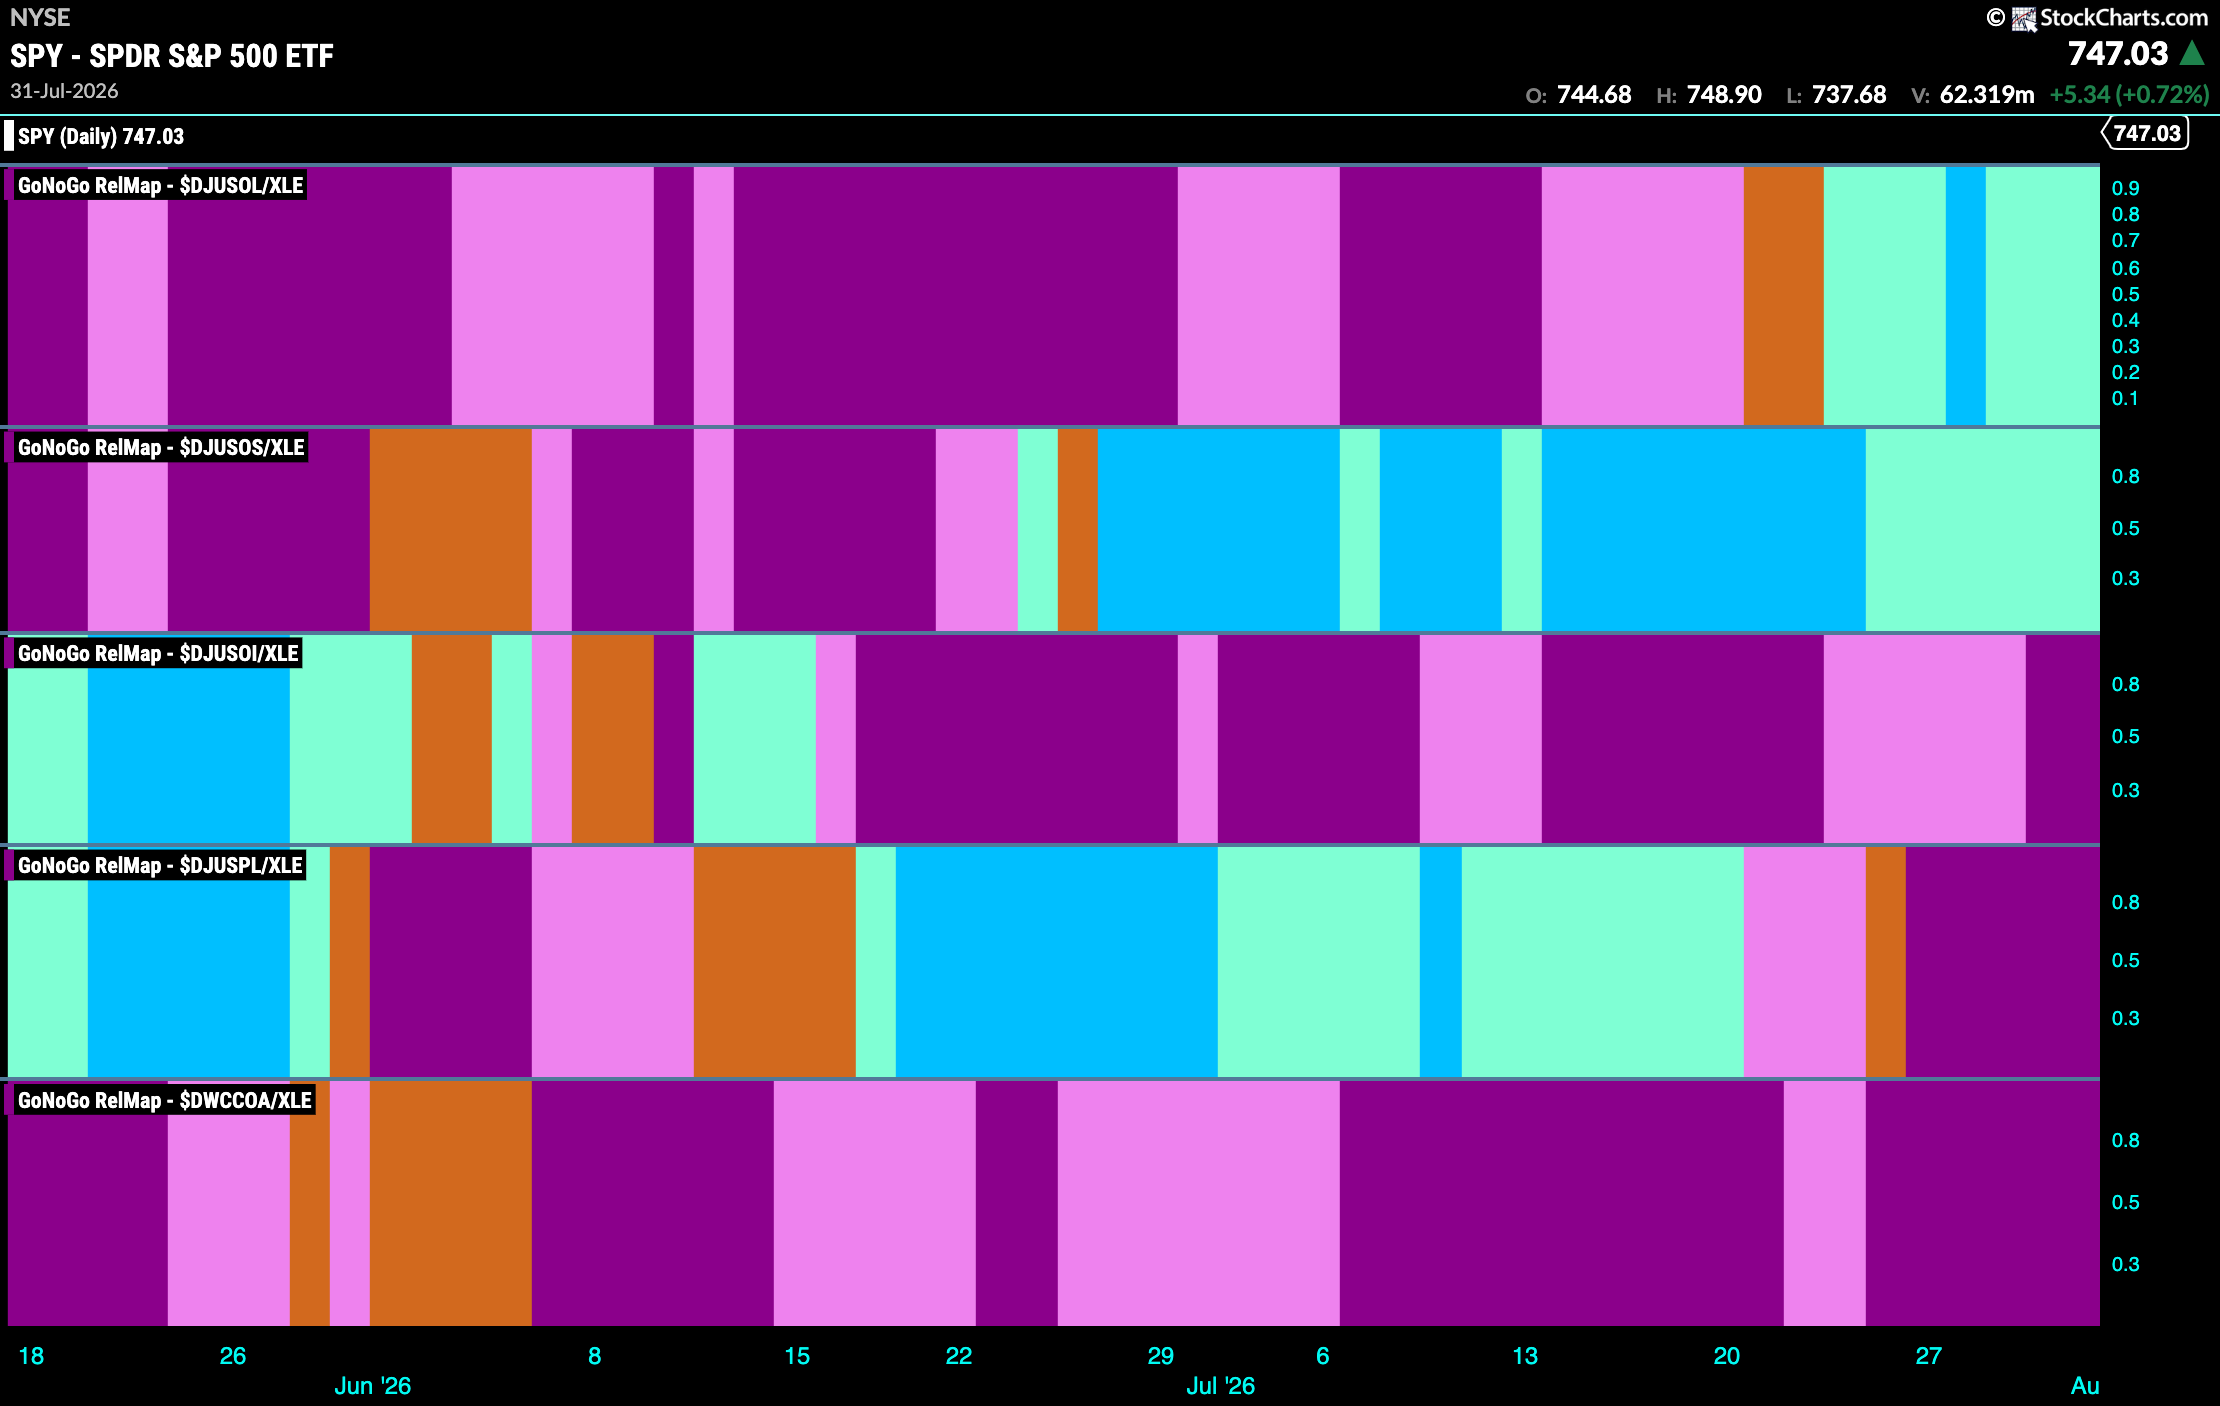
The chart below shows a relative trend breakdown of the sub groups within the energy sector this week. The Sub-Group RelMap plots the GoNoGo Trend of each sub index to the $XLV. We saw in the above GoNoGo Sector HeatMap that $XLE is painting relative “Go” bars. When we look at the below RelMap we can see that the oil equipment and services index in the 1st panel is painting new aqua “Go” bars on a relative basis.
$LPG Tests Prior Highs in “Go” Trend
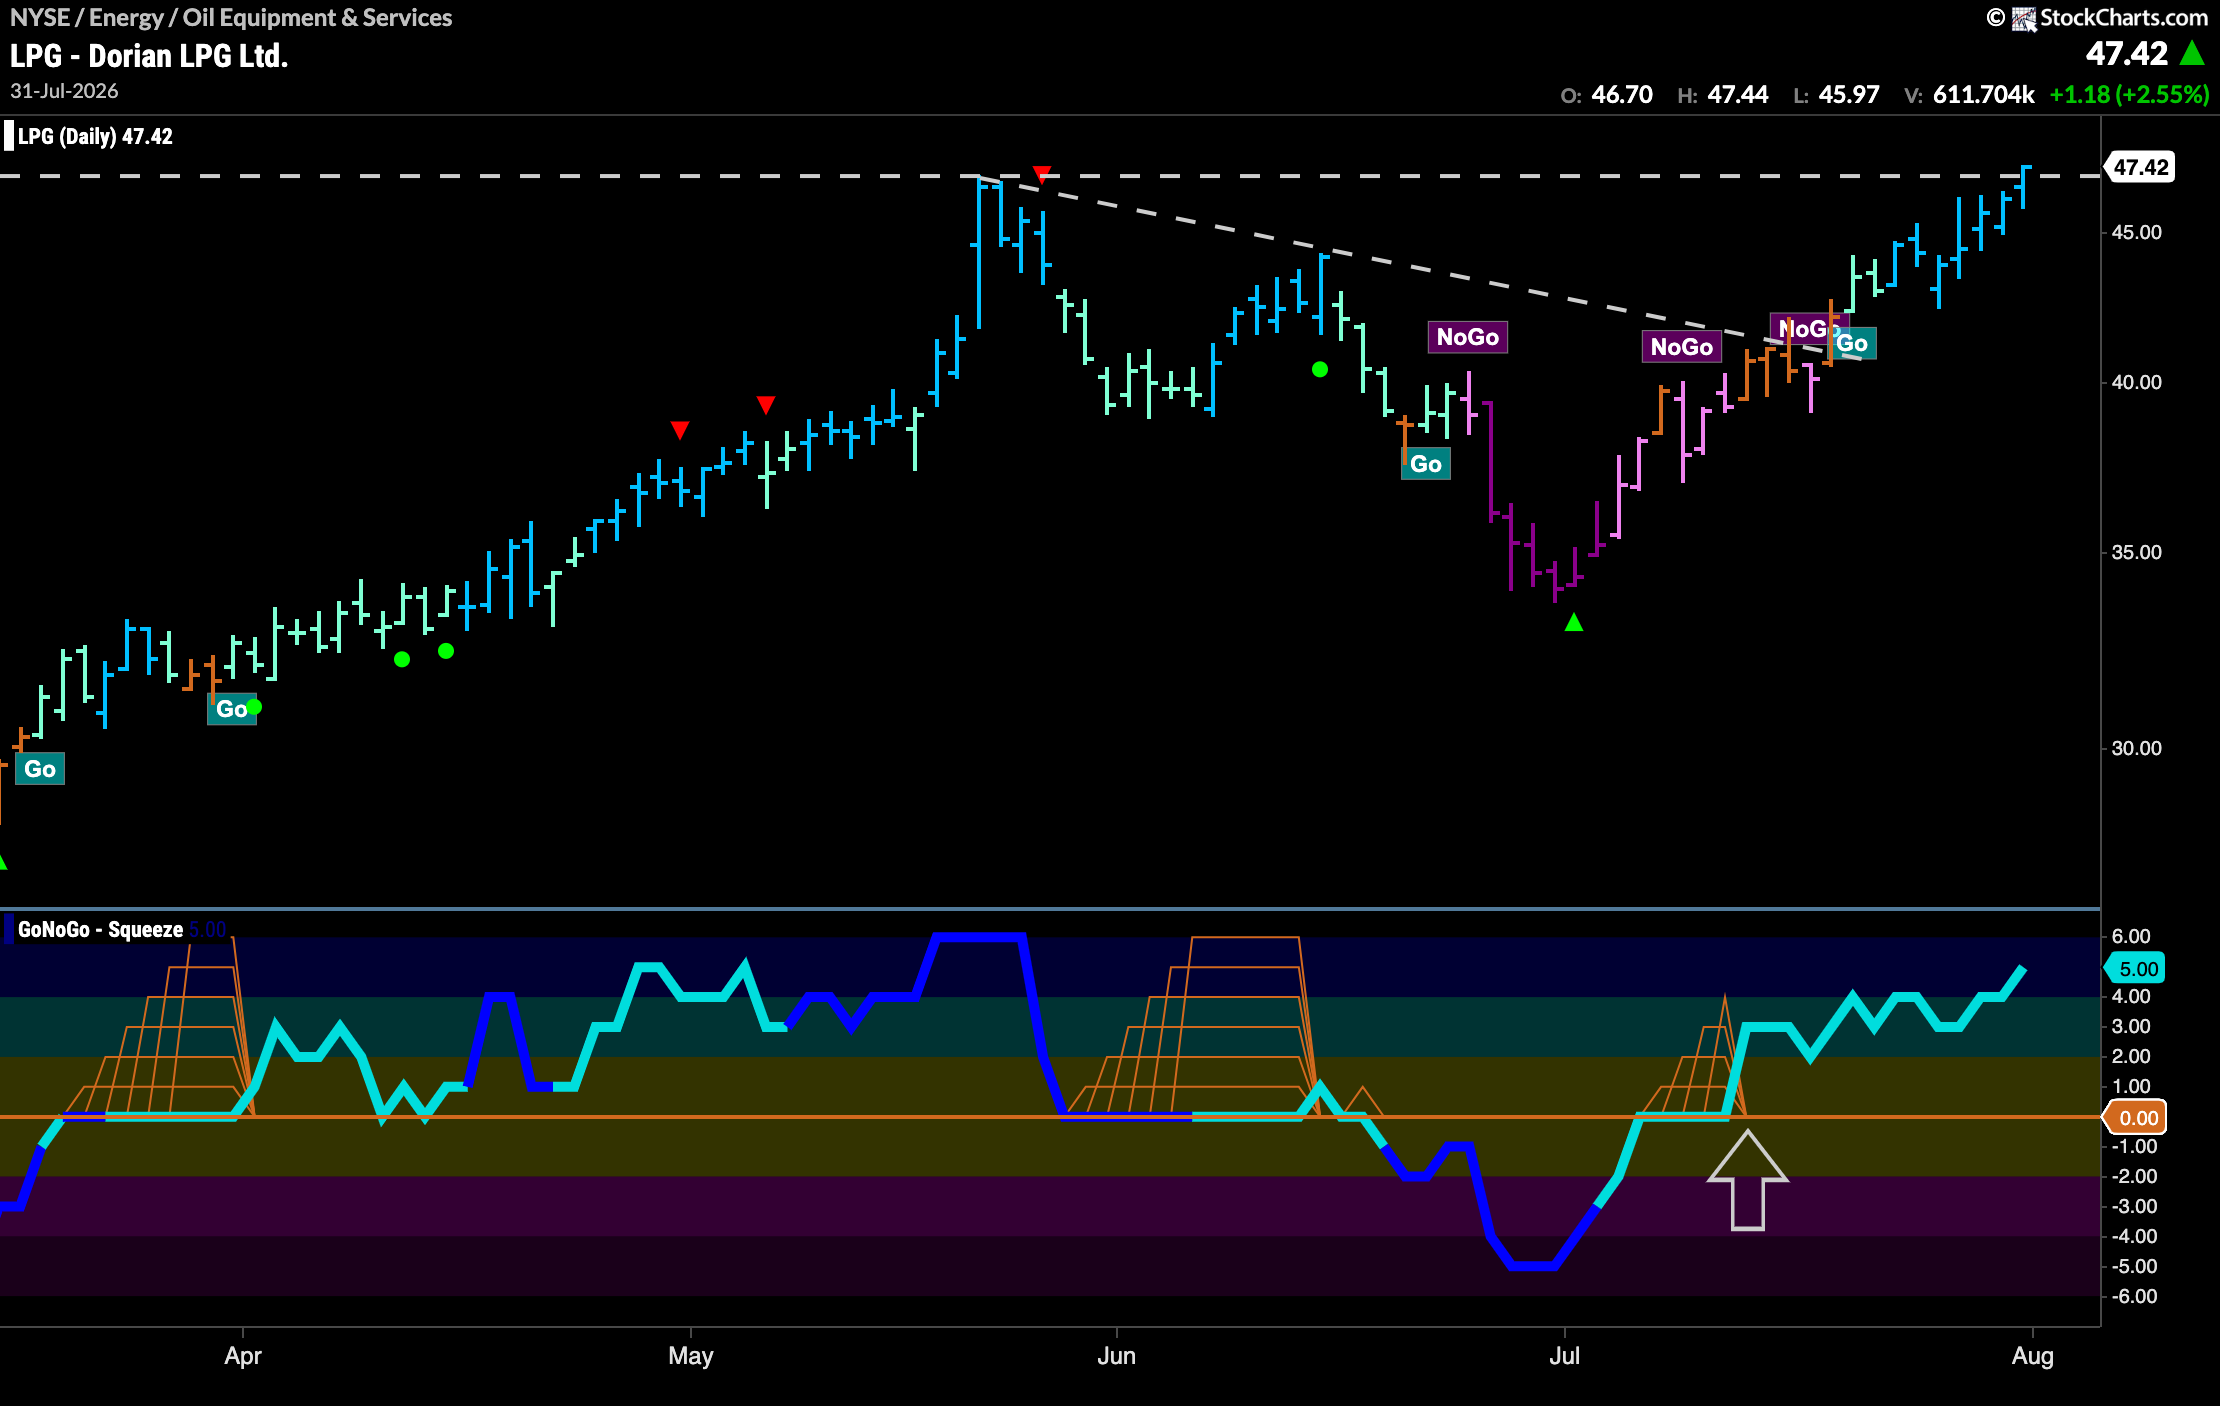
The GoNoGo Chart below shows that the new “Go” trend has continued to help prices climb over the past week and now we are testing prior highs from late May. GoNoGo Oscillator helped hint at the new “Go” trend several weeks ago when it broke above the zero line. Now, with the oscillator entering overbought territory we will watch to see if there is enough market enthusiasm to help push price higher.
$WBI Looks for Support in “Go” Trend
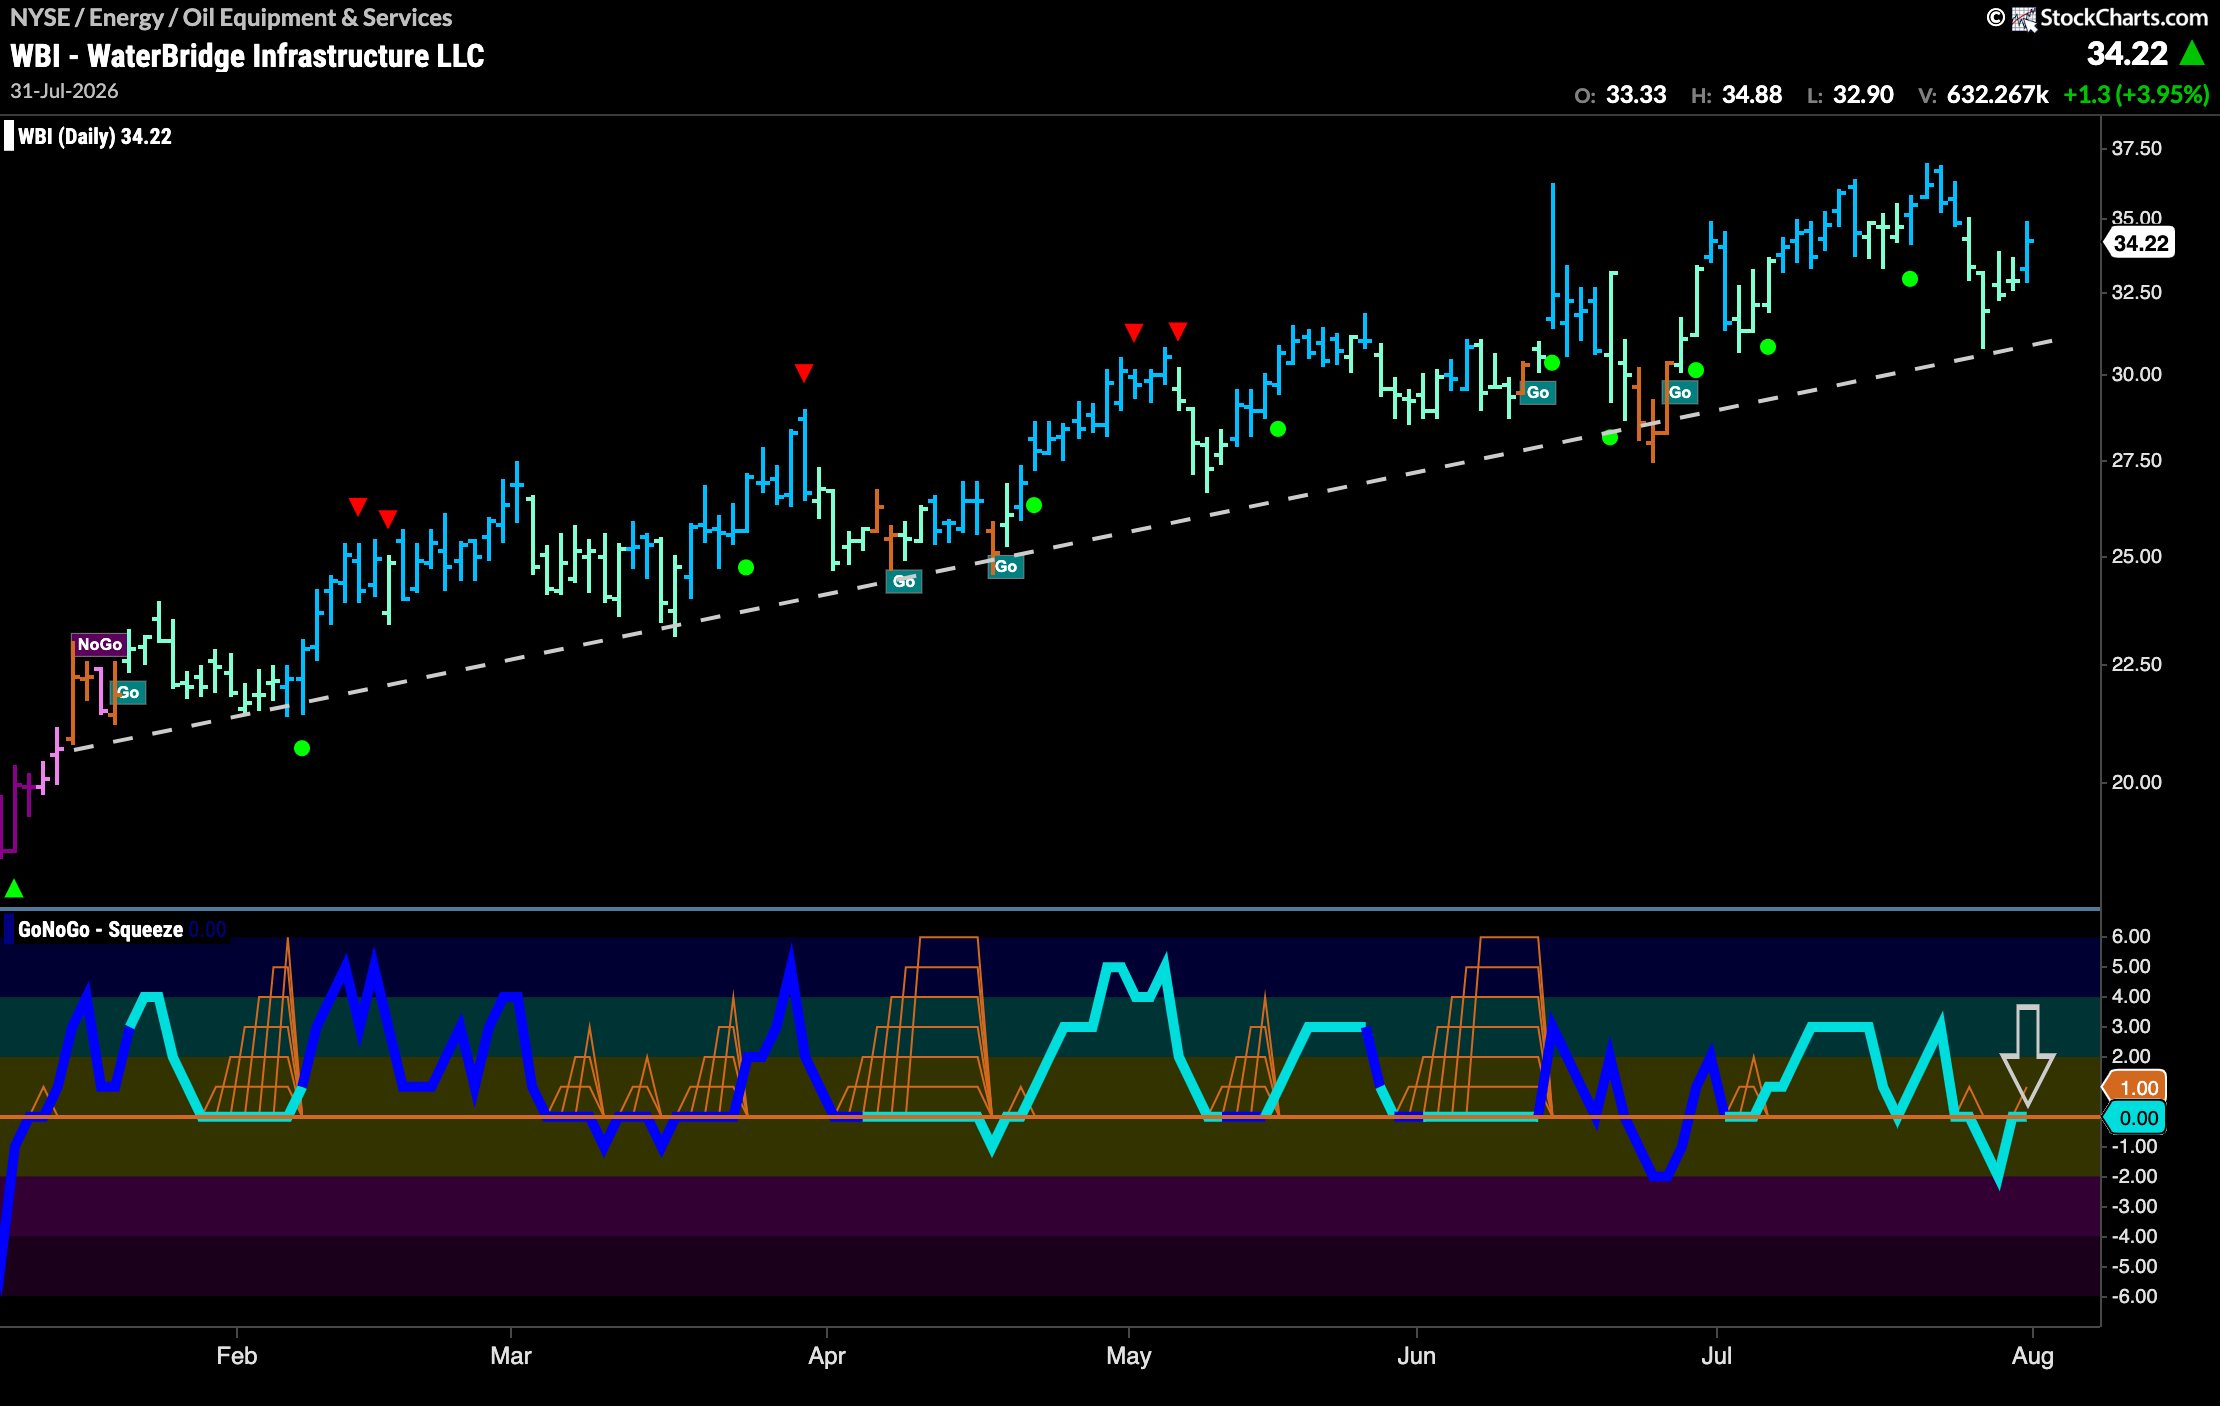
The chart below shows that $WBI has been in a “Go” Trend and we have seen a series of higher highs and higher lows over the past several months. There has been consistent support coming in the form of the rising trend line and recently we saw price bounce off that level again. GoNoGo Oscillator is testing the zero line from below and we will watch to see if it can regain positive territory. If it does, look for price to make an attempt at a new higher high.