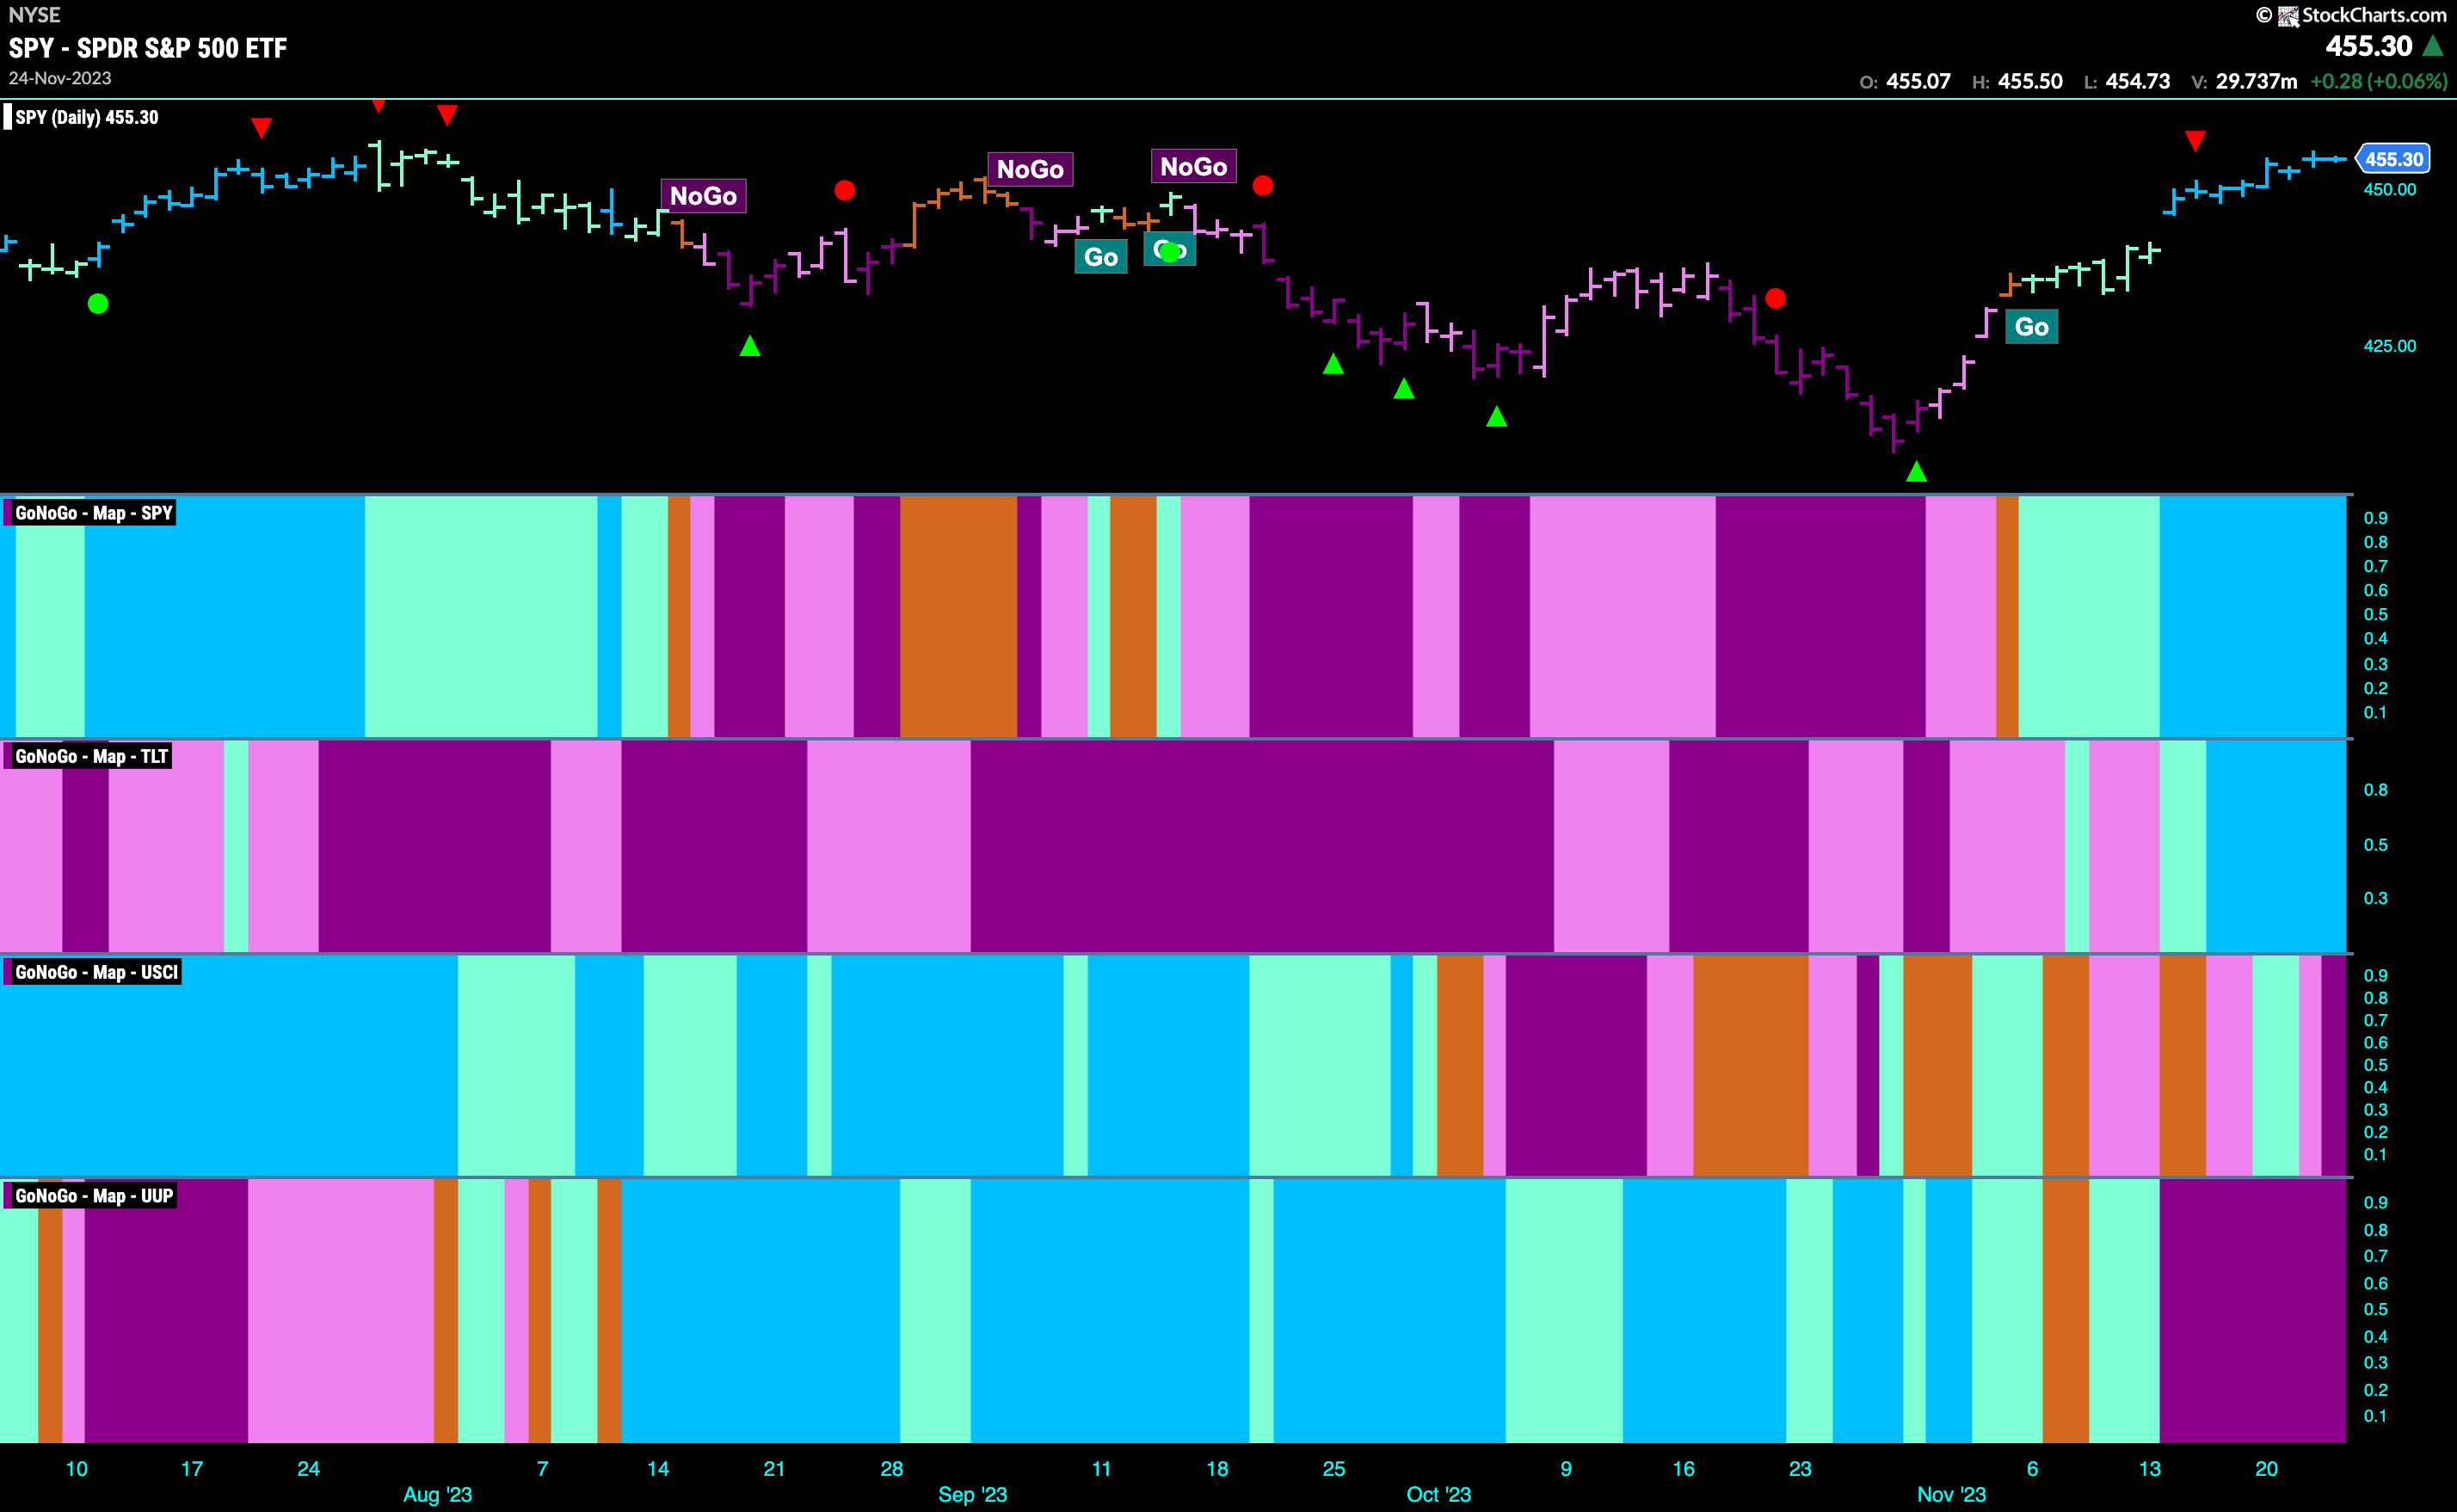
Good morning and welcome to this week’s Flight Path. Equity prices are really making a strong effort to break higher. A week of uninterrupted bright blue “Go” bars this week as price continued to climb. Treasury bond prices saw the return to “Go” bars hold as well as GoNoGo Trend painted strong blue “Go” bars. Commodities struggled again this week as GoNoGo Trend spotted a return to “NoGo” bars as the week came to a close. The Dollar, now seems firmly entrenched in a “NoGo” as GoNoGo Trend paints purple bars.
Equity Prices Set to Challenge August Highs
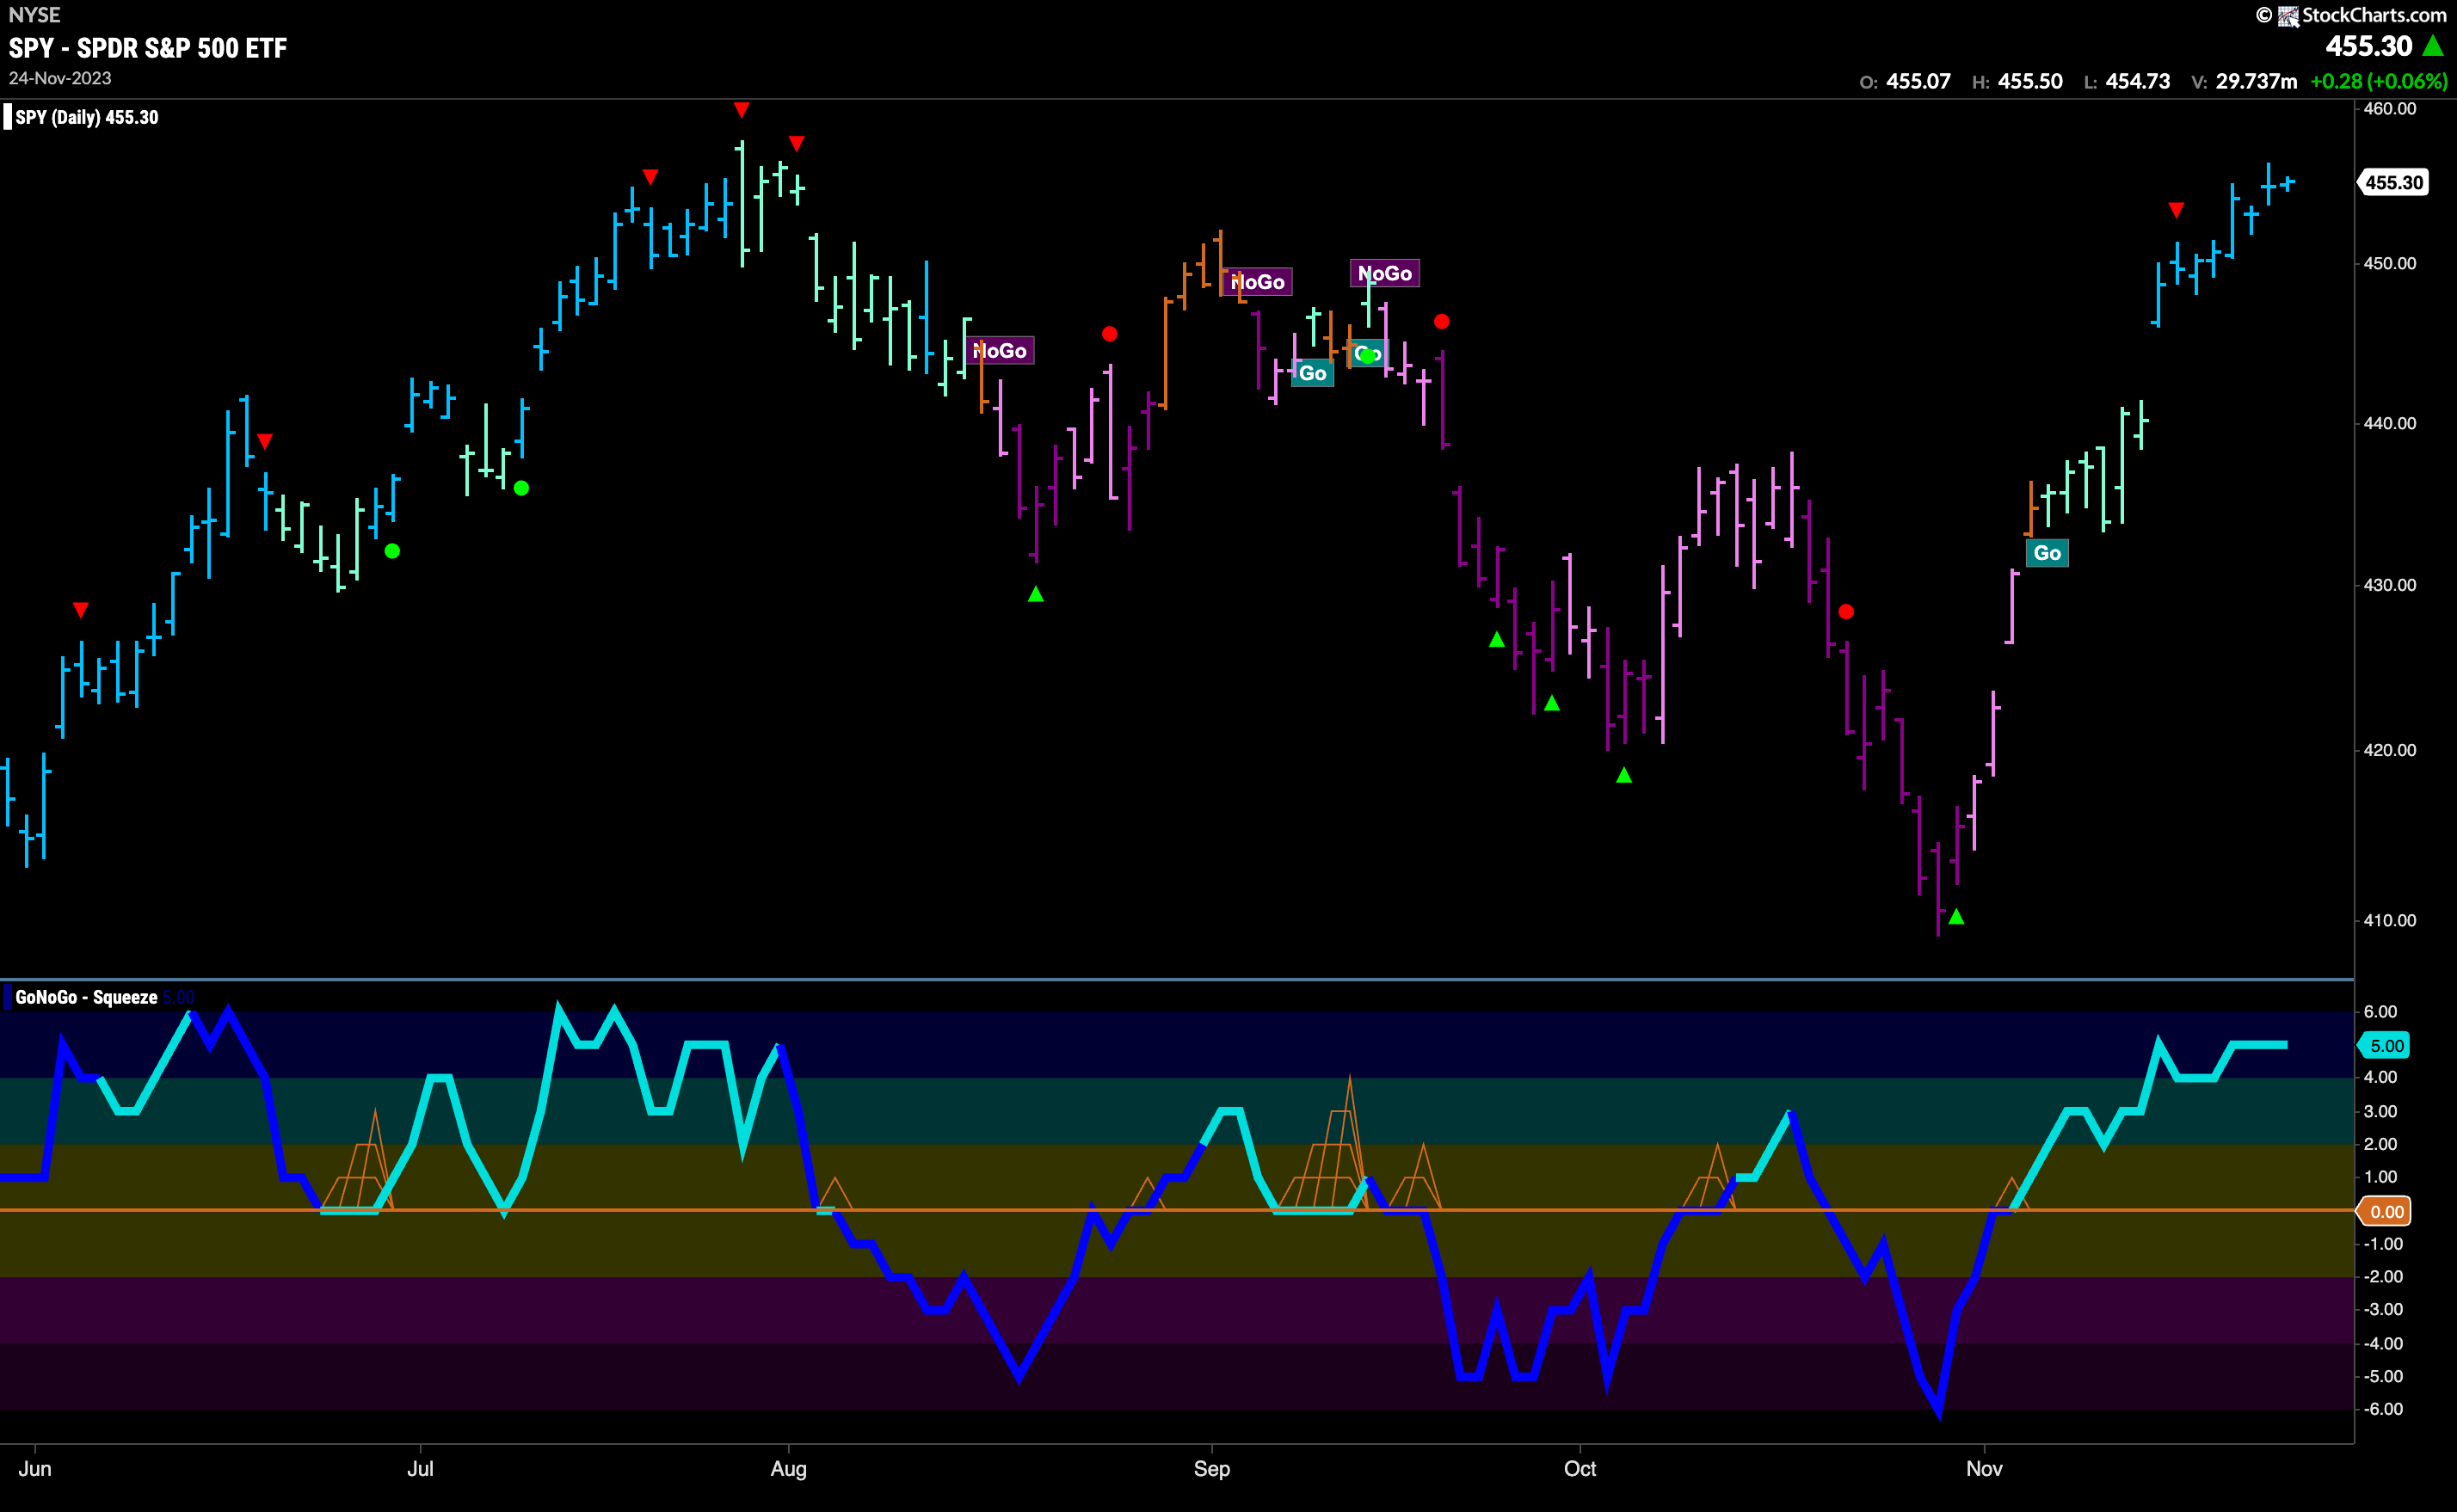
A strong week for U.S. equities saw prices climb as GoNoGo Trend painted a string of strong blue “Go” bars. There was no slowdown after price gapped higher over a week ago and we can see that price did not stall for long after the Go Countertrend Correction Icon (red arrow). GoNoGo Oscillator has been in and out of overbought territory for about a week and that shows the strength of the current move in price. We will watch to see if momentum cools which could cause price to slow down here as it approaches resistance from the prior high in August.
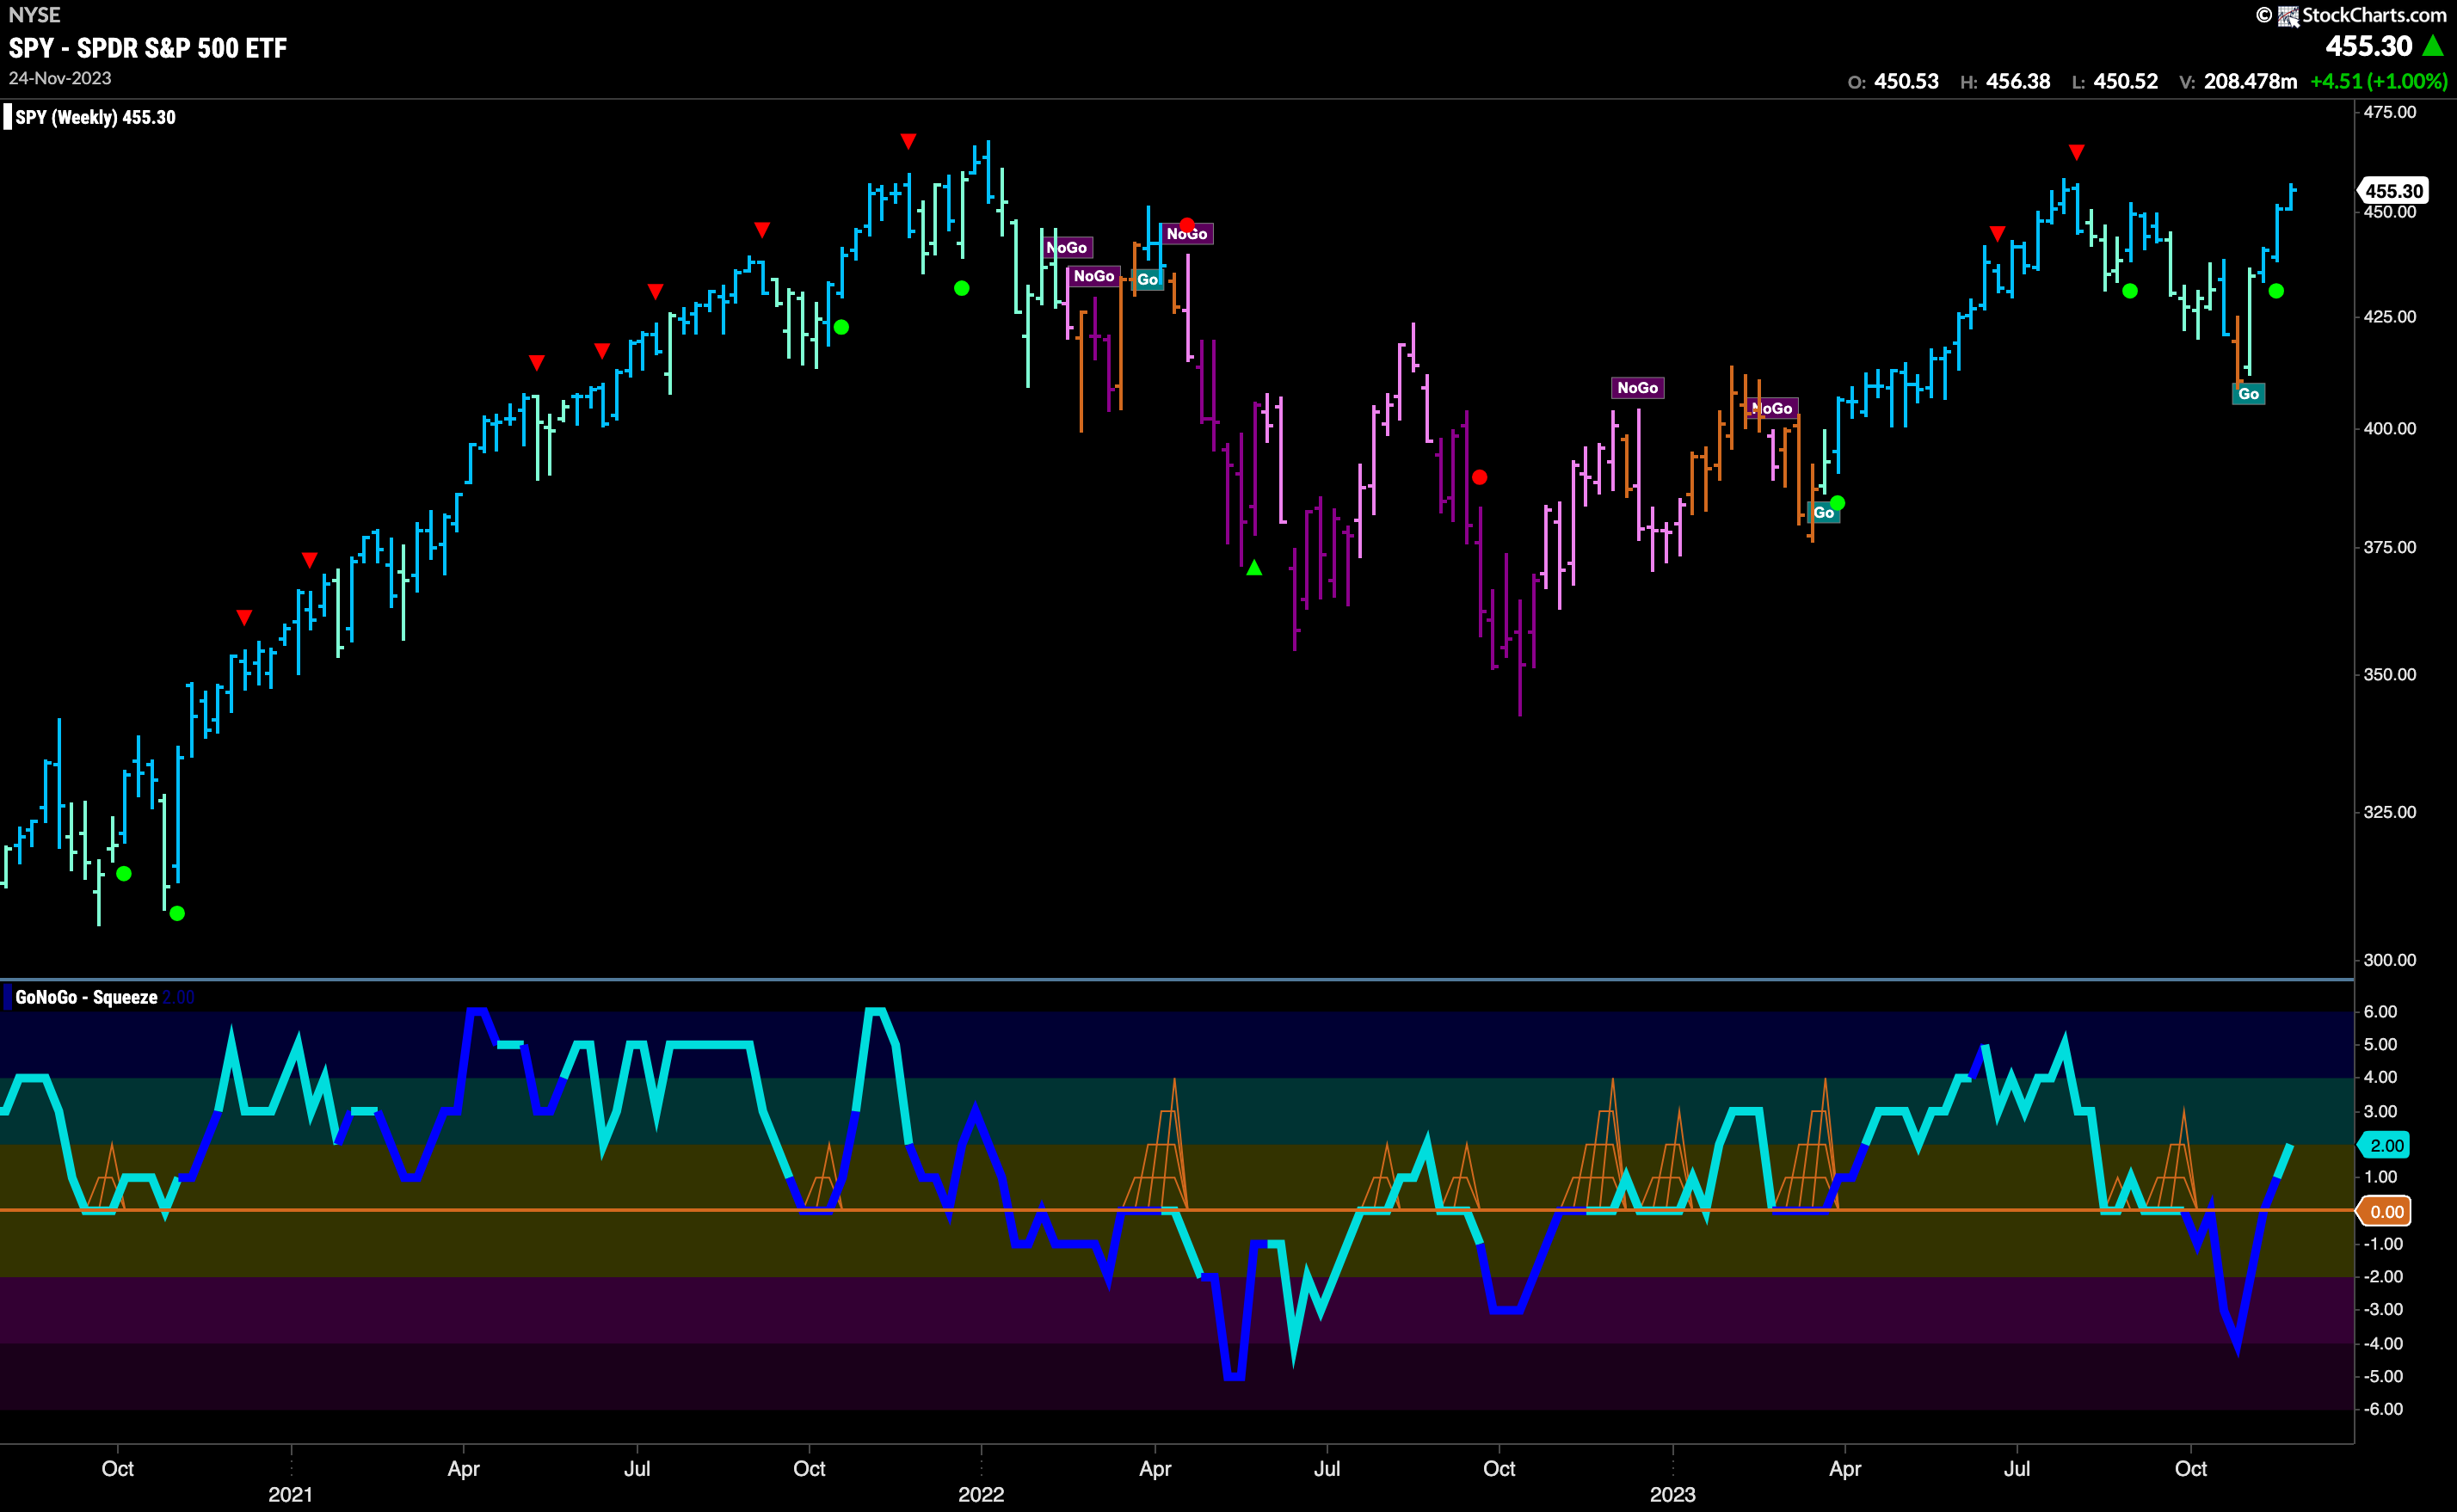
We saw another higher weekly close this past week as price has raced higher from the amber bar that GoNoGo Trend painted a month ago. The market certainly made up its mind after that week of uncertainty. That also came in the form of a higher low since the lows from a year ago. Now, as we approach resistance from the August high we look to the oscillator panel and see that momentum has broken back into positive territory and so that has triggered a Go Trend Continuation Icon (green circle) under the prior week’s bar. A new higher high would extend the bullish thesis.
Treasury Rates Find Horizontal Support
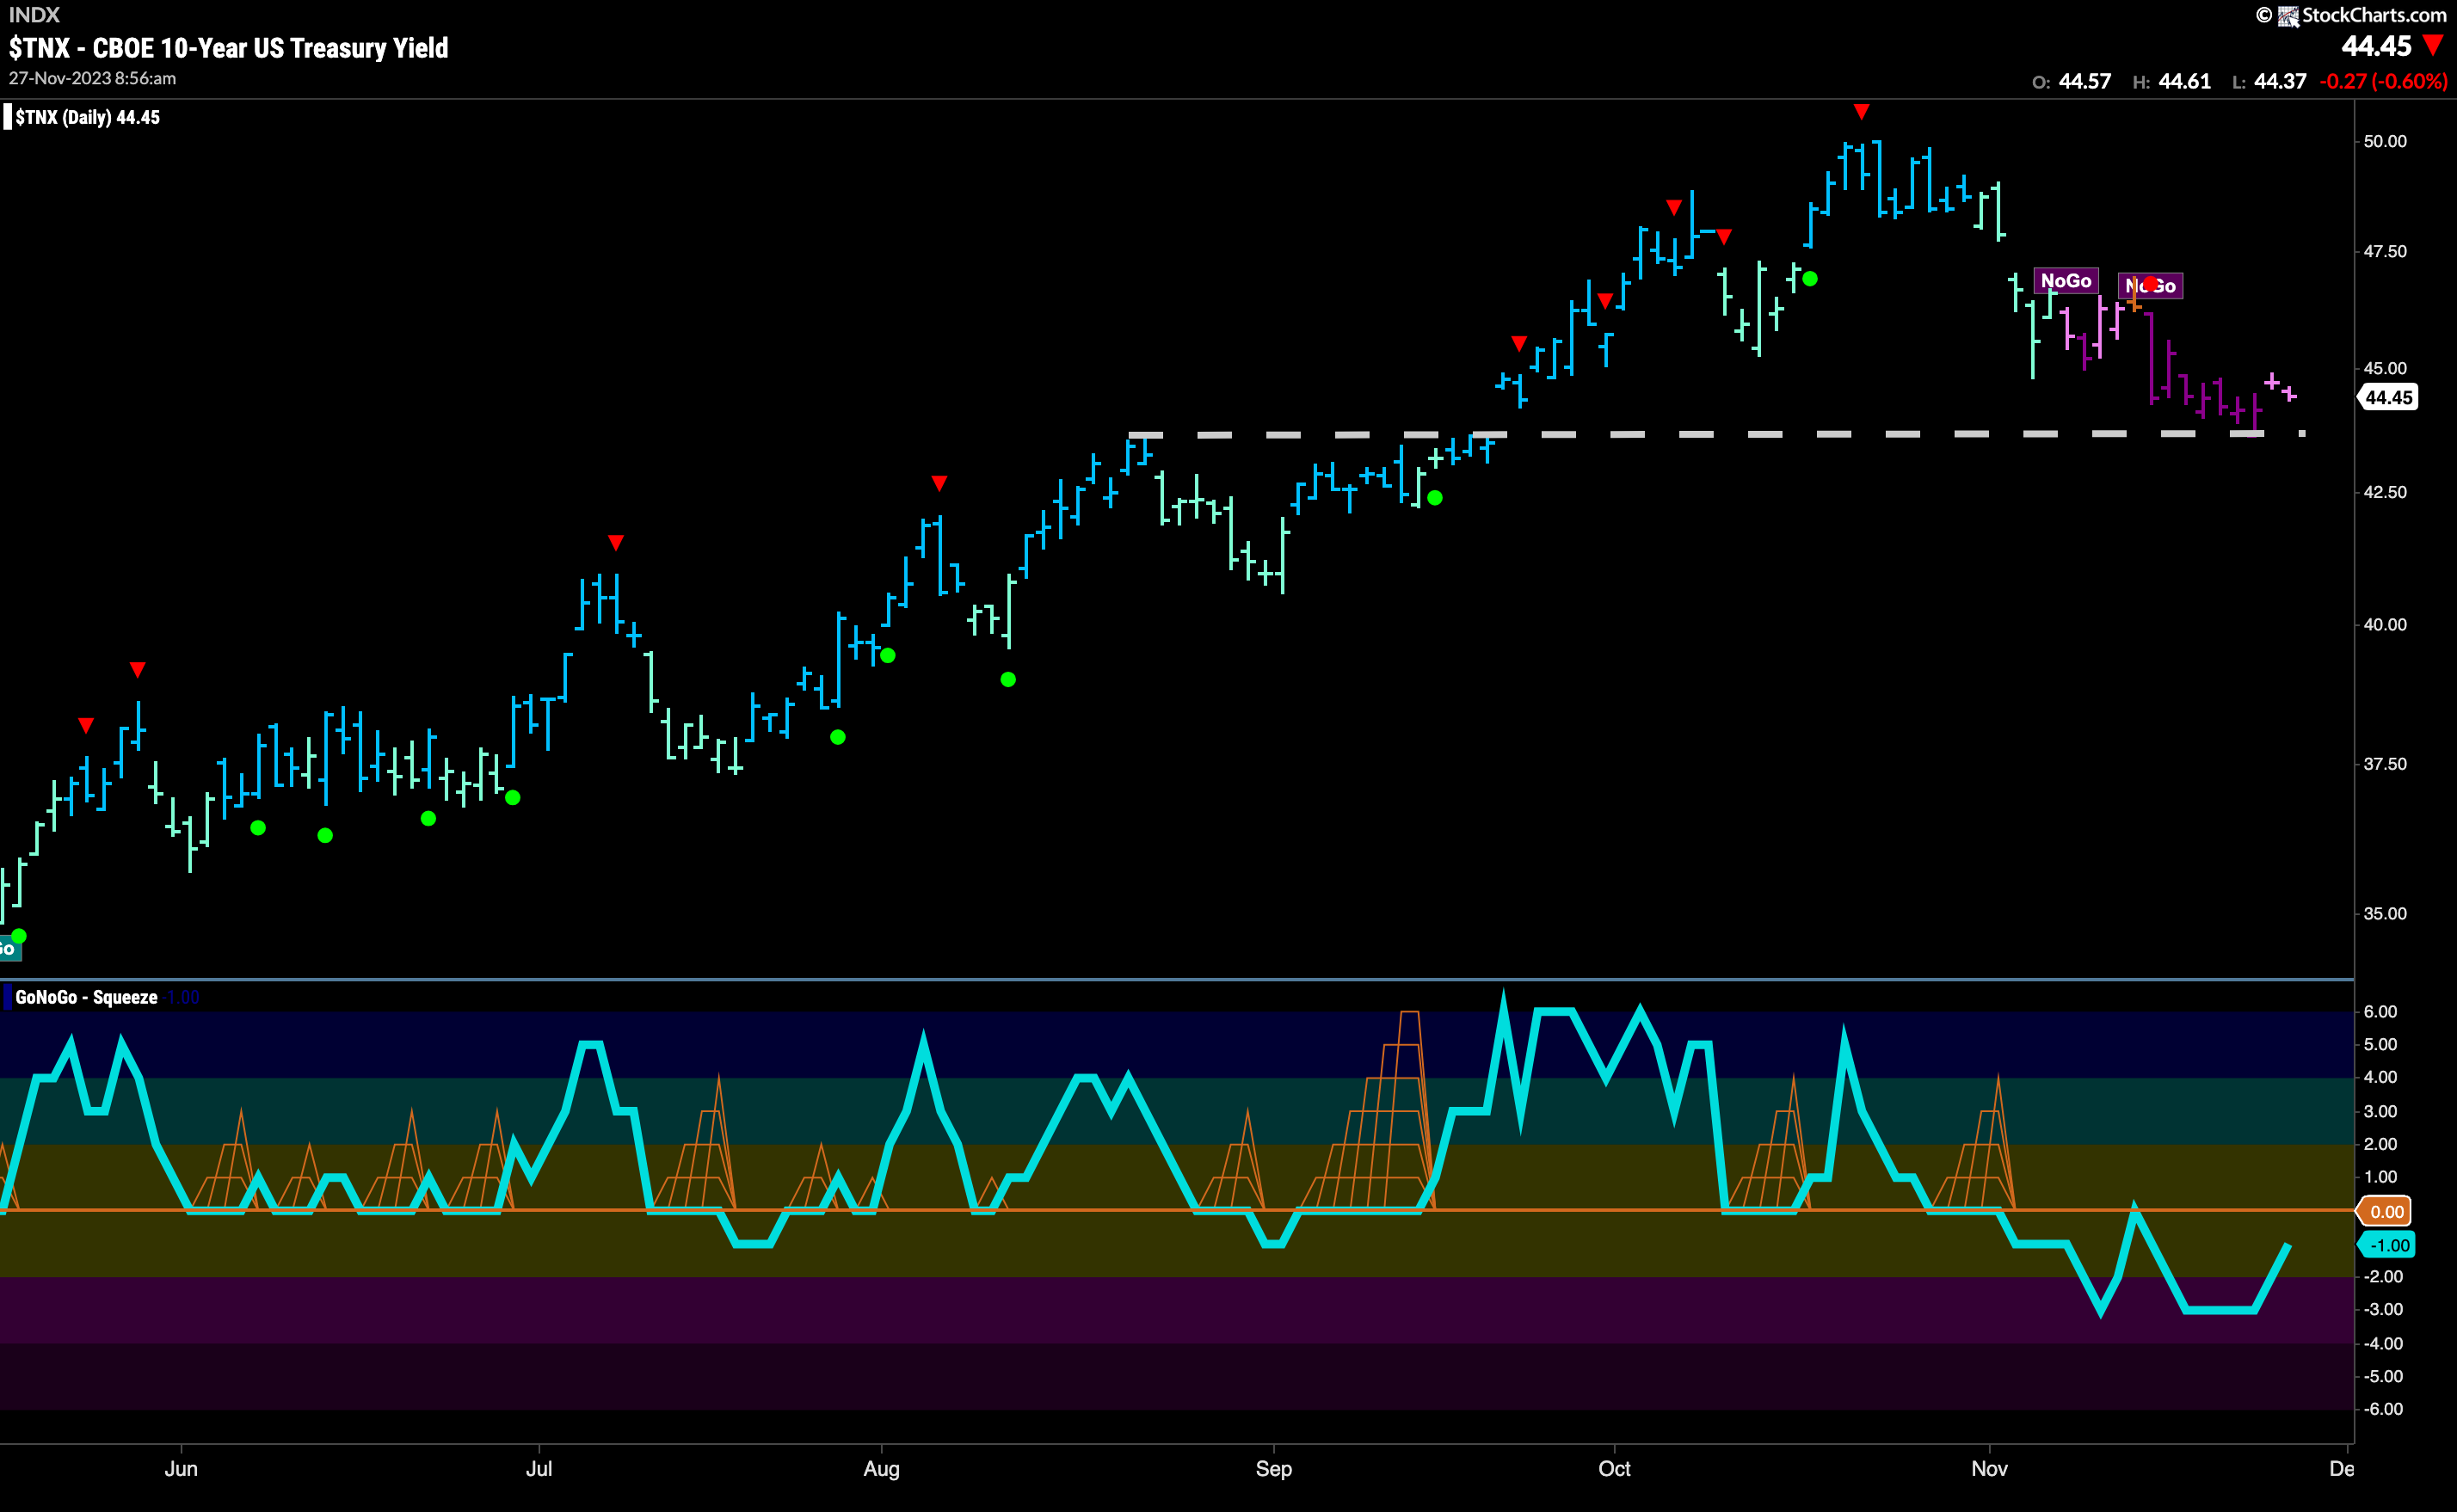
The “NoGo” trend continues in rates this week but it does look like price found support and we see that as price stabilizes GoNoGo Trend painted a couple of weaker pink “NoGo” bars. We will watch as the GoNoGo Oscillator moves toward the zero line. If it is rejected at this level then we will expect price to make another attempt to move lower. That would tell us that momentum remains in the direction of the “NoGo” trend.
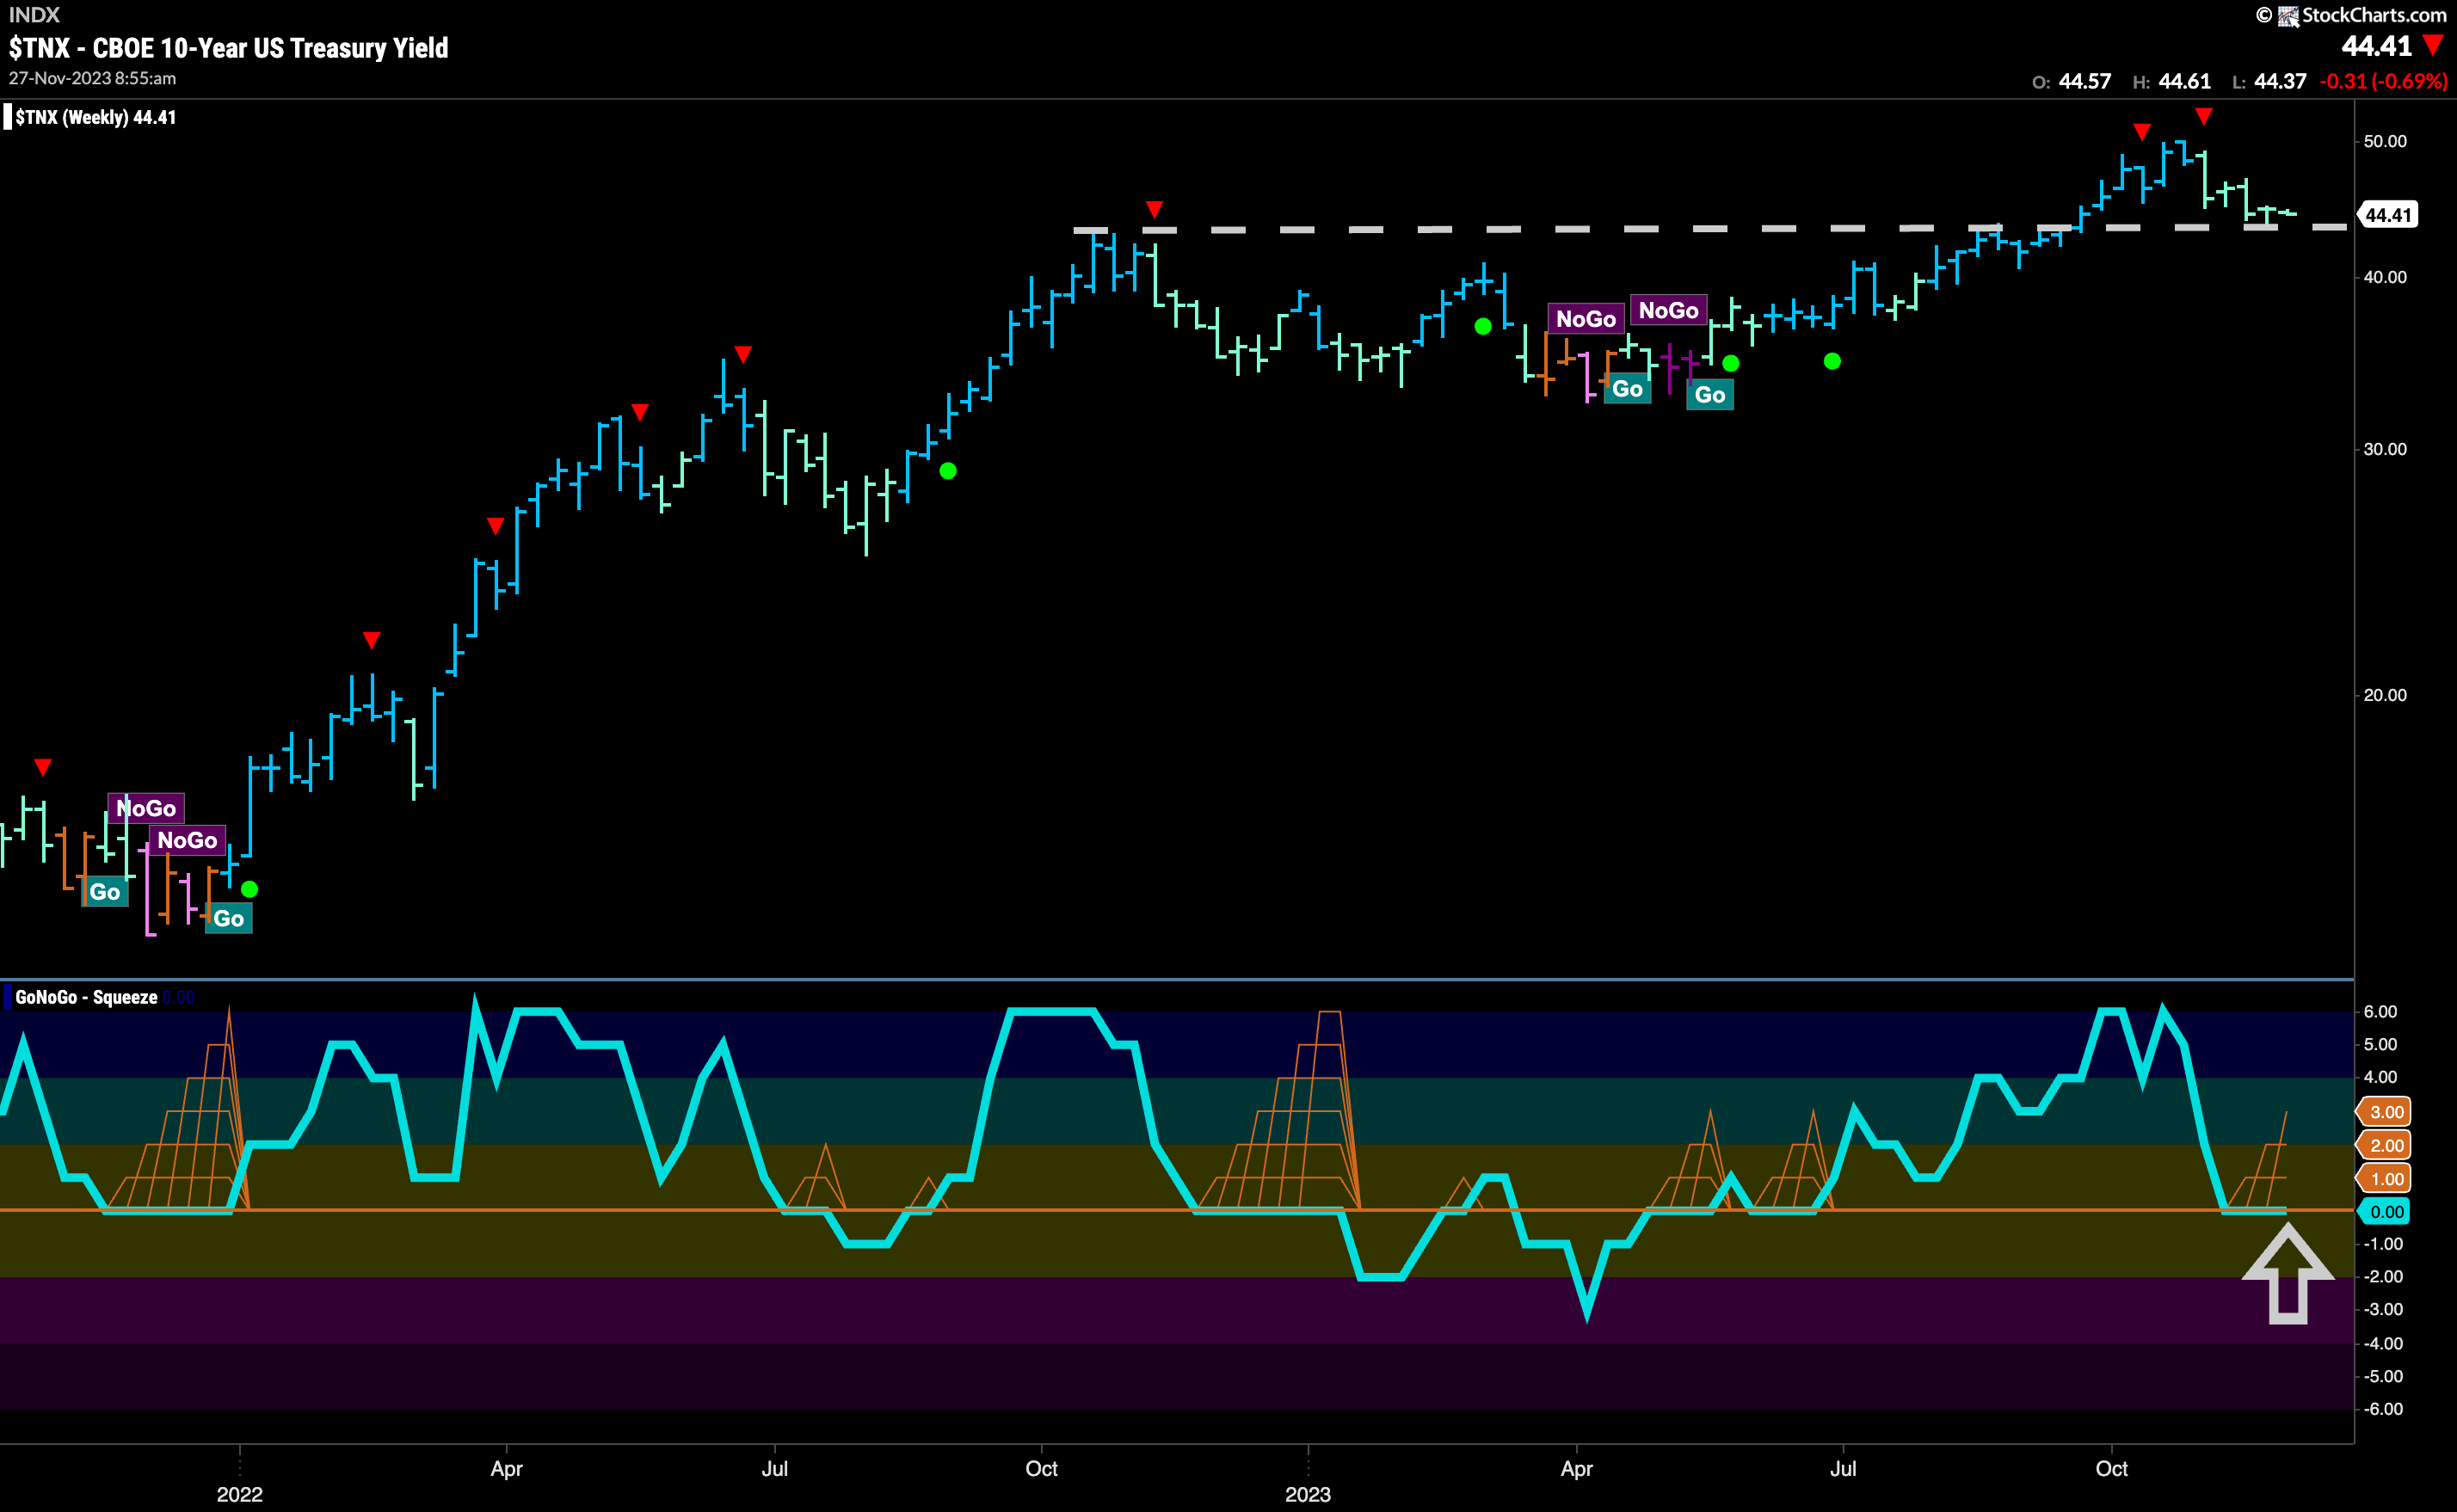
The larger timeframe chart shows us that the support is being found from a prior high a year ago. This is therefore significant support and price so far is respecting that level. We will watch over the next few weeks as the “NoGo” on the daily timeframe puts pressure on this level to see if it is enough to overwhelm this weekly support. GoNoGo Oscillator continues to ride the zero line which is causing the climbing grid of GoNoGo Squeeze to climb reflecting the tug of war between buyers and sellers at this level. The break of this GoNoGo Squeeze will be informative.
Dollar Remains in “NoGo”
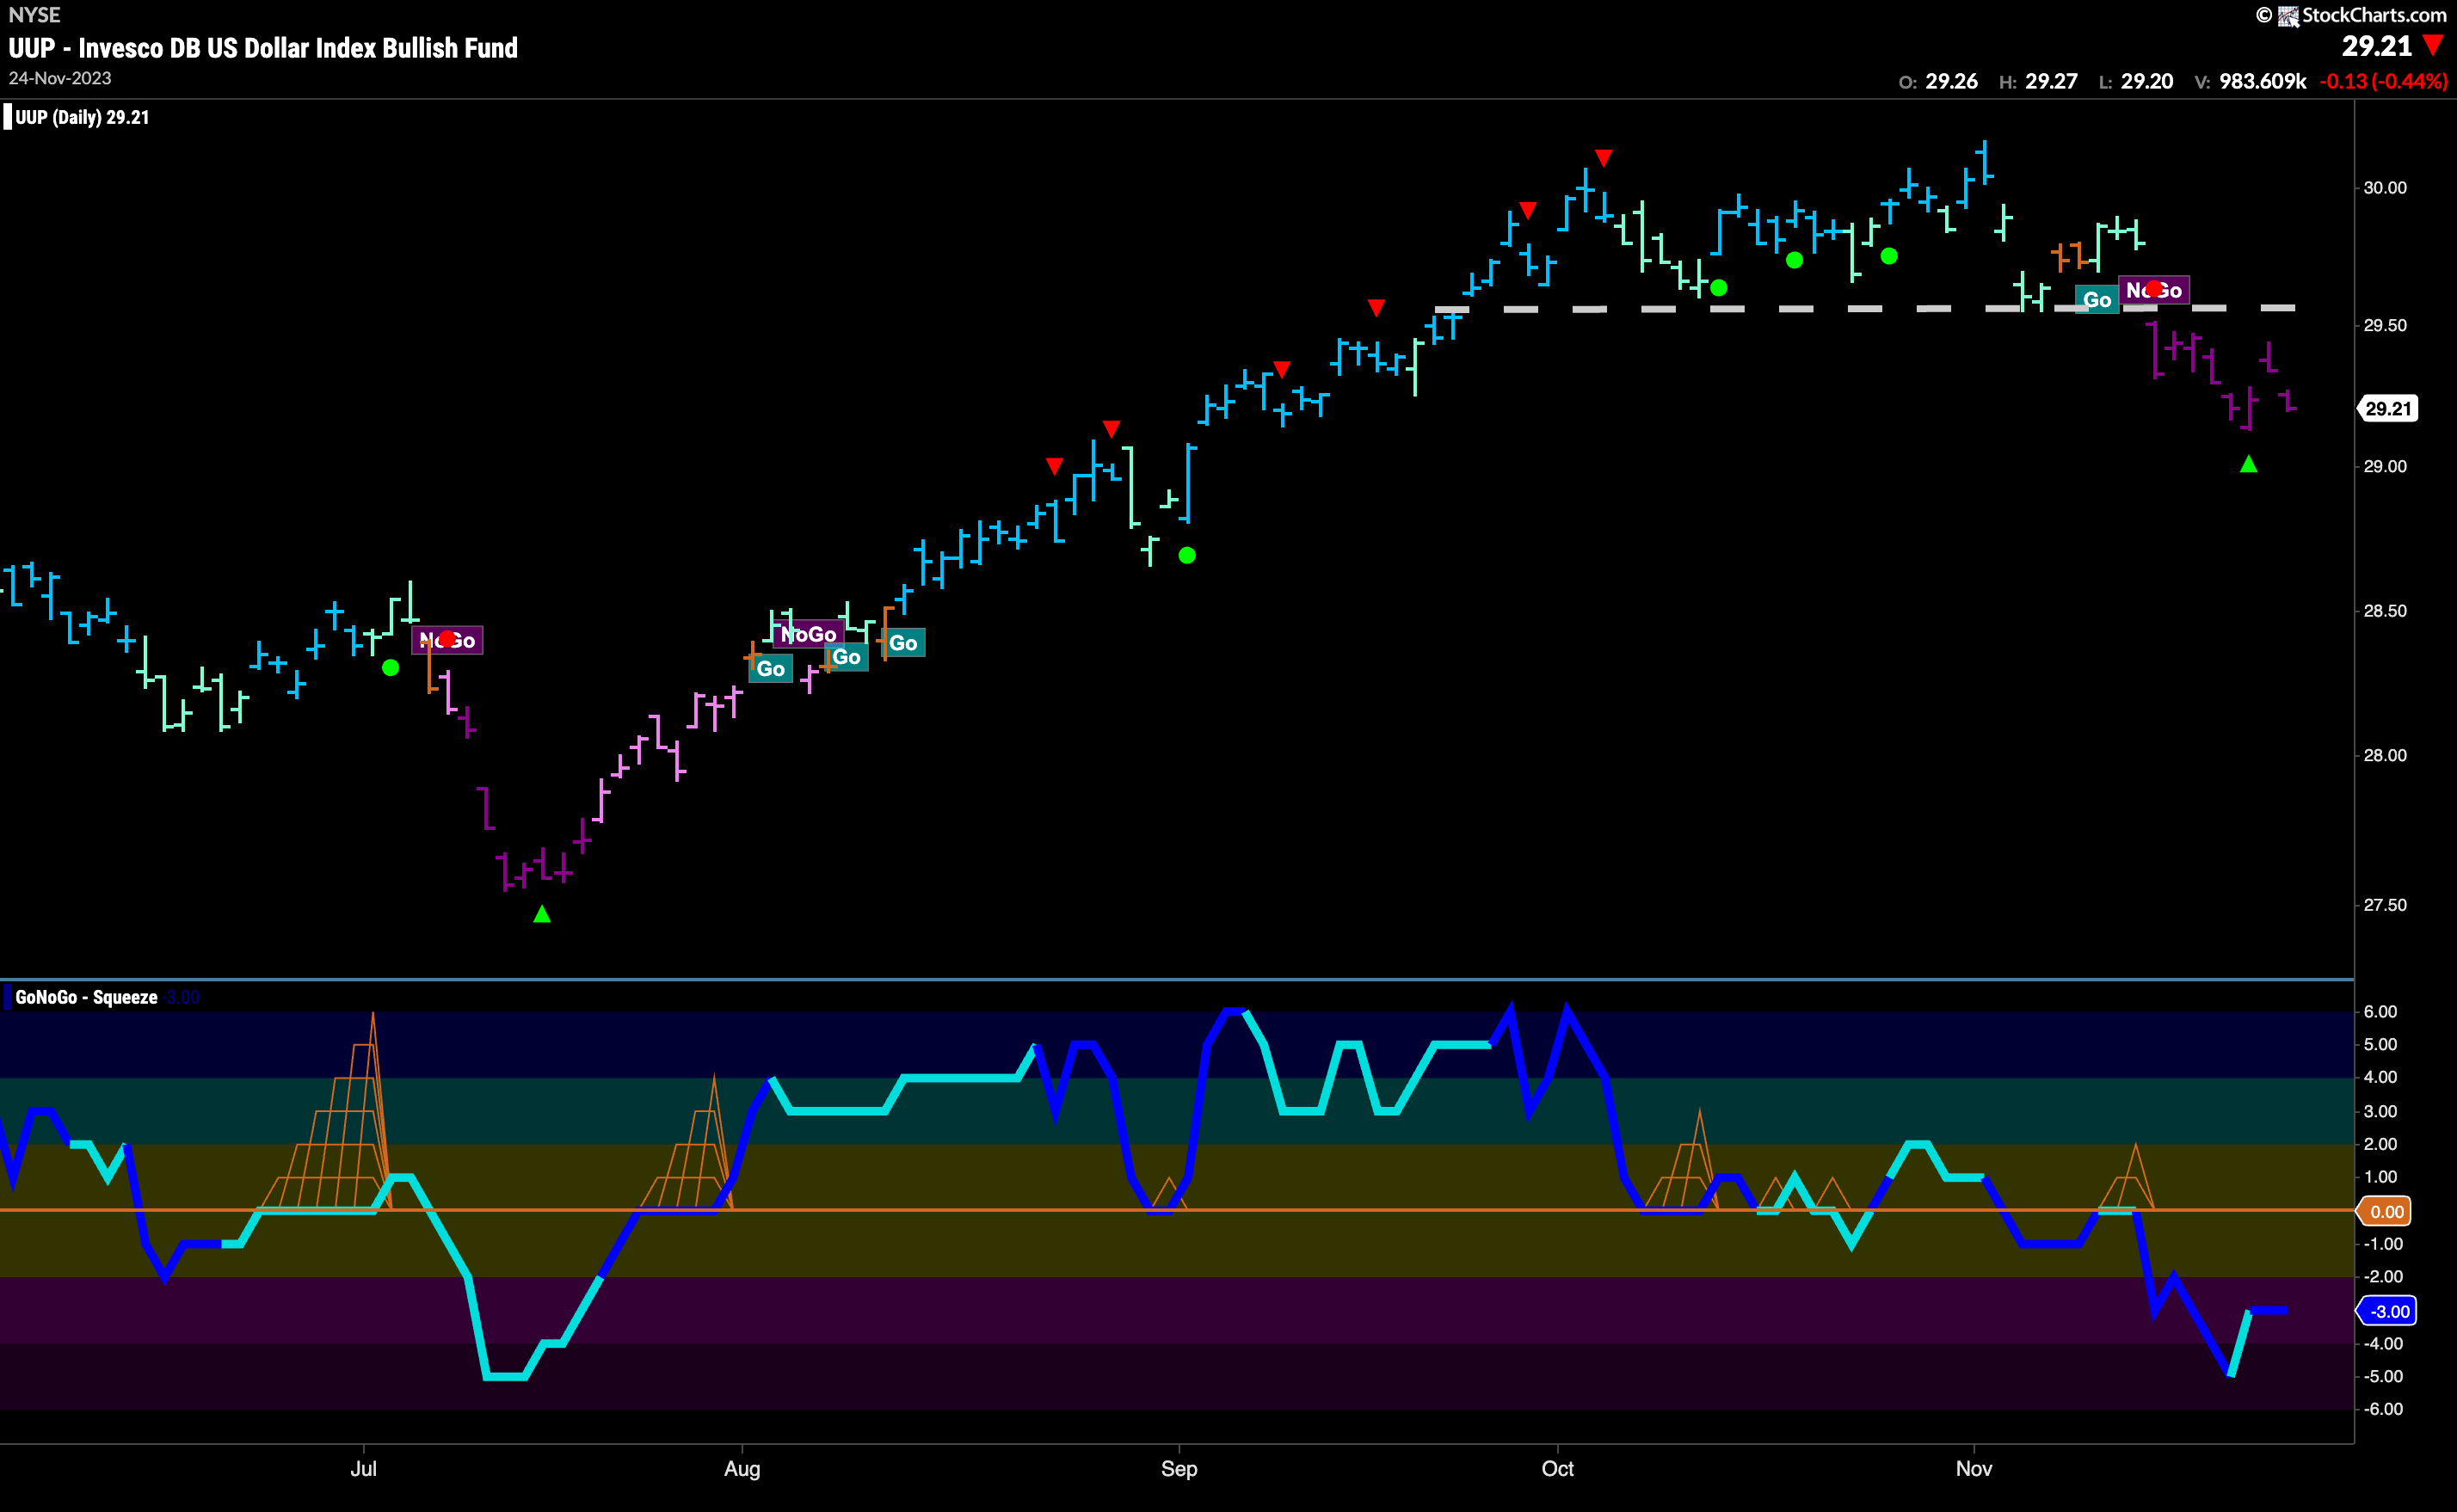
GoNoGo Trend shows nothing but strong purple “NoGo” bars for the U.S. dollar this week. After hitting extreme oversold levels we saw a NoGo Countertrend Correction Icon (green arrow) which told us that price may struggle to go lower in the short term. Indeed, price jumped following that, but quickly reversed and GoNoGo Oscillator is now in negative territory but no longer oversold. We will watch to see if price can make a new lower low this week.
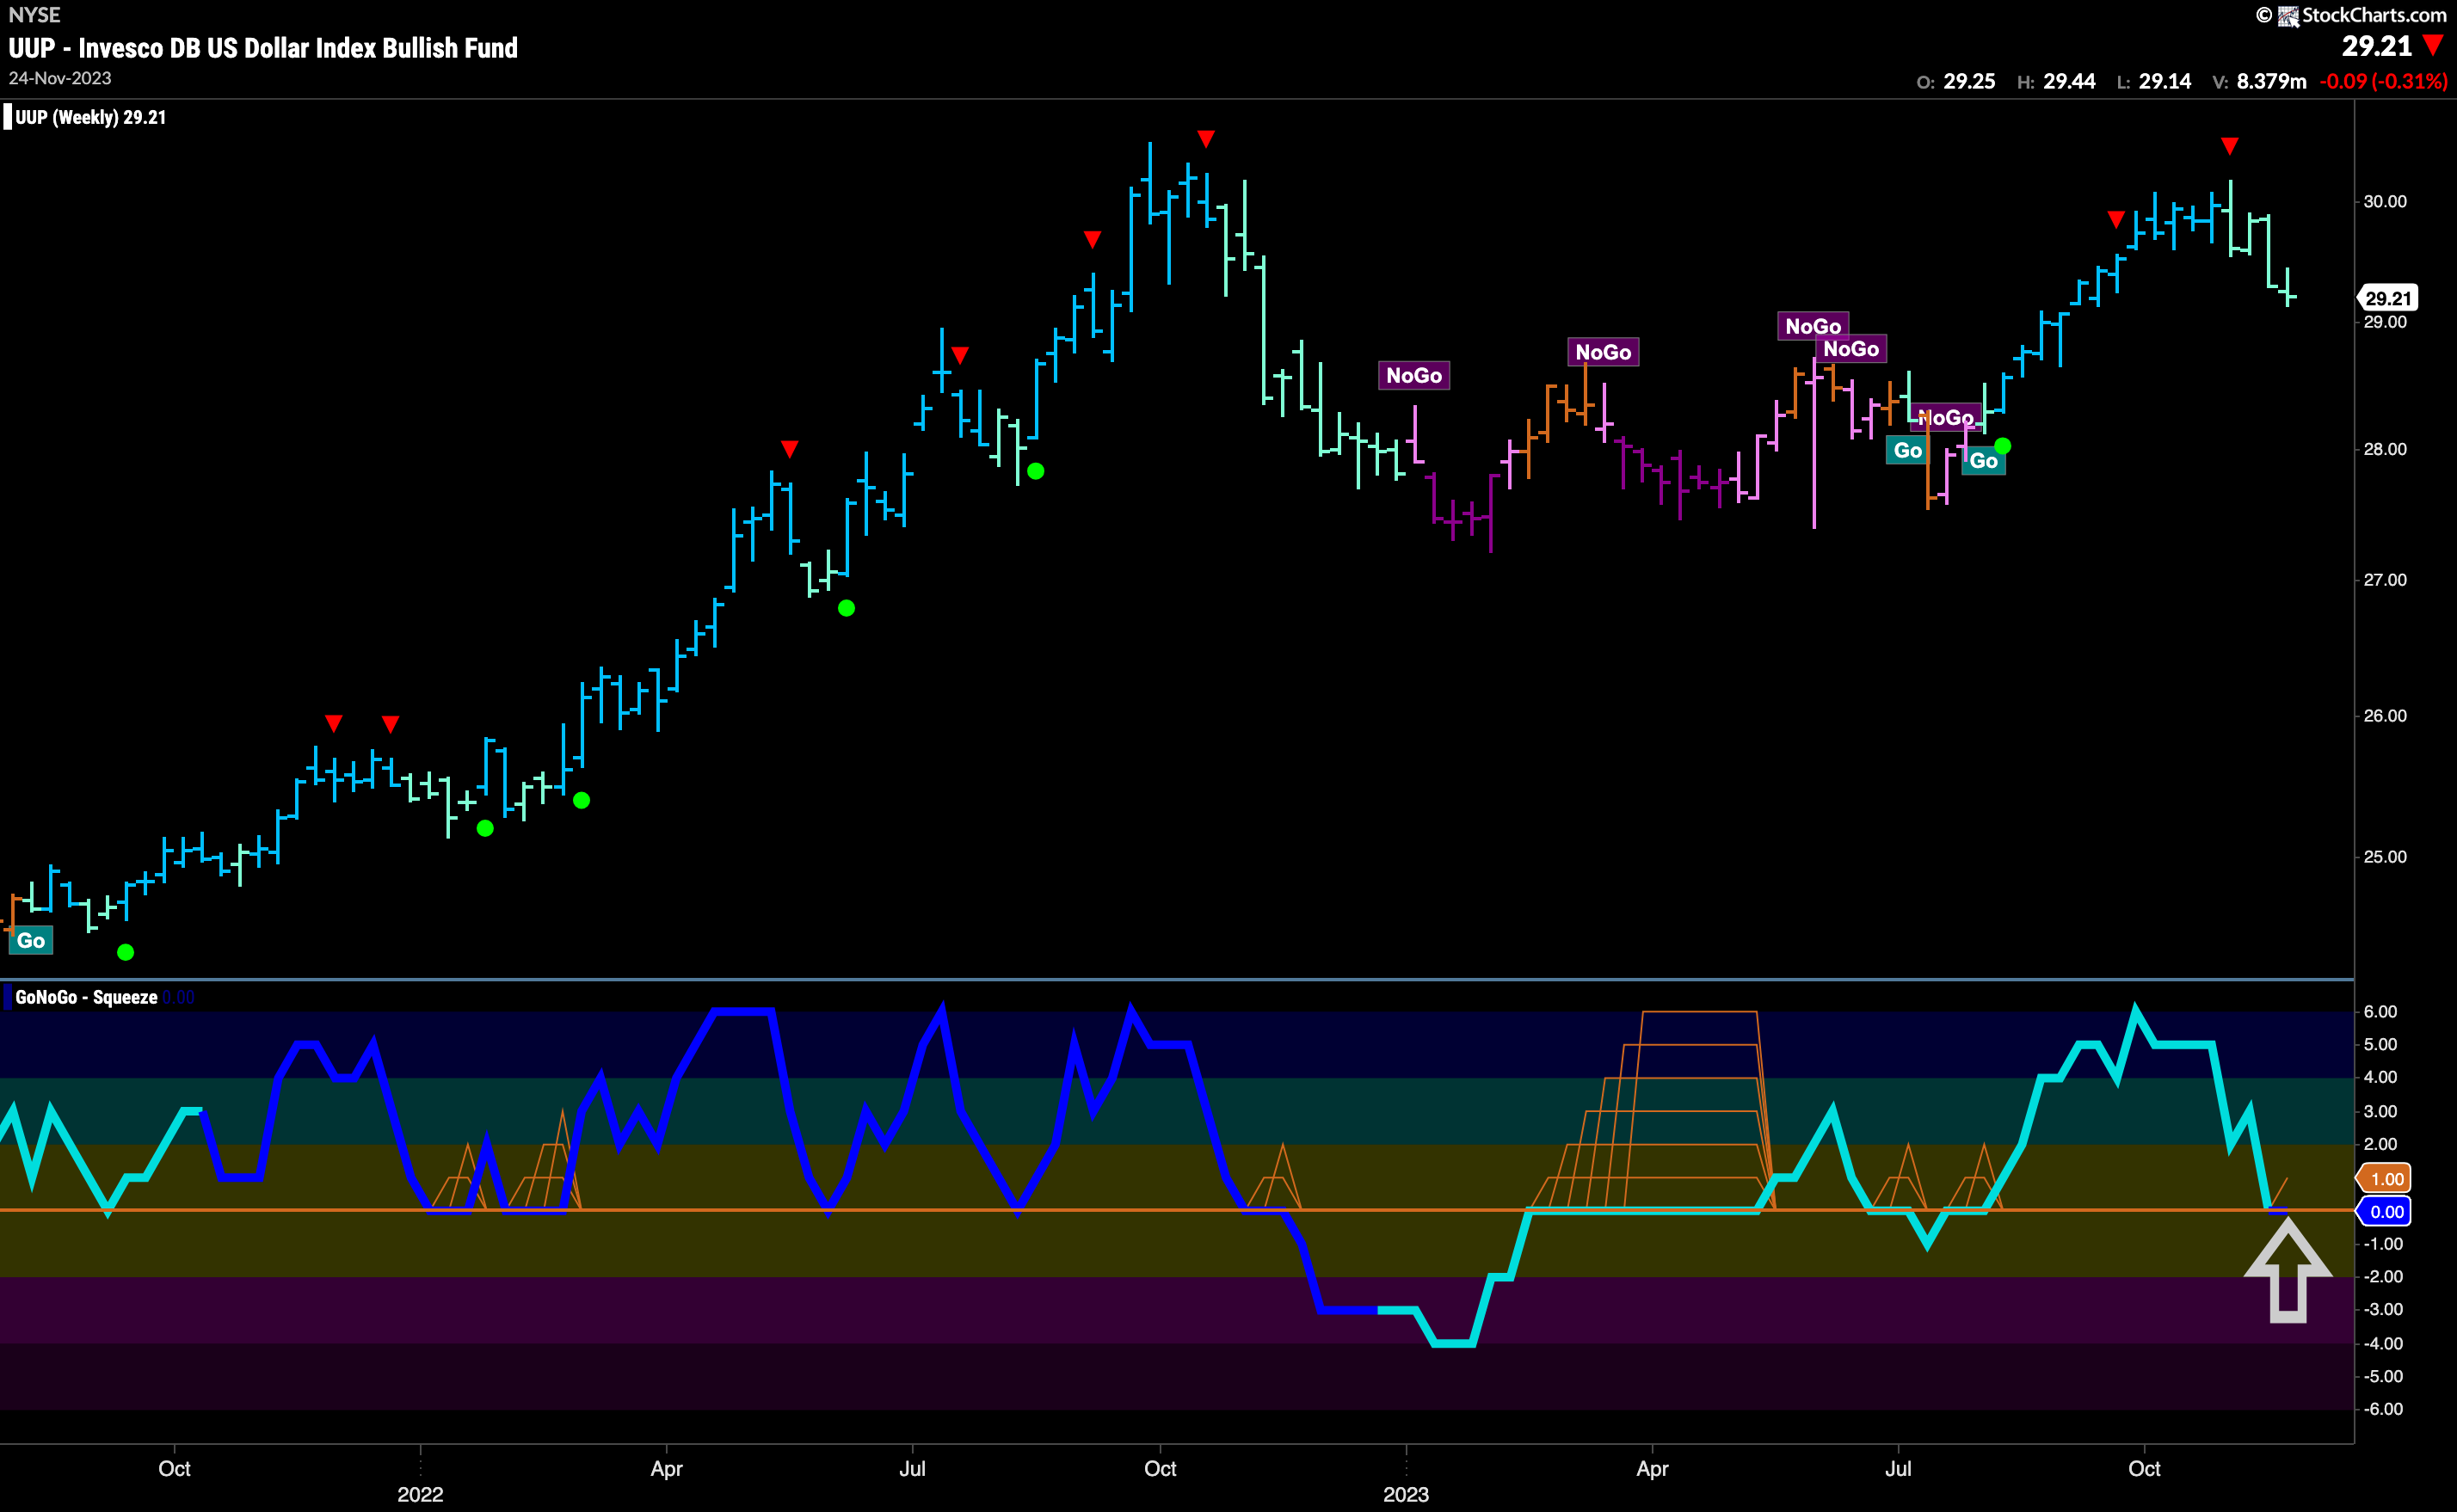
The weekly chart shows that the “Go” trend that has been in place since the summer is being tested as GoNoGo Trend paints another weak aqua bar and GoNoGo Oscillator rests at the zero line. We will watch to see if the oscillator remains at this level. If it does, we will see a GoNoGo Squeeze grid climb reflecting a tug of war between buyers and sellers at these levels. If the oscillator finds support and rallies back into positive territory then this weekly “Go” trend will likely remain in place for now.
Oil Remains in “NoGo” Trend
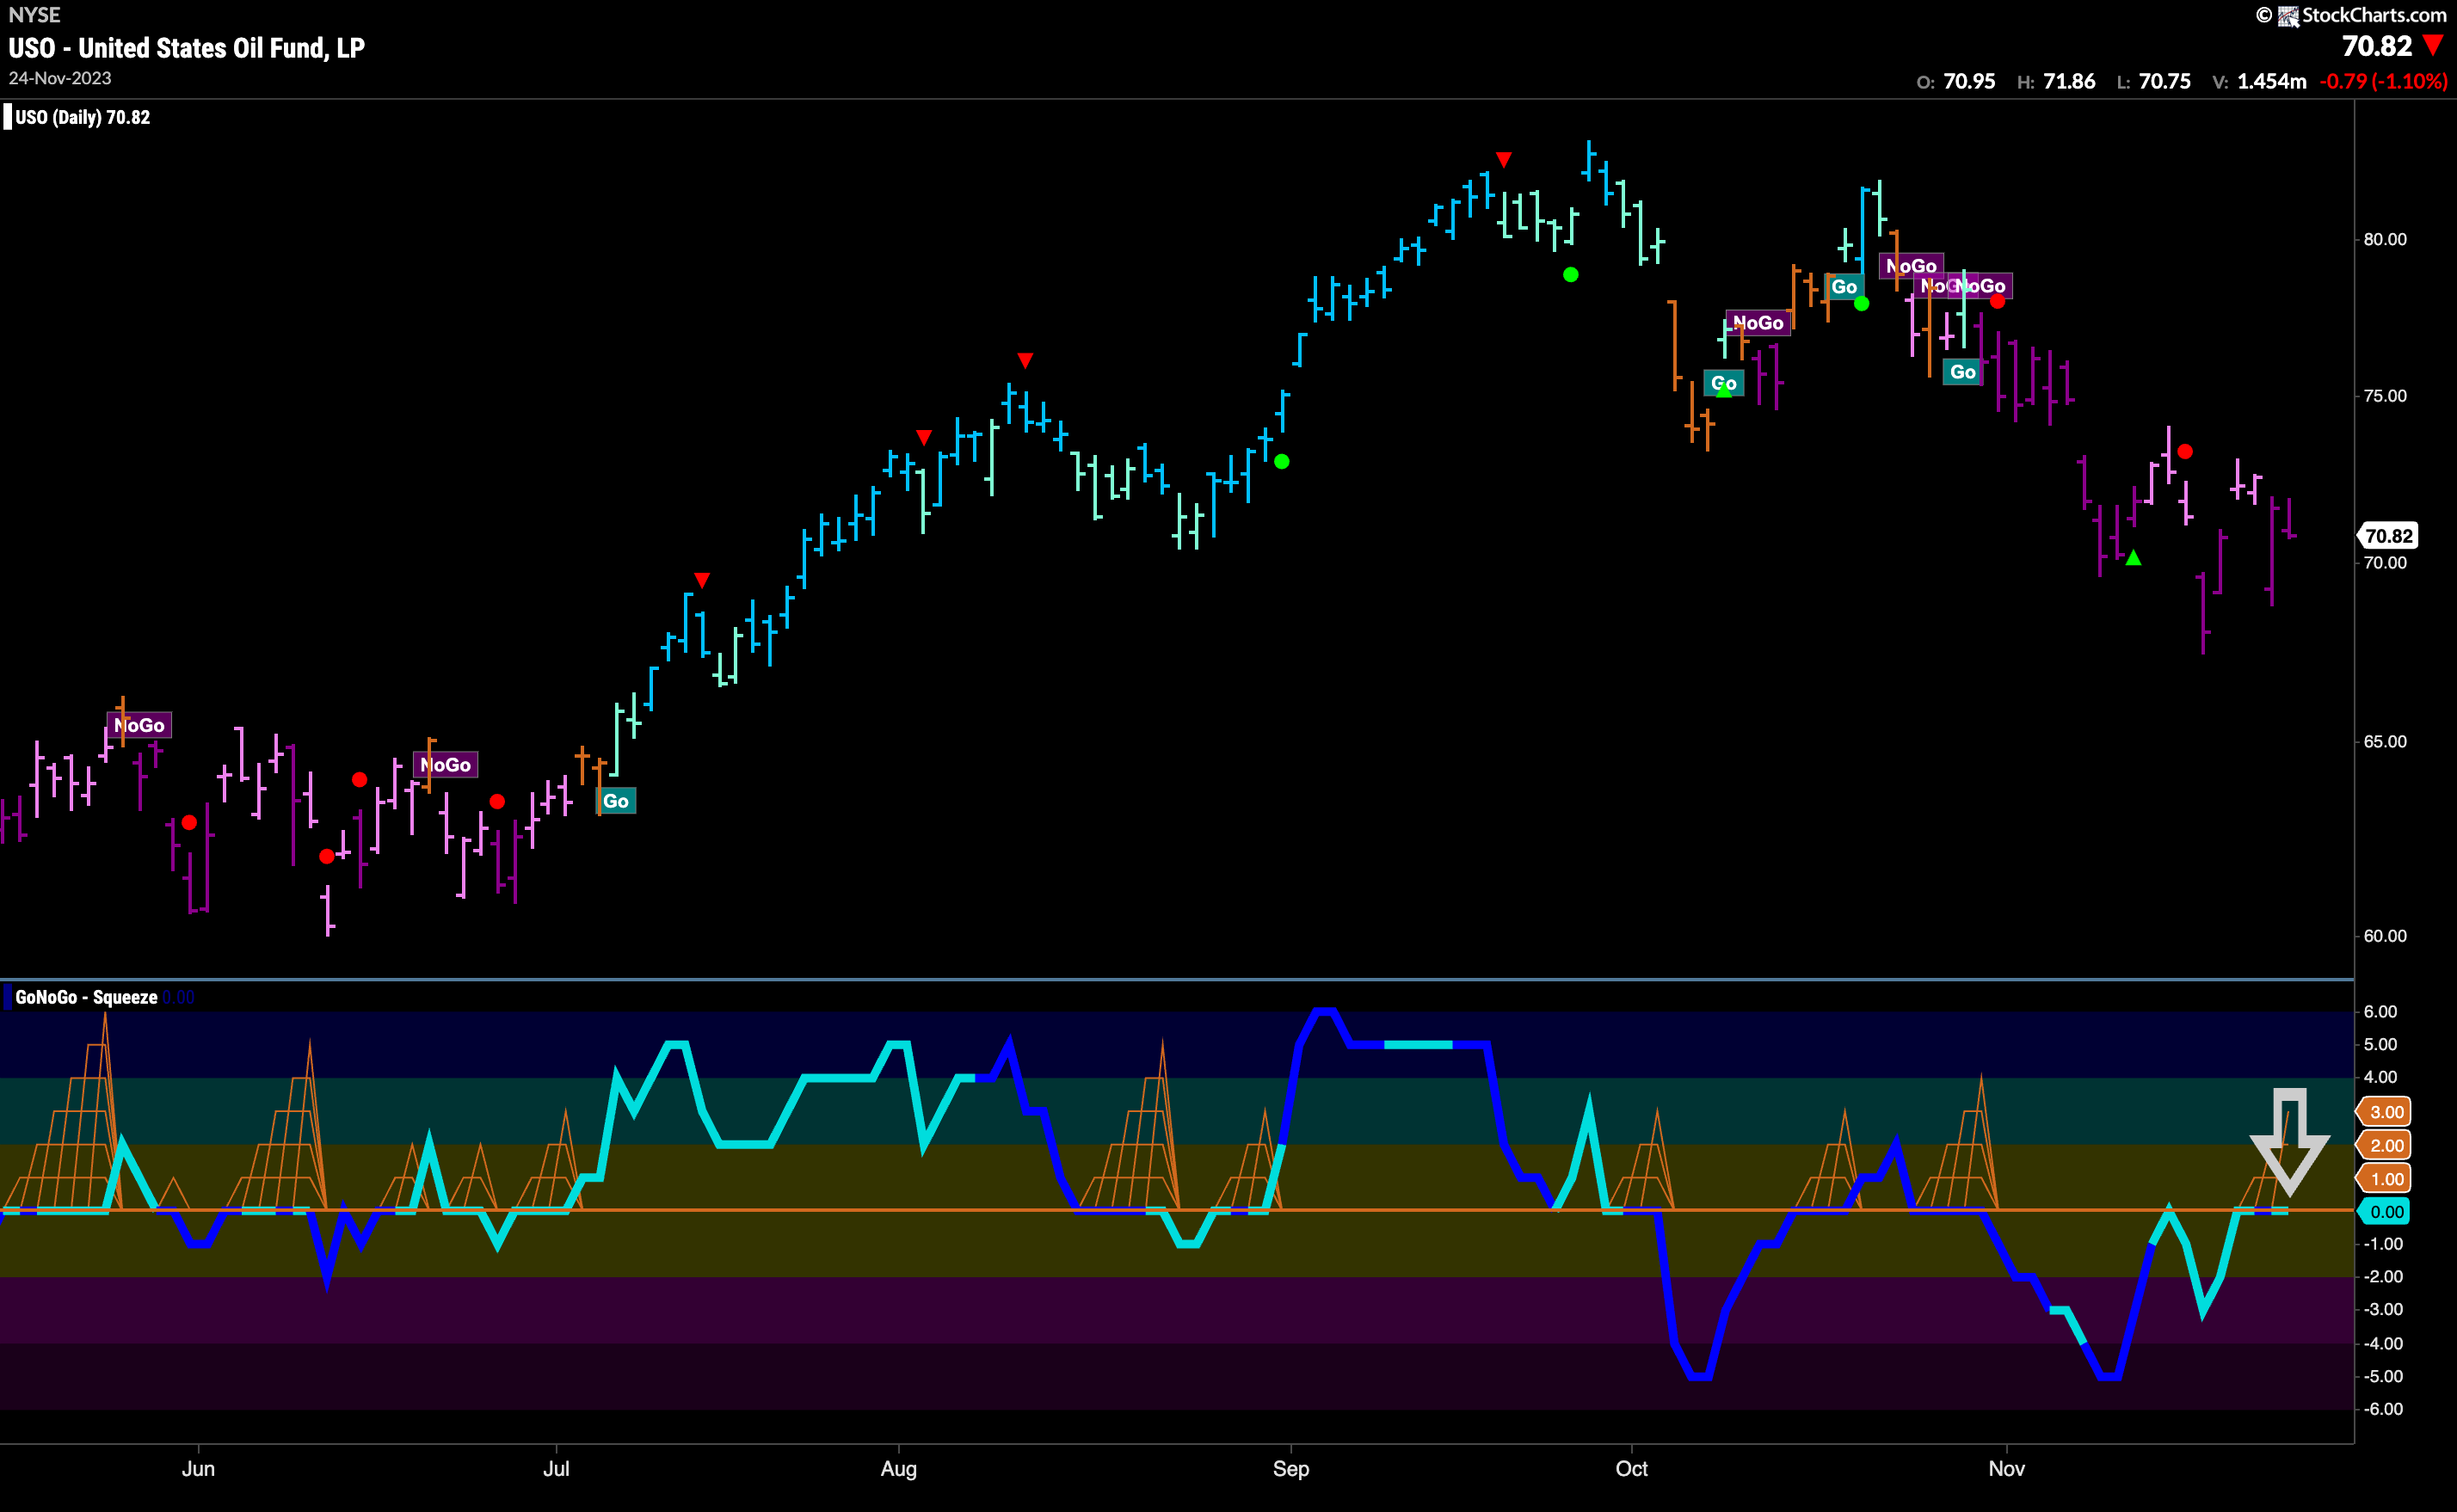
GoNoGo Trend bounced off the low at the beginning of last week but after two days of pink bars returned lower and painted strong purple bars. Although the “NoGo” trend is firmly in place, we see momentum waning in the lower panel. GoNoGo Oscillator has rallied to test the zero line from below and now it has remained at that level for a few bars. This is causing the grid of GoNoGo Squeeze to climb. We will watch to see if the zero line continues to act as resistance. If the oscillator is rejected by this level, we’ll look for price to move lower.
Gold Finds Support in “Go” trend
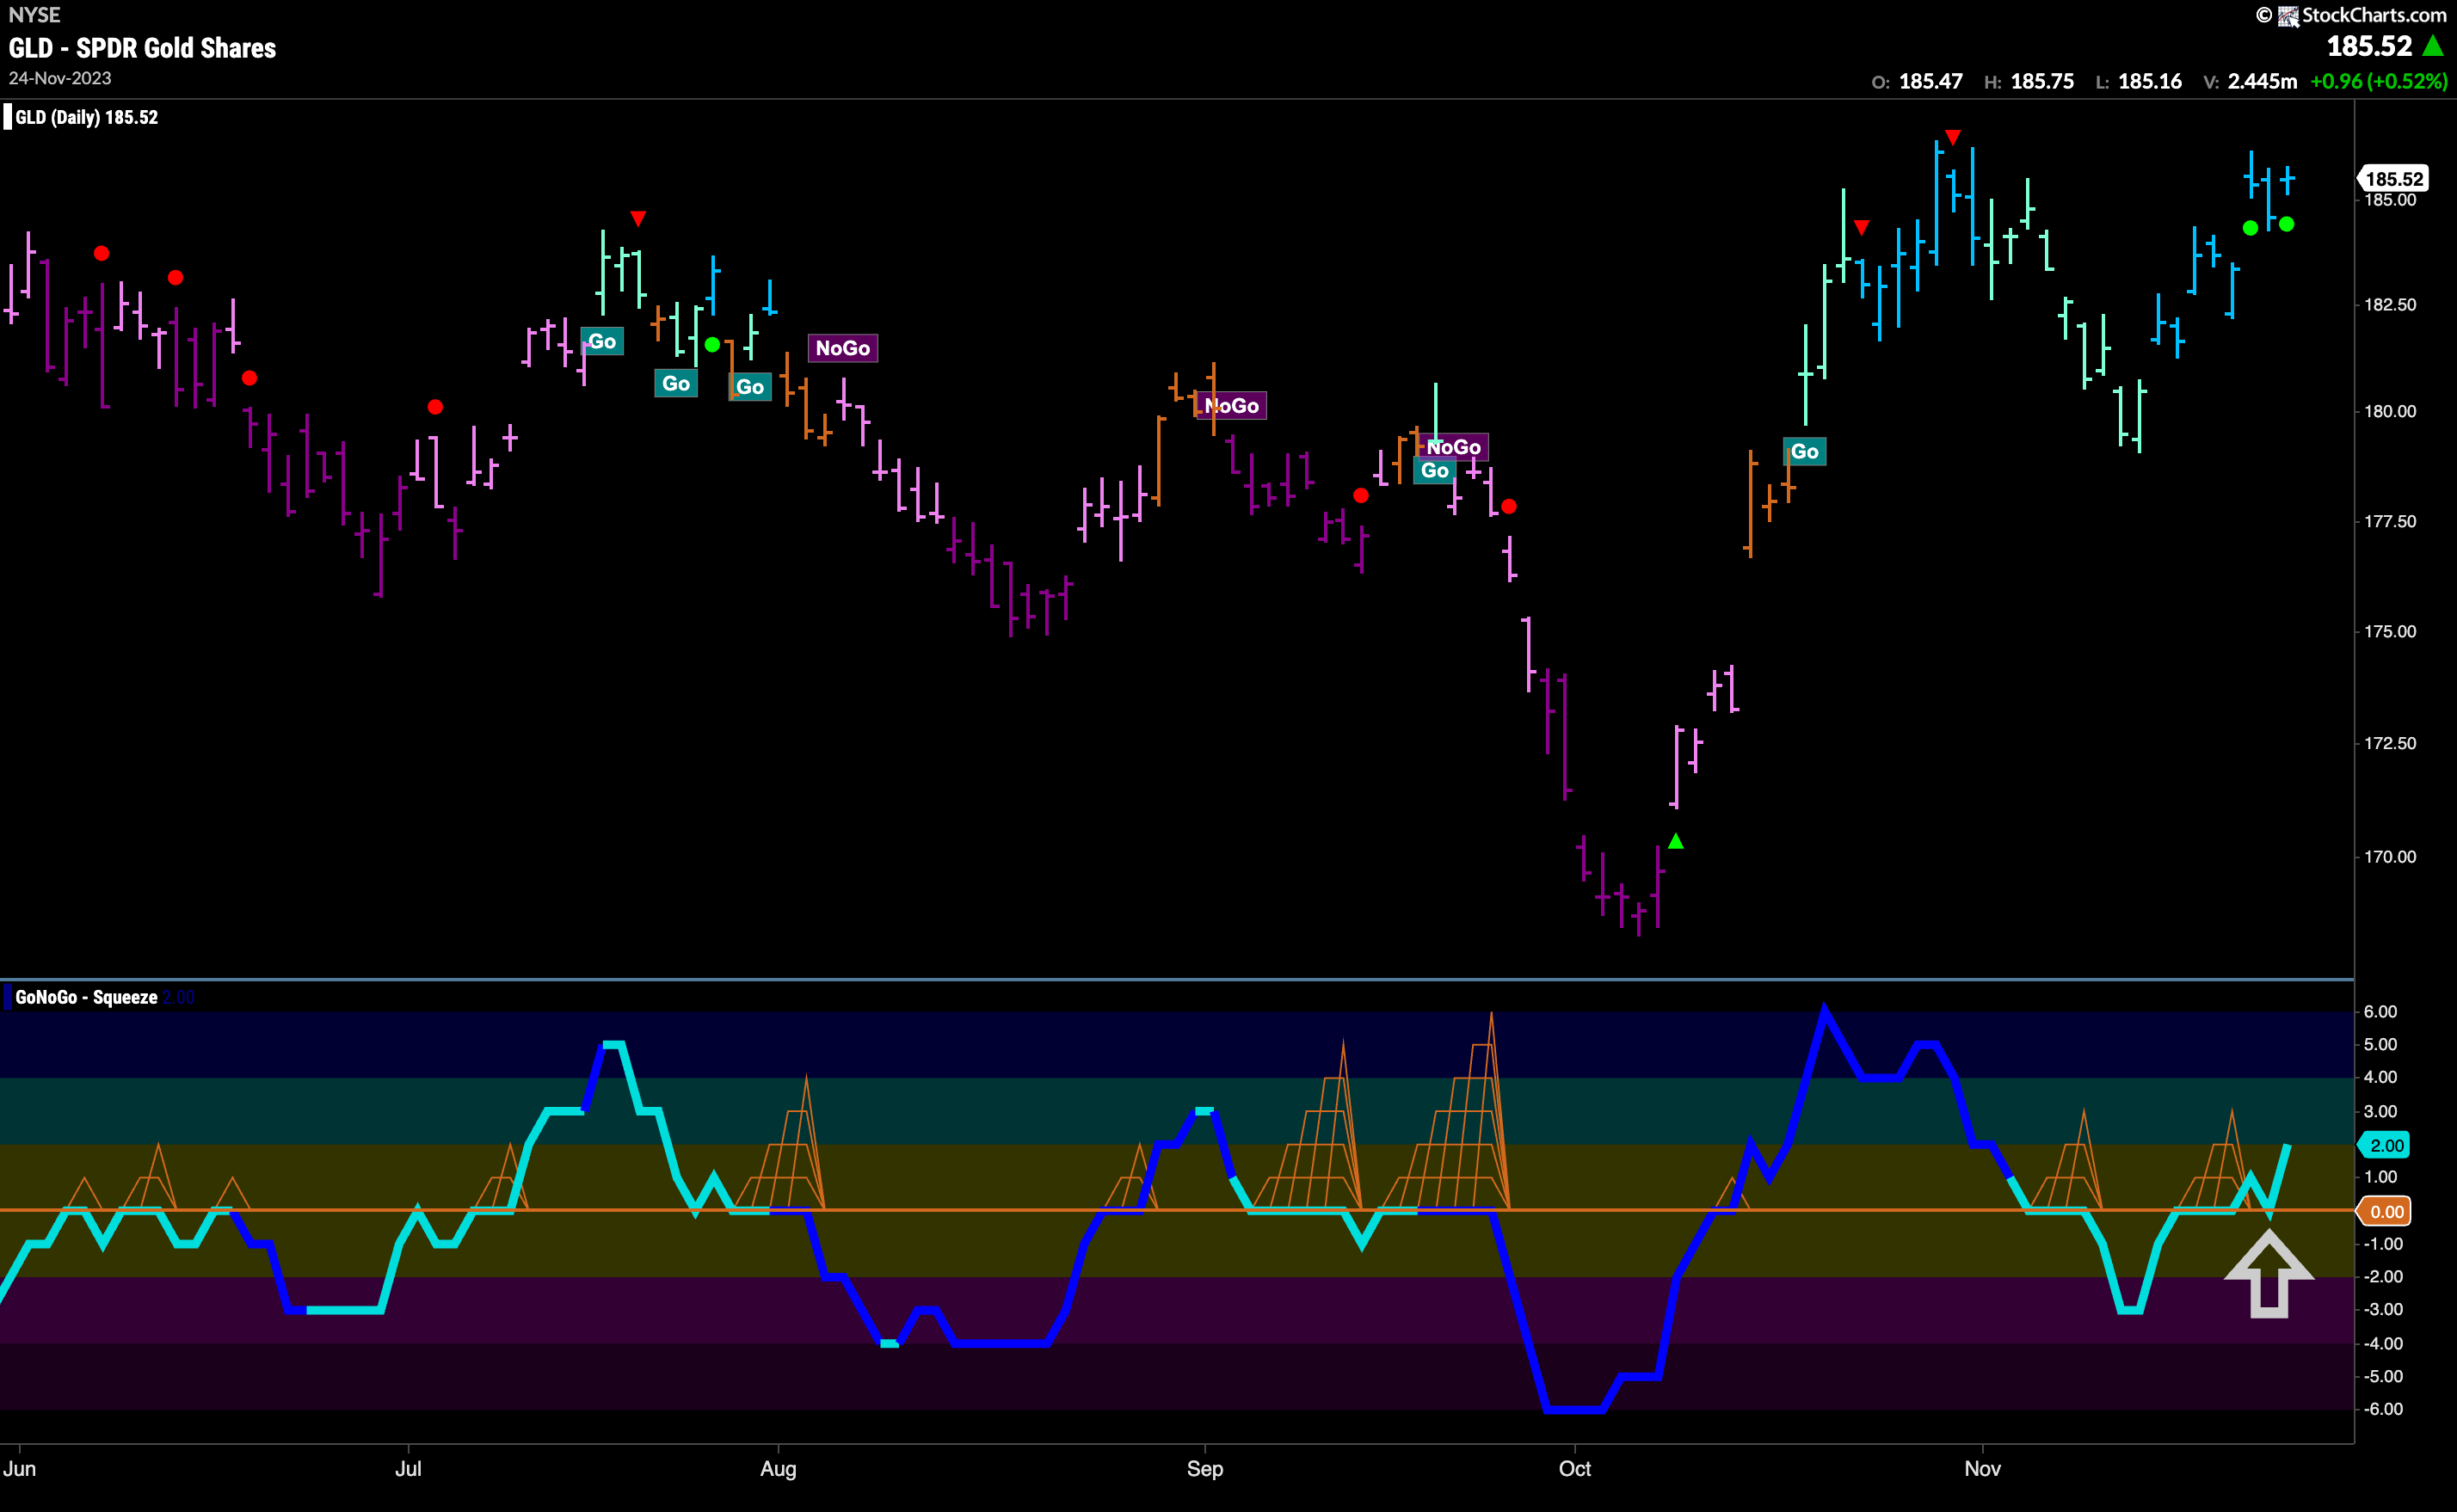
The “Go” trend found some real strength this past week as GoNoGo Trend painted a string of stronger blue bars. As we approach resistance from recent highs, GoNoGo Oscillator has broken back into positive territory and is finding support at the zero line. This is a positive sign for the precious metal as it tells us that momentum is resurgent in the direction of the underlying “Go” trend. We will watch to see if this positive momentum is enough to push price to new highs this week.
Sector RelMap
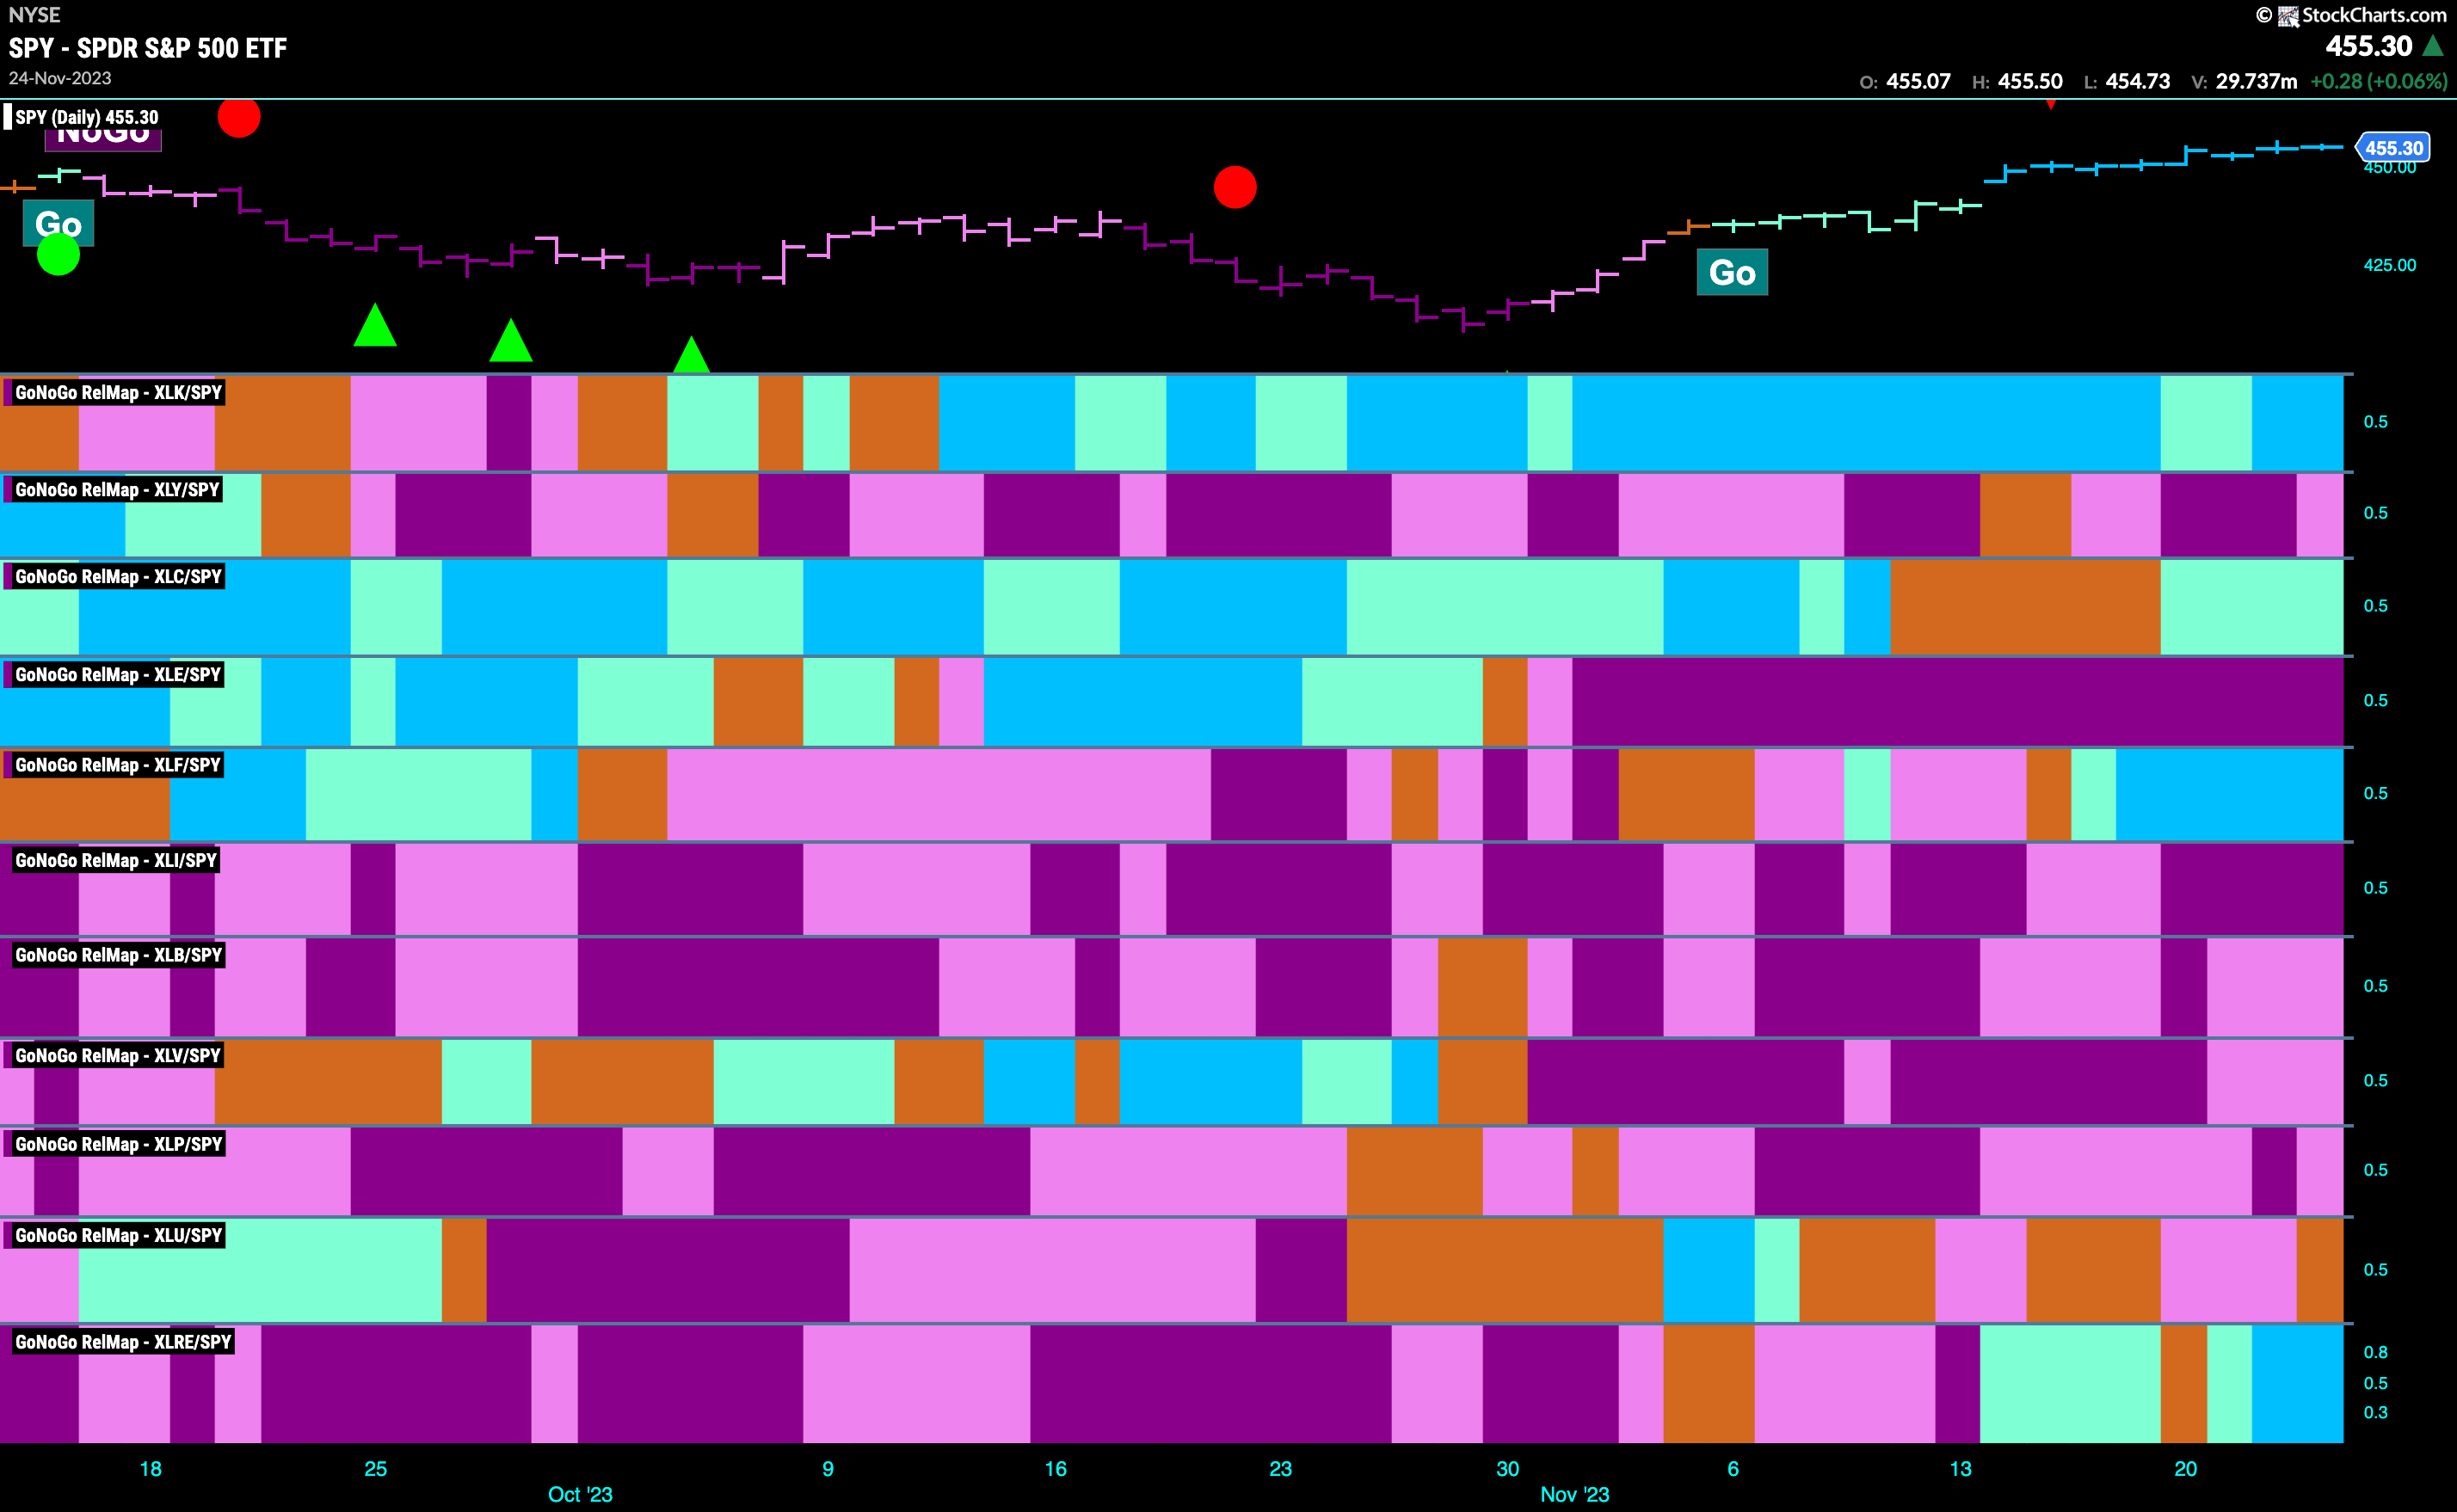
Below is the GoNoGo Sector RelMap. This GoNoGo RelMap applies the GoNoGo Trend to the relative strength ratios of the sectors to the base index. Looking at this map, we can quickly see where the relative outperformance is coming from as well as which sectors are lagging on a relative basis. 4 sectors are outperforming the base index this week. $XLK, $XLC $XLF, and $XLRE, are painting “Go” bars.
Financials Sub Group RelMap
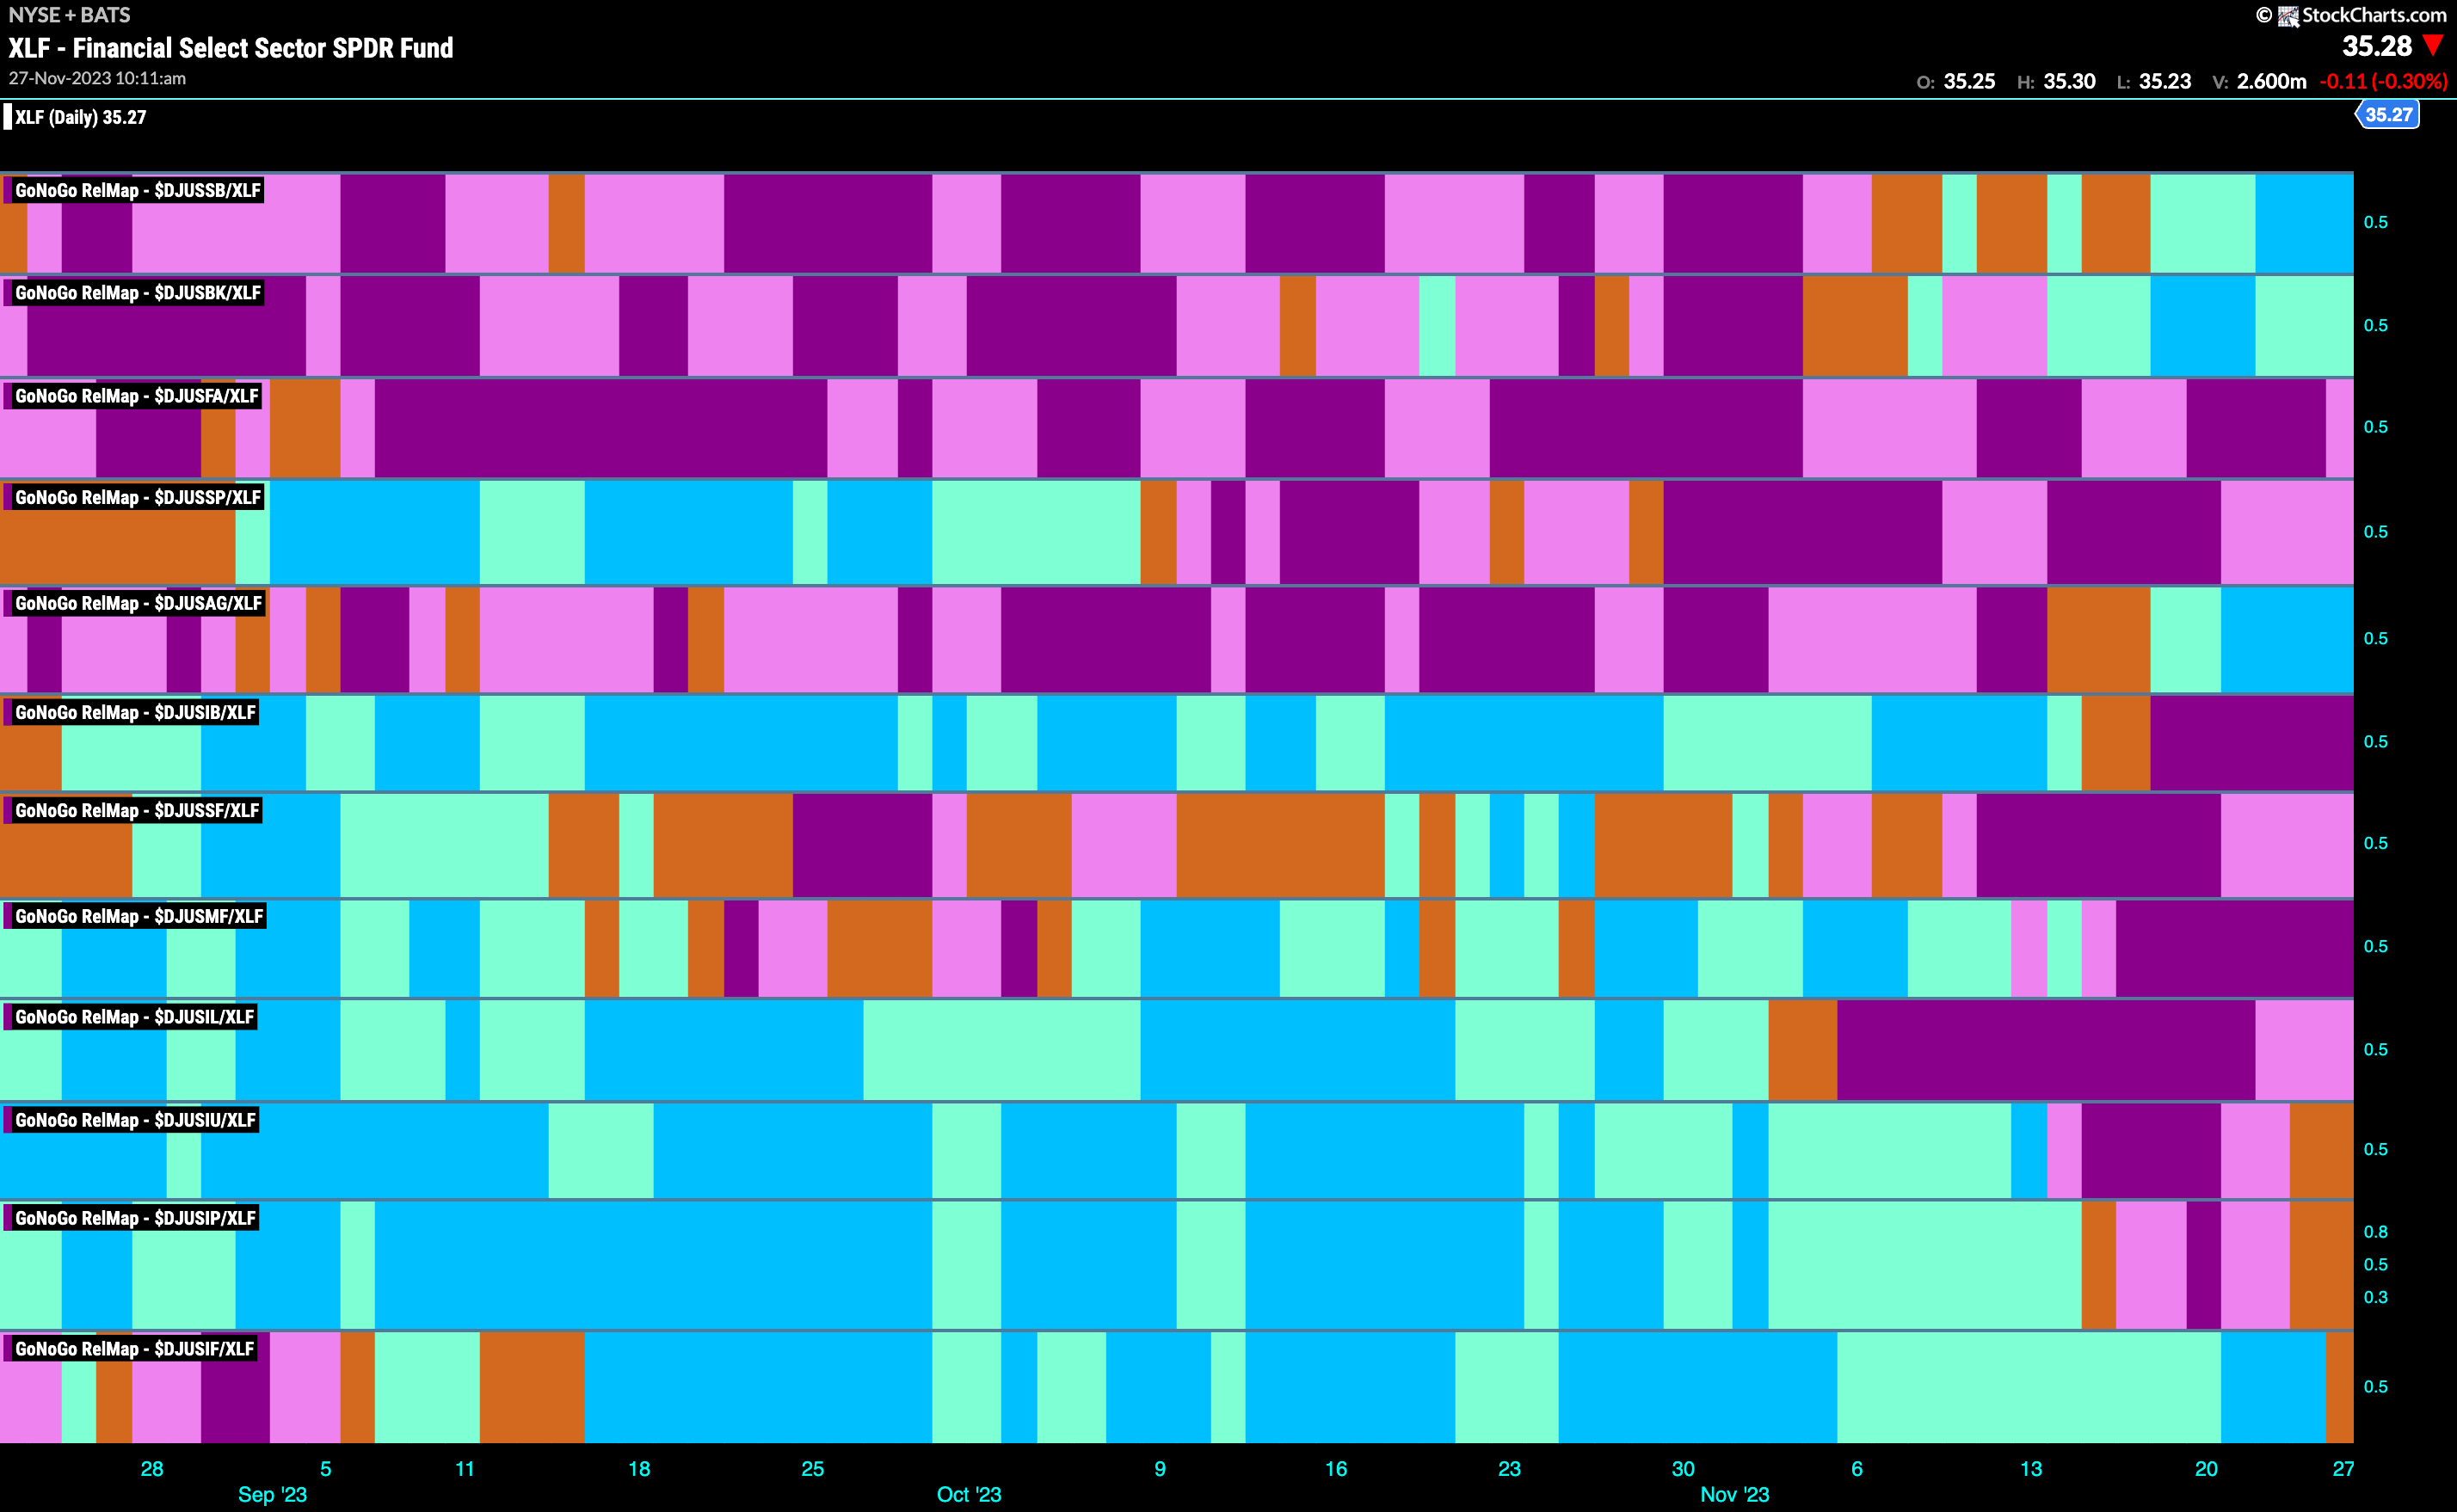
We saw in the above GoNoGo Sector RelMap that the financials sector was strong again this week. Let’s take a look at the sub group map below to see what is driving that sector outperformance. We can see there are a few leaders here. Investor services is painting strong blue “Go” bars in the top panel. The 5th panel represents the relative trend of asset managers to the the financials sector and we can see that it is painting strong relative “Go” bars as well.
$JEF Begins new “Go” Trend
The chart below shows daily prices for Jefferies Financial Group Inc, in the asset managers sub group. We saw that group is outperforming in the GoNoGo Financials Subgroup RelMap above. We can see that $JEF has started a new “Go” trend over this past week. GoNoGo Trend is painting aqua “Go” bars and GoNoGo Oscillator is in positive territory but not yet overbought. We will look for the “Go” trend to survive this week and for price to kick on higher.
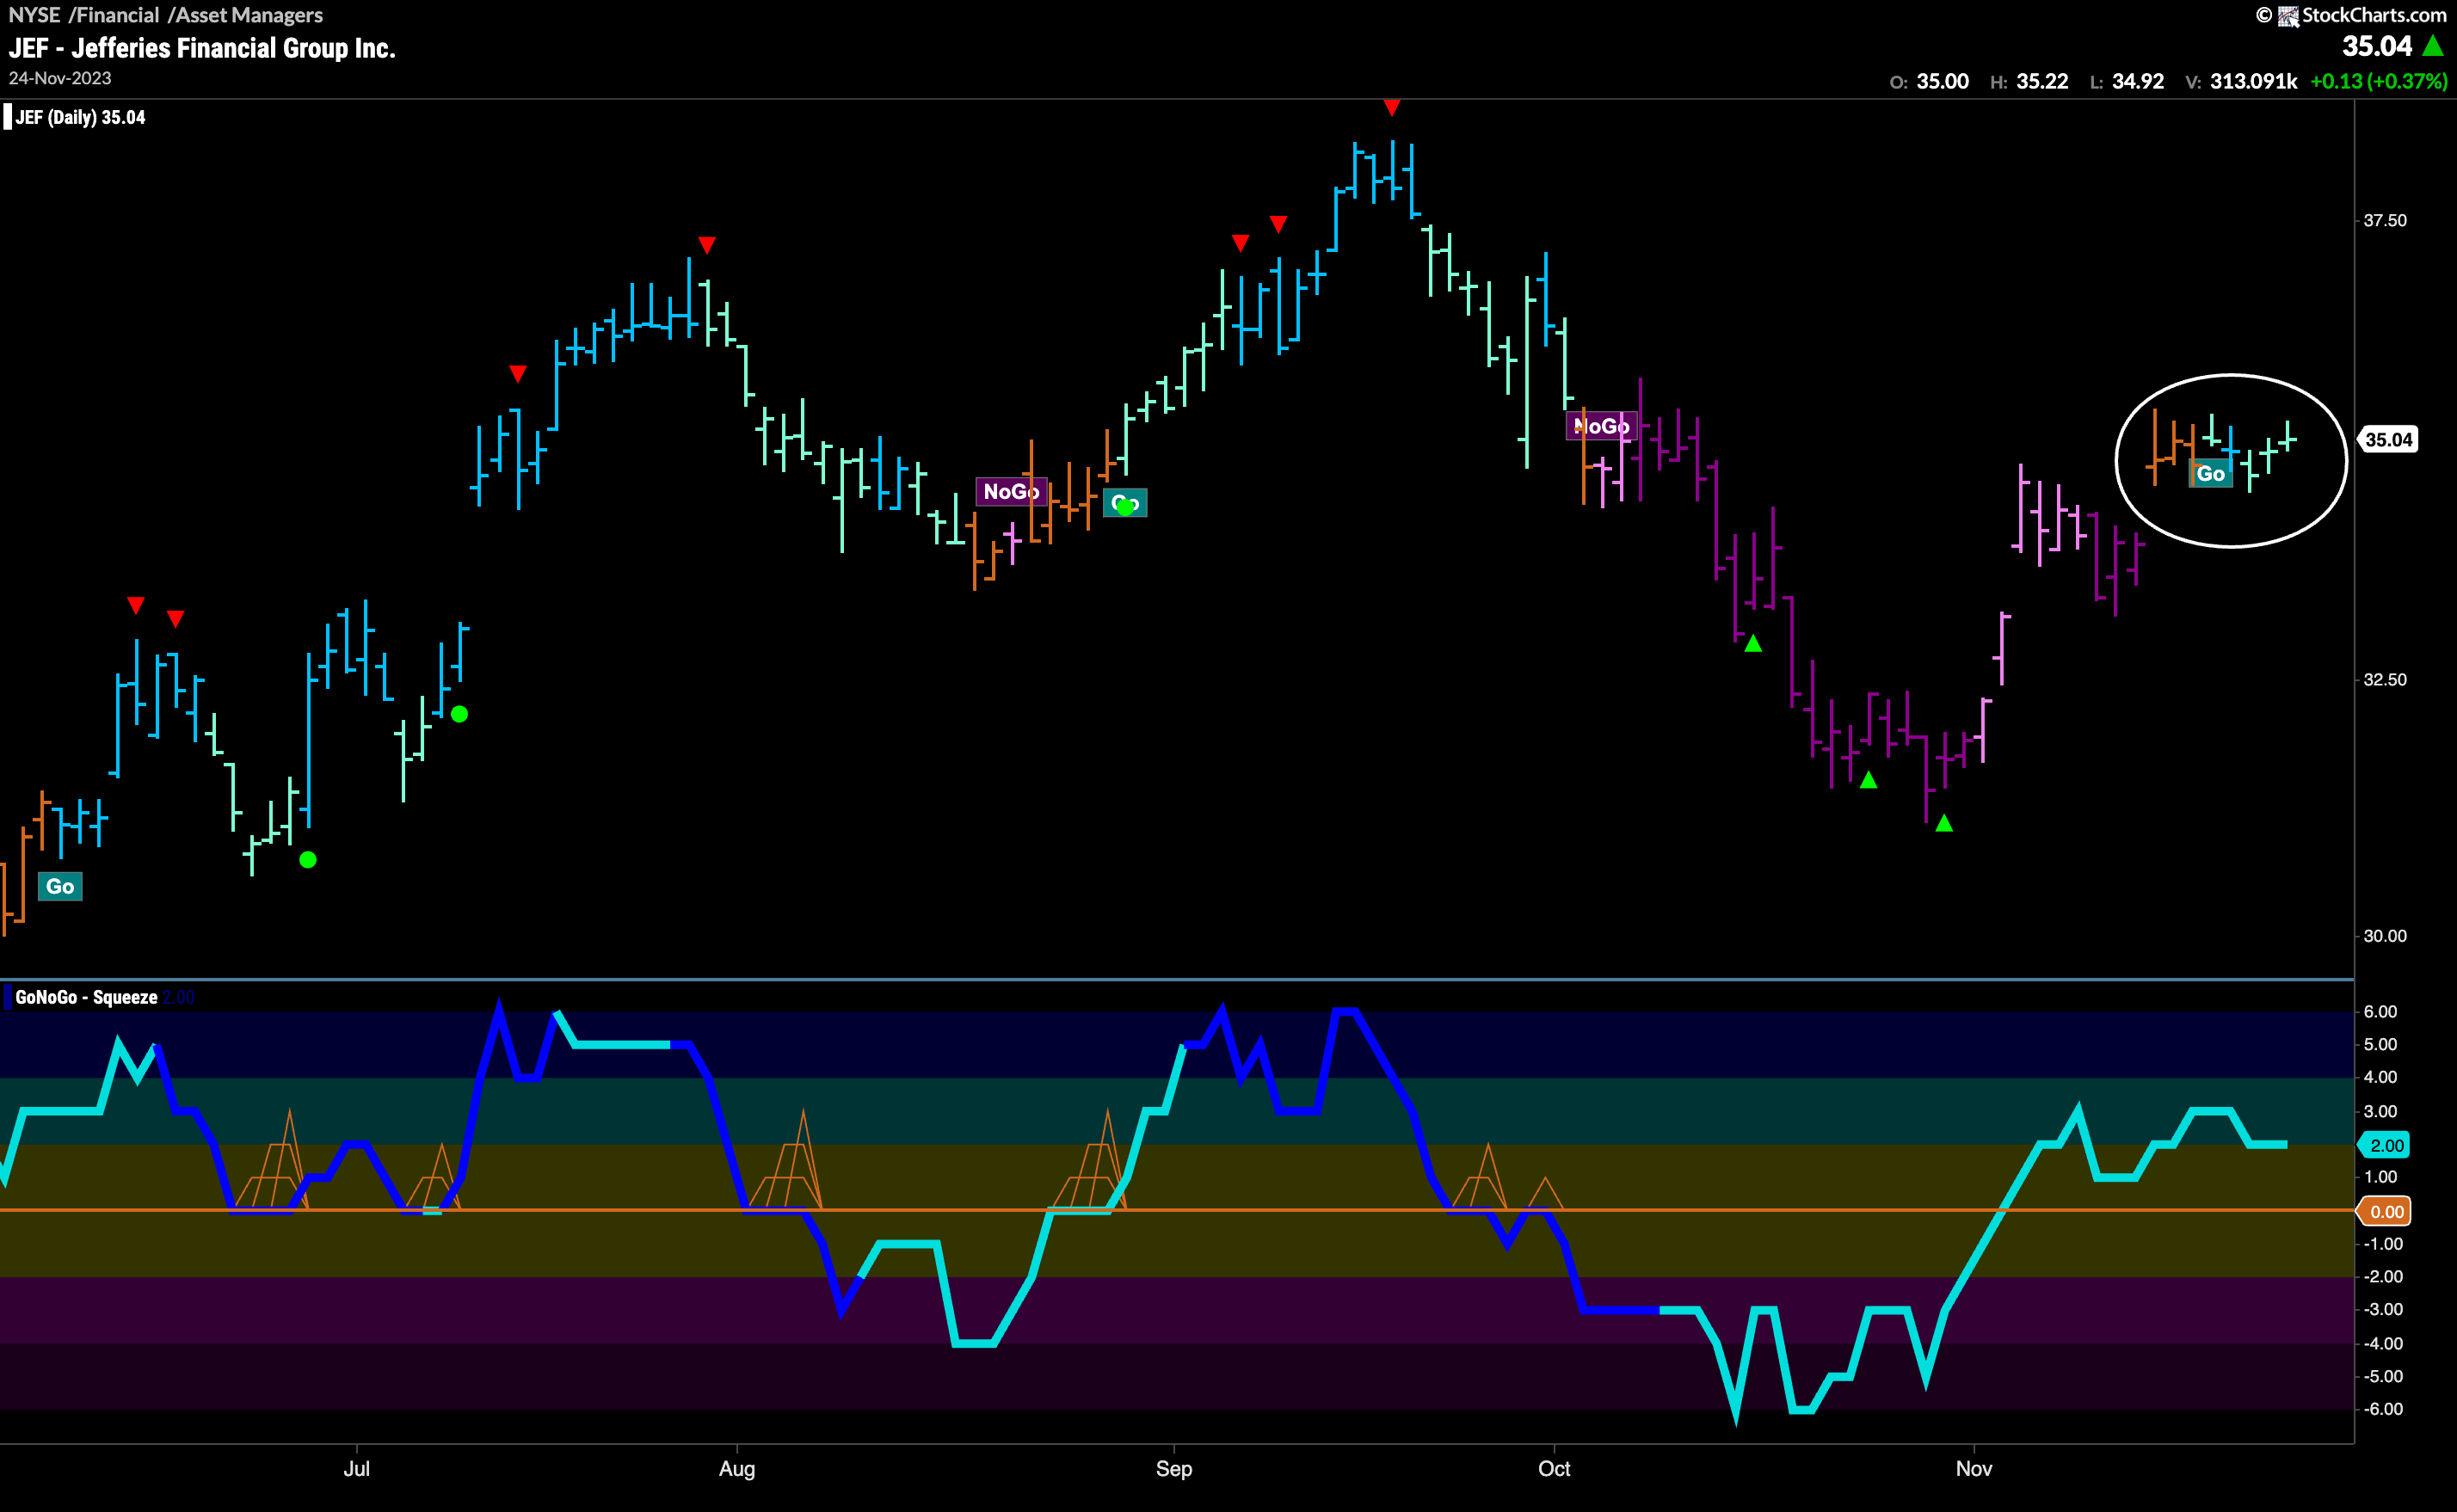
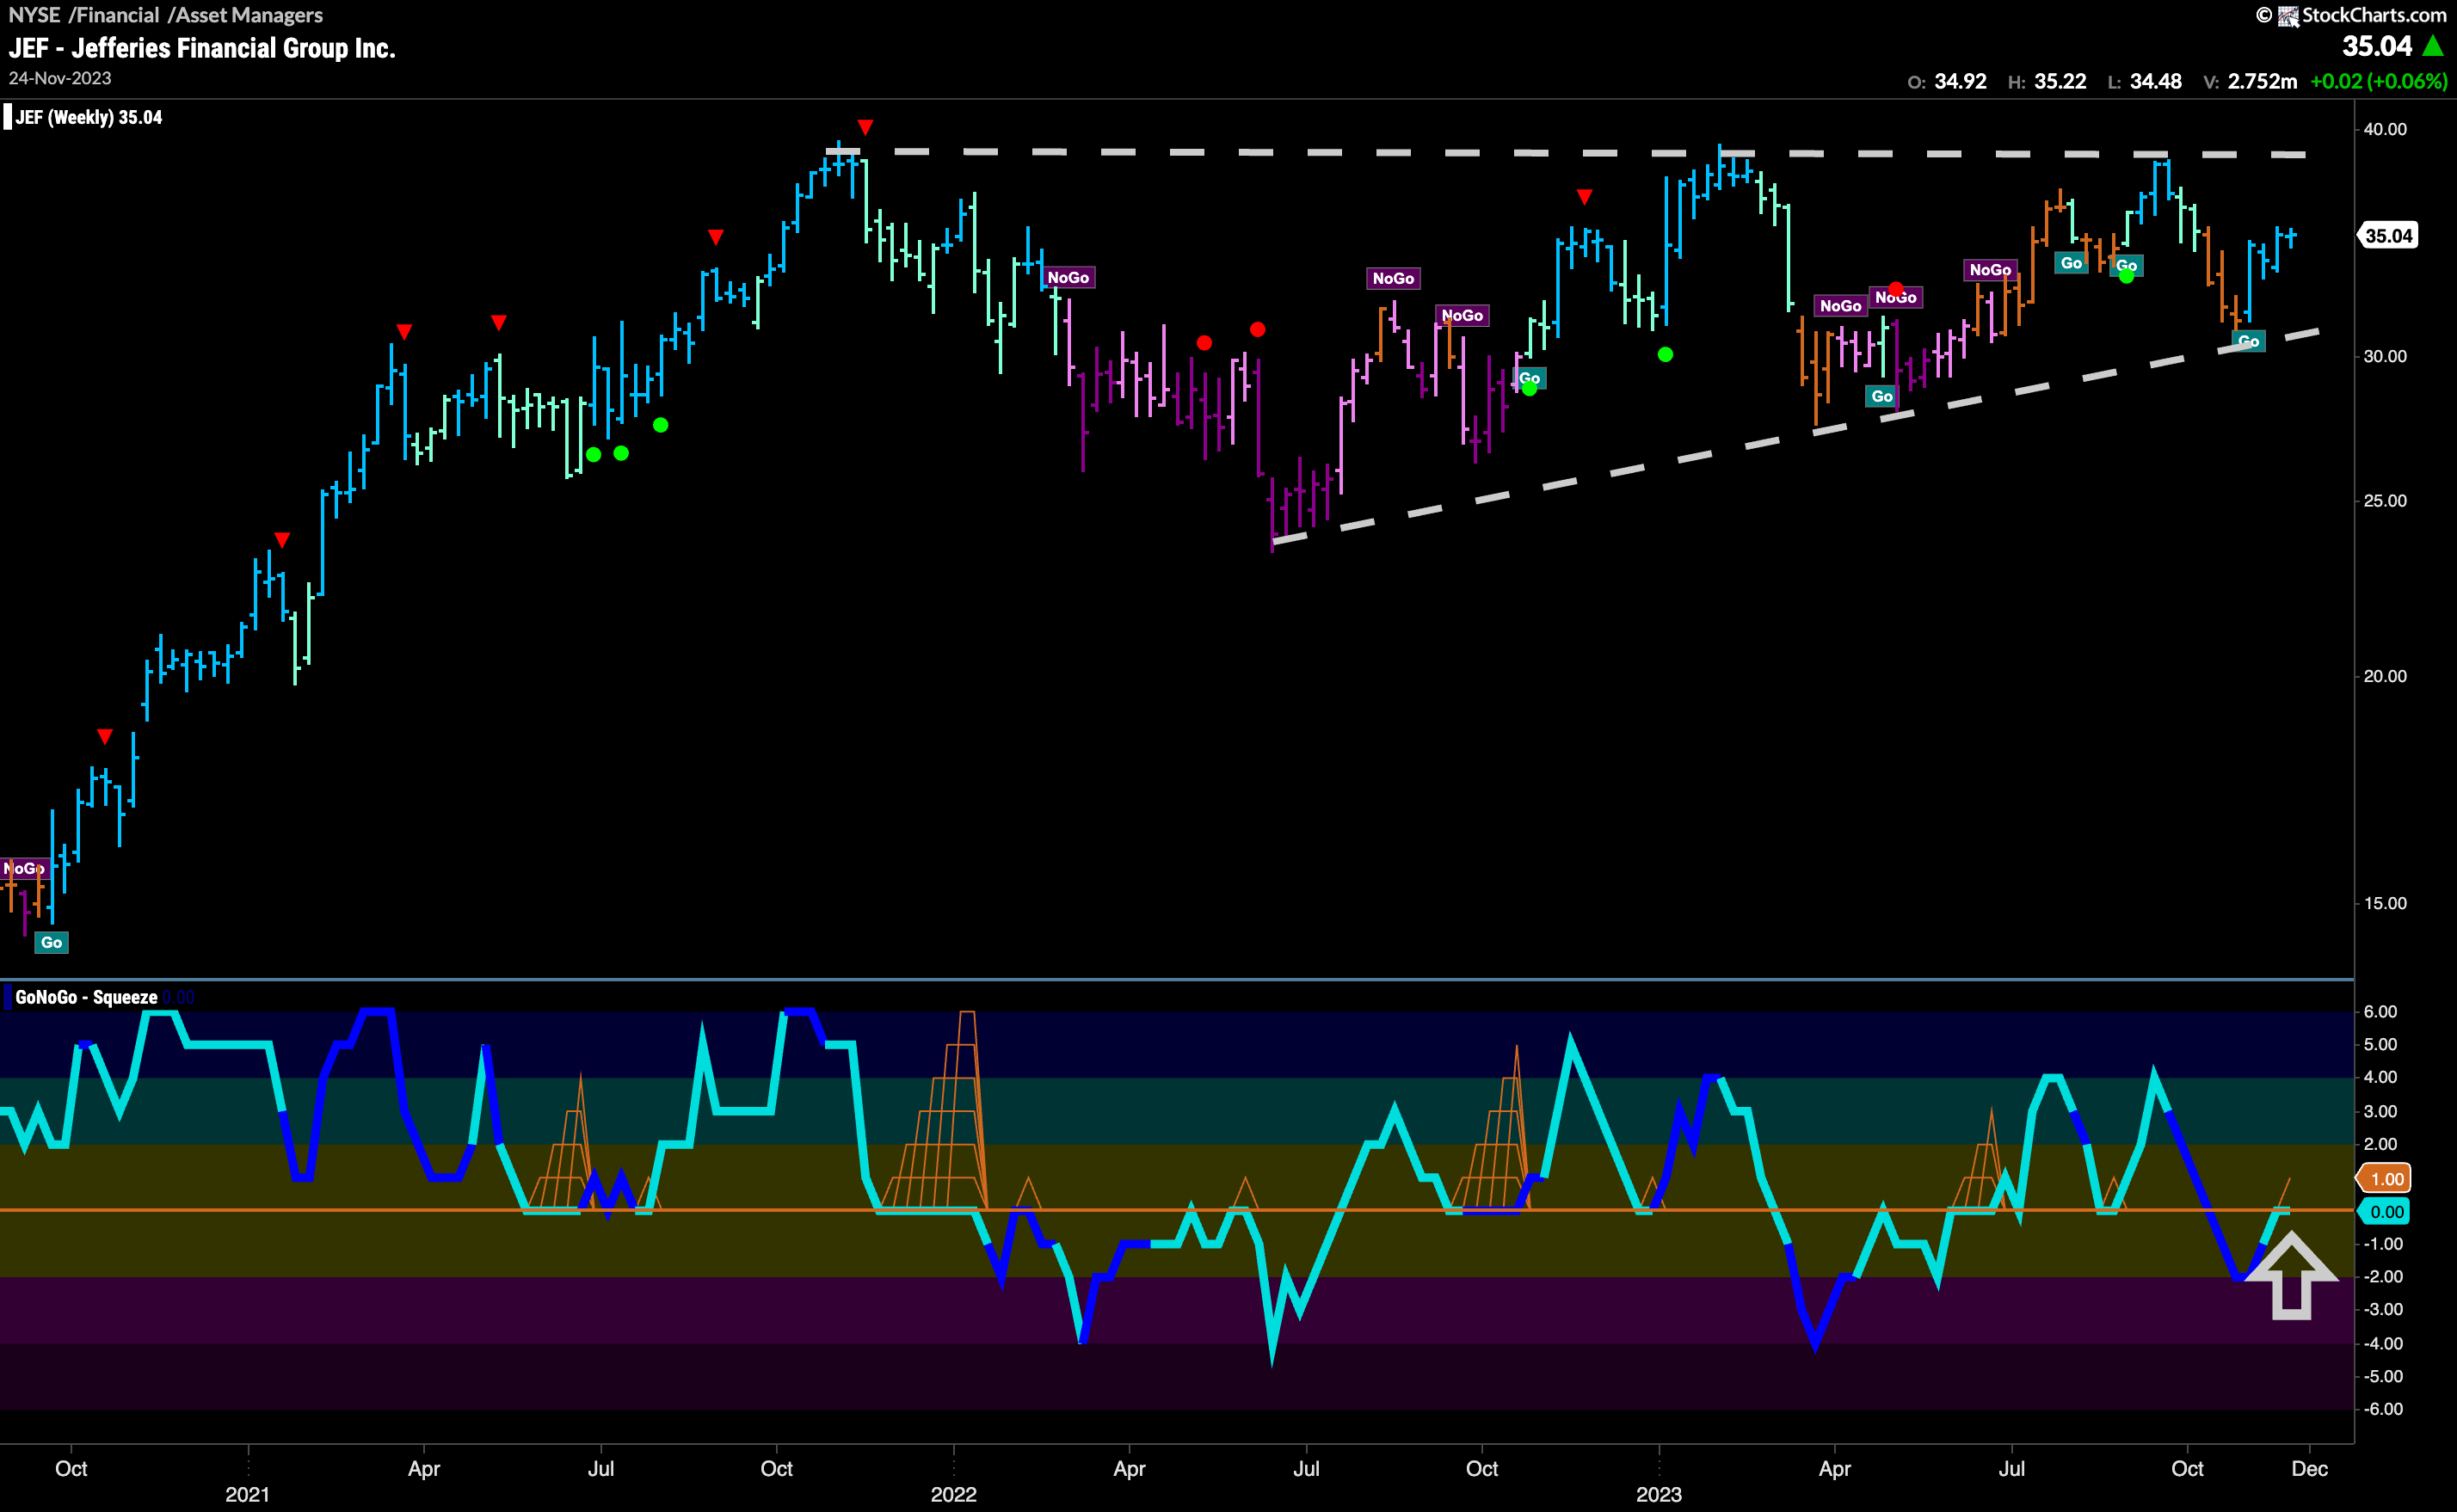
A look at the larger timeframe shows us what $JEF is trying to break out of. Although we see horizontal resistance at prior highs which is likely quite strong, buyer are stepping in at higher levels causing higher lows on the price chart. With fresh strong blue “Go” bars on this weekly chart we will look to see if price can make another attack at those resistance levels. GoNoGo Oscillator has quickly returned to test the zero line from below. If it can break back into positive territory that could give price the push it needs to set a new higher high.
