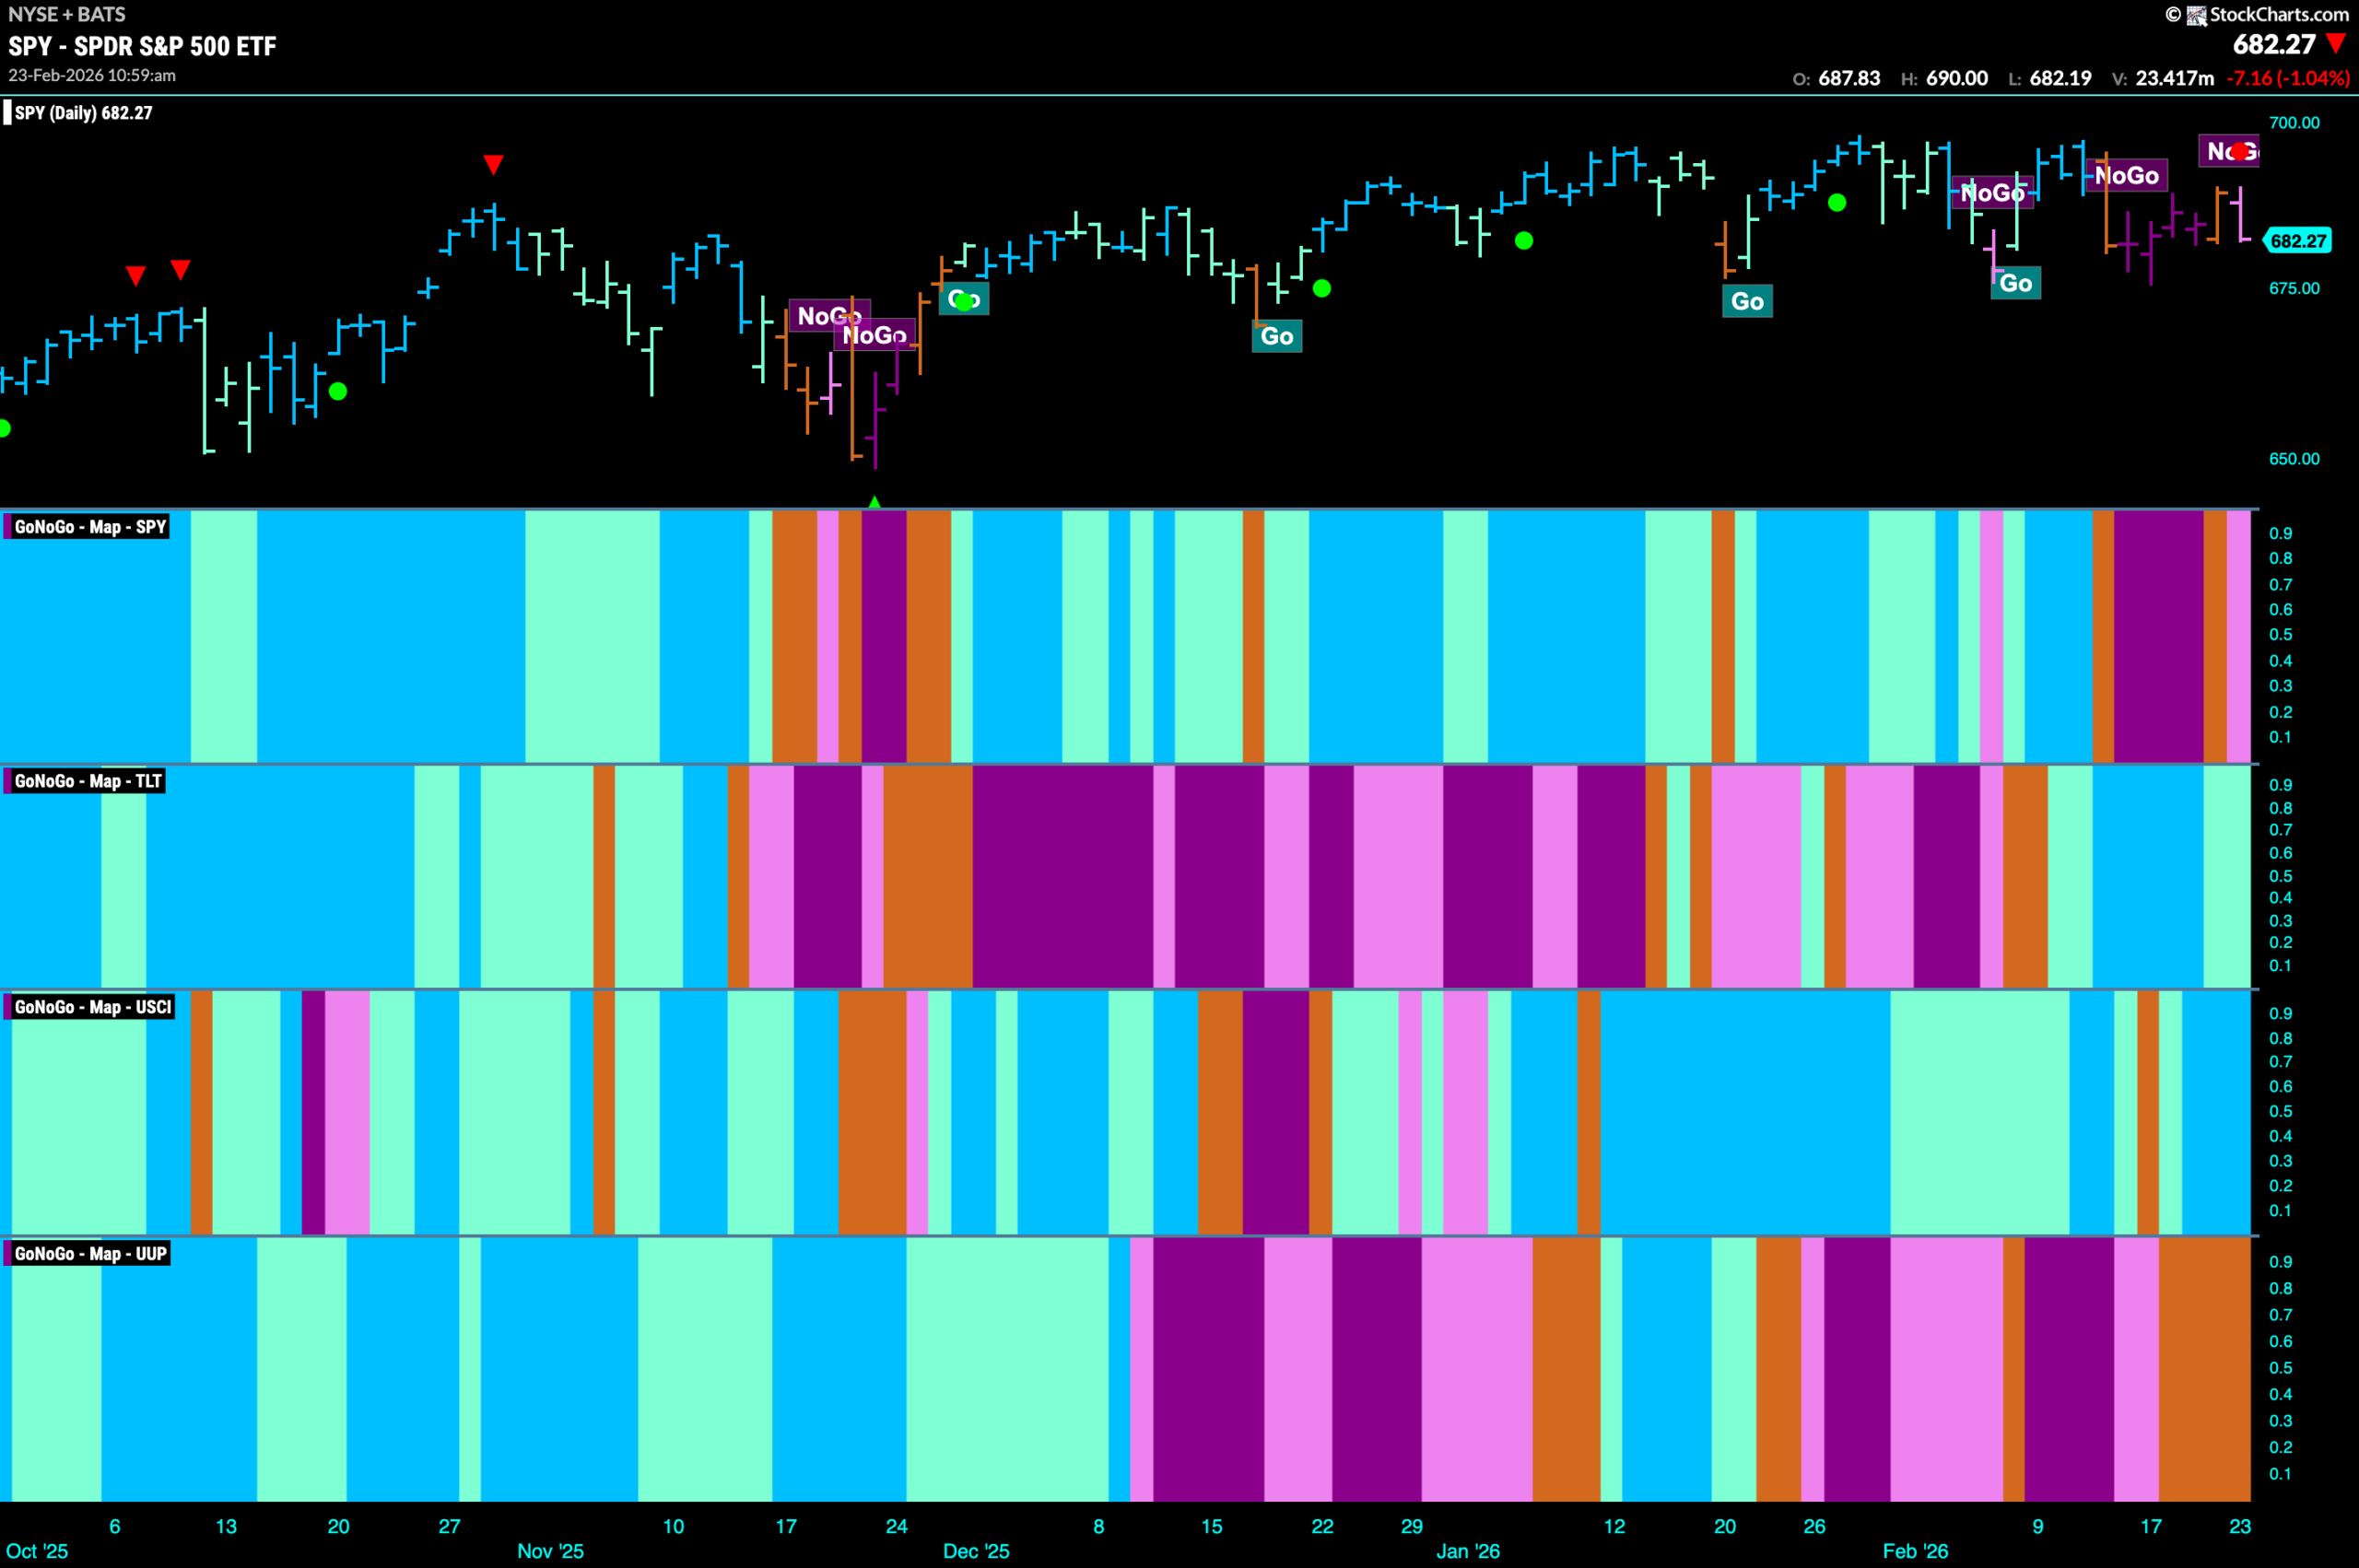

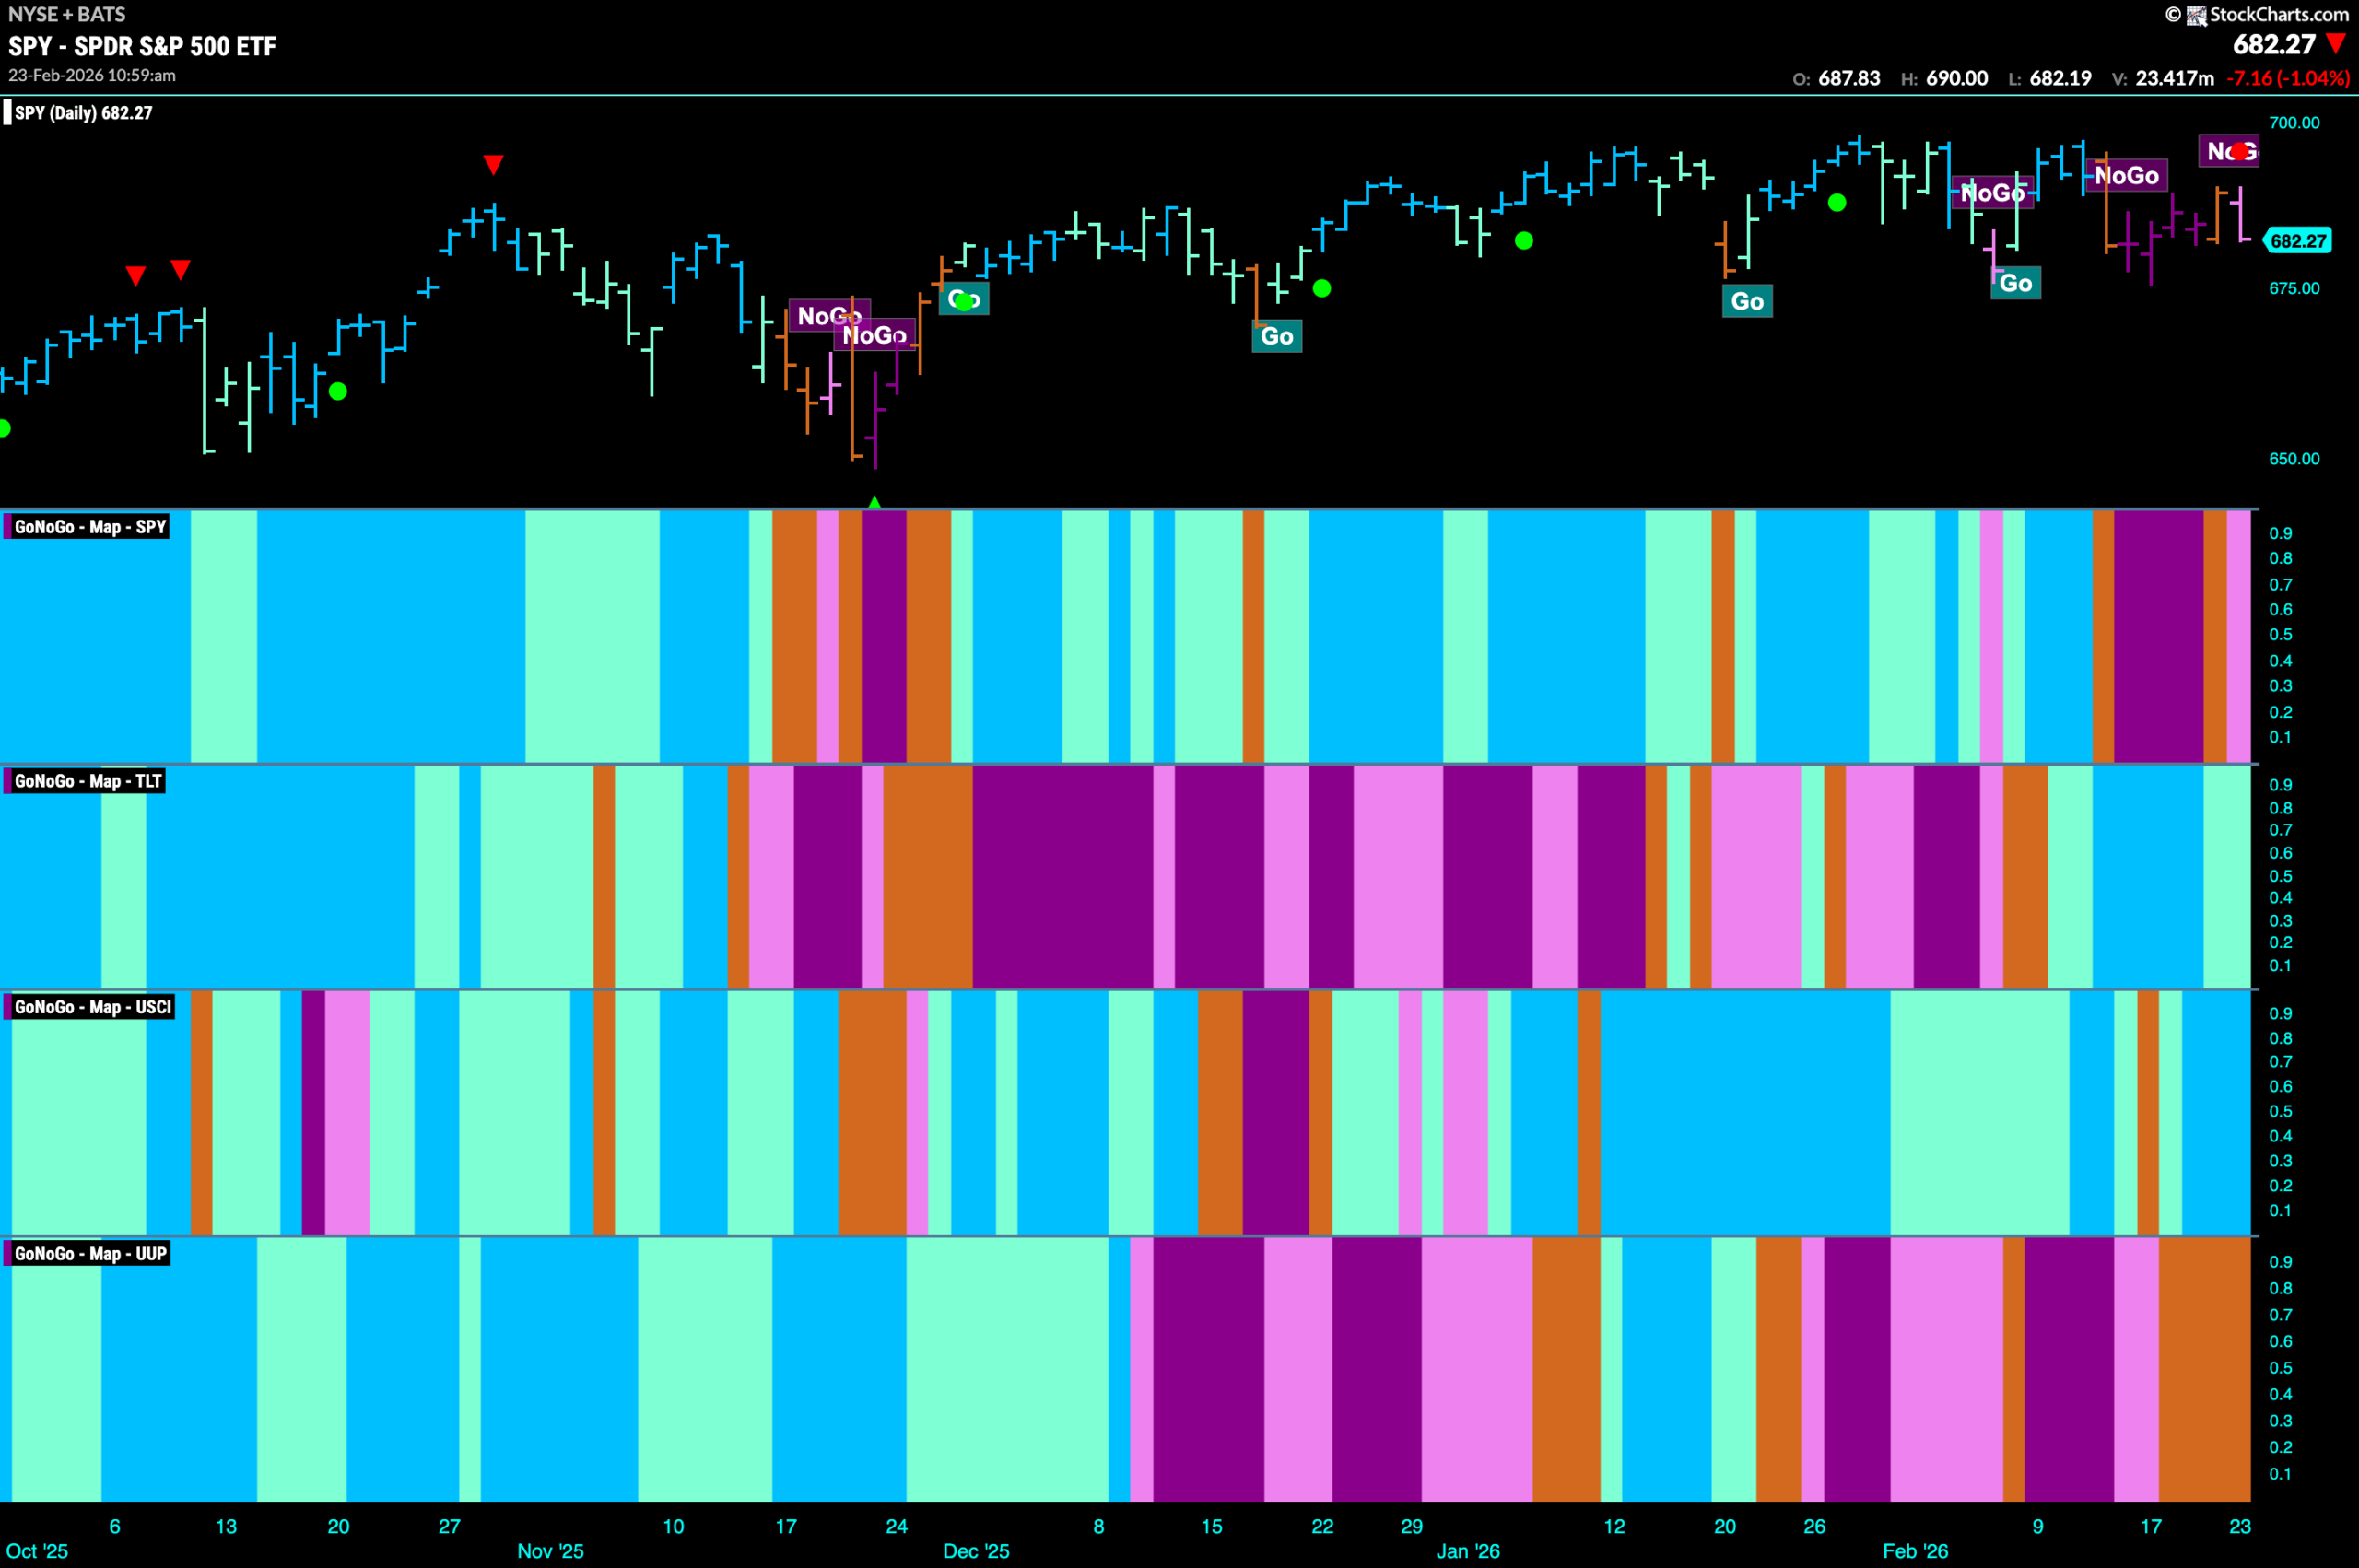
Good morning and welcome to this week’s Flight Path. Equities see some choppiness this week as we saw an amber “Go Fish” bar of uncertainty that was quickly followed by another pink “NoGo” bar. Treasury bond prices have remained in a “Go” trend this week but we see pale aqua bars representing a little weakness. U.S. commodities are painting strong blue bars after an amber “Go Fish” bar of uncertainty last week. GoNoGo Trend tells us that the market is uncertain about the direction of the dollar as we see consecutive amber “Go Fish” bars.
$SPY Experiences Chop
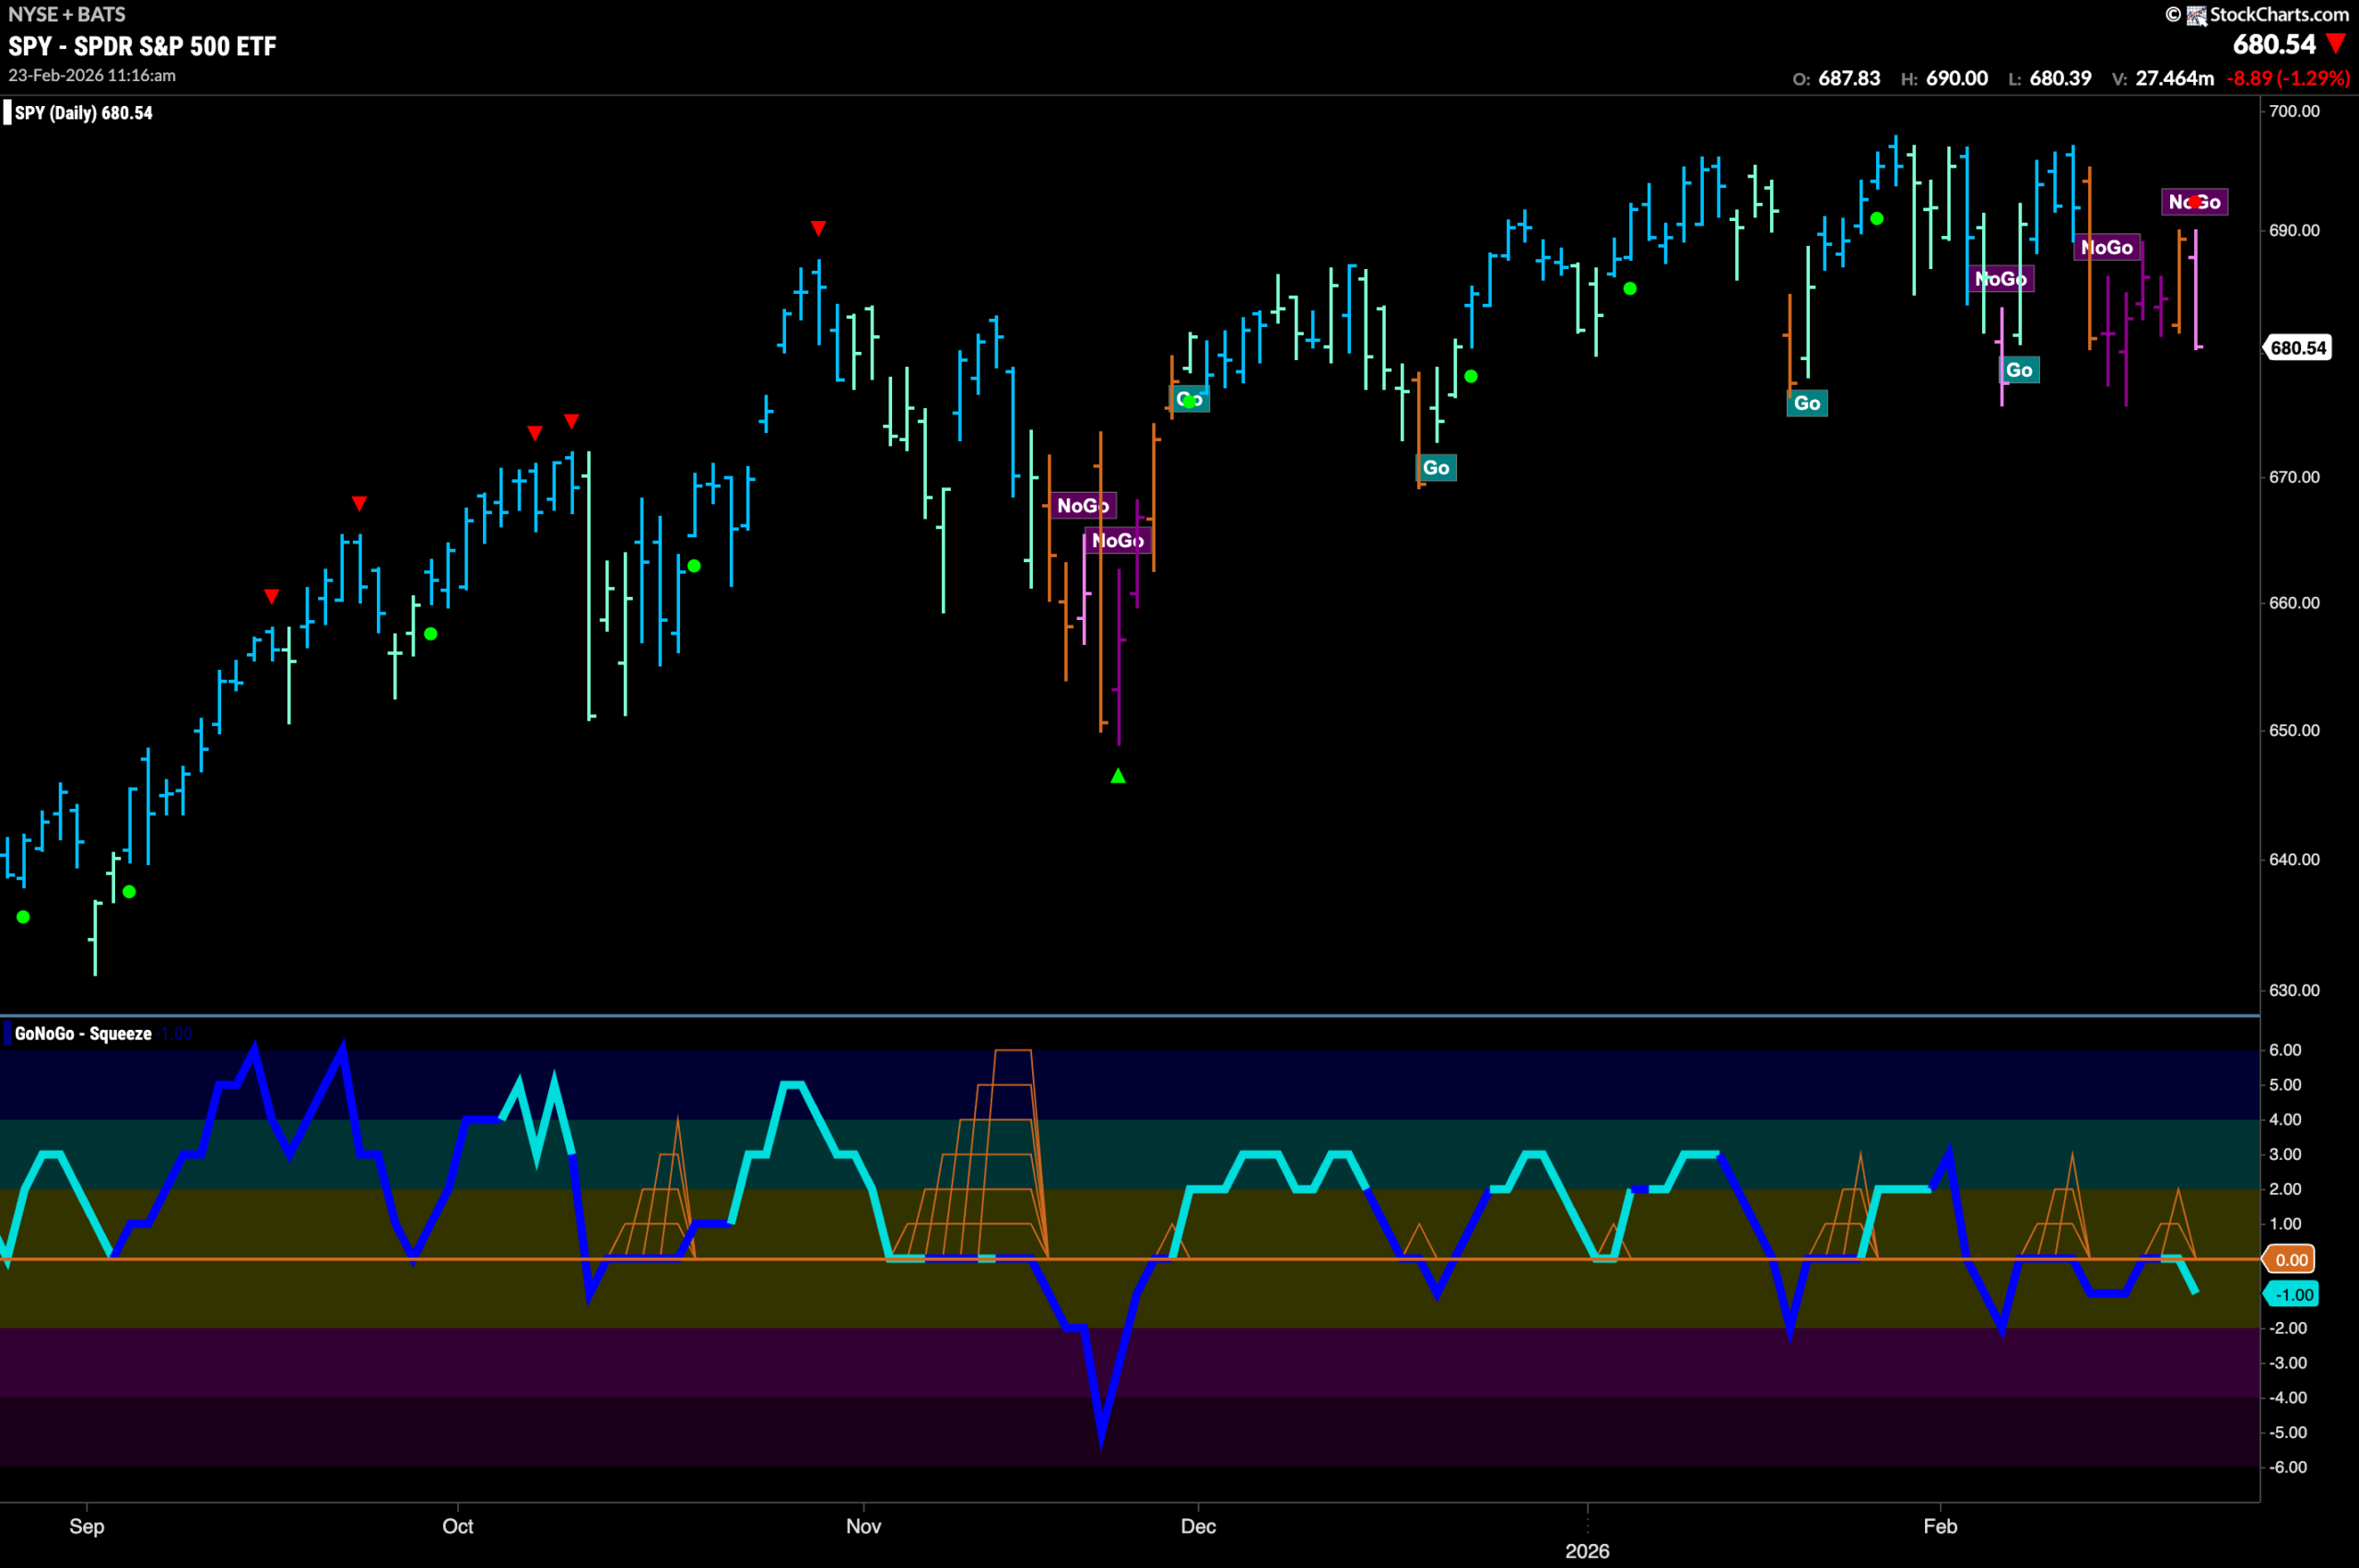
The GoNoGo chart below shows that the trend has been shaky this past week. We see an amber “Go Fish” bar returned at the end of the week and now the trend indicator is painting a pink “NoGo” bar. We seem to be in a range with clearly defined highs and lows. If we look at the oscillator panel, we see that it has been rejected by the zero line and is falling back into negative territory. This informs us that momentum is inline with the “NoGo” trend and for the time being we will expect downside pressure.
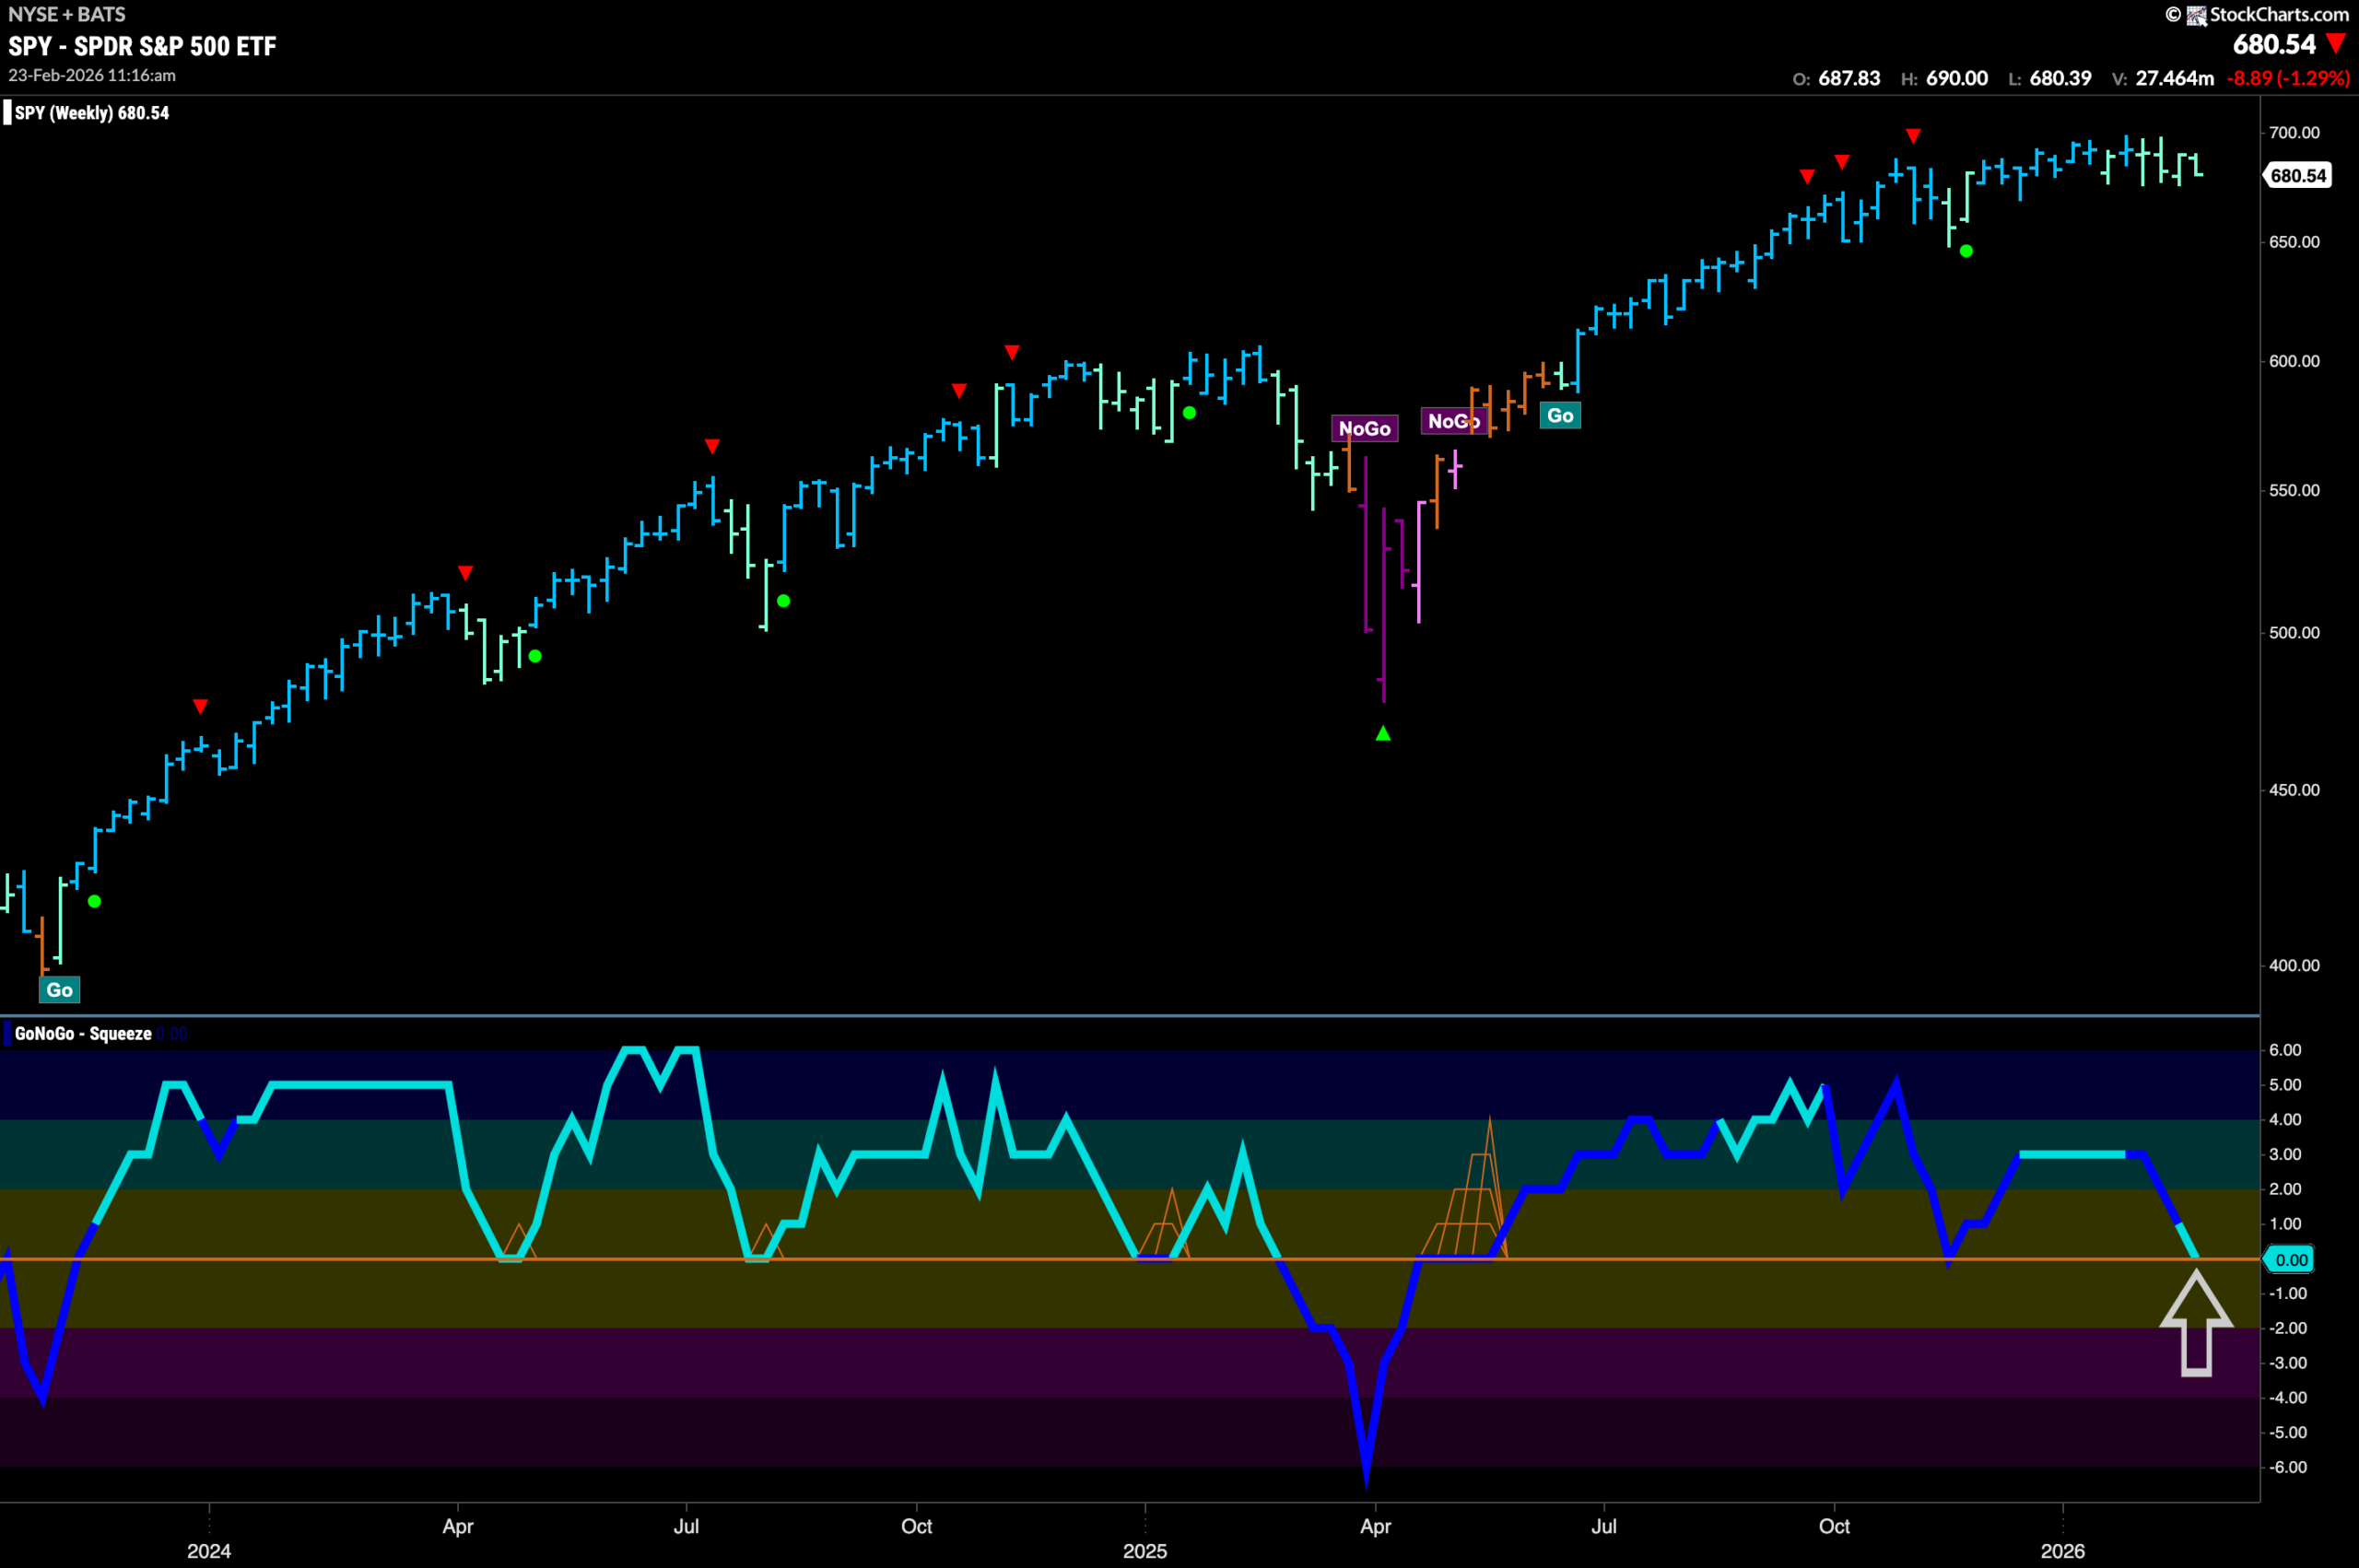
The weekly chart shows that on the larger time frame we are at a critical juncture. We have seen a month of weaker aqua bars and not a single higher weekly close during that time. GoNoGo Oscillator has fallen to test the zero line from above and for the health of this “Go” trend we will need to see support at this level. If the oscillator can bounce back into positive territory we would likely see the “Go” trend continue on signs of trend continuation. Should the zero line fail to hold, we may be looking at a longer correction.
Treasury Rates Remain in “NoGo”
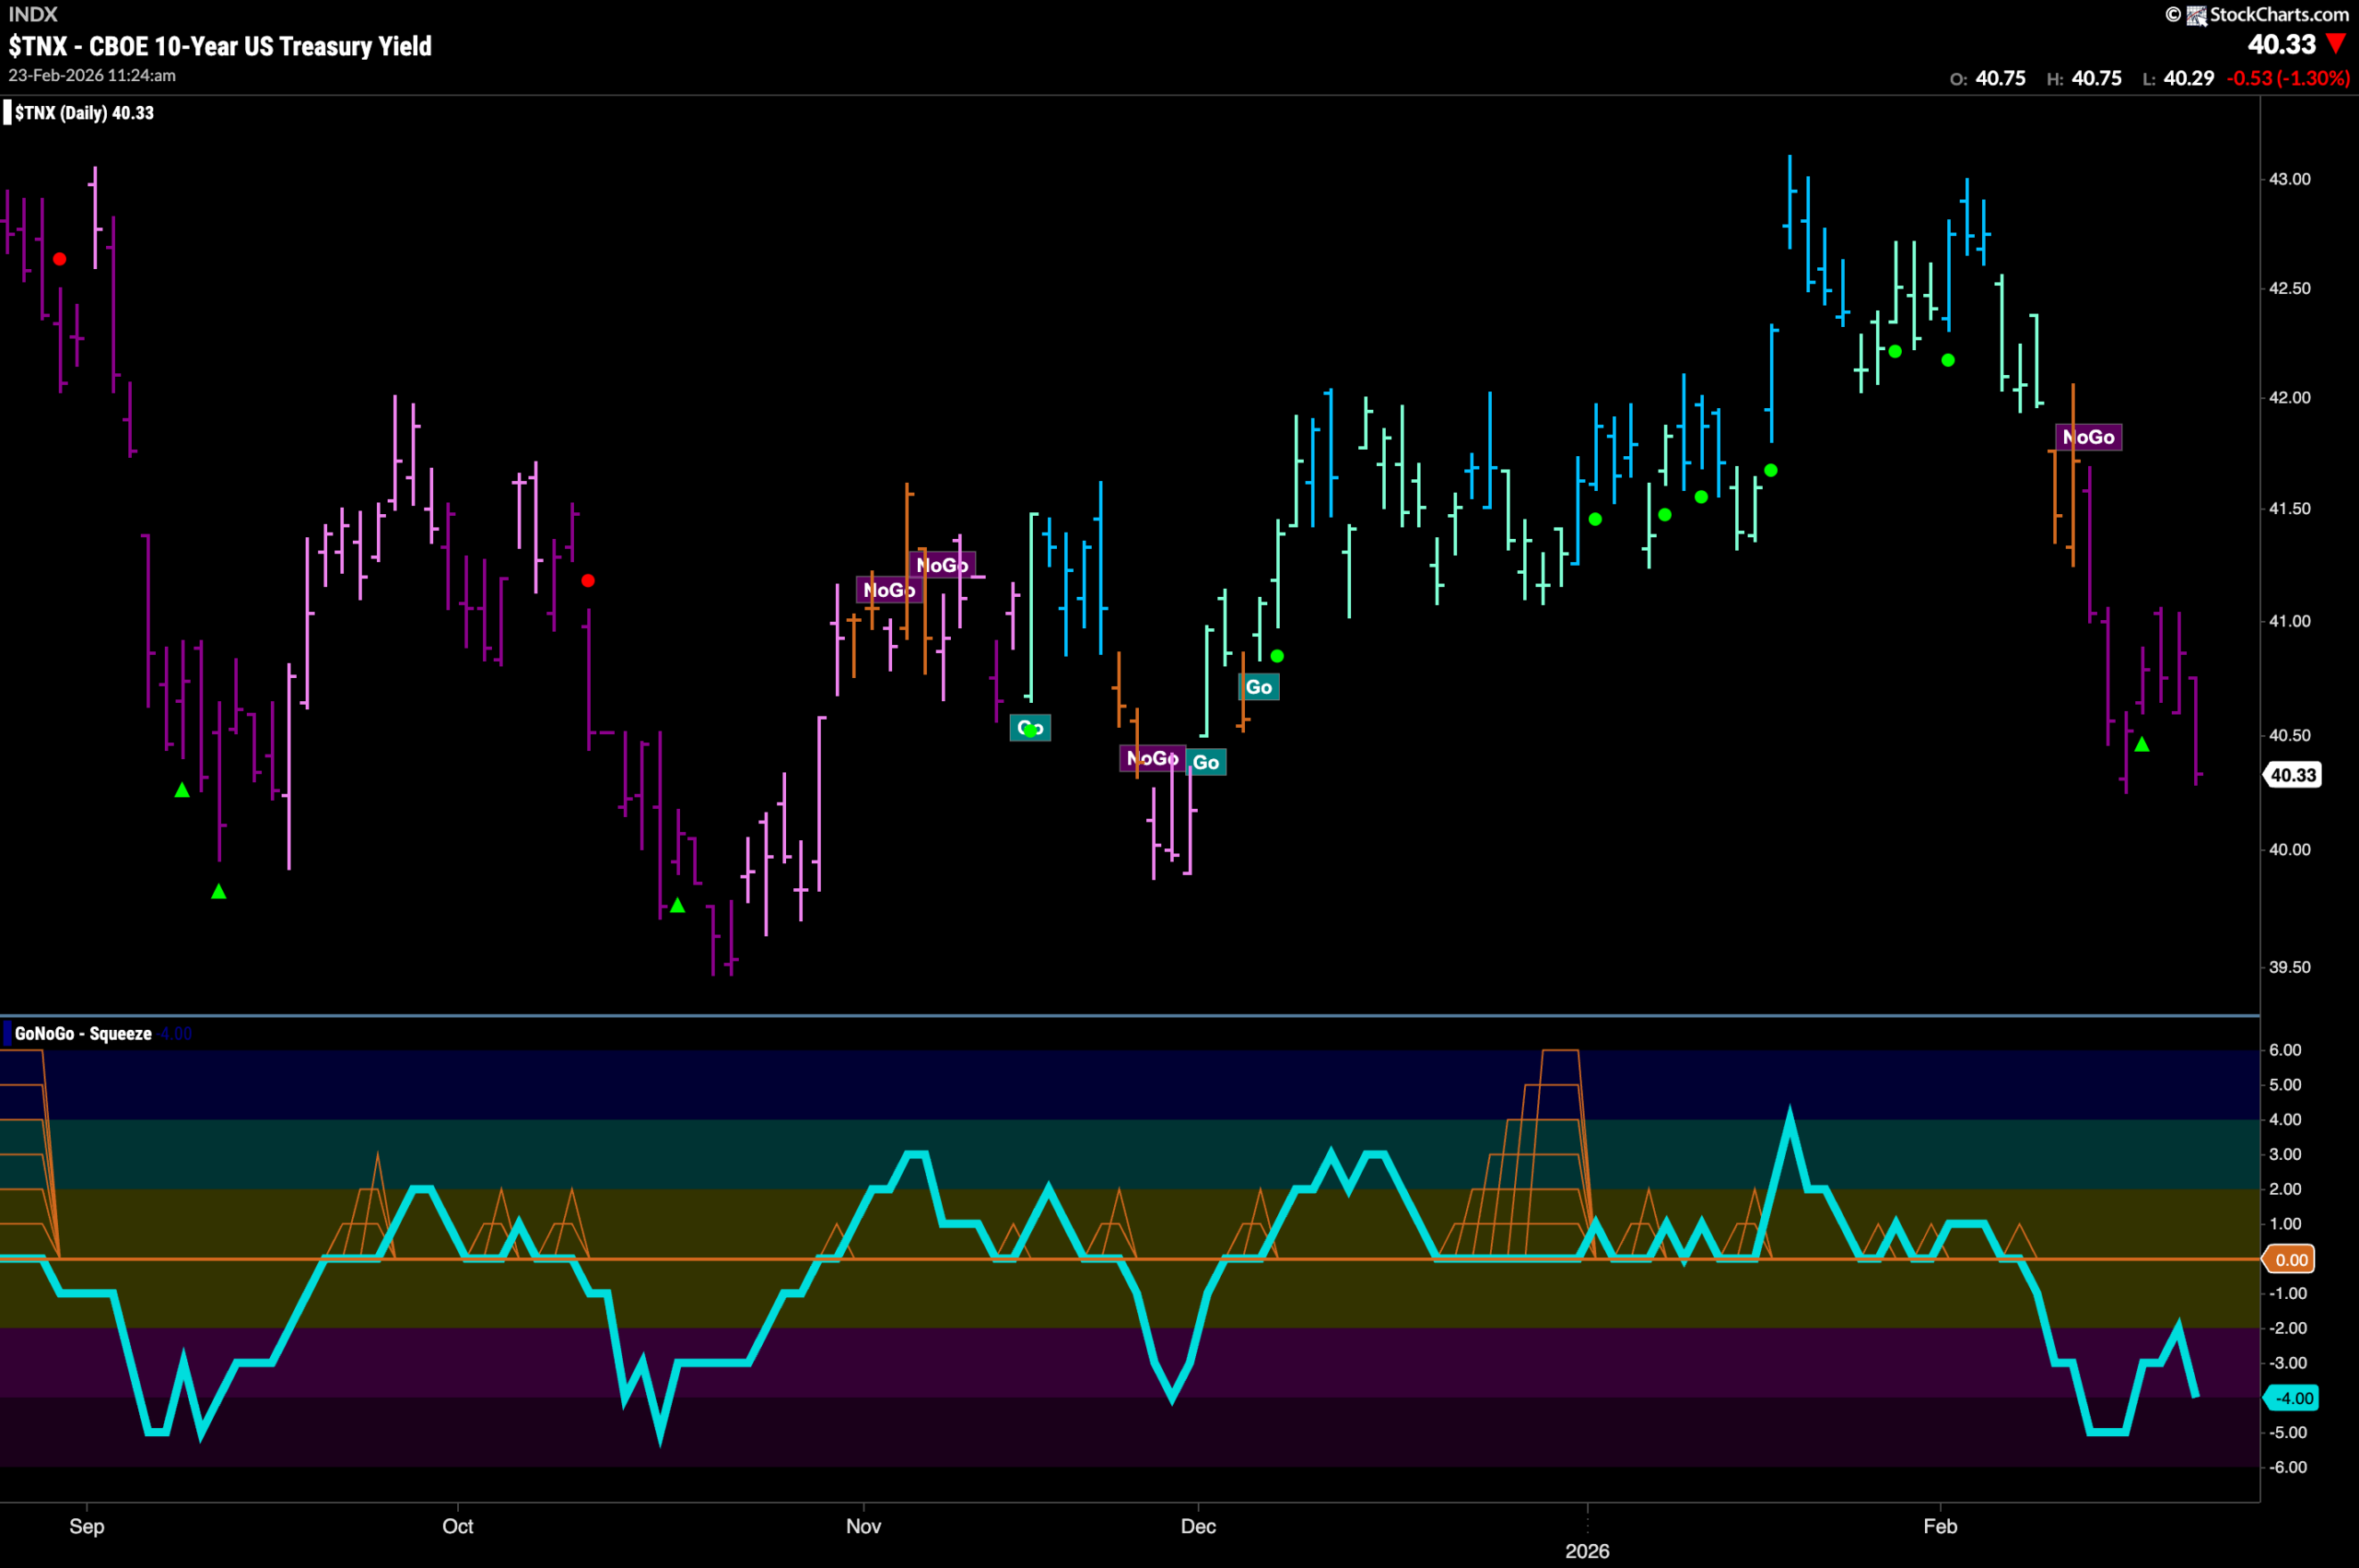
GoNoGo Trend shows the trend remained this week as the indicator painted a week of strong purple bars. After a NoGo Countertrend Correction Icon (green arrow), price tried to rally but we see on the last bar of the week it fell again to test the prior low. GoNoGo Oscillator is in negative territory having rolled over after failing to touch zero and is now at a value of -4, approaching oversold.
Dollar Displays Uncertainty
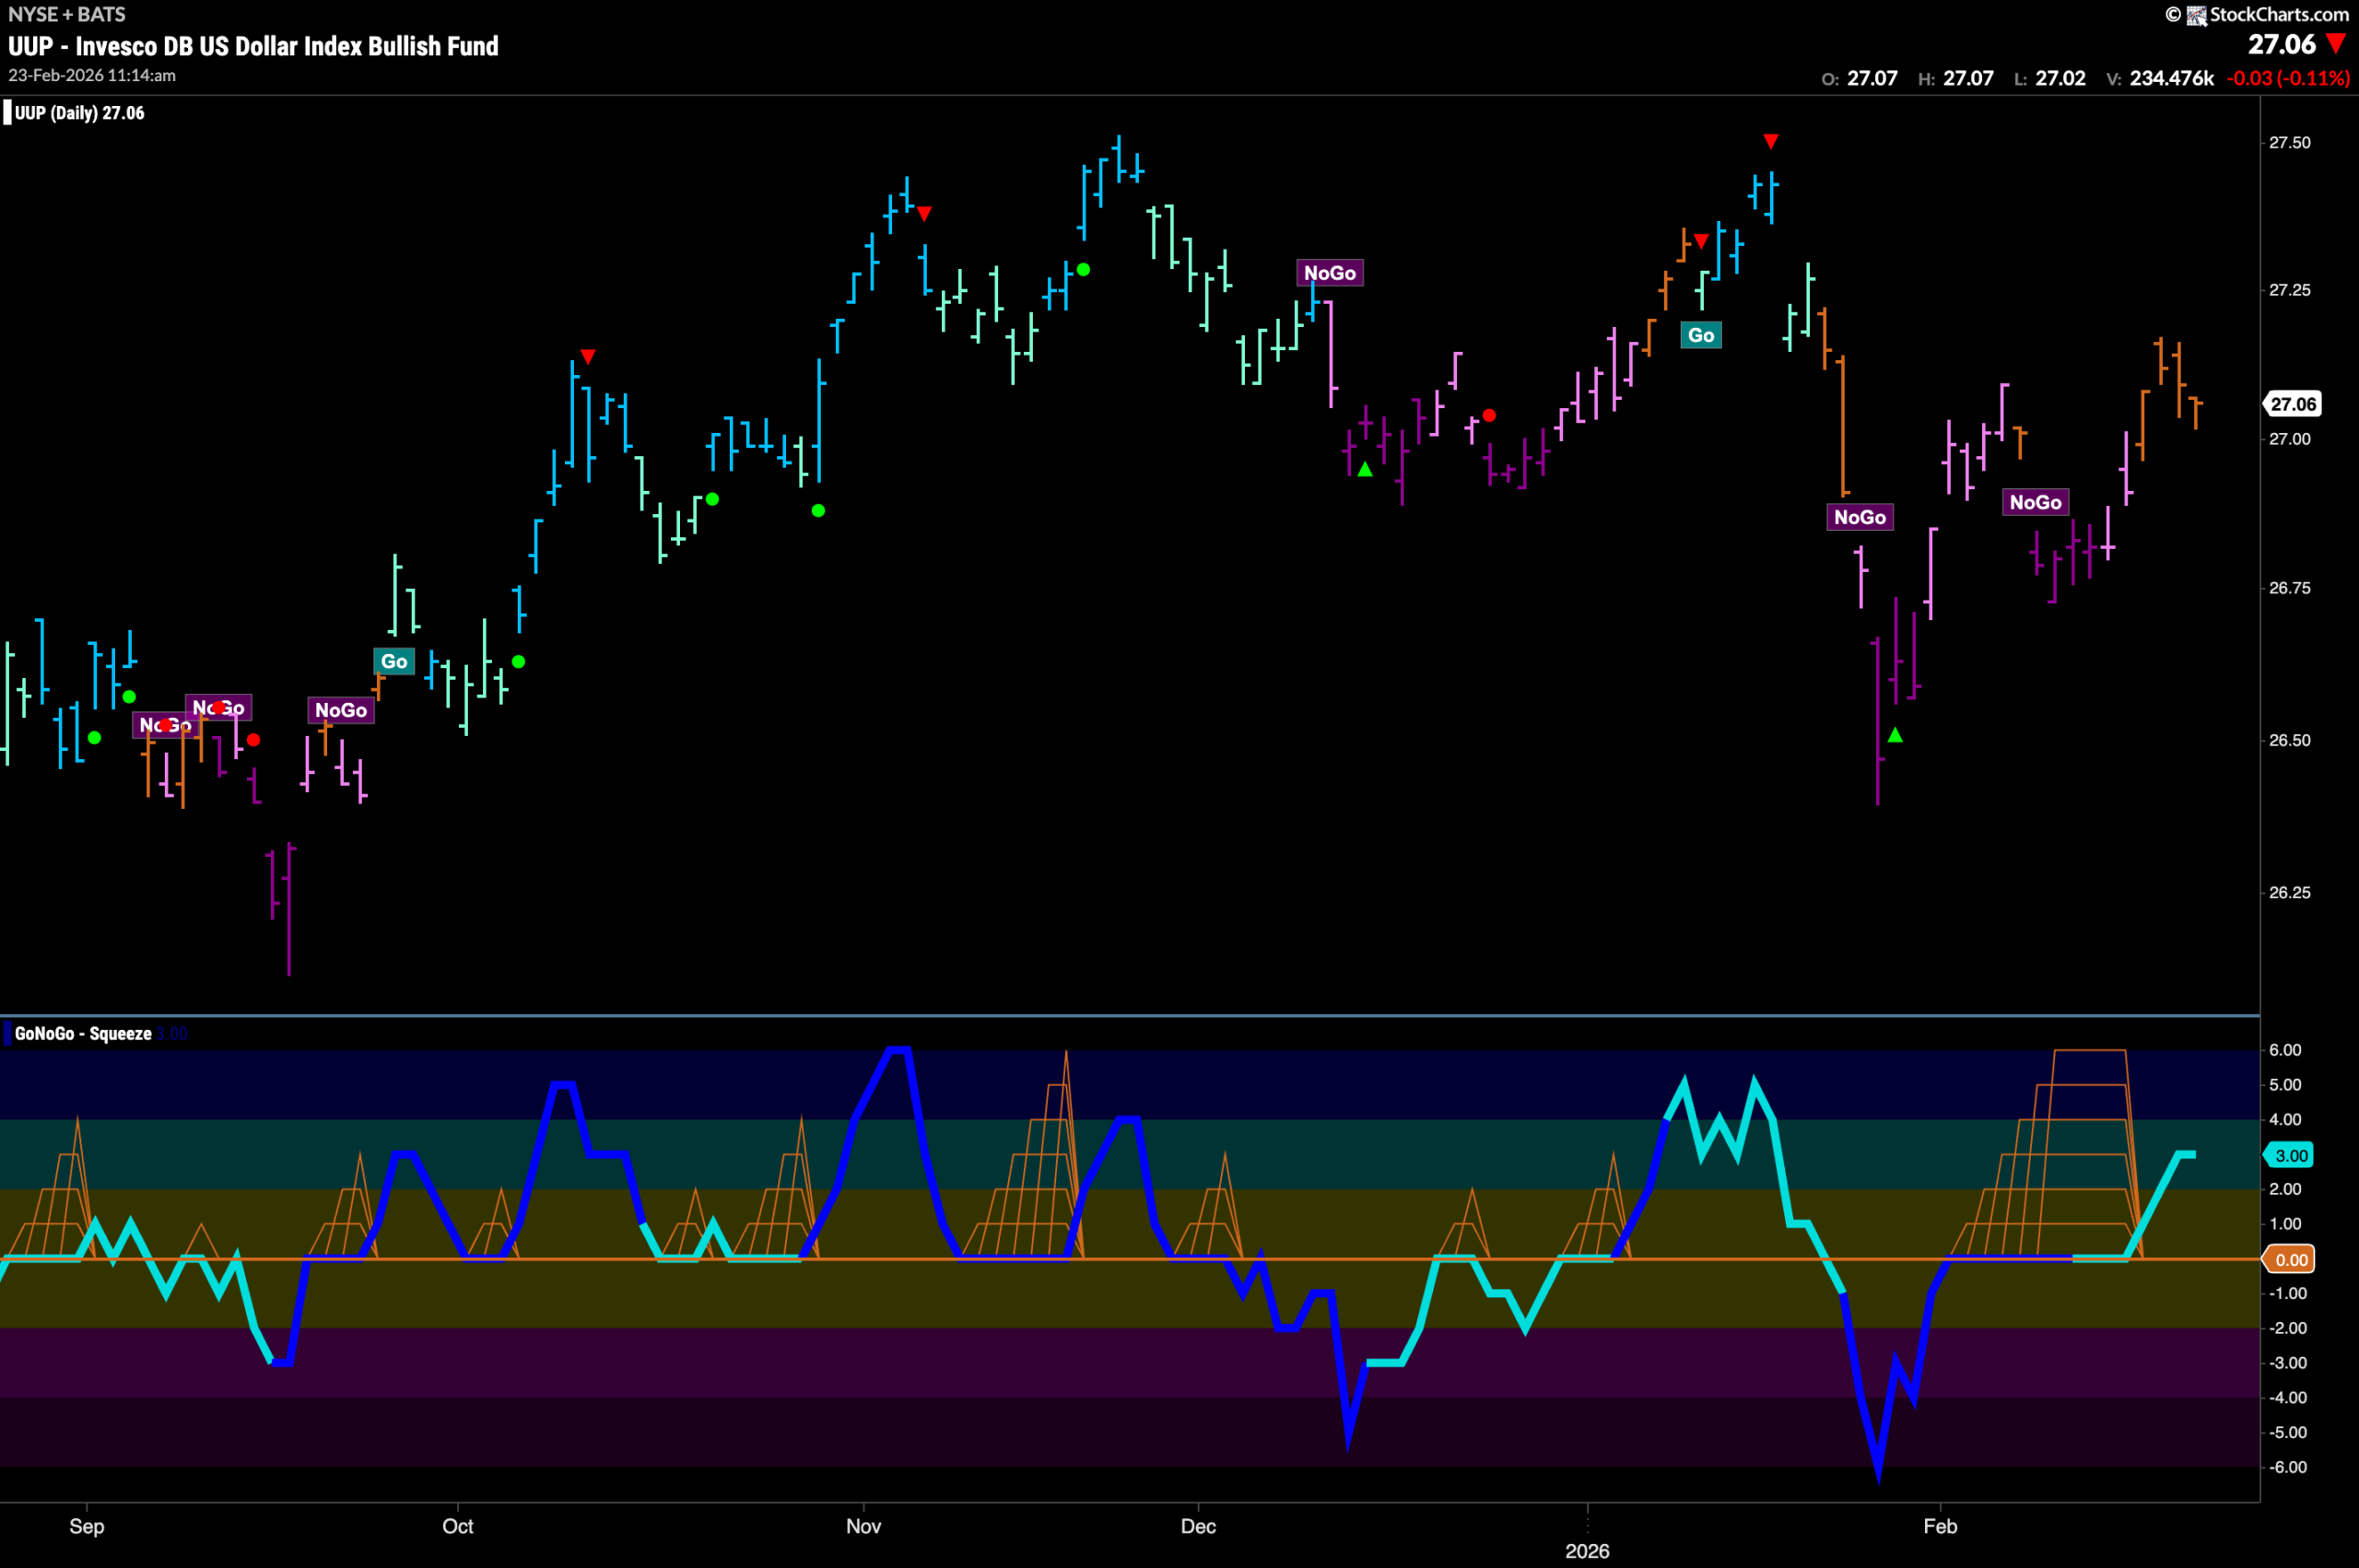
The chart below shows that the dollar has displayed a great deal of uncertainty over the past week. Having rallied out of the “NoGo” trend we see that price has set a higher intermediate high. Price has fallen since, and the market is unsure of the greenback’s next direction as it paints amber “Go Fish” bars. If we turn our attention to the oscillator panel for clues, we see that it has broken out of an extended Max GoNoGo Squeeze into positive territory and is now at a value of 3.
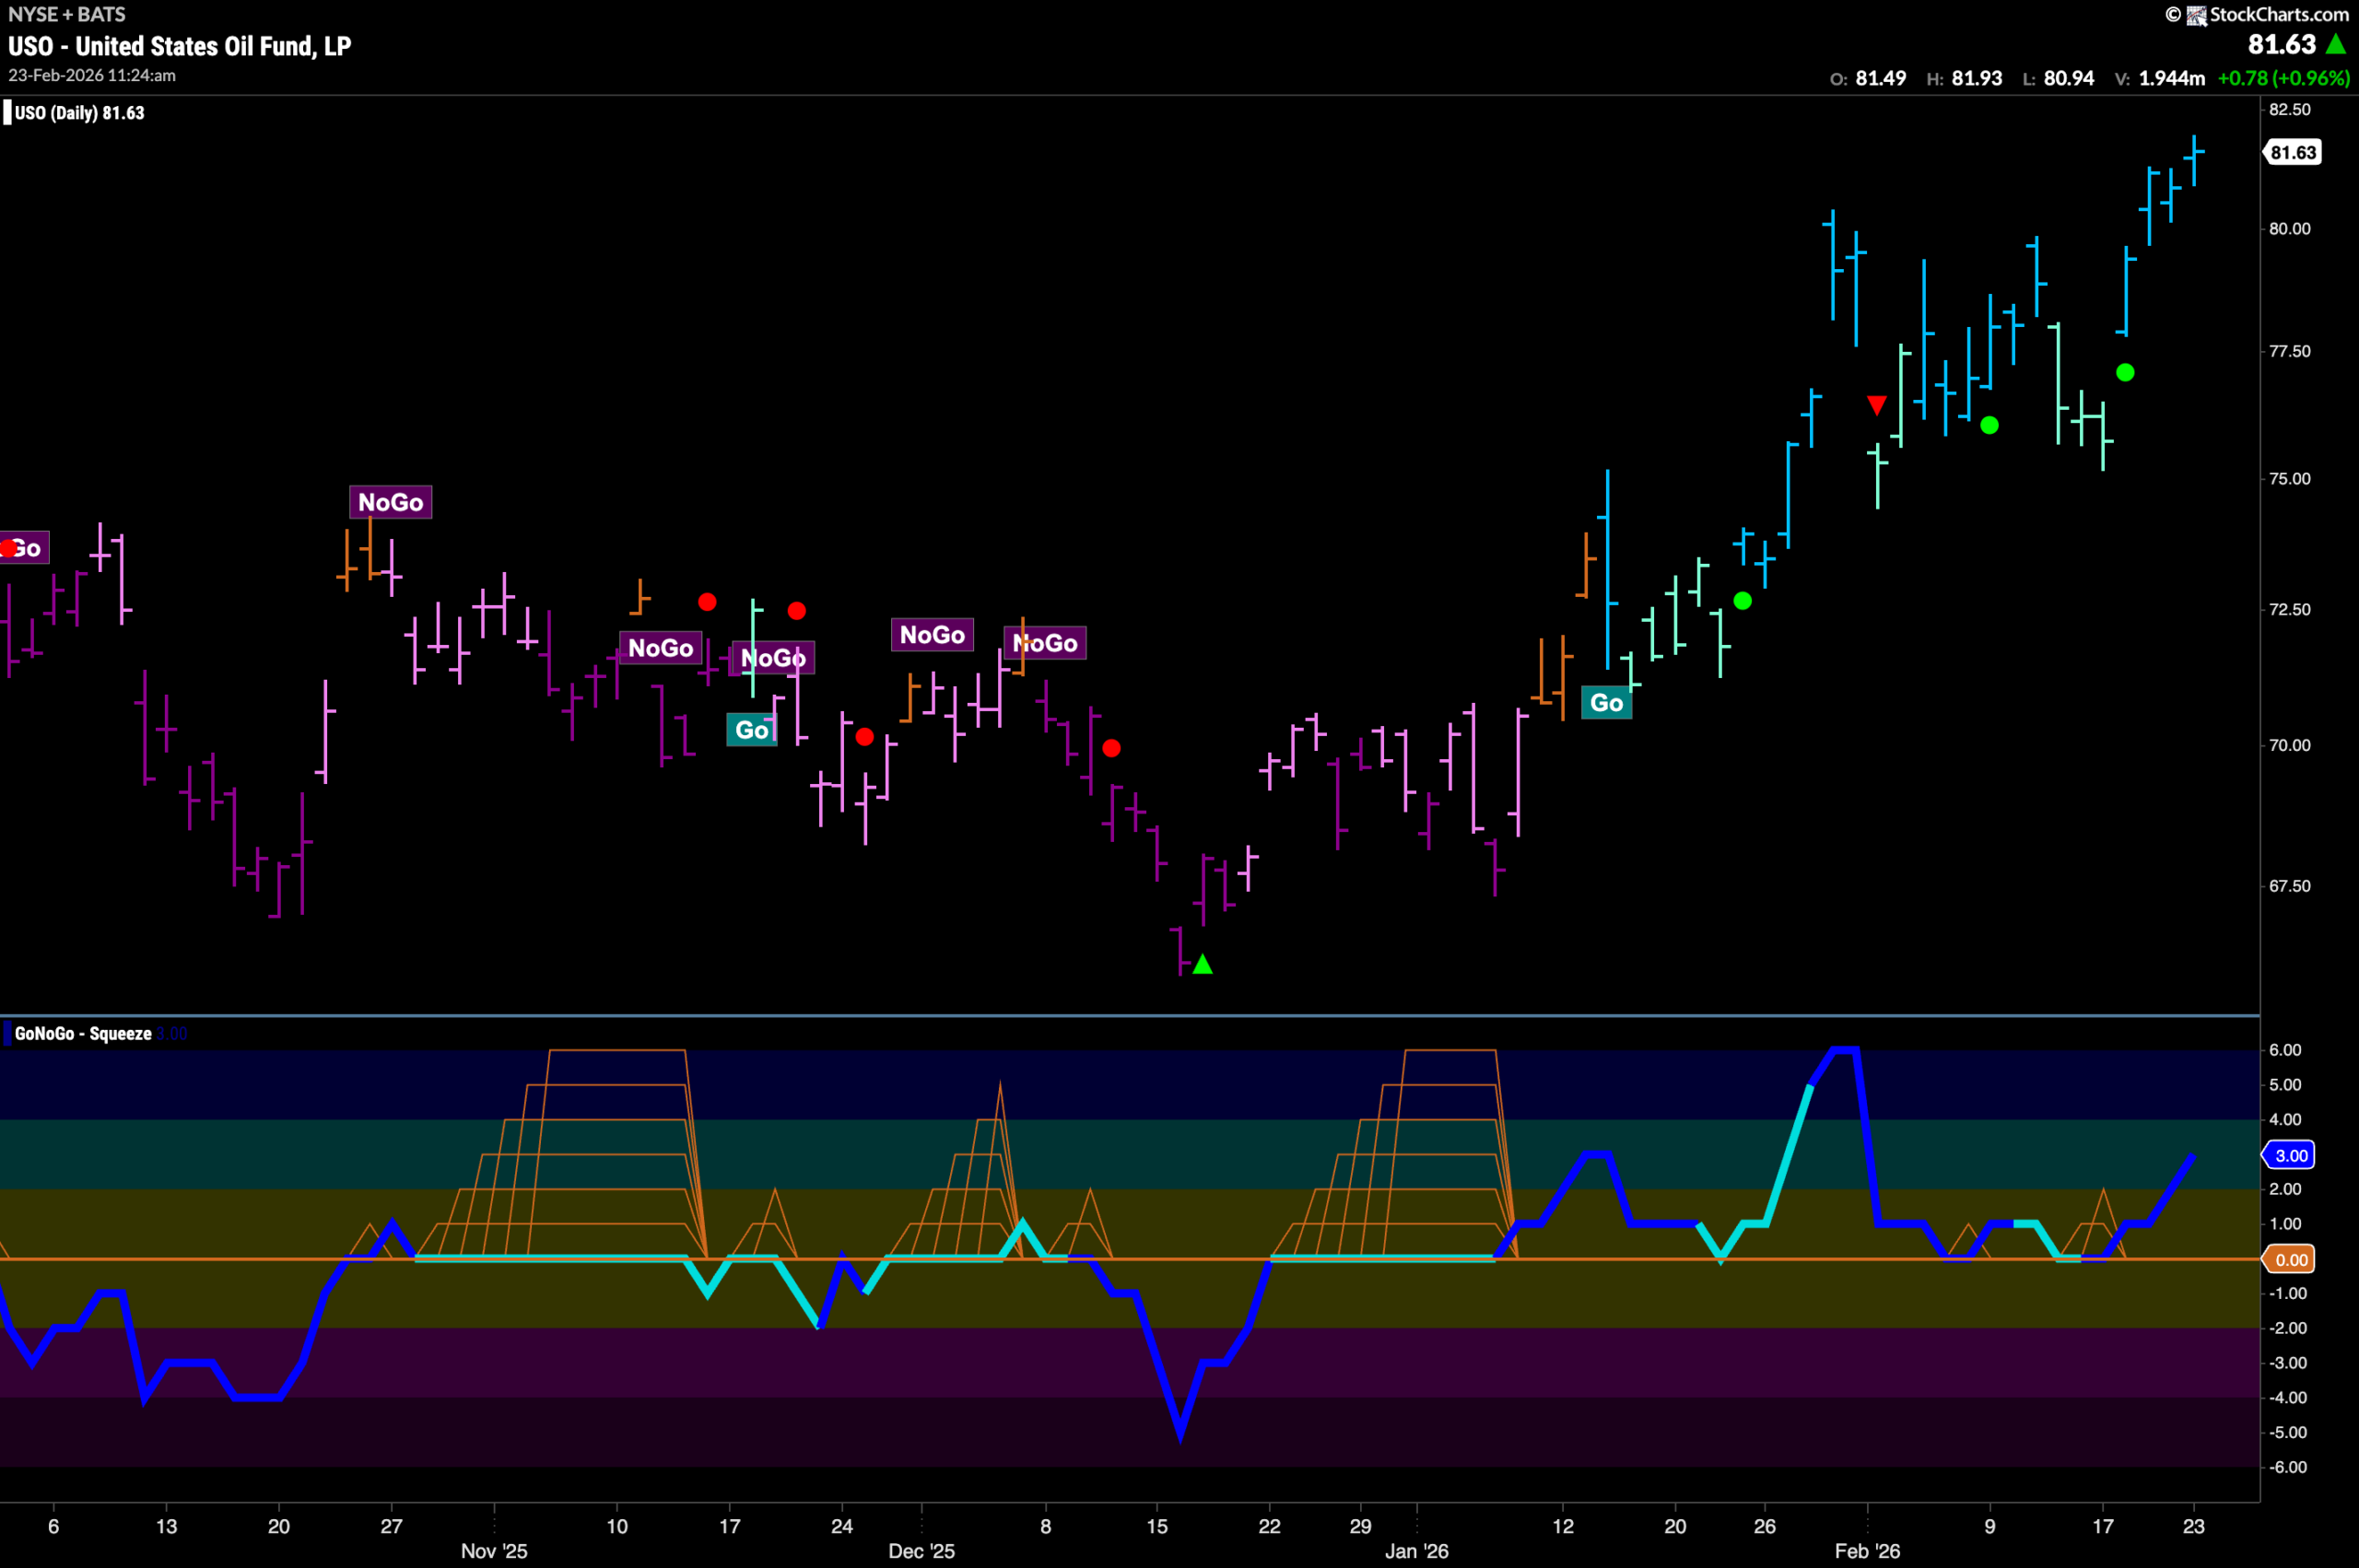
Oil Remains in “Go” Trend Hitting New Highs
GoNoGo Trend shows that the “Go” trend remained in place and indeed strengthened this week after strong blue bars pushed price to new higher highs. This comes after GoNoGo Oscillator found support again at the zero line giving us a Go Trend Continuation Icon (green circle). With momentum therefore resurgent in the direction of the trend, this gave price the boost it needed to climb to a new high on heavy volume.
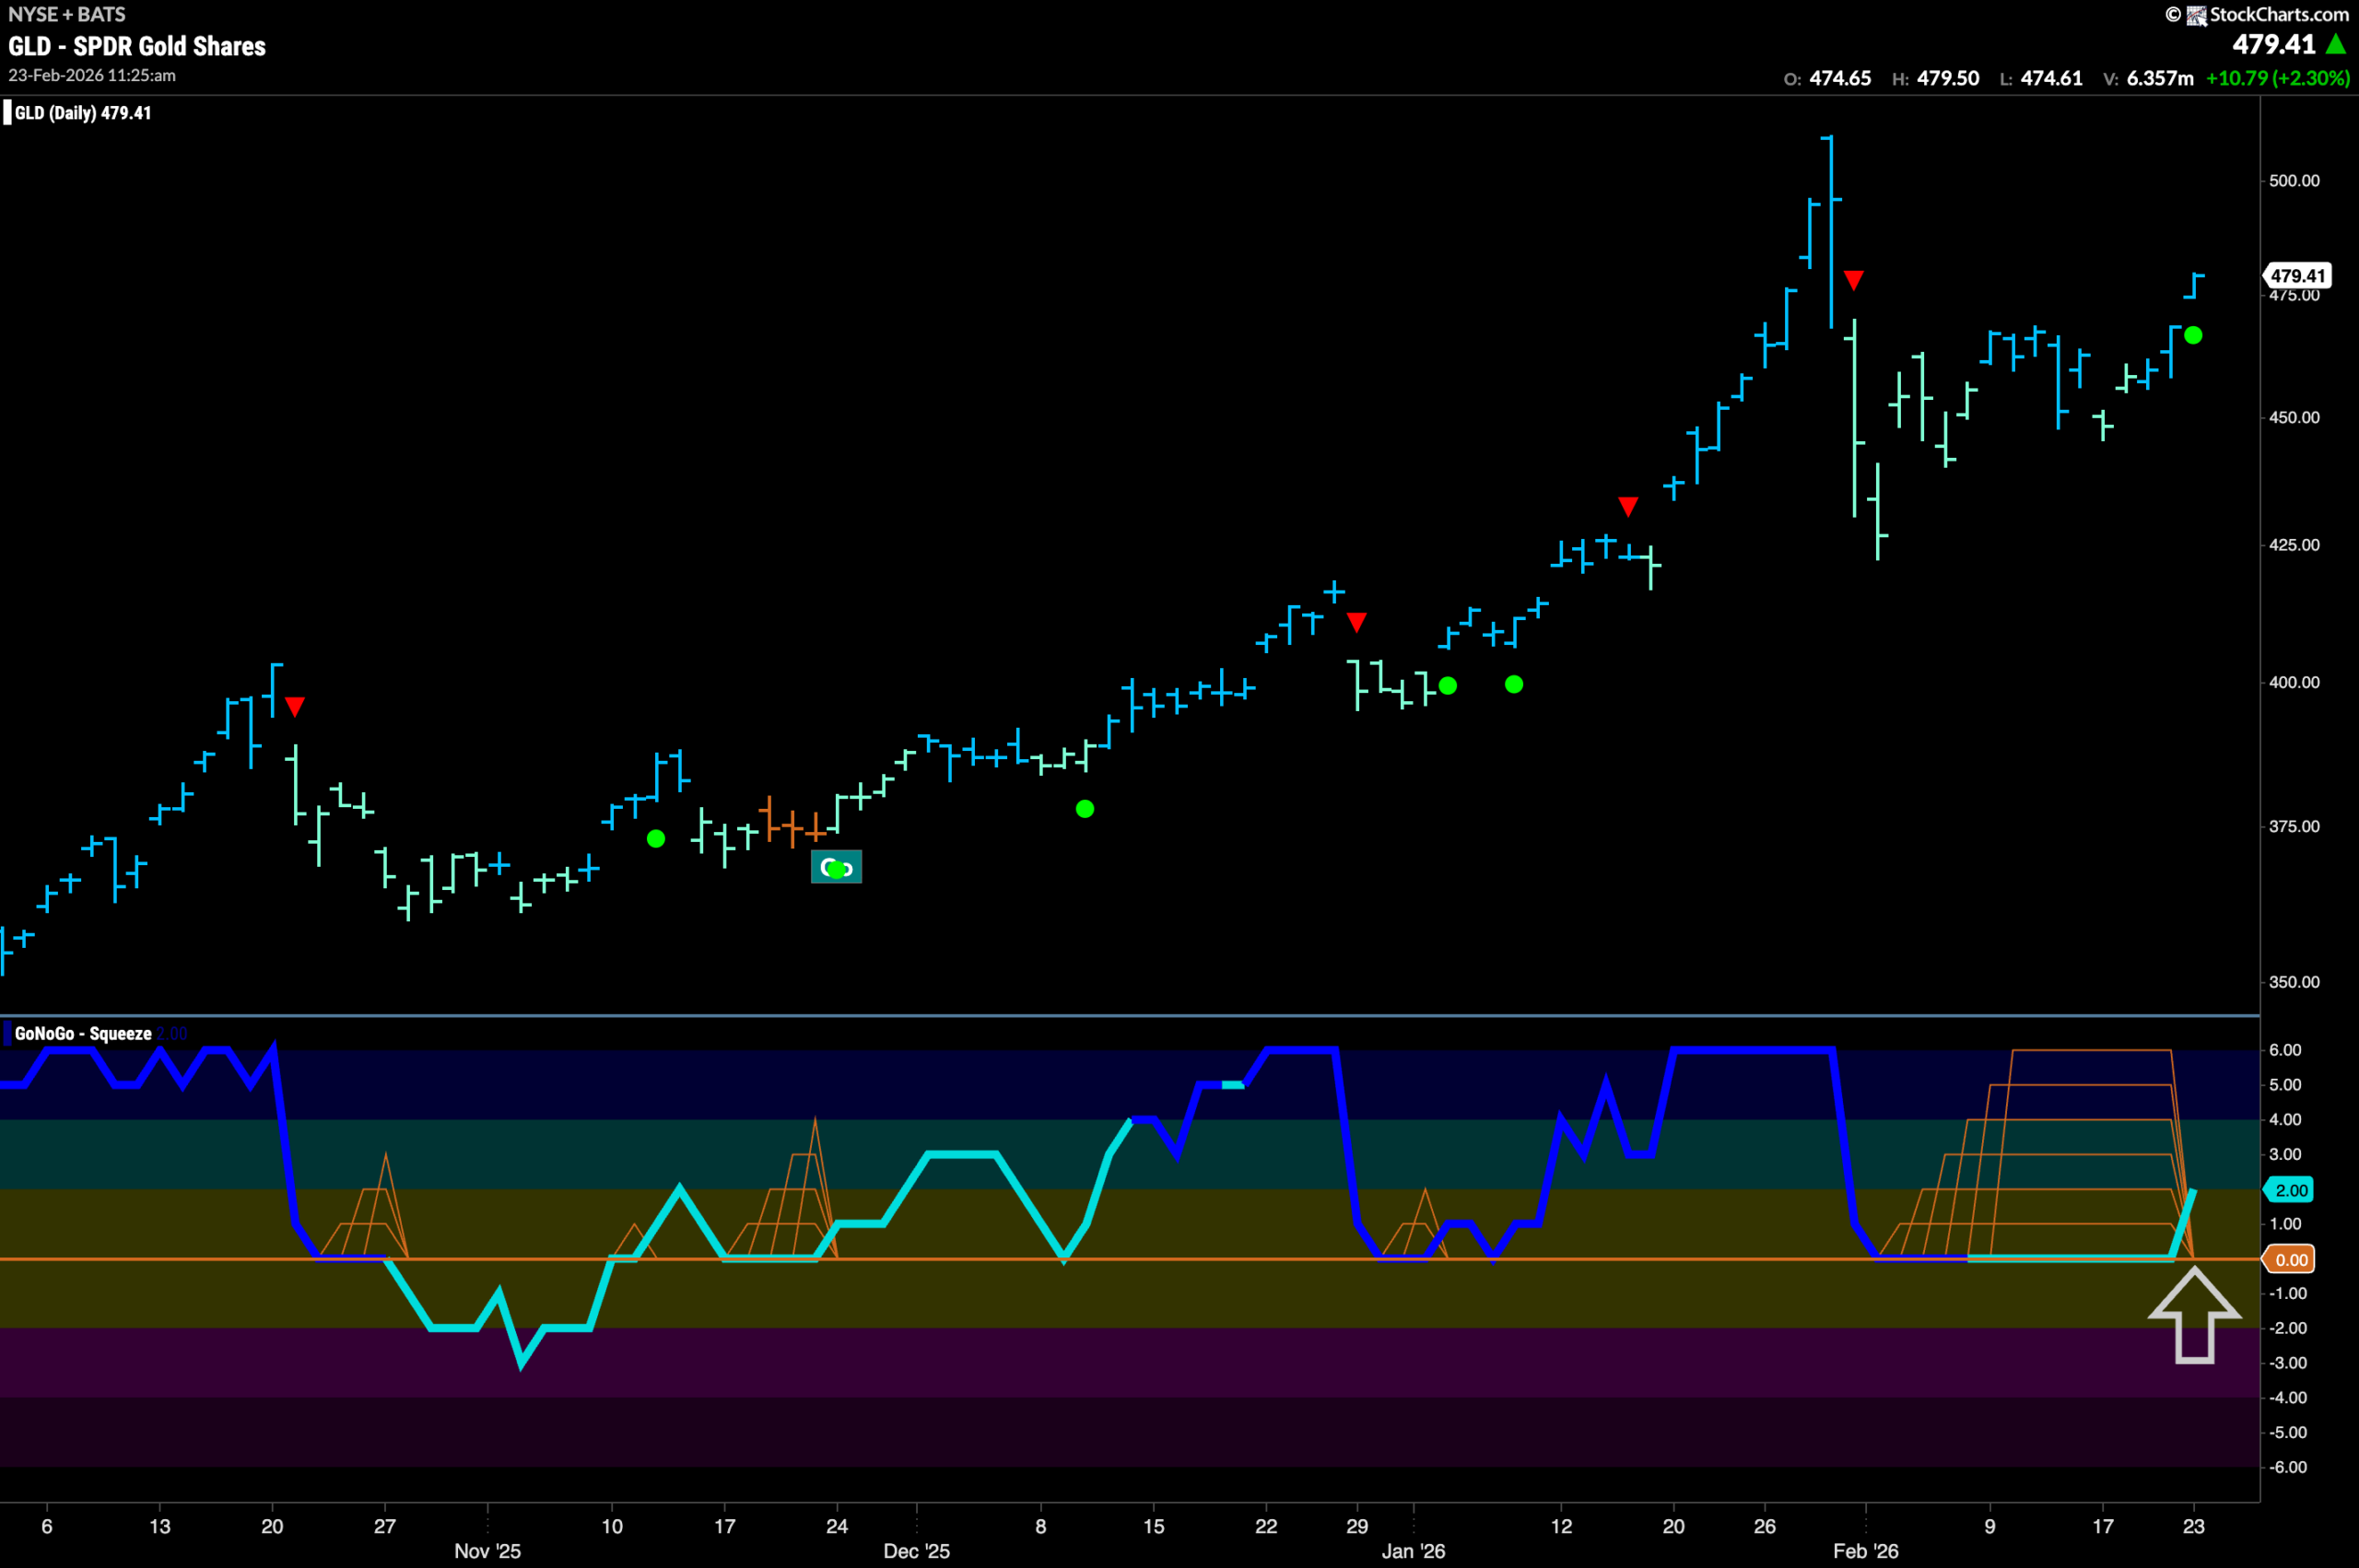
Gold Sees Go Trend Continuation
The trend in Gold remained in place this week as the GoNoGo Trend indicator painted more strong blue “Go” bars as price climbed to a new high. This comes as GoNoGo Oscillator is breaking out of an extended Max GoNoGo Squeeze into positive territory. This tells us that momentum is resurgent in the direction of the “Go” trend and we see a Go Trend Continuation Icon (green circle) under price. The “Go” trend is healthy in the precious metal.
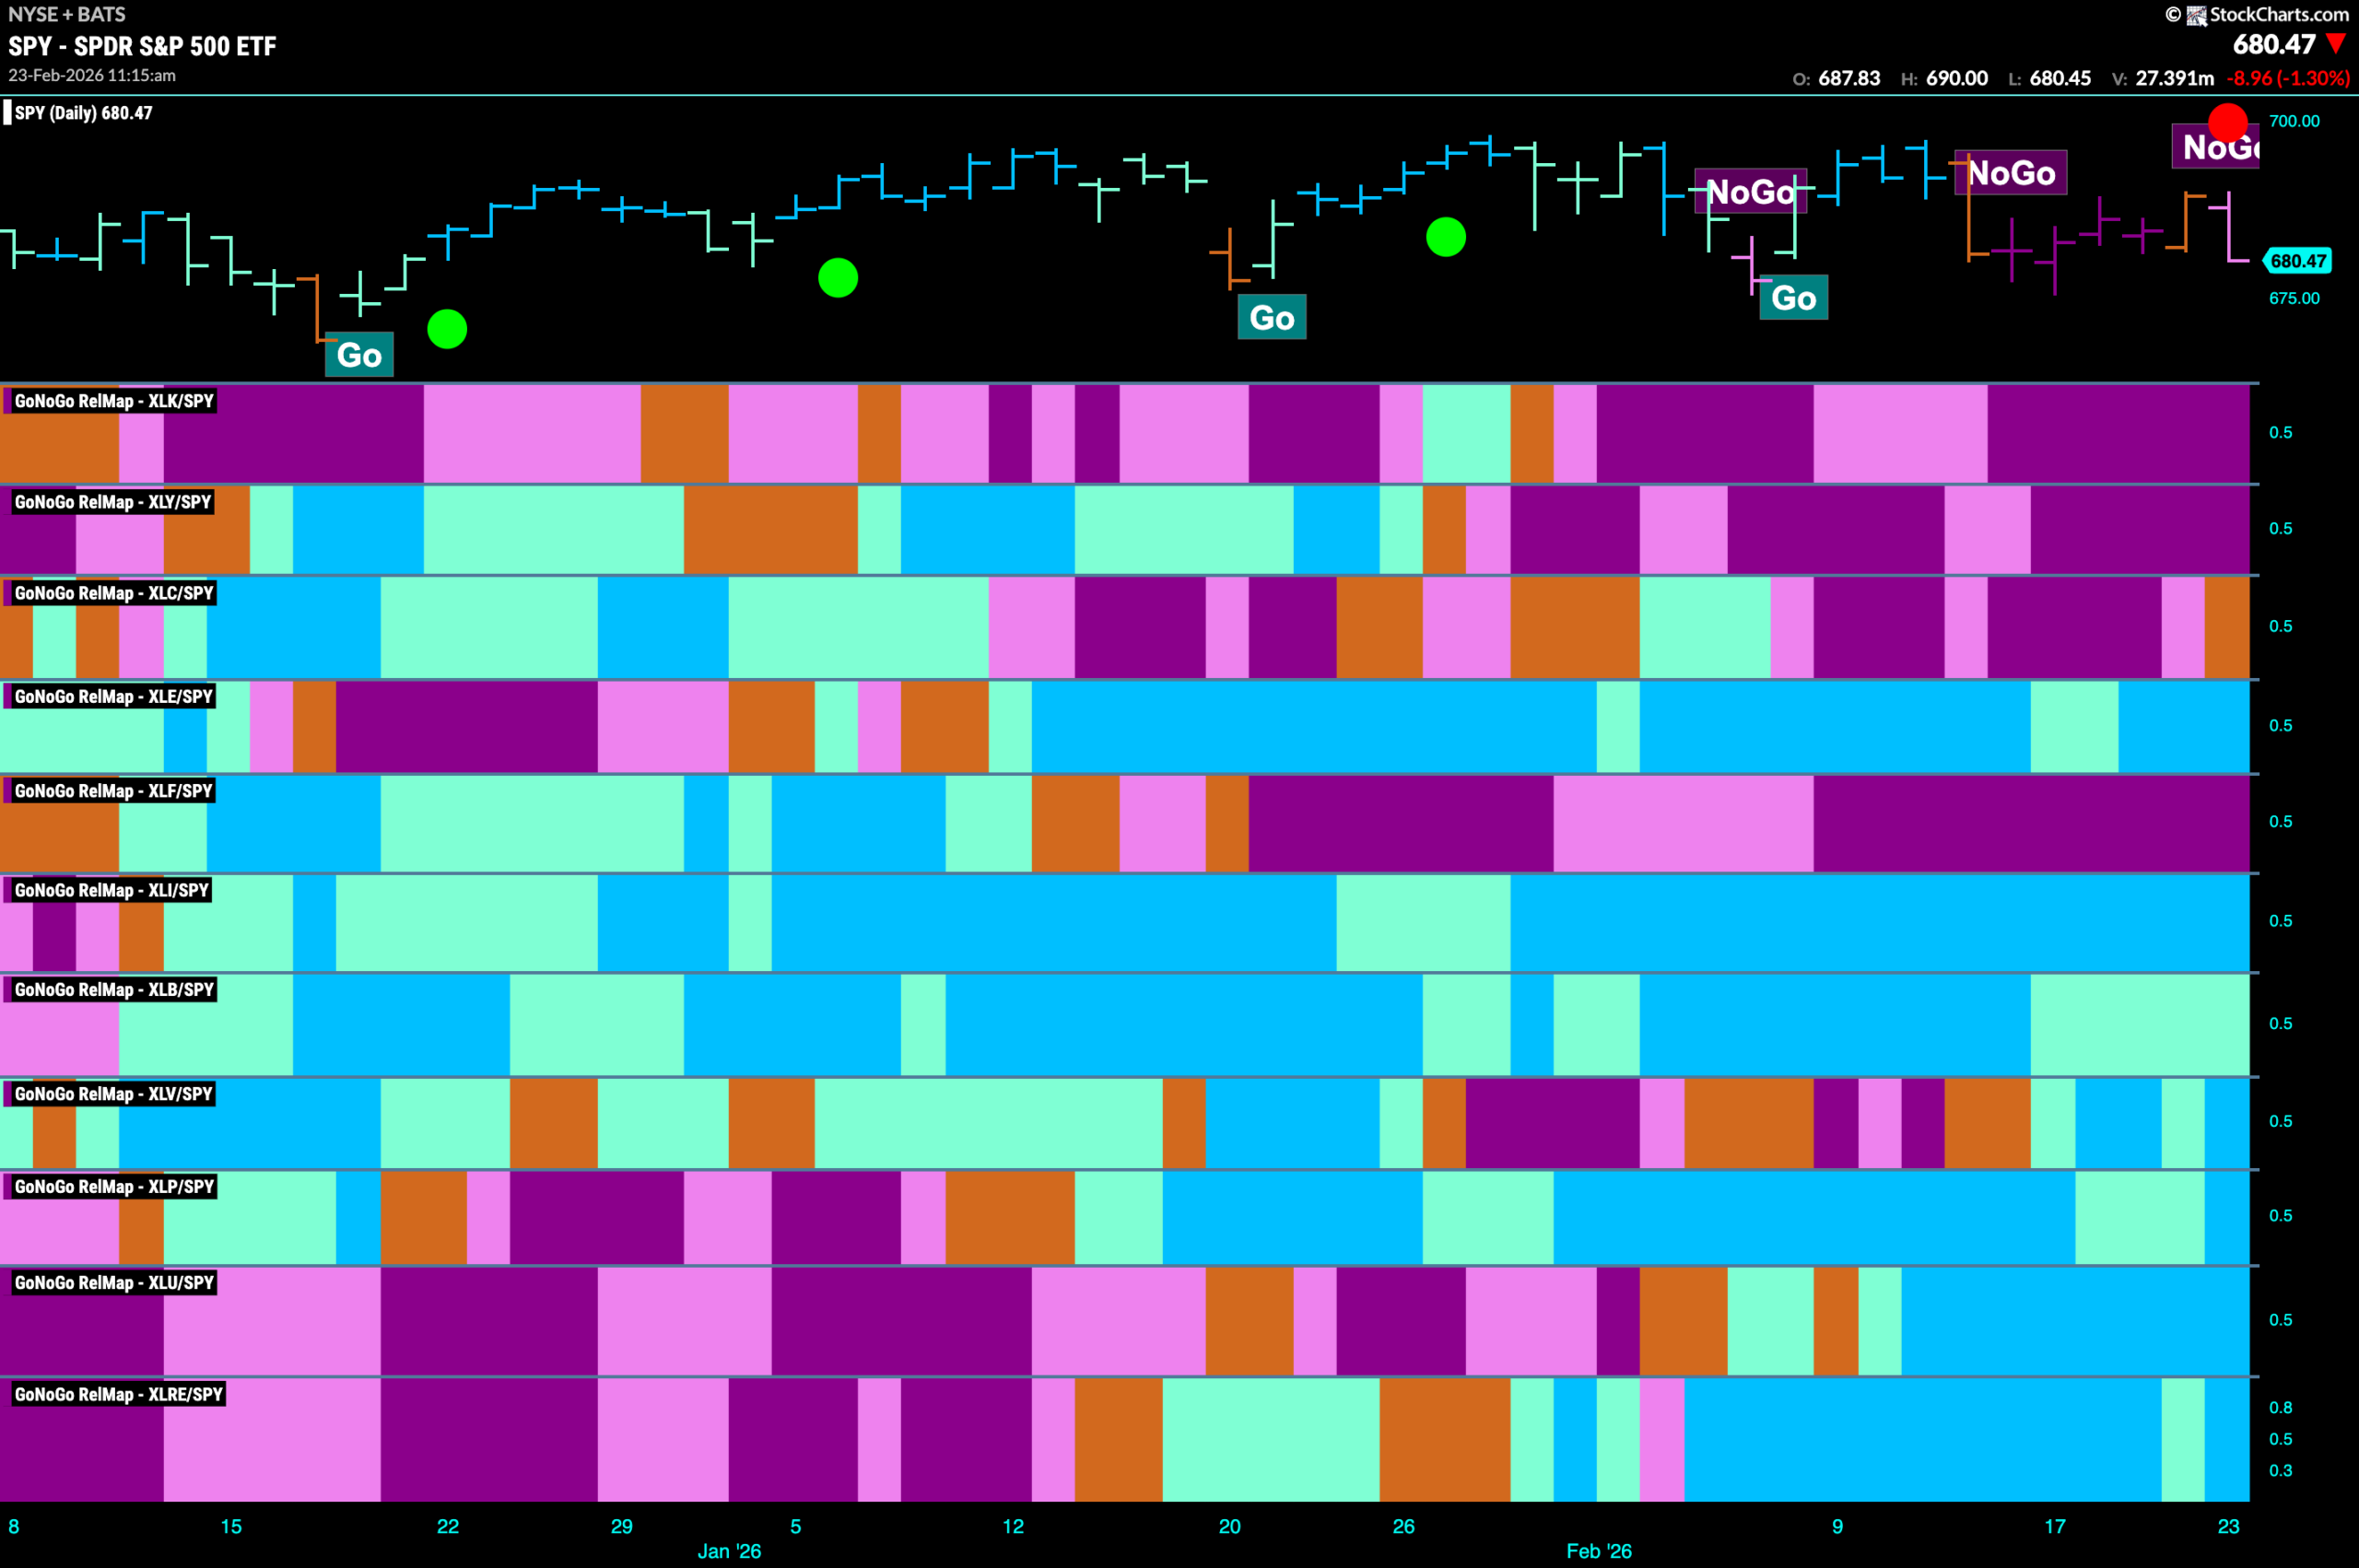
Sector RelMap
Below is the GoNoGo Sector RelMap. This GoNoGo RelMap applies the GoNoGo Trend to the relative strength ratios of the sectors to the base index. With this view we can get a sense of the relative out performance and relative underperformance of the sectors. 7 sectors are in relative “Go” trends. $XLE, $XLI, $XLB, $XLV, $XLP, $XLU, and $XLRE are painting relative “Go” bars.
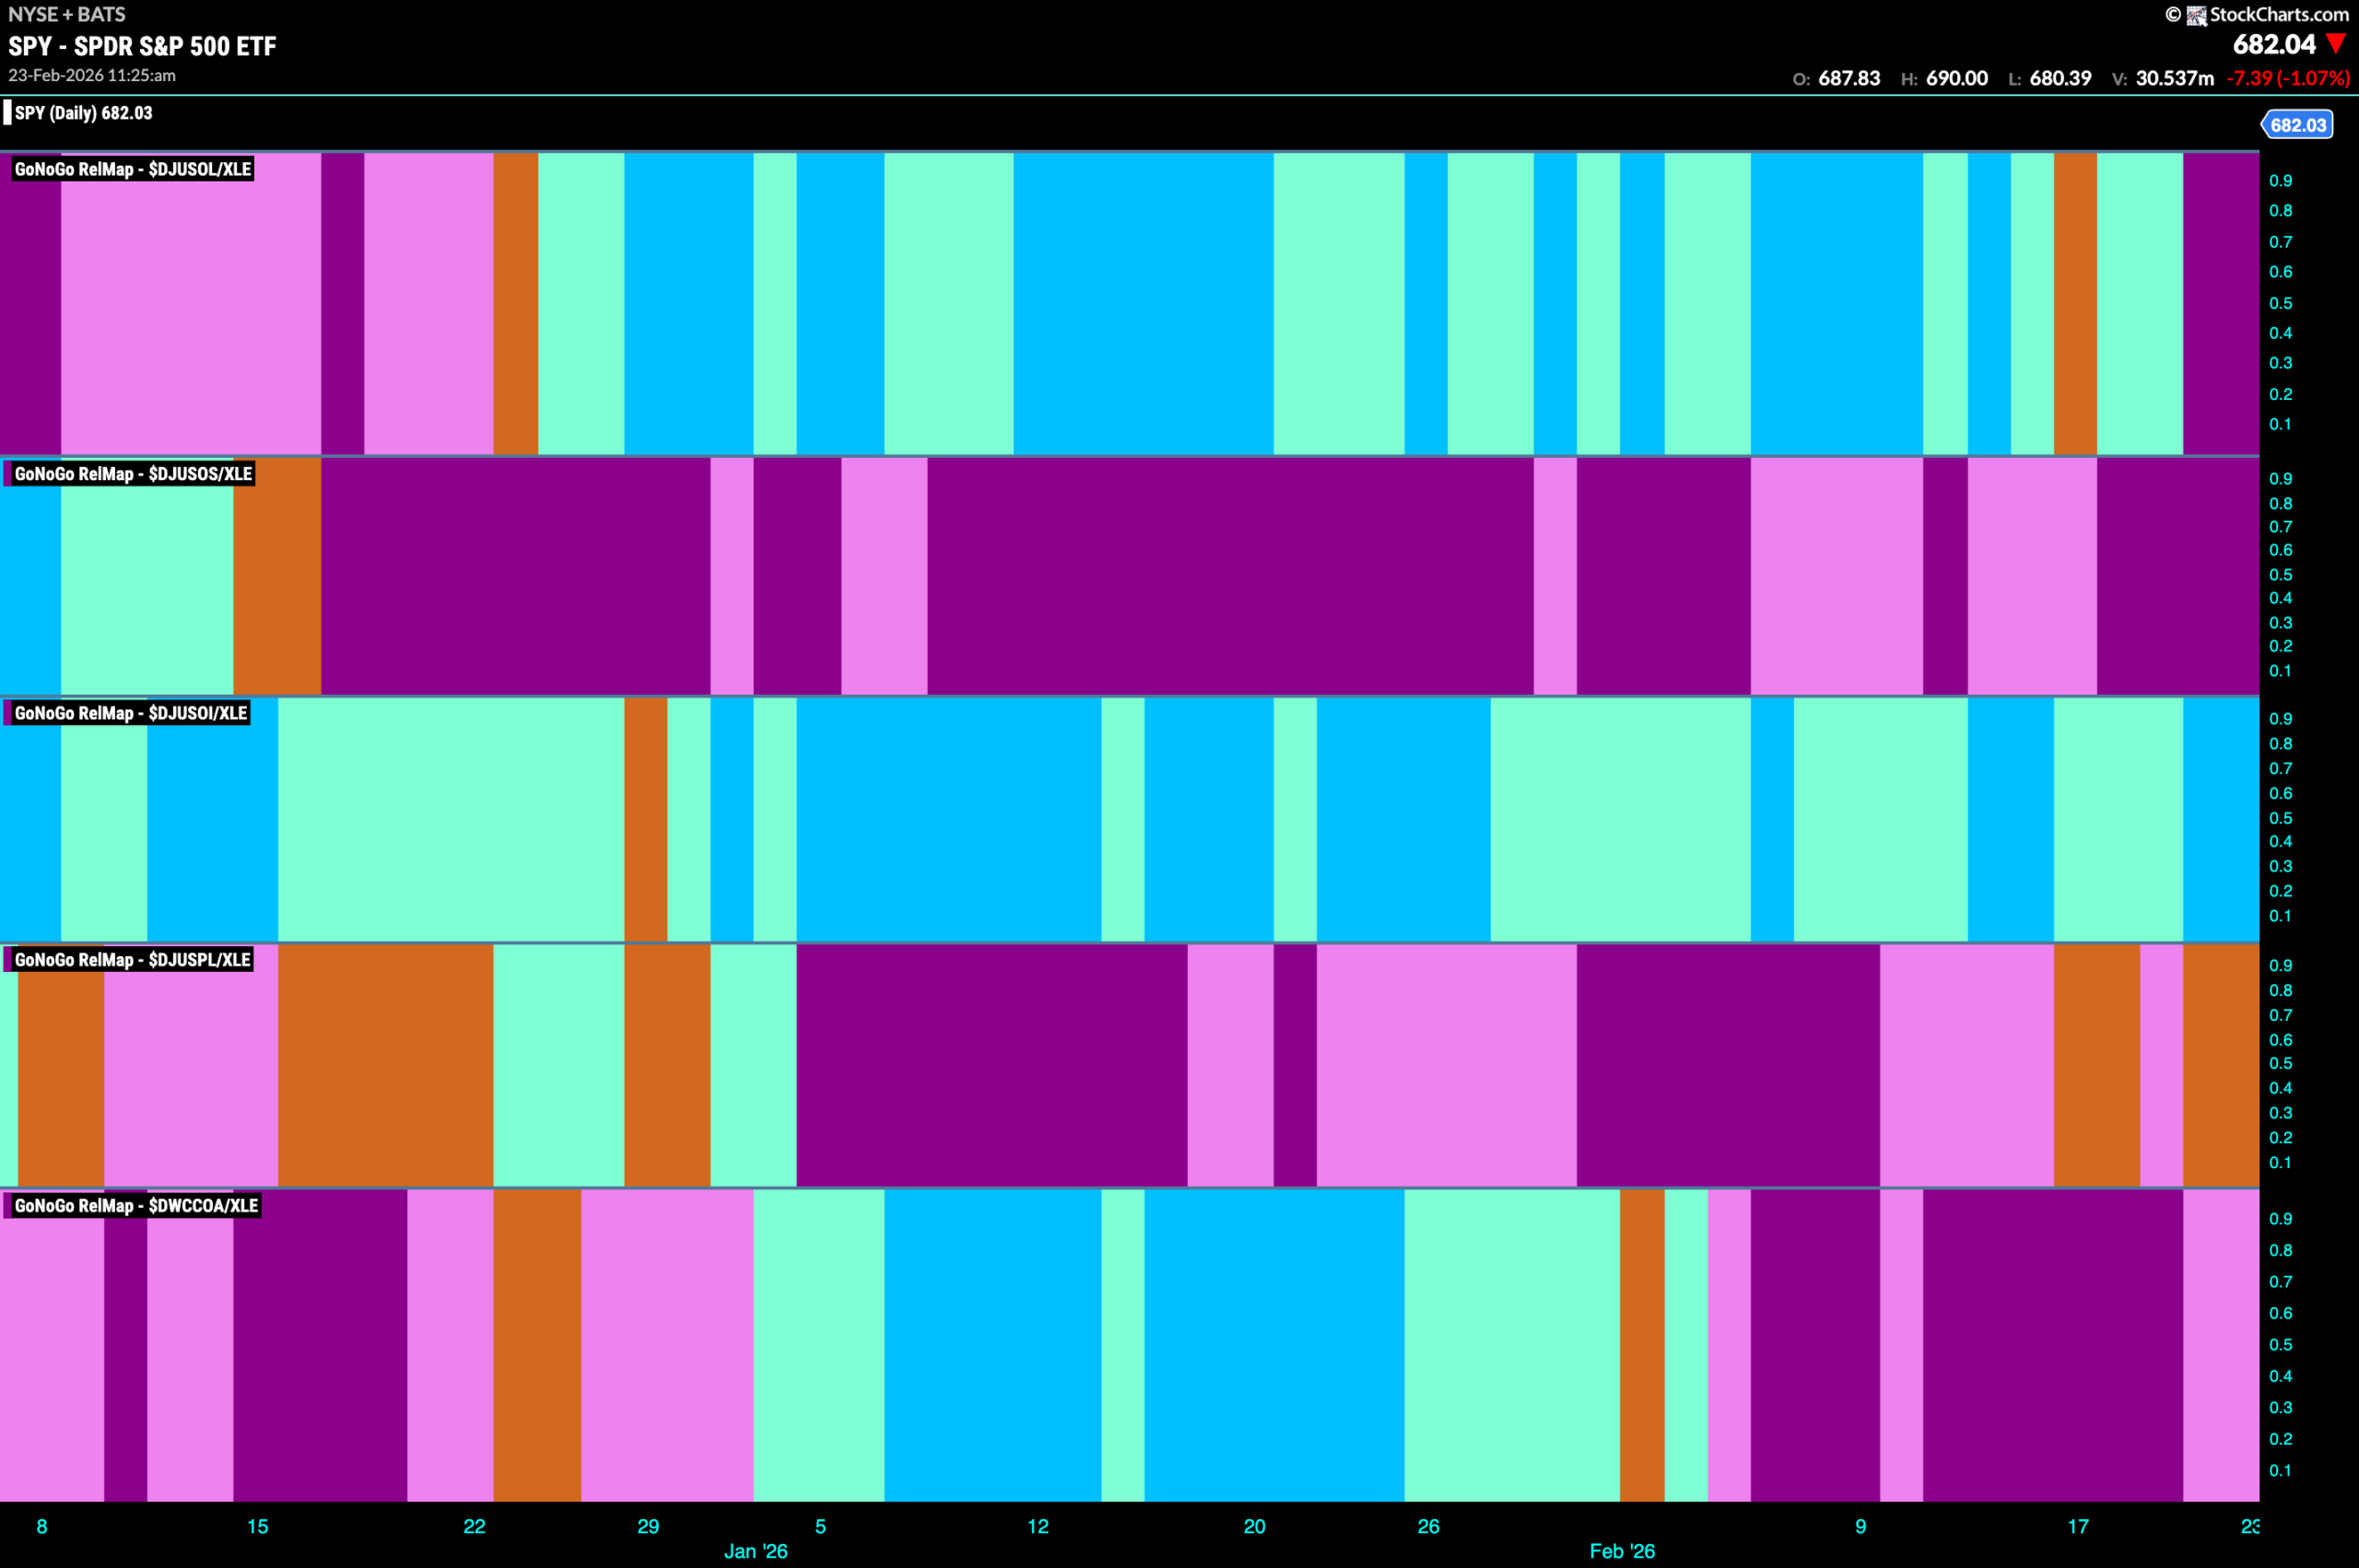
Energy Sub-Group RelMap
The chart below shows a relative trend breakdown of the sub groups within the energy sector again this week. The Sub-Group RelMap plots the GoNoGo Trend of each sub index to the $XLE. We saw in the above GoNoGo Sector RelMap that $XLE continues to be an out-performing sector and paints strong relative “Go” bars. When we look at the below RelMap we can see that the oil and equipment index in the 3rd panel is painting strong blue “Go” bars on a relative basis.
$TTI Looks For Support in “Go” Trend
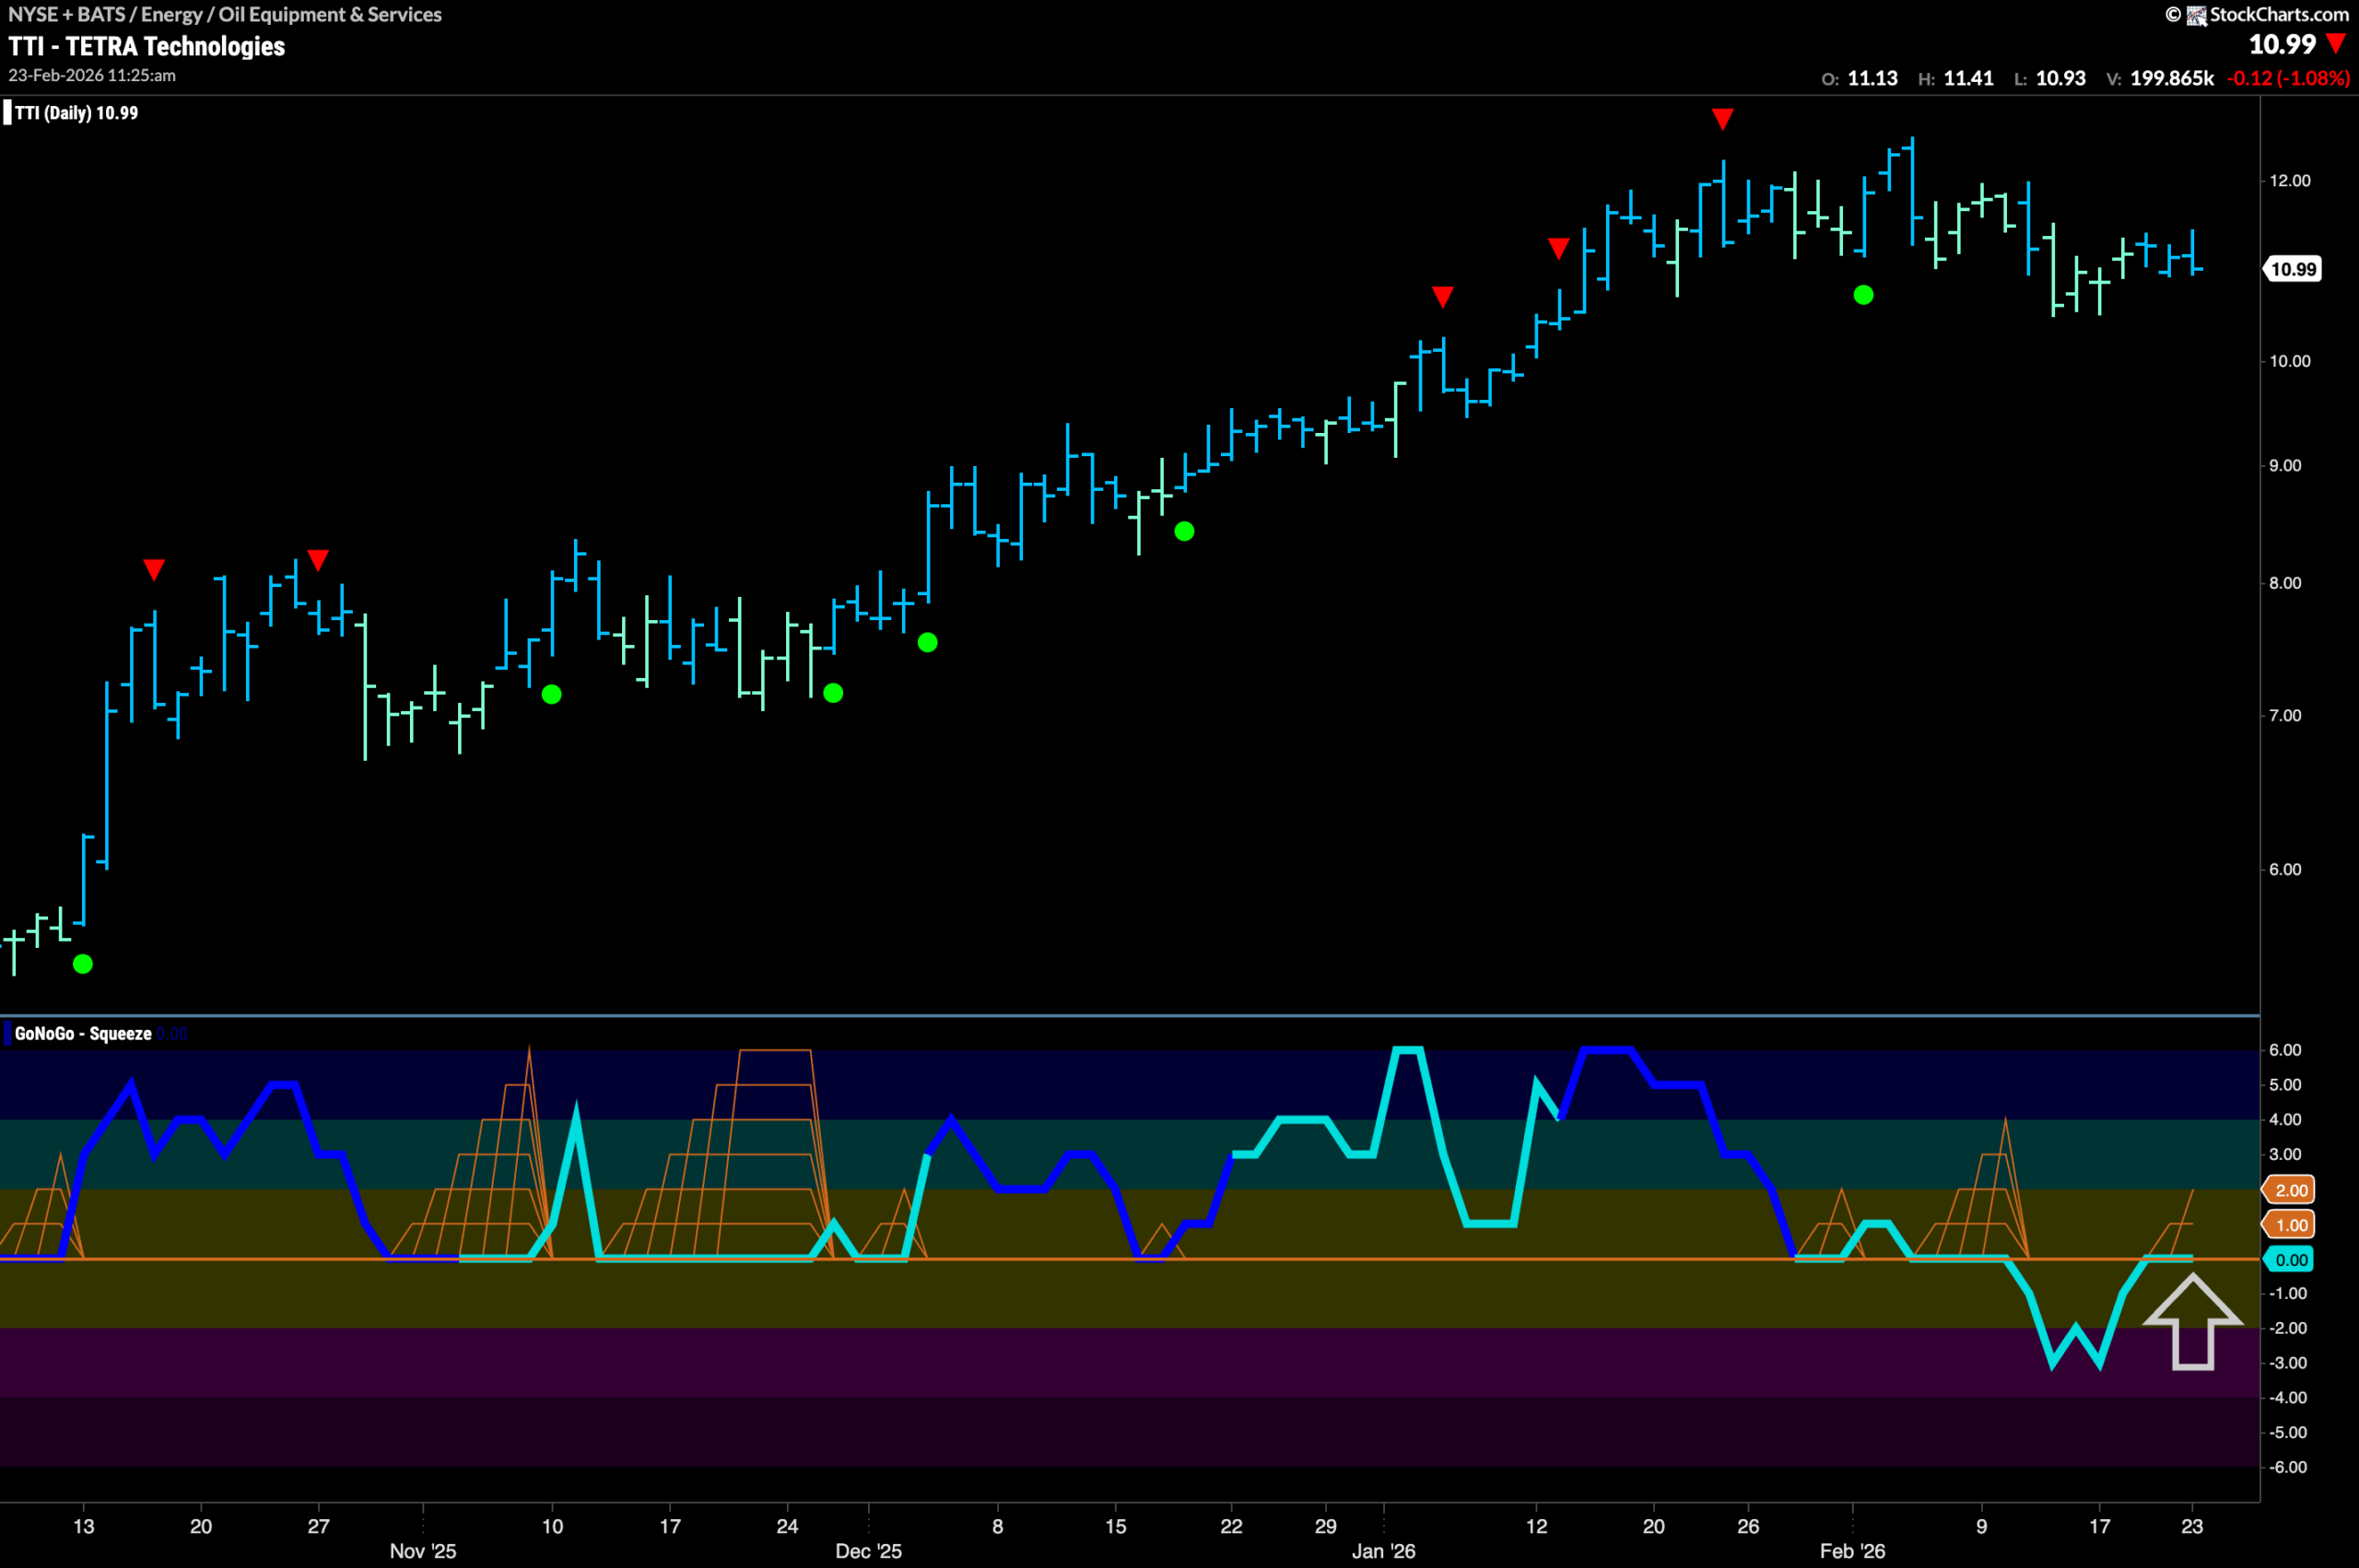
GoNoGo Trend shows that $TTI has been in a “Go” trend for some time. After a new high in early January, we saw a Go Countertrend Correction icon (red arrow) indicating that price may struggle to go higher in the short term. Indeed, we saw price move mostly sideways or slightly lower since then. GoNoGo Oscillator fell to test the zero line but eventually broke down into negative territory, further threatening the trend. Most recently, the oscillator is back at zero, and we will watch to see if it can regain positive territory. If it does, then we can expect price to make an attempt at another higher high.
$HP Finds Support and Looks for High
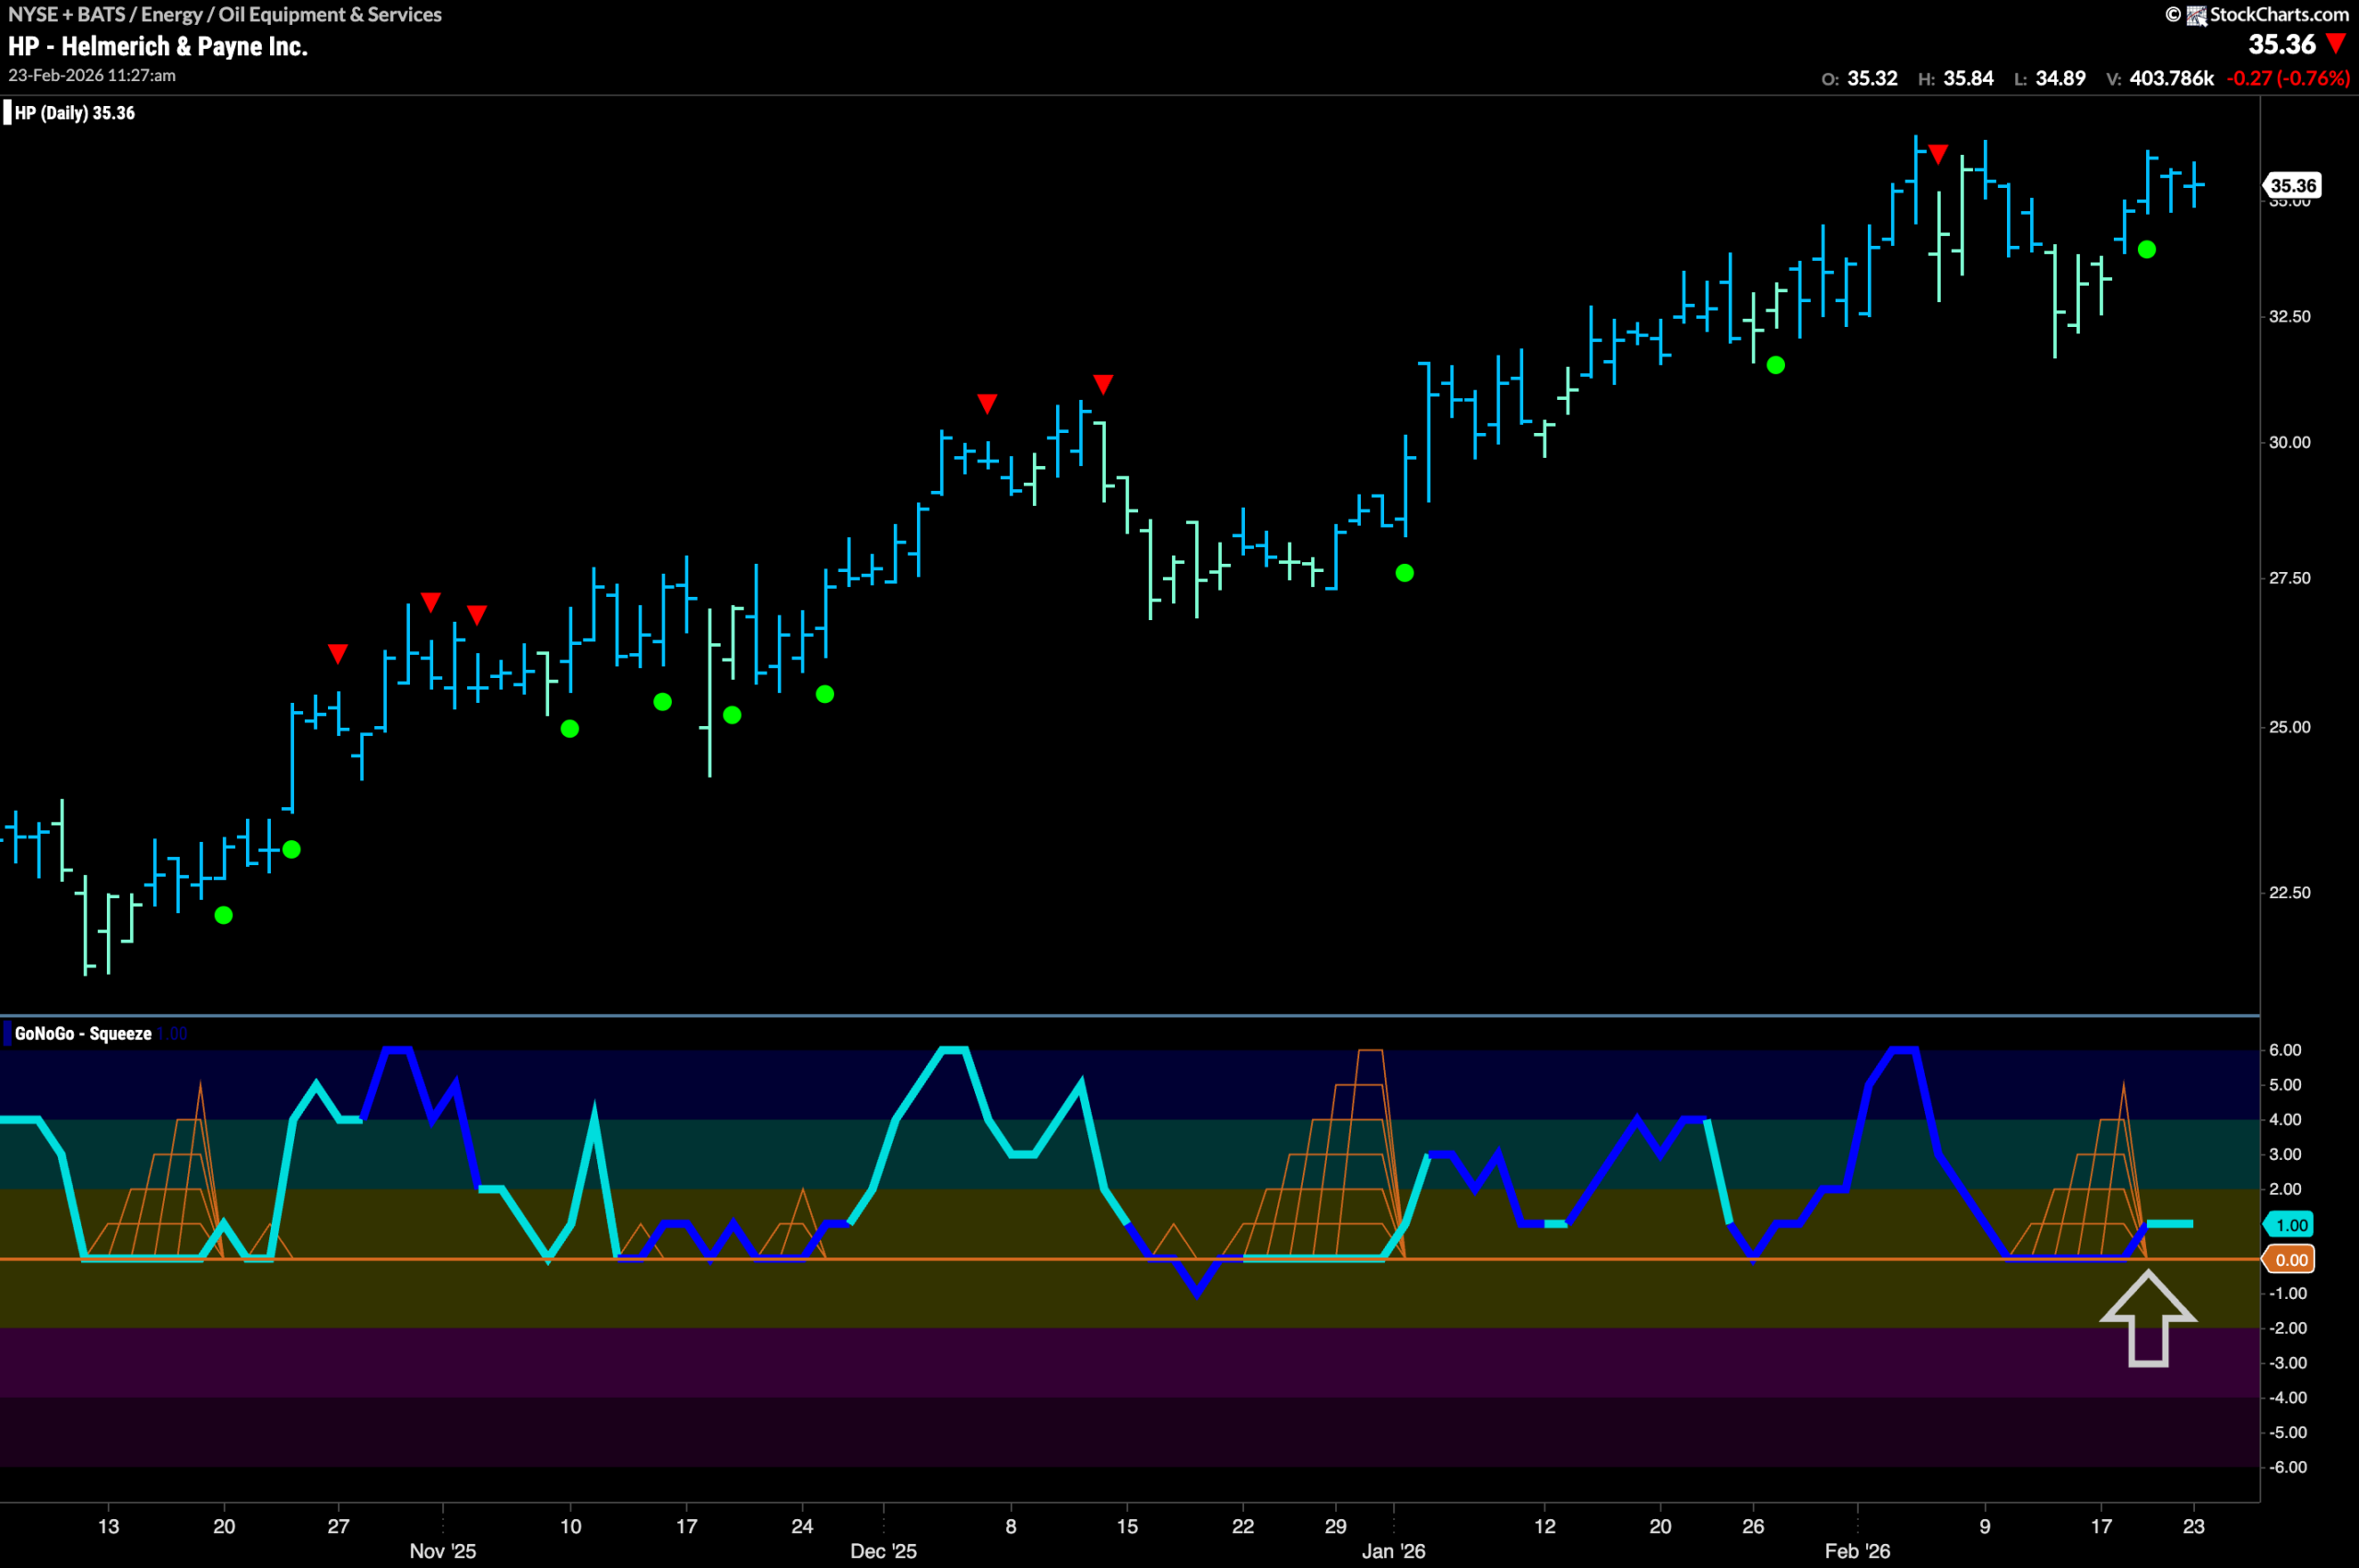
$HP has been in a “Go” trend for several months and we have seen a series of higher highs and higher lows as price has climbed to nearly $40. With a Go Countertrend Correction (red arrow) at the last high, we knew it would be a struggle for price to go higher in the short term. However, with GoNoGo Trend once again painting strong blue bars, we see that GoNoGo Oscillator has found support at zero, bouncing back into positive territory. With momentum therefore resurgent in the direction of the “Go” trend, we will look to see if price can climb to new higher highs this week.