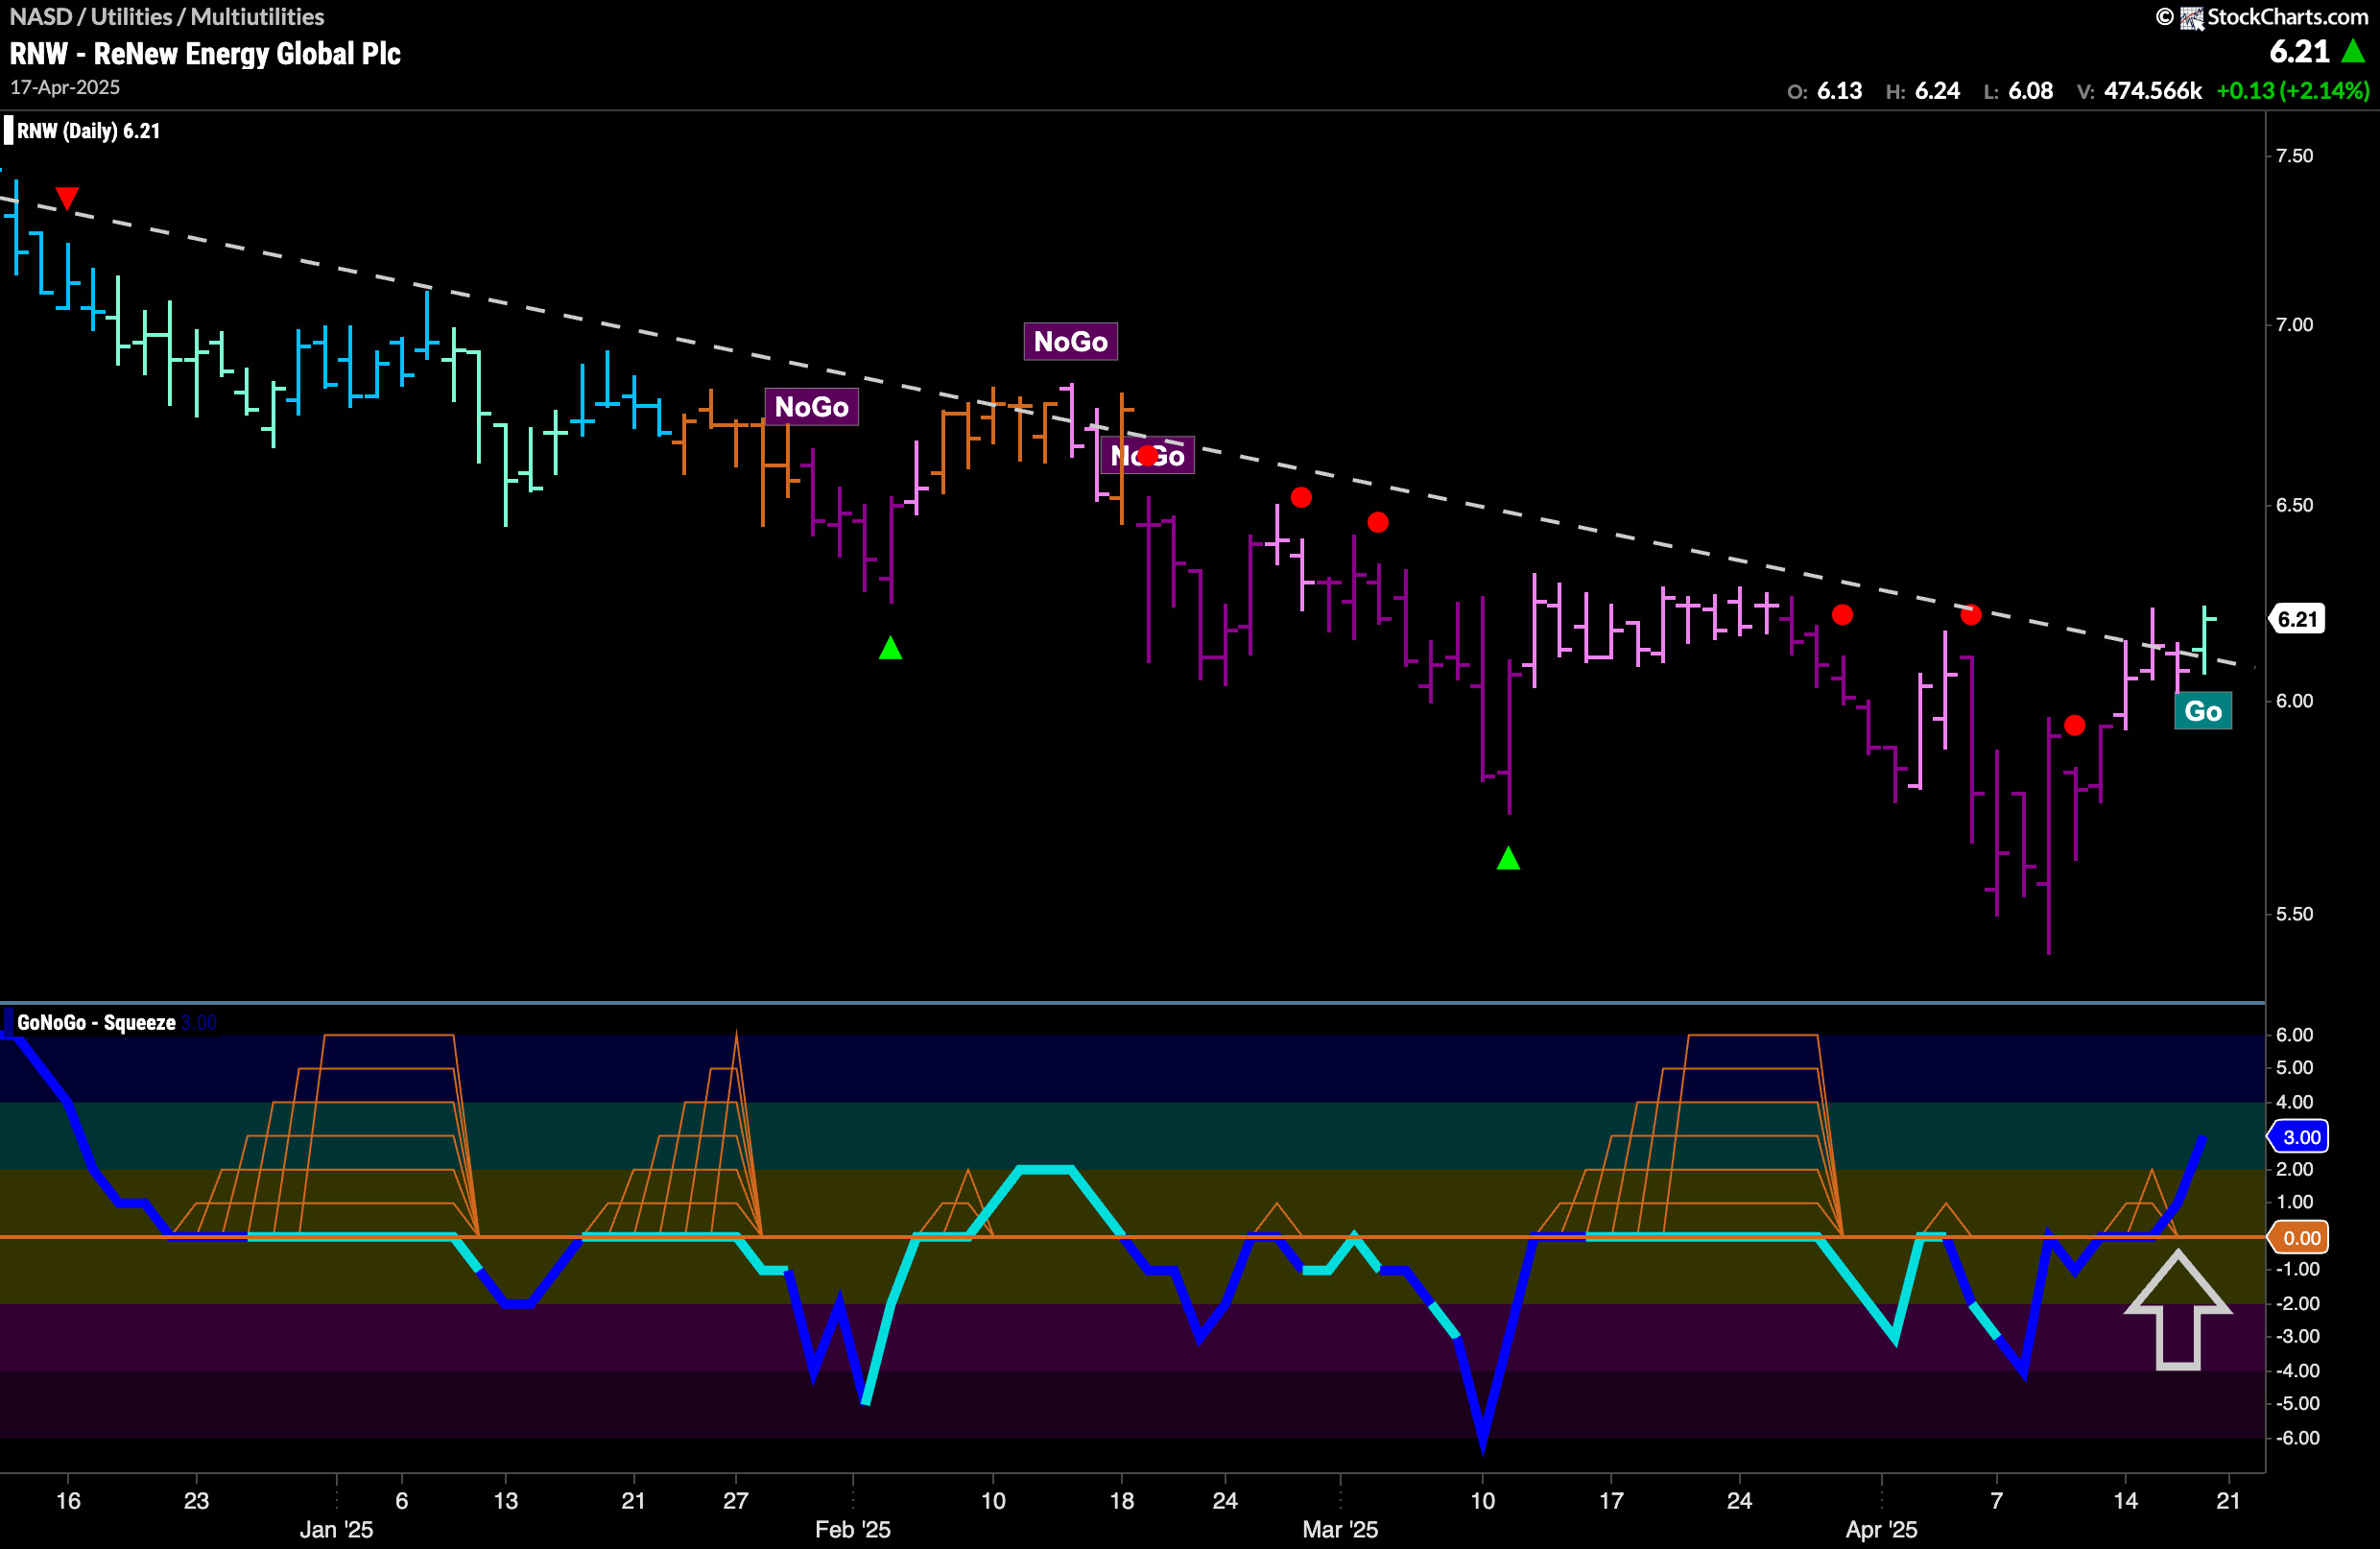
Good morning and welcome to this week’s Flight Path. The equity trend is a “NoGo” again this week and we saw the price rally stall but the indicator continued to paint weaker pink bars. Treasury bond prices remained in a “NoGo” trend as well and weakened to paint pink bars. U.S. Commodities painted weak pink “NoGo” bars as well and the dollar rounded out a complete set of “NoGo” trends by painting a week of strong purple bars.
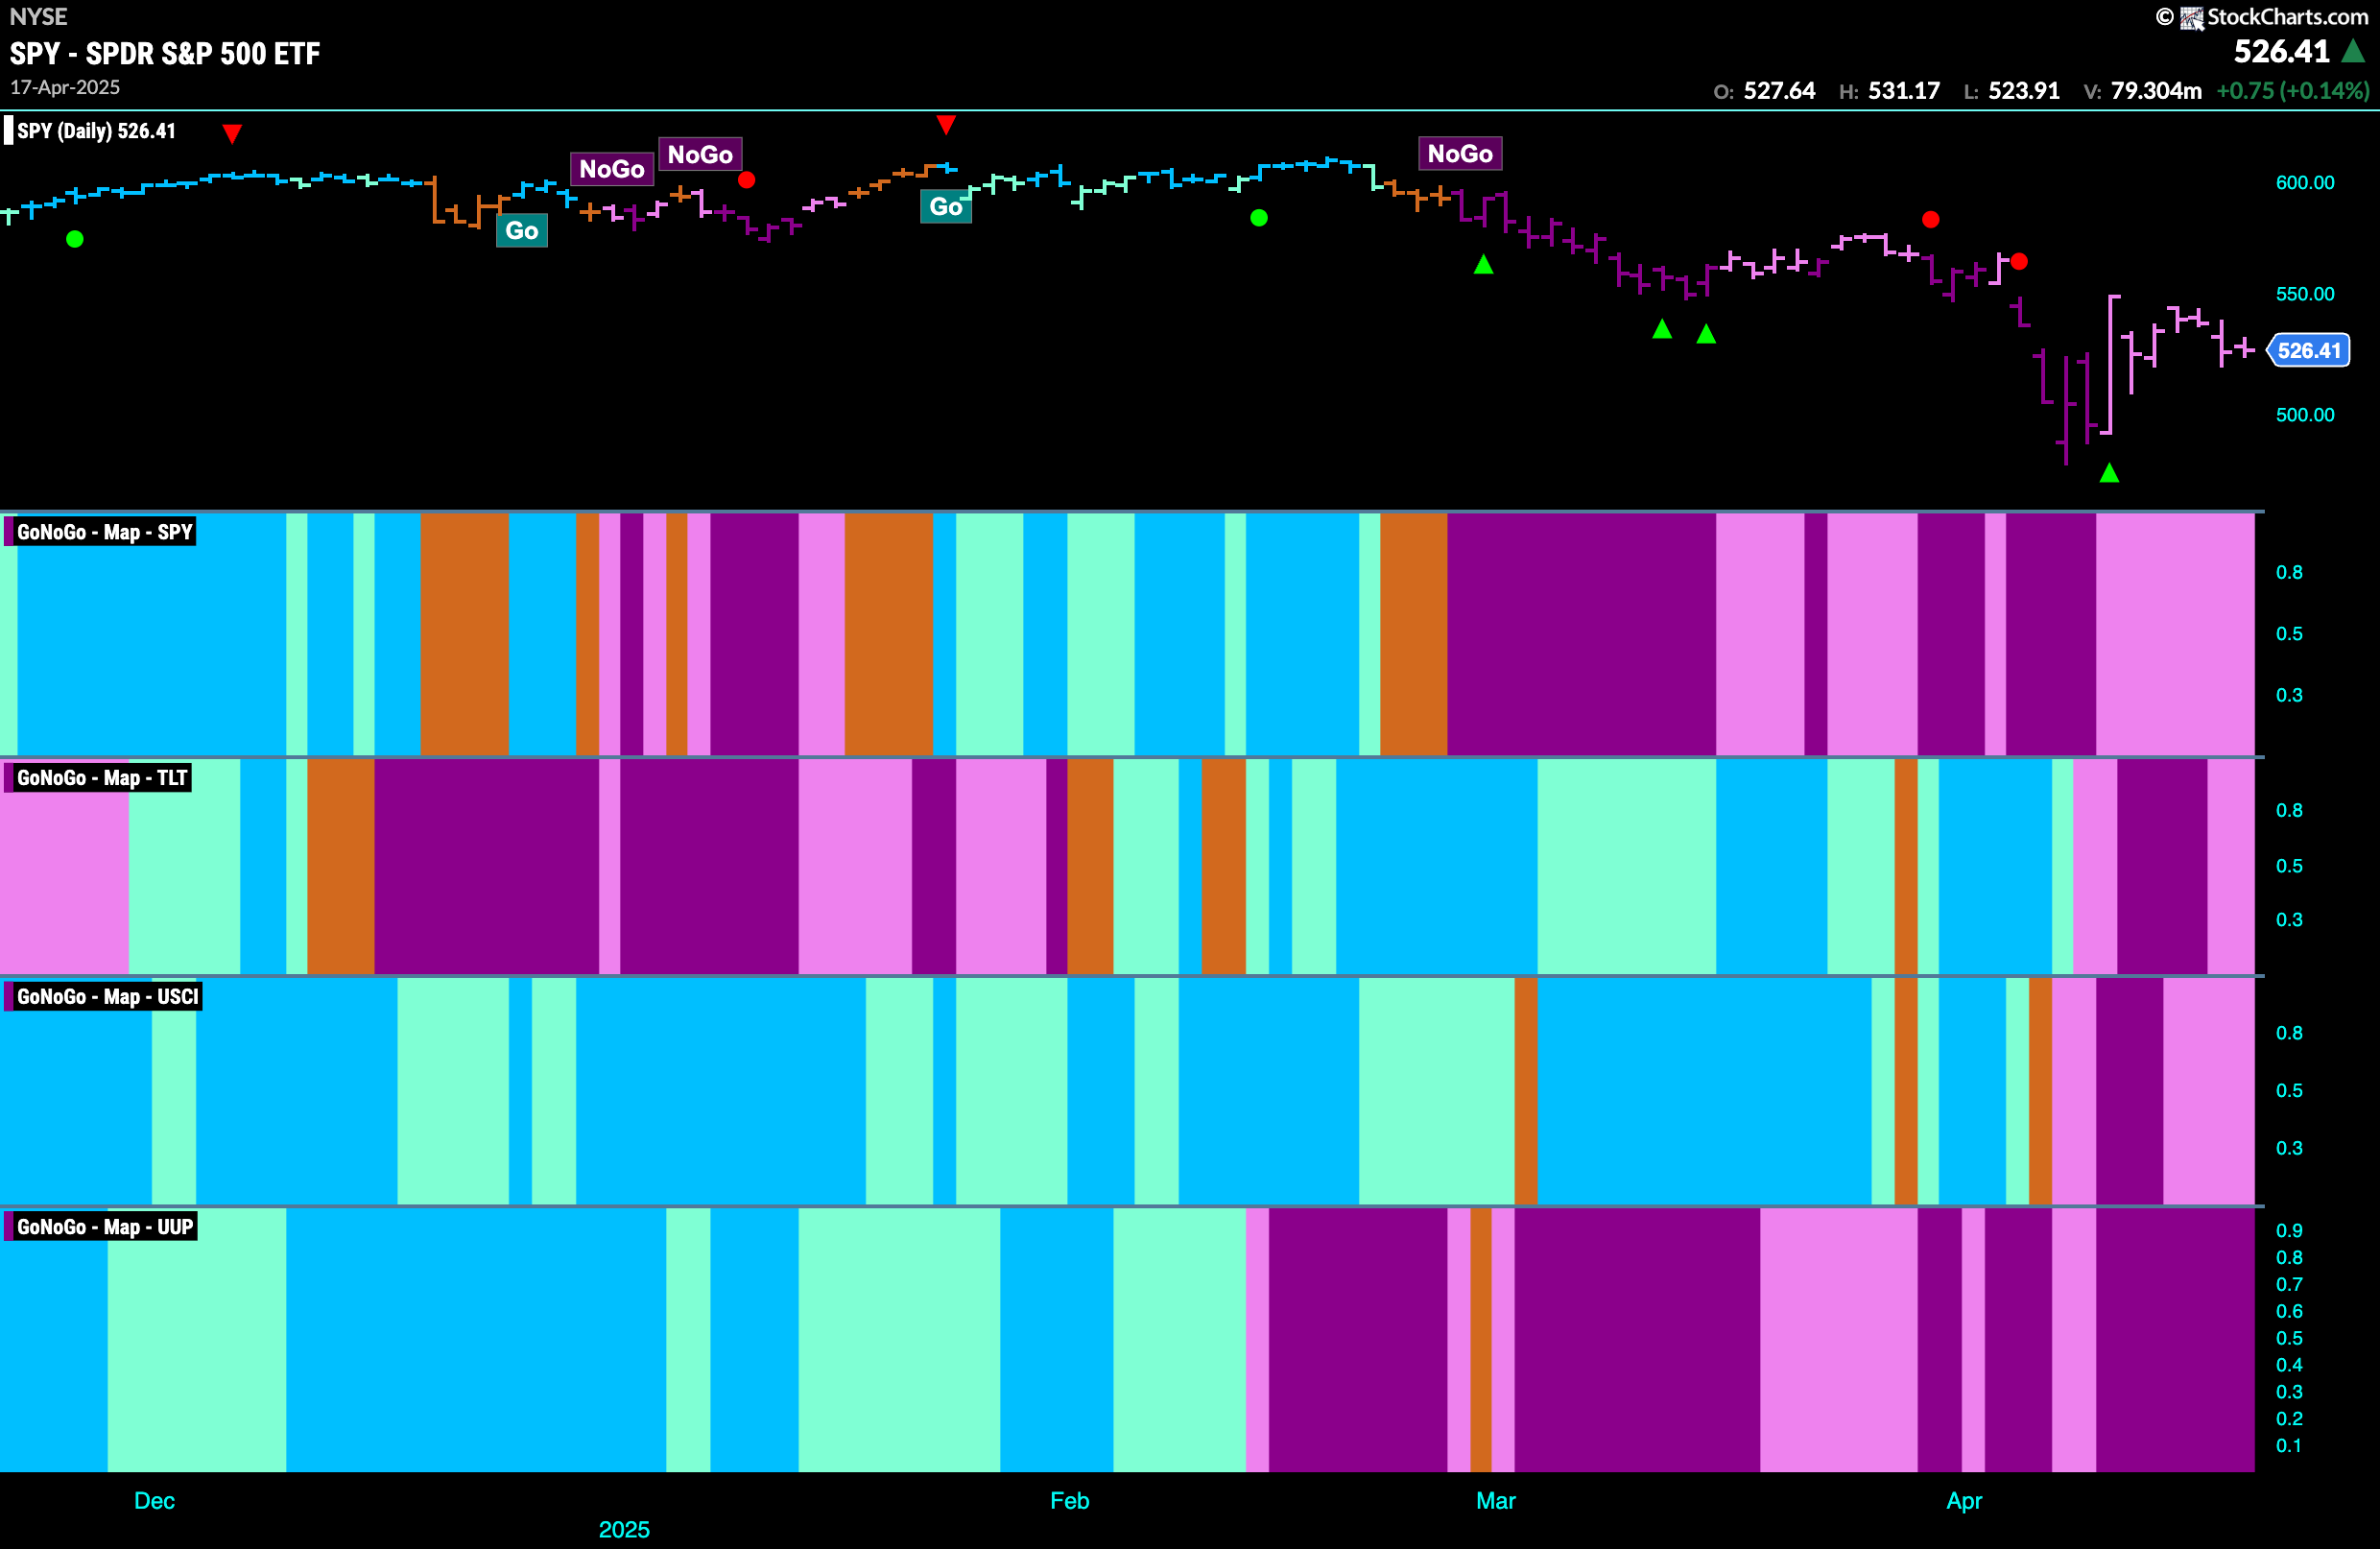
$SPY Sees Relief Rally Stall in “NoGo”
The GoNoGo chart below shows that the “NoGo” trend stayed for another week as the price rally stalled and we look to have set a new lower high. GoNoGo Indicator paints more pink “NoGo” bars and GoNoGo Oscillator is testing the zero line from below. As it rides this level we see a GoNoGo Squeeze building. We will watch to see in which direction the squeeze is broken.
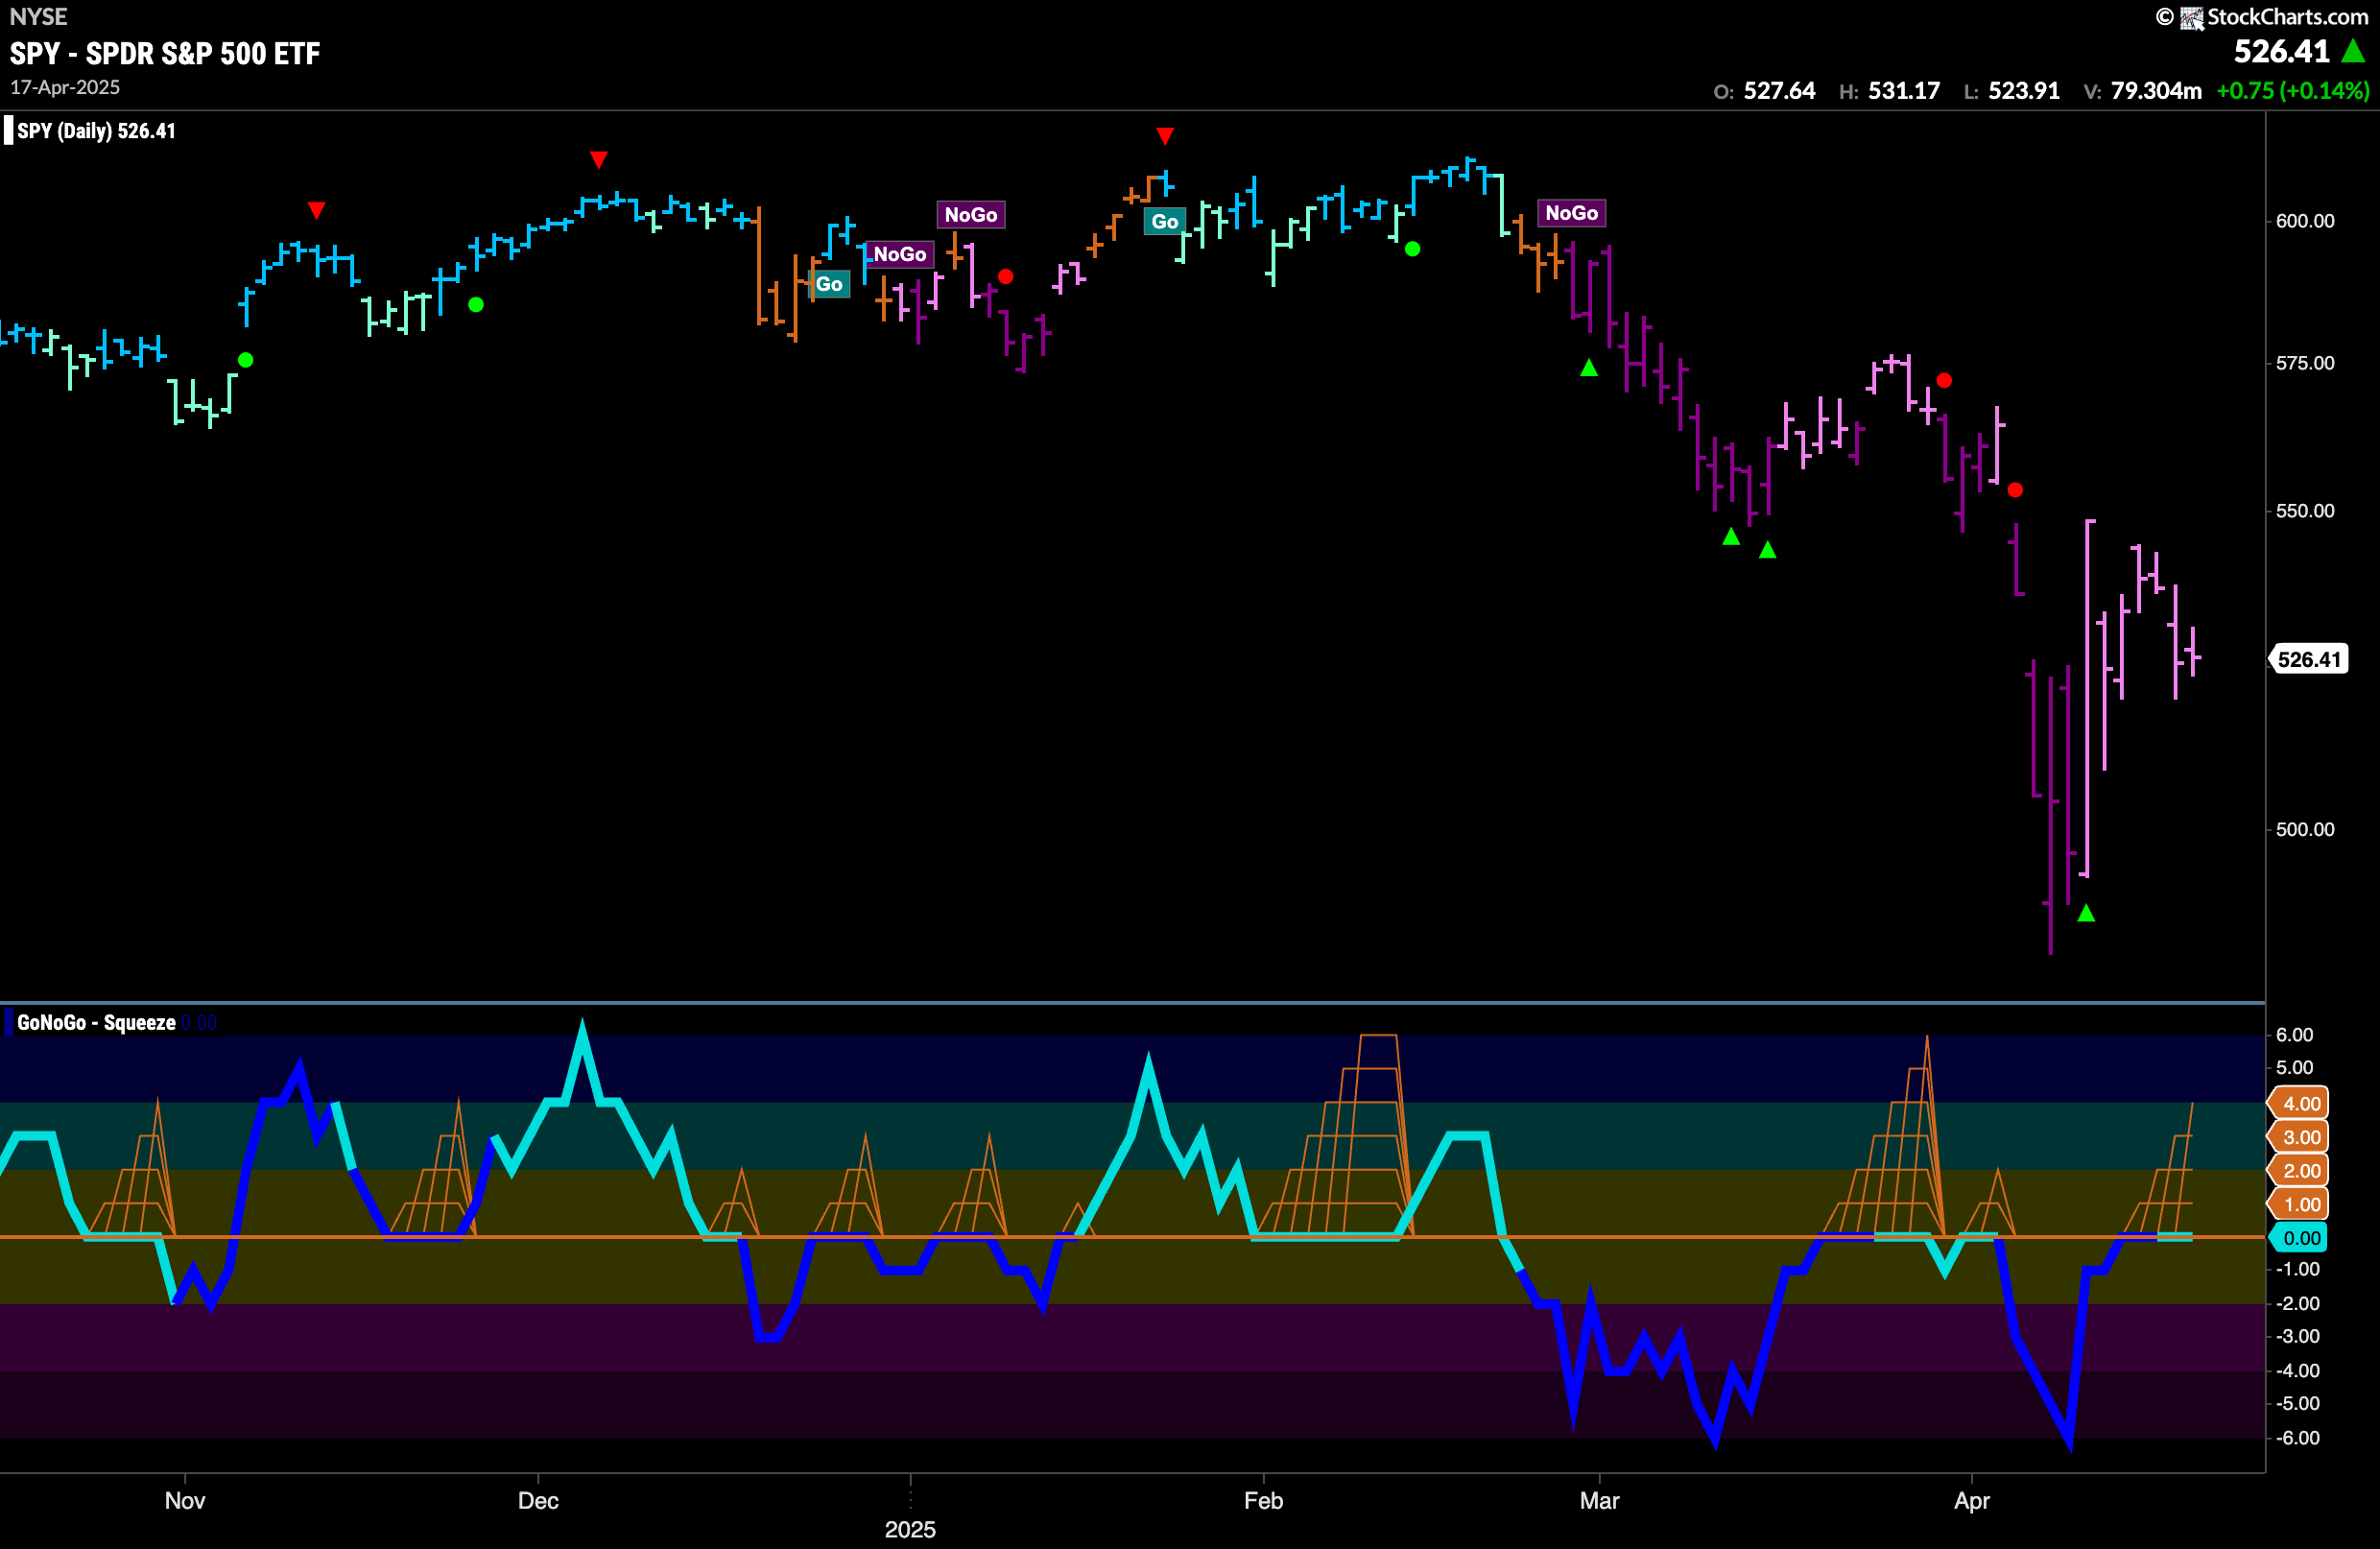
The weekly chart shows us another strong purple “NoGo” bar as price remains depressed. With GoNoGo Oscillator in negative territory but no longer oversold we know that momentum remains in the direction of the underlying “Go” trend. Volume is heavy as investors absorb the recent losses.
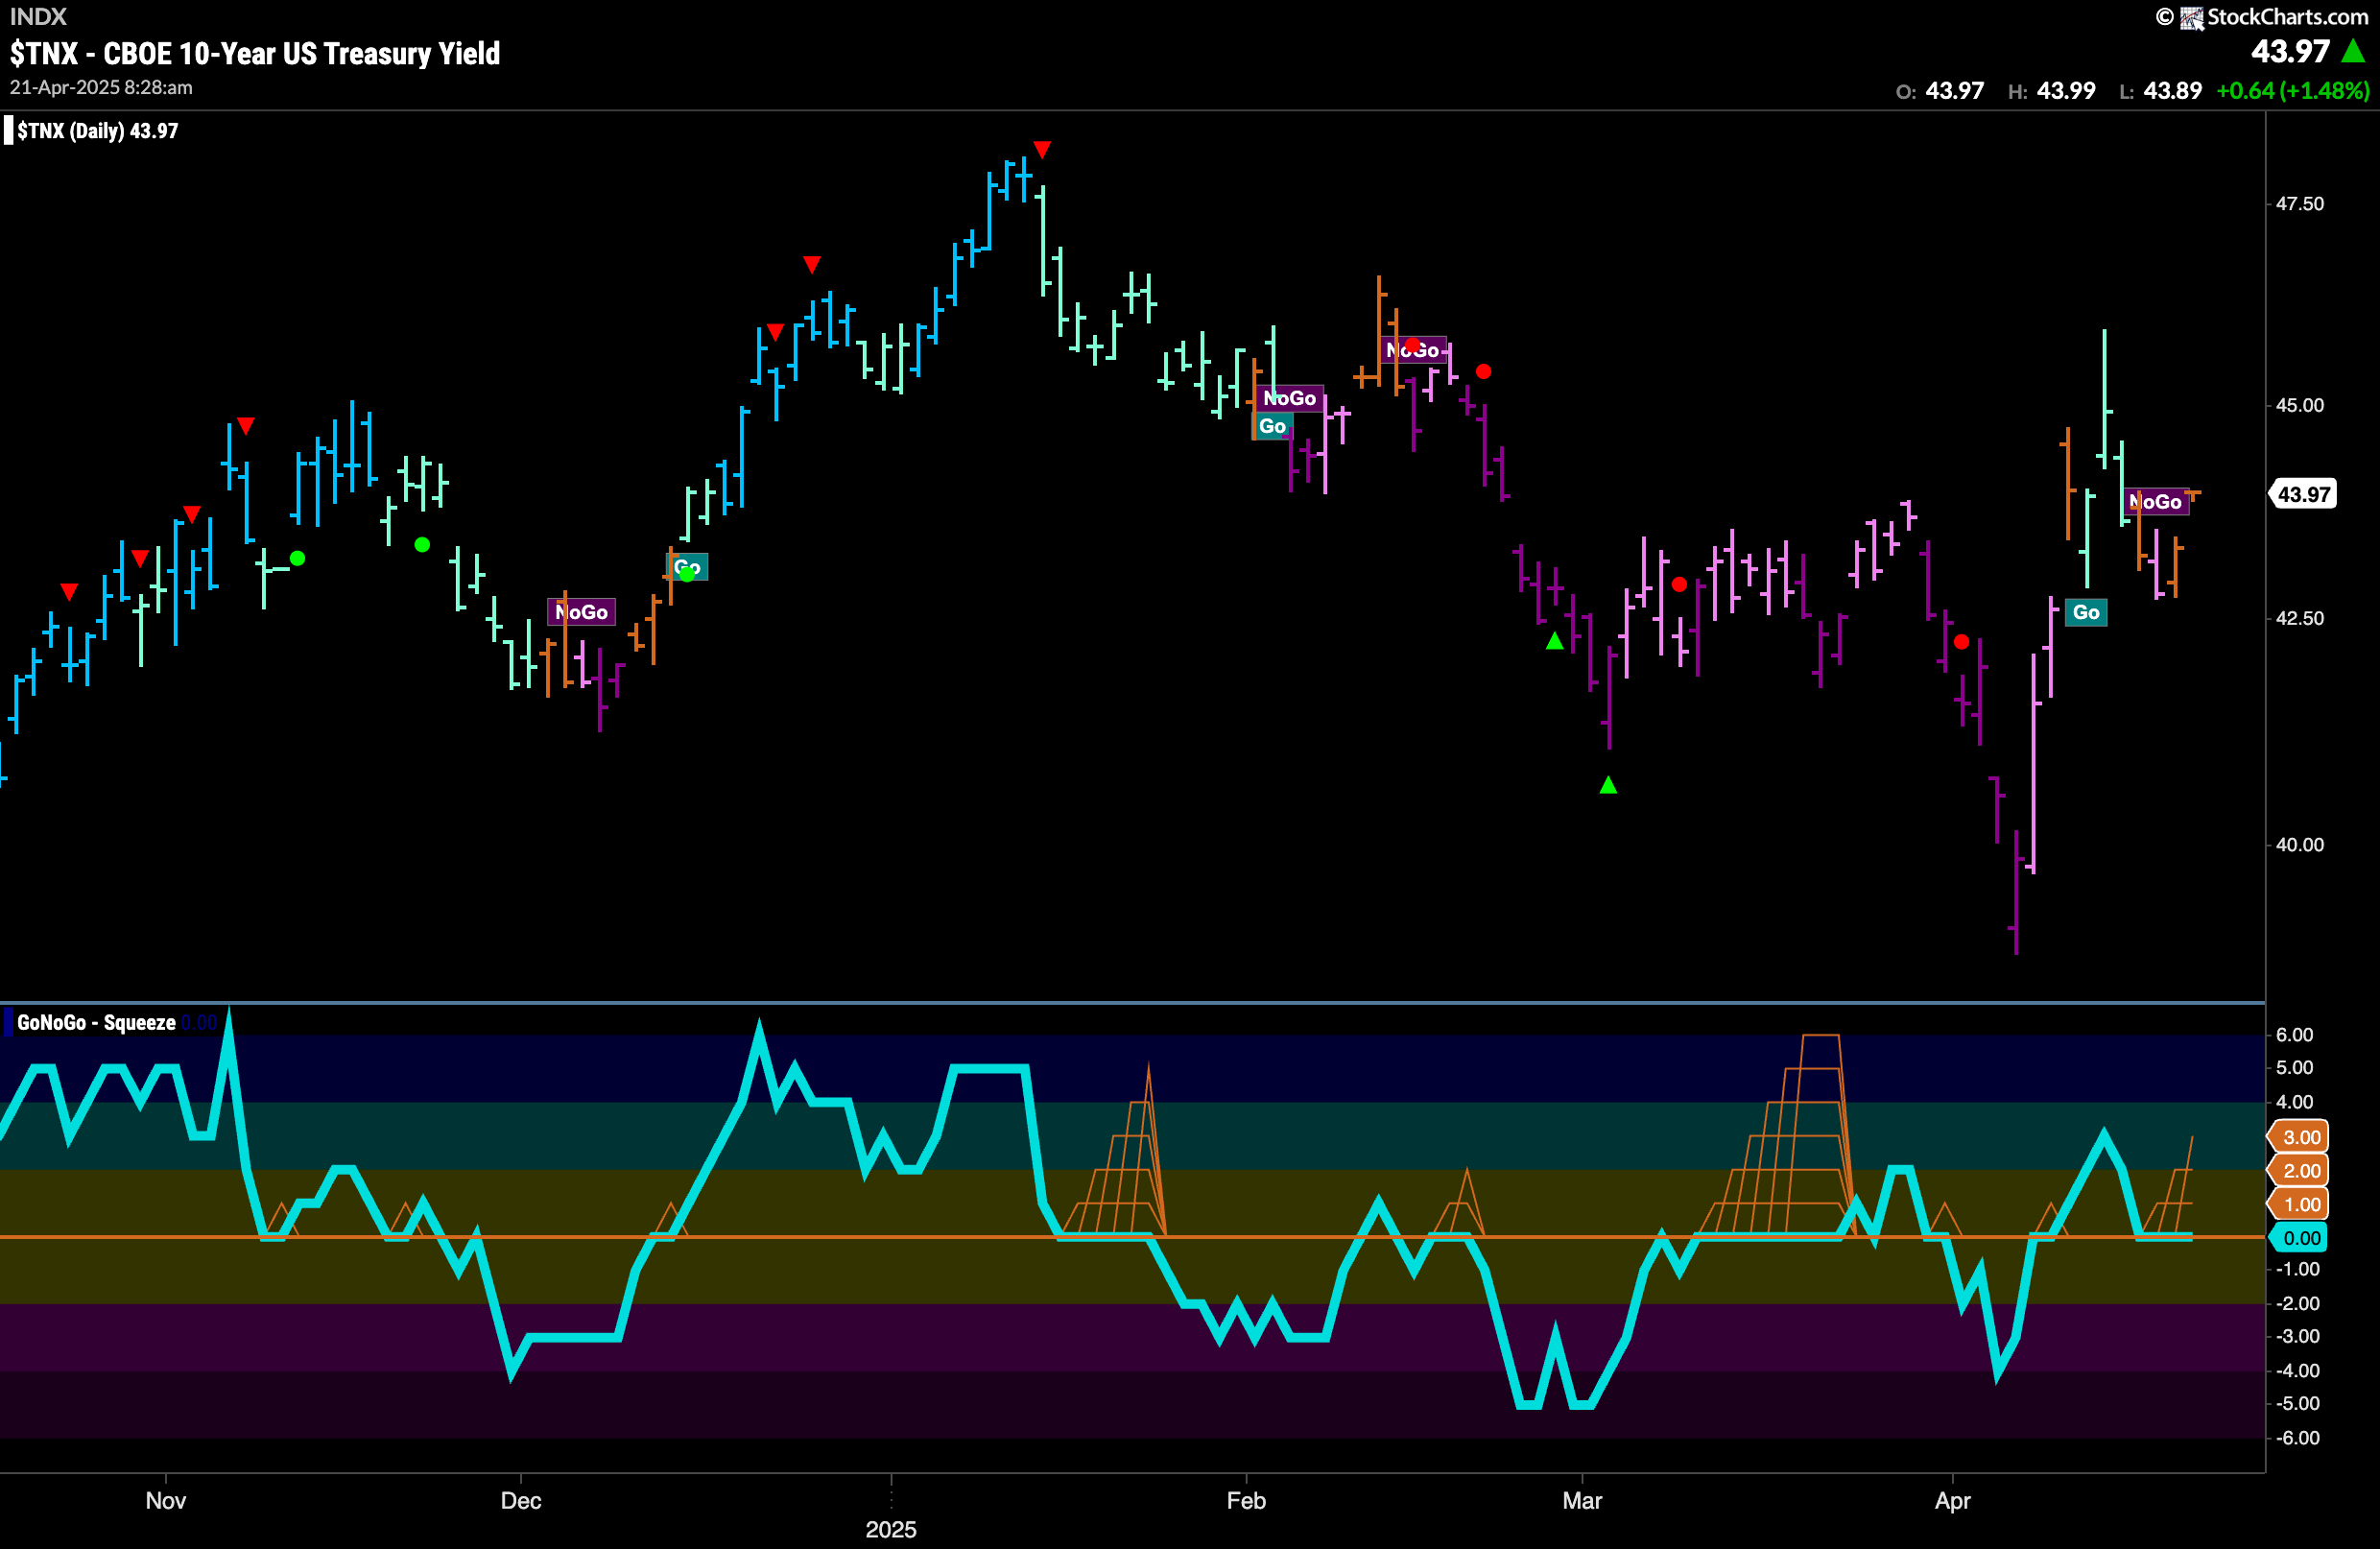
Treasury Rates Showing Uncertainty
GoNoGo Trend shows after a brief rally that saw GoNoGo Trend paint some weak aqua “Go” bars, we have seen uncertainty return and the indicator ended the week painting a couple of amber “Go Fish” bars. GoNoGo Oscillator is testing the zero line from above and we will watch to see if it finds support at this level.
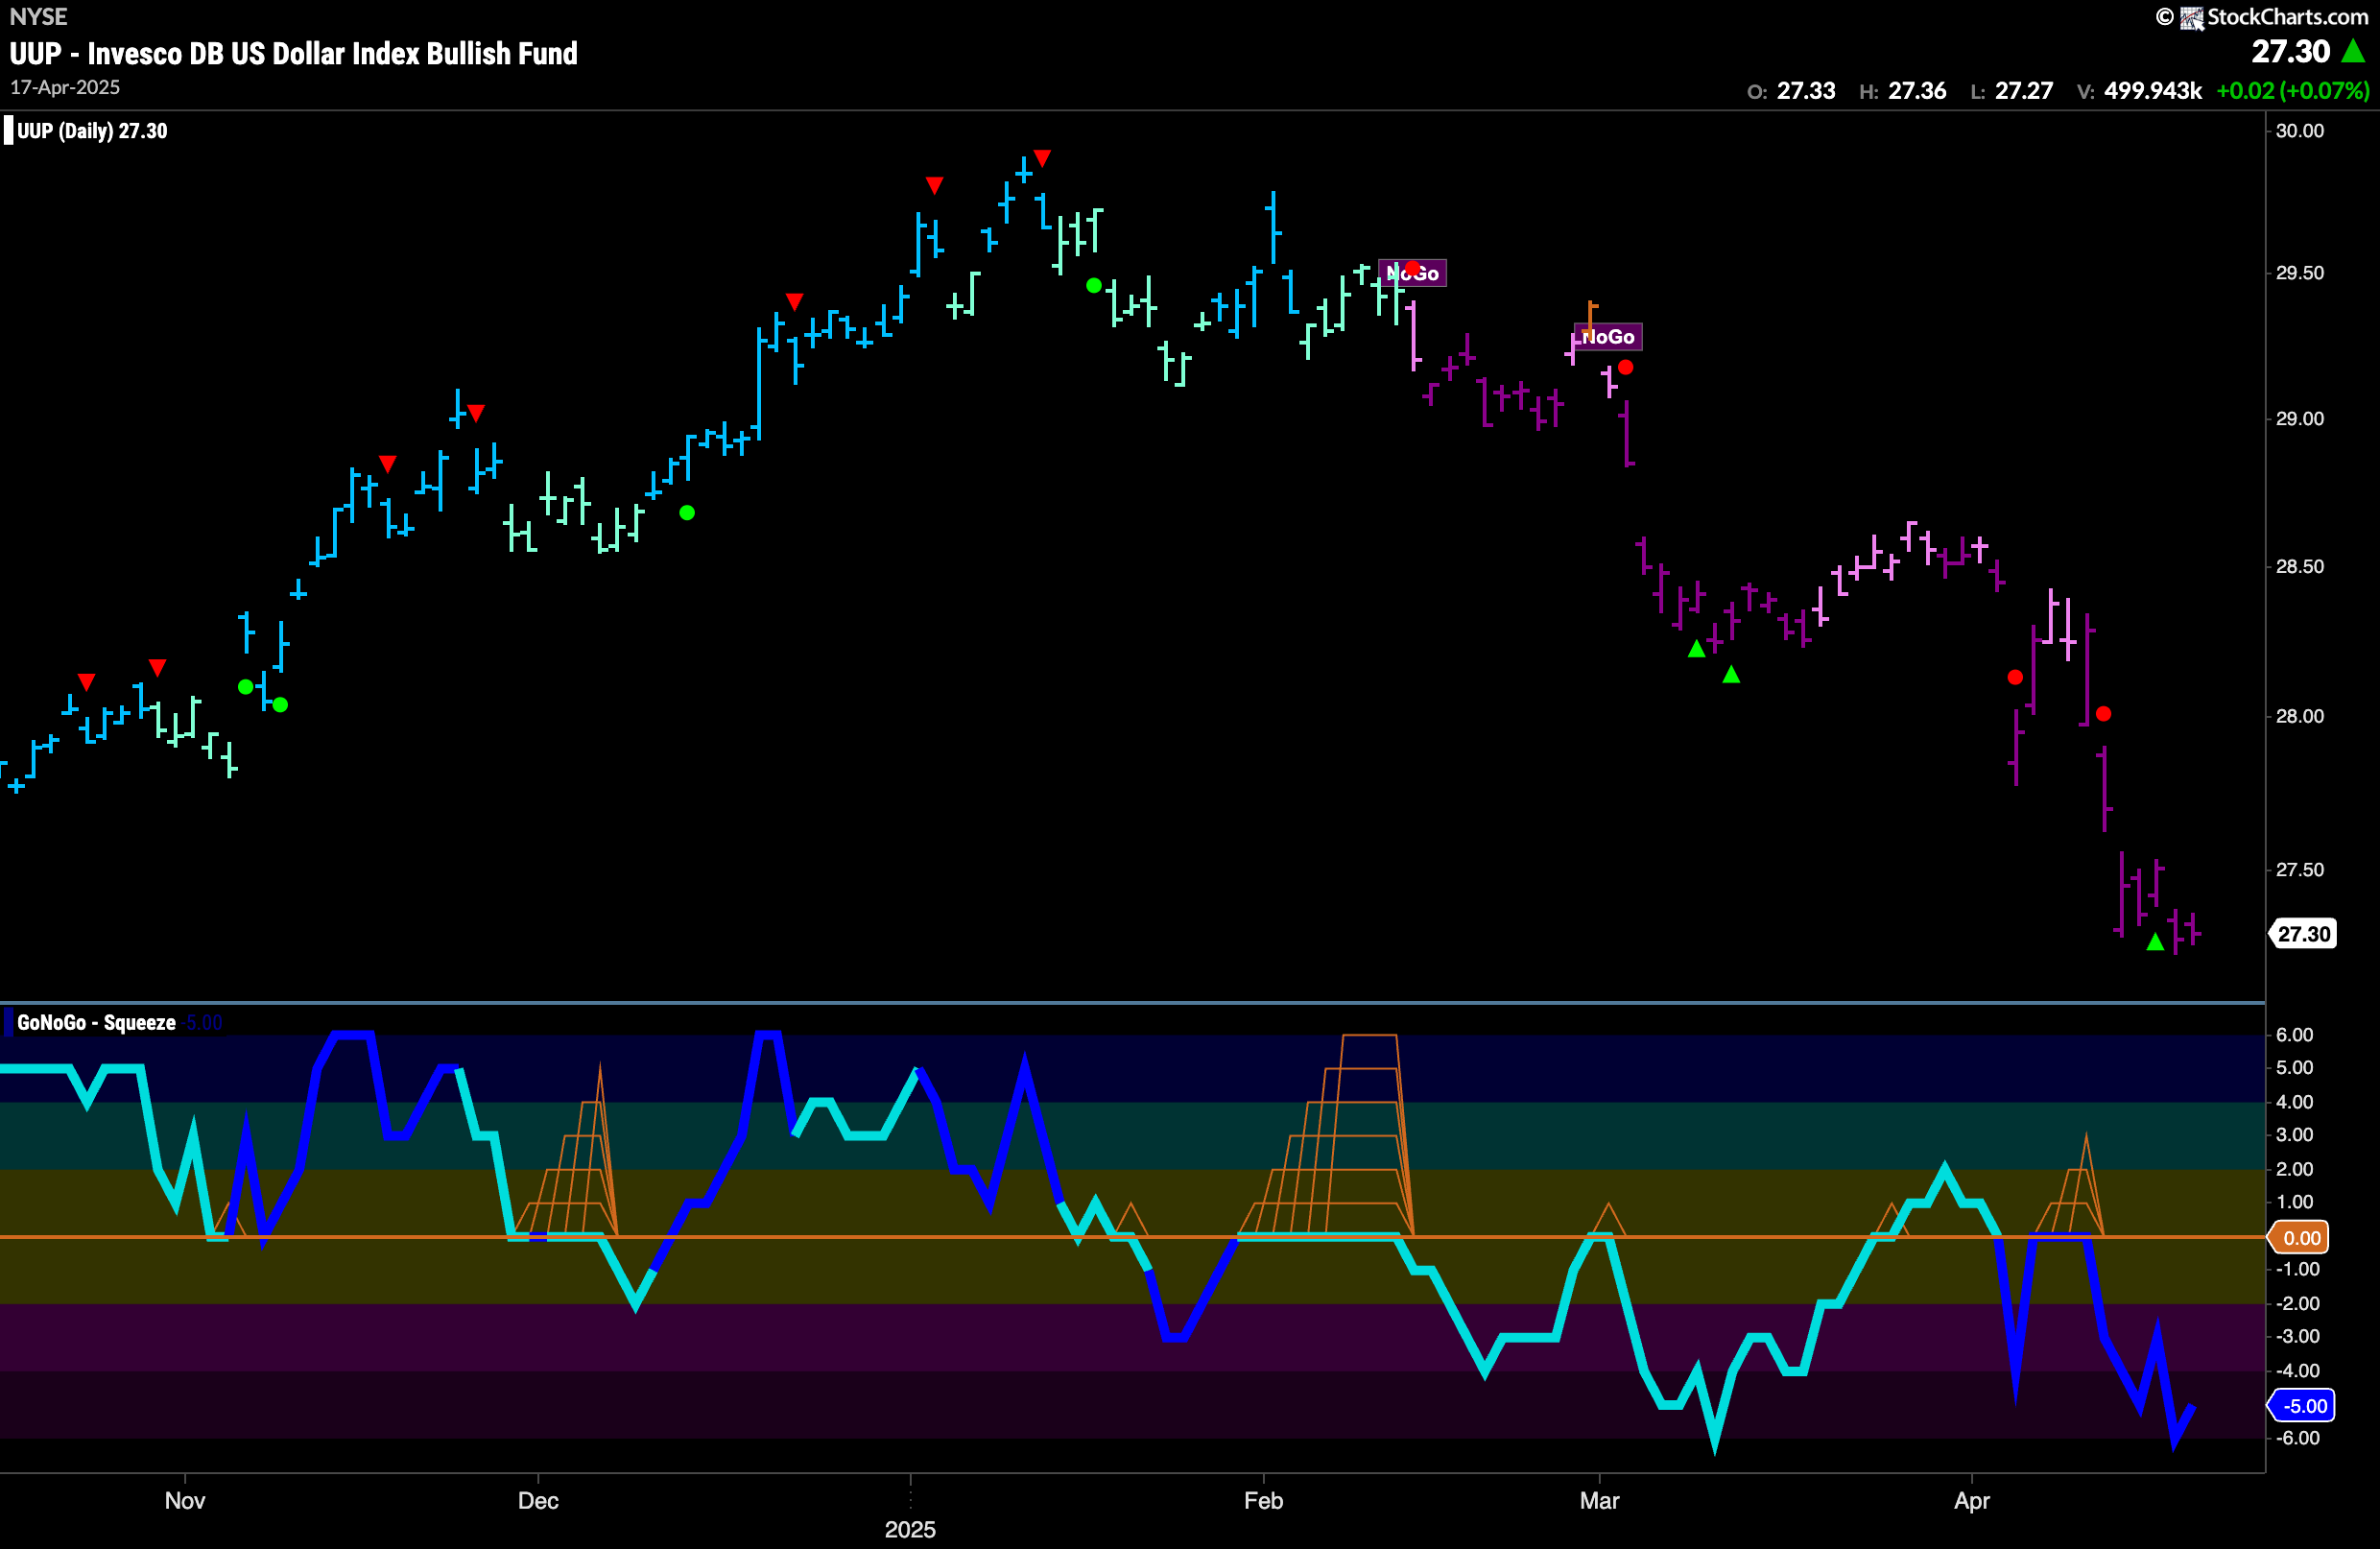
Dollar Continues Descent with Strong “NoGo” bars
The “NoGo” trend remained strong this week as price fell to new lower lows. GoNoGo Trend painted nothing but strong purple bars and GoNoGo Oscillator failed to climb out of oversold territory. We see that it is at a value of -5 and volume is heavy. We will look for price to consolidate at these levels.
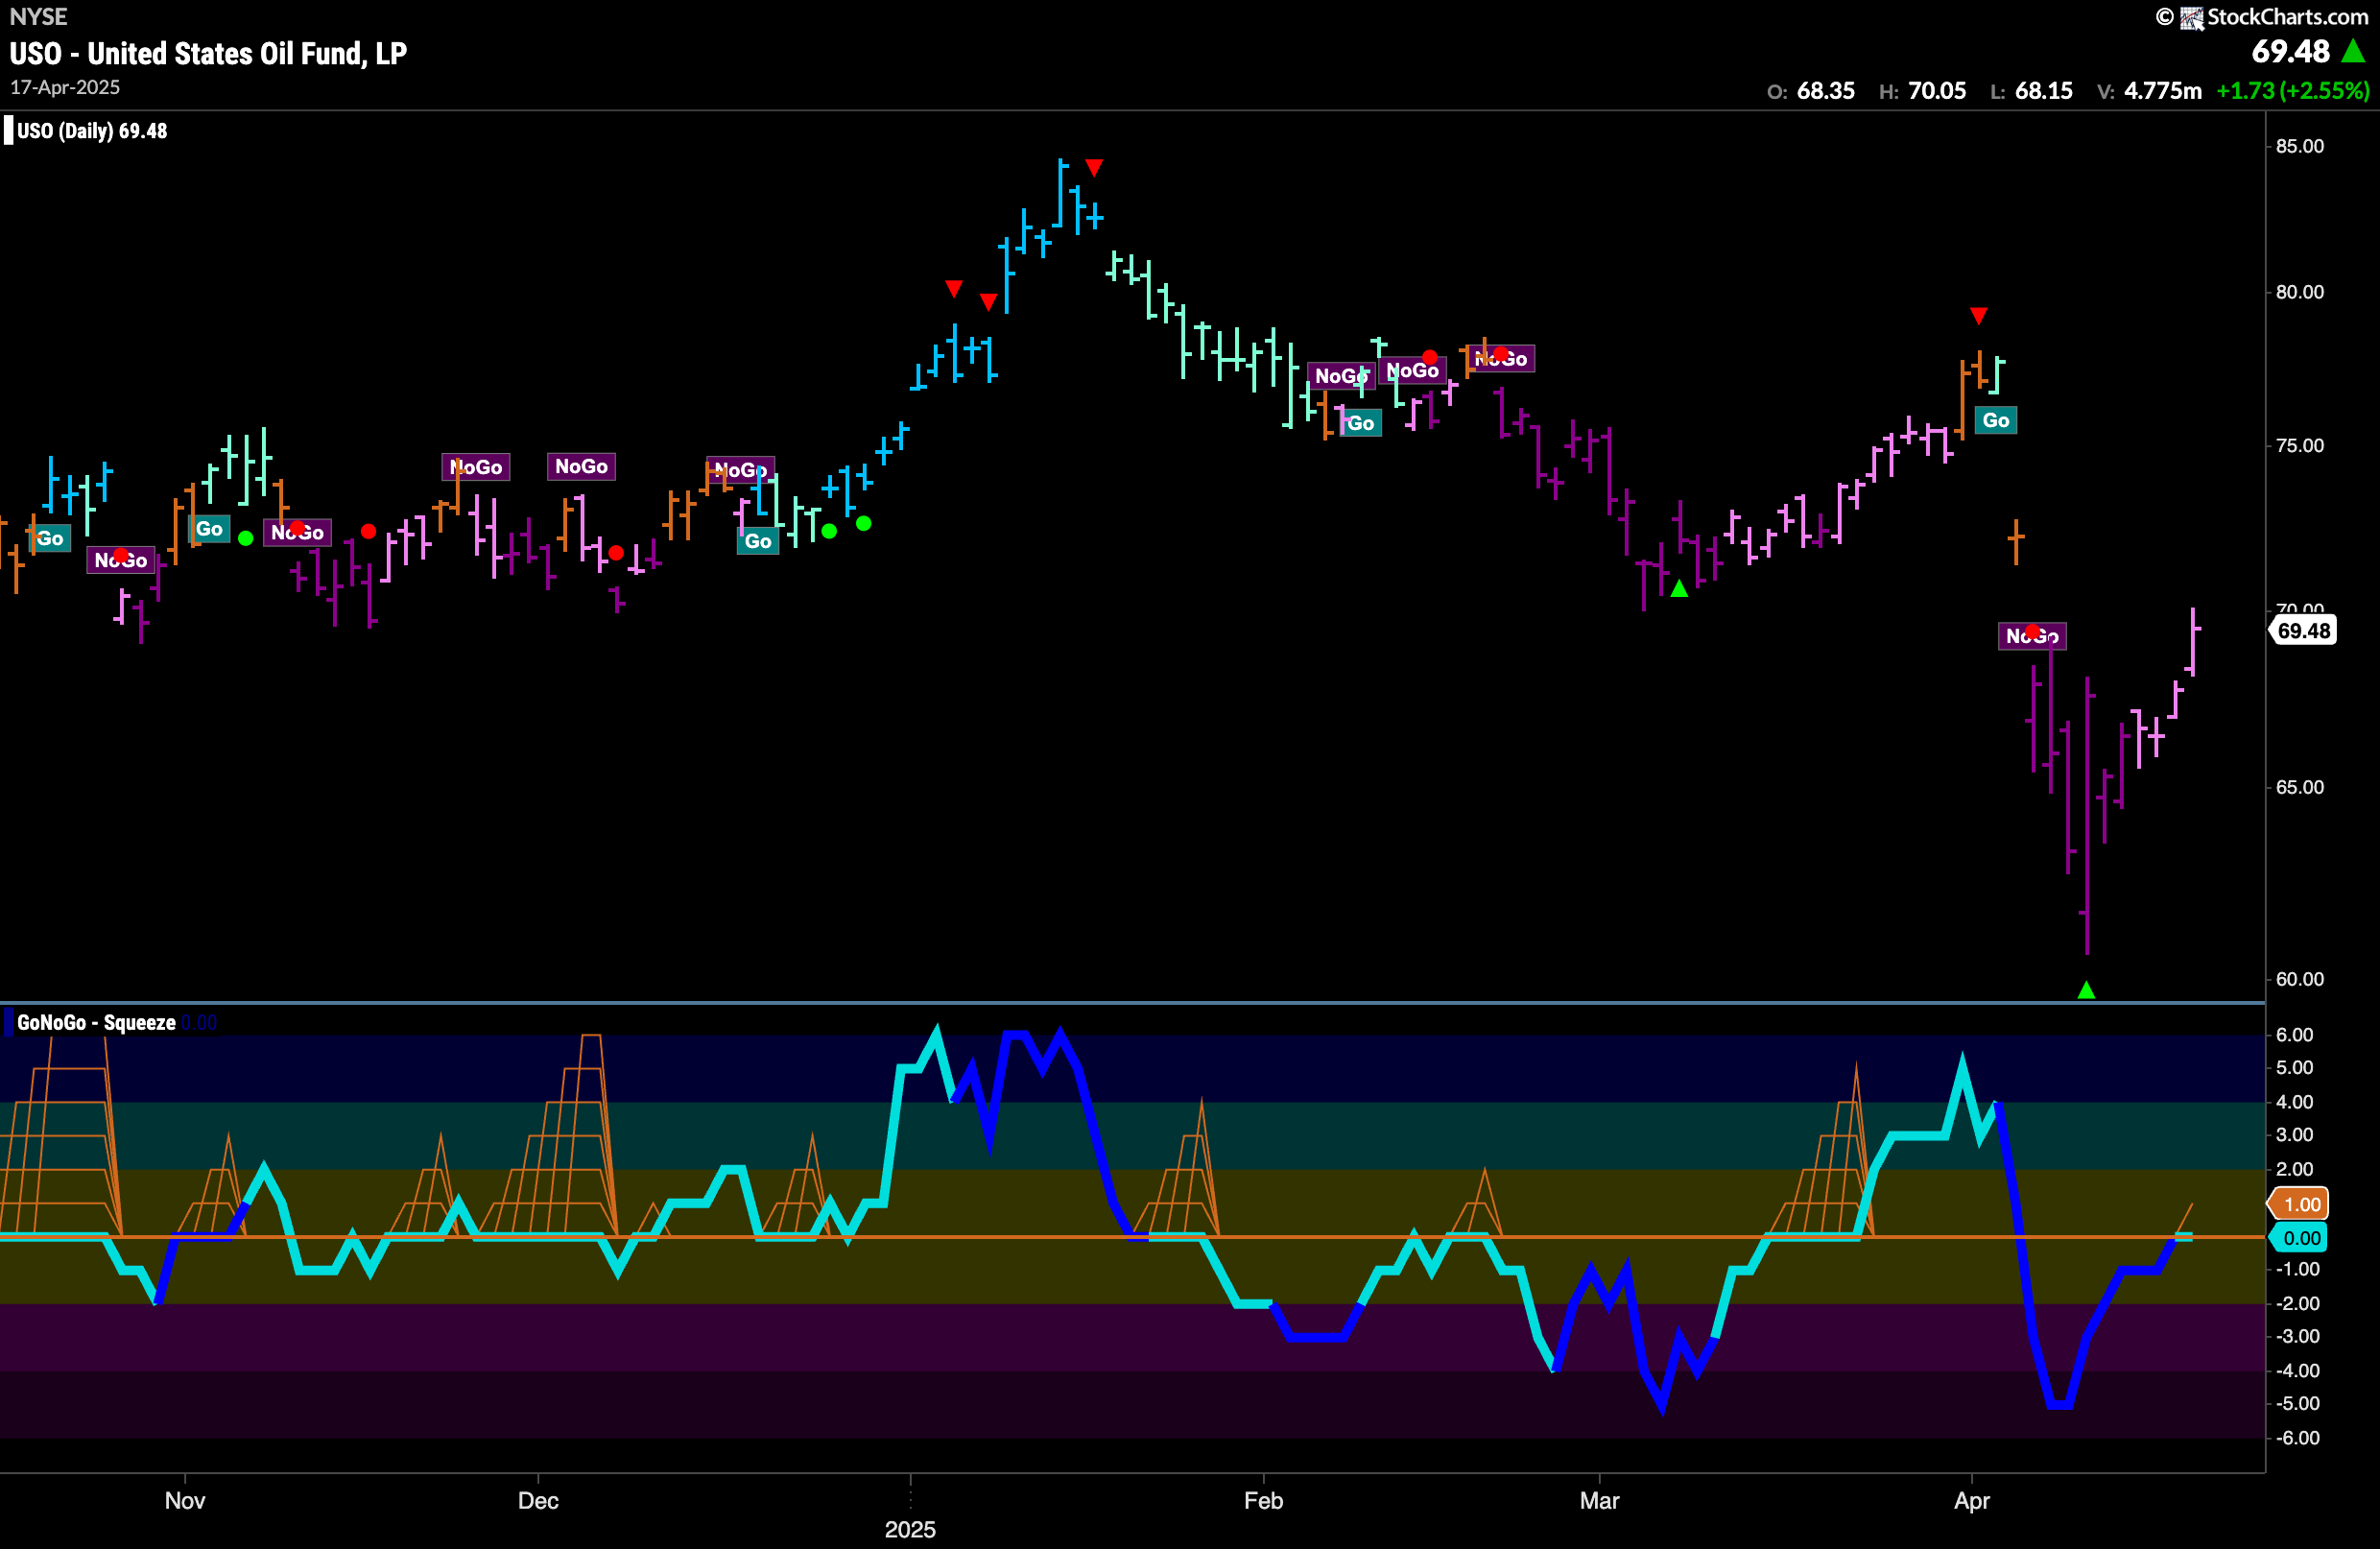
“NoGo” Weakens as GoNoGo Trend Paints Pink Bars
The “NoGo” remained for another week but we do see weakness as price climbs from the recent low. GoNoGo Trend is painting pink bars and GoNoGo Oscillator has risen to test the zero line from below. We will watch to see if it gets rejected by the zero line. If it does, then we would know that momentum is resurgent in the direction of the “NoGo” trend and expect price to roll over and fall once again.
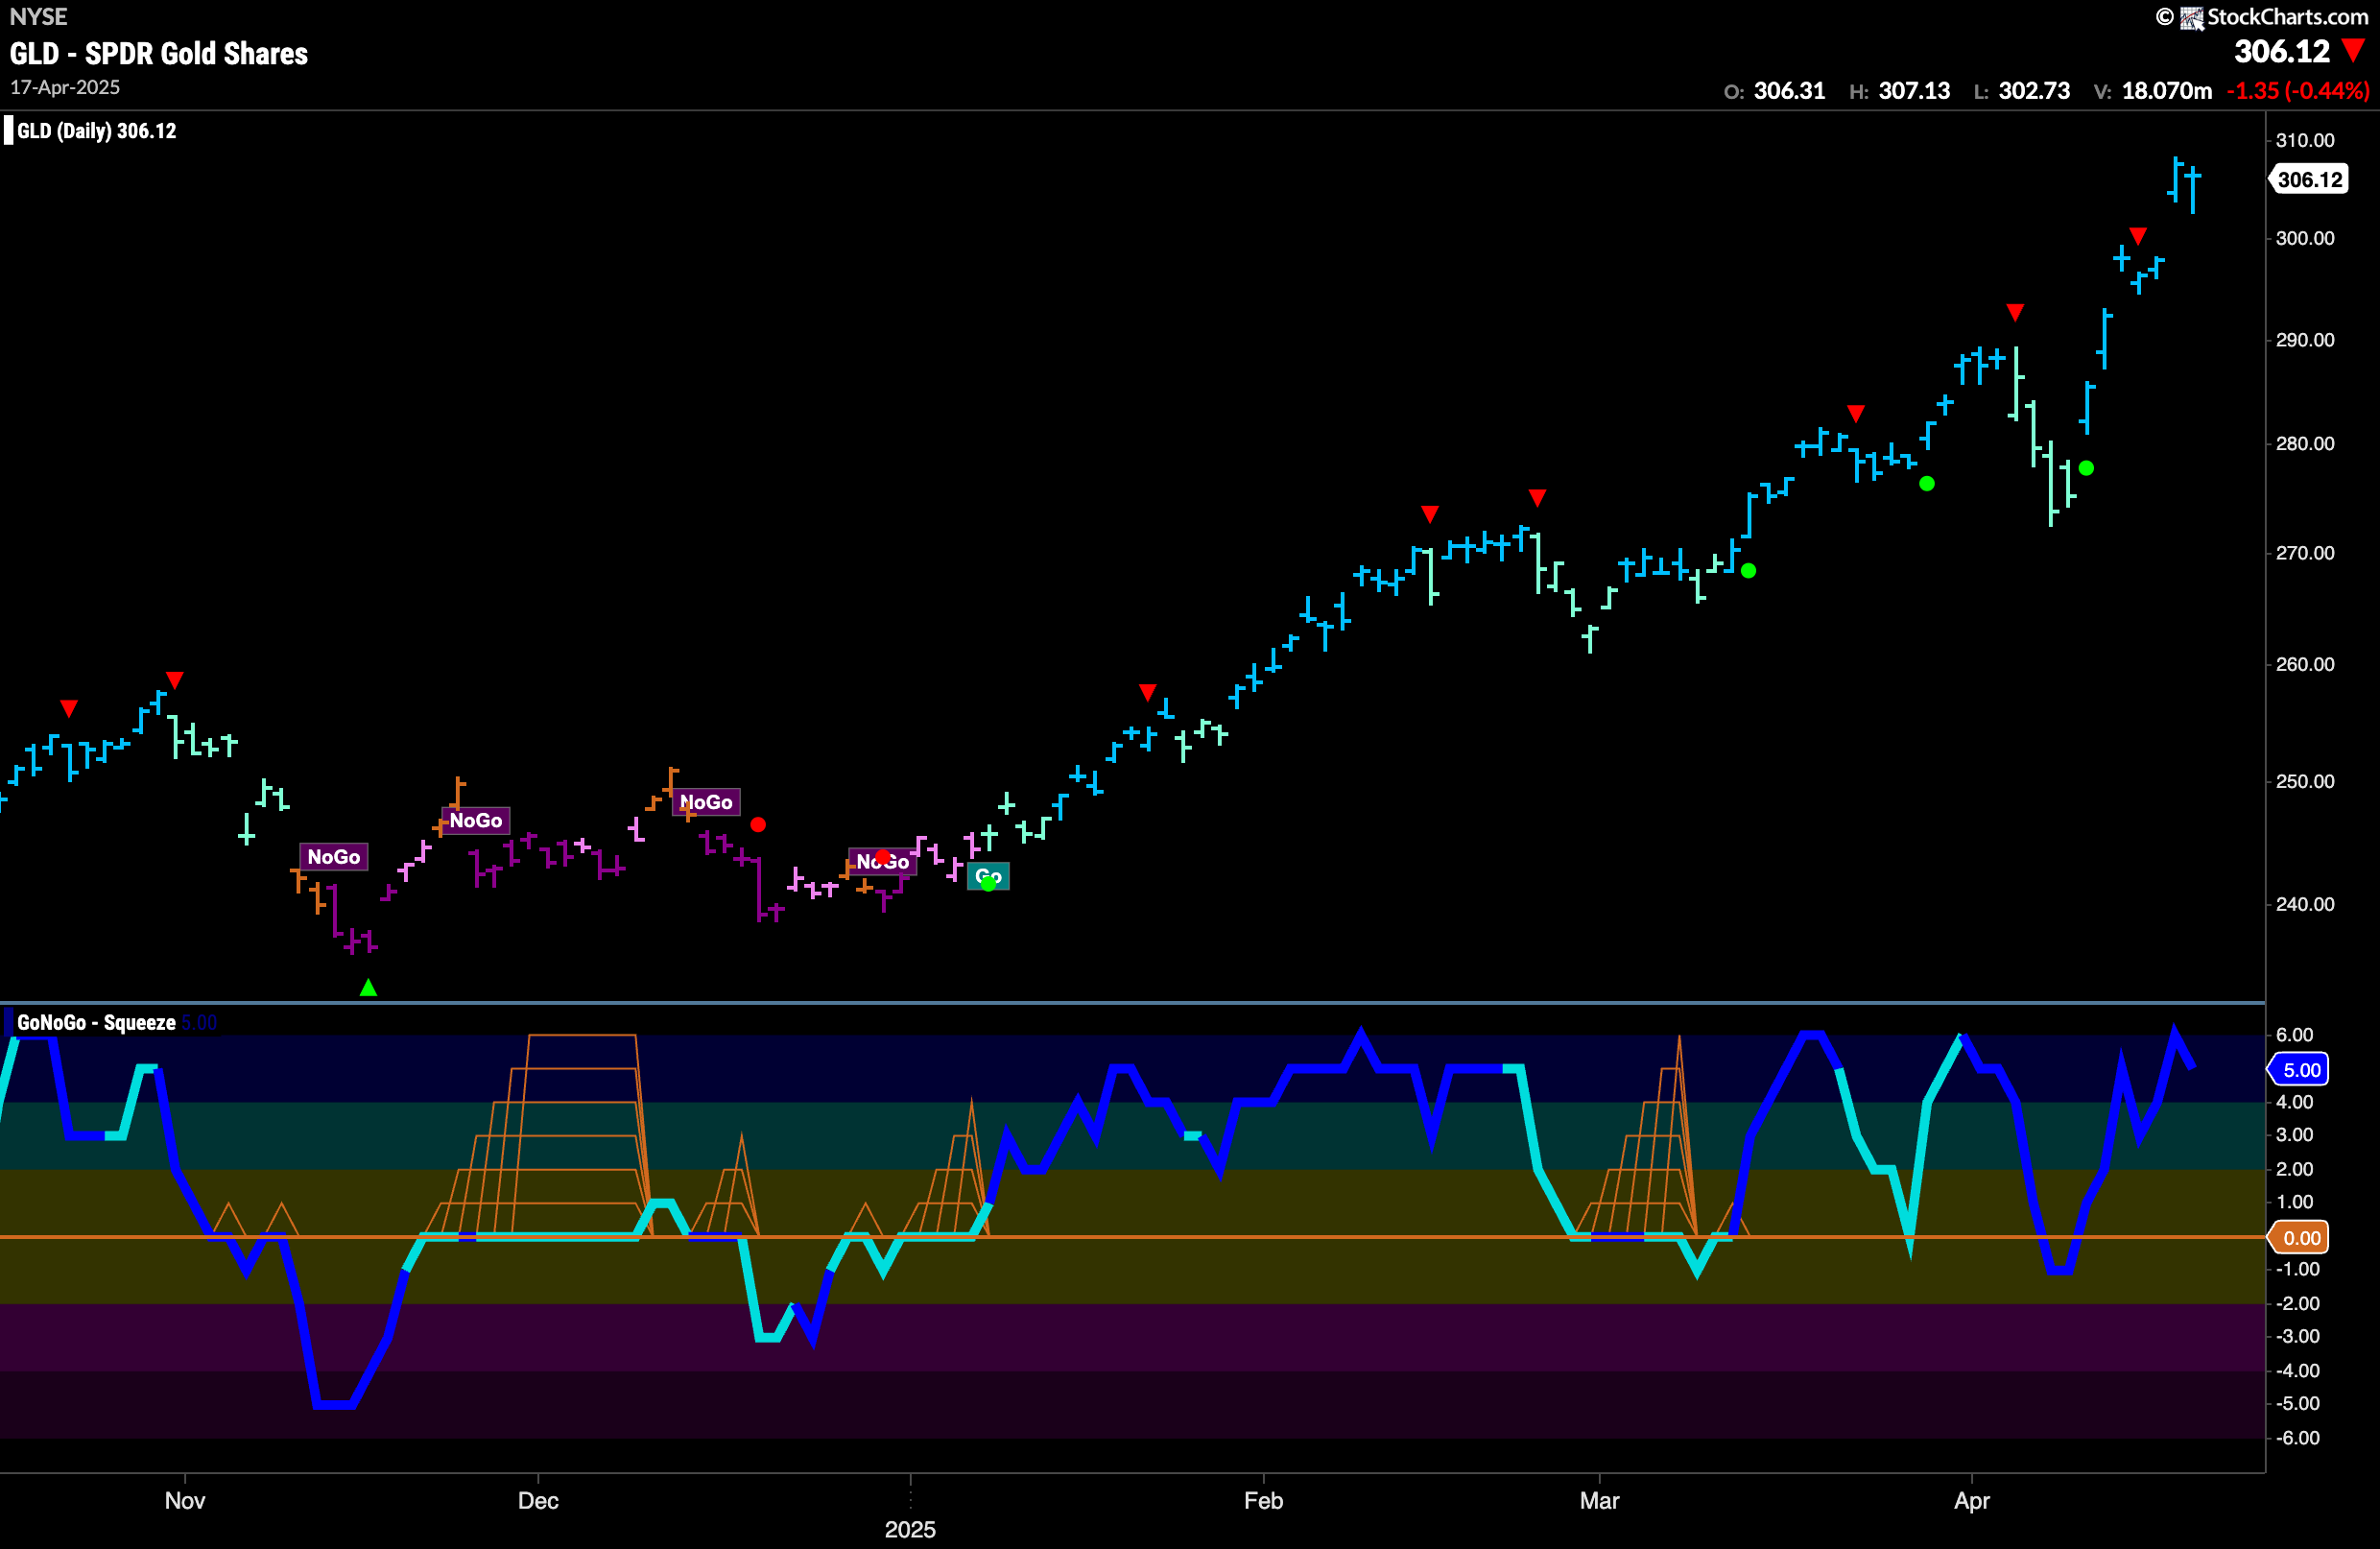
Gold Continues to Climb!
No stopping Gold as price gaps higher again to another new higher high. GoNoGo Trend is painting strong blue bars and we saw price blow past a Go Countertrend Correction Icon (red arrow) as momentum could not be slowed. GoNoGo Oscillator is back in overbought territory at a value of 5 and volume is heavy showing strong market participation.
Sector RelMap
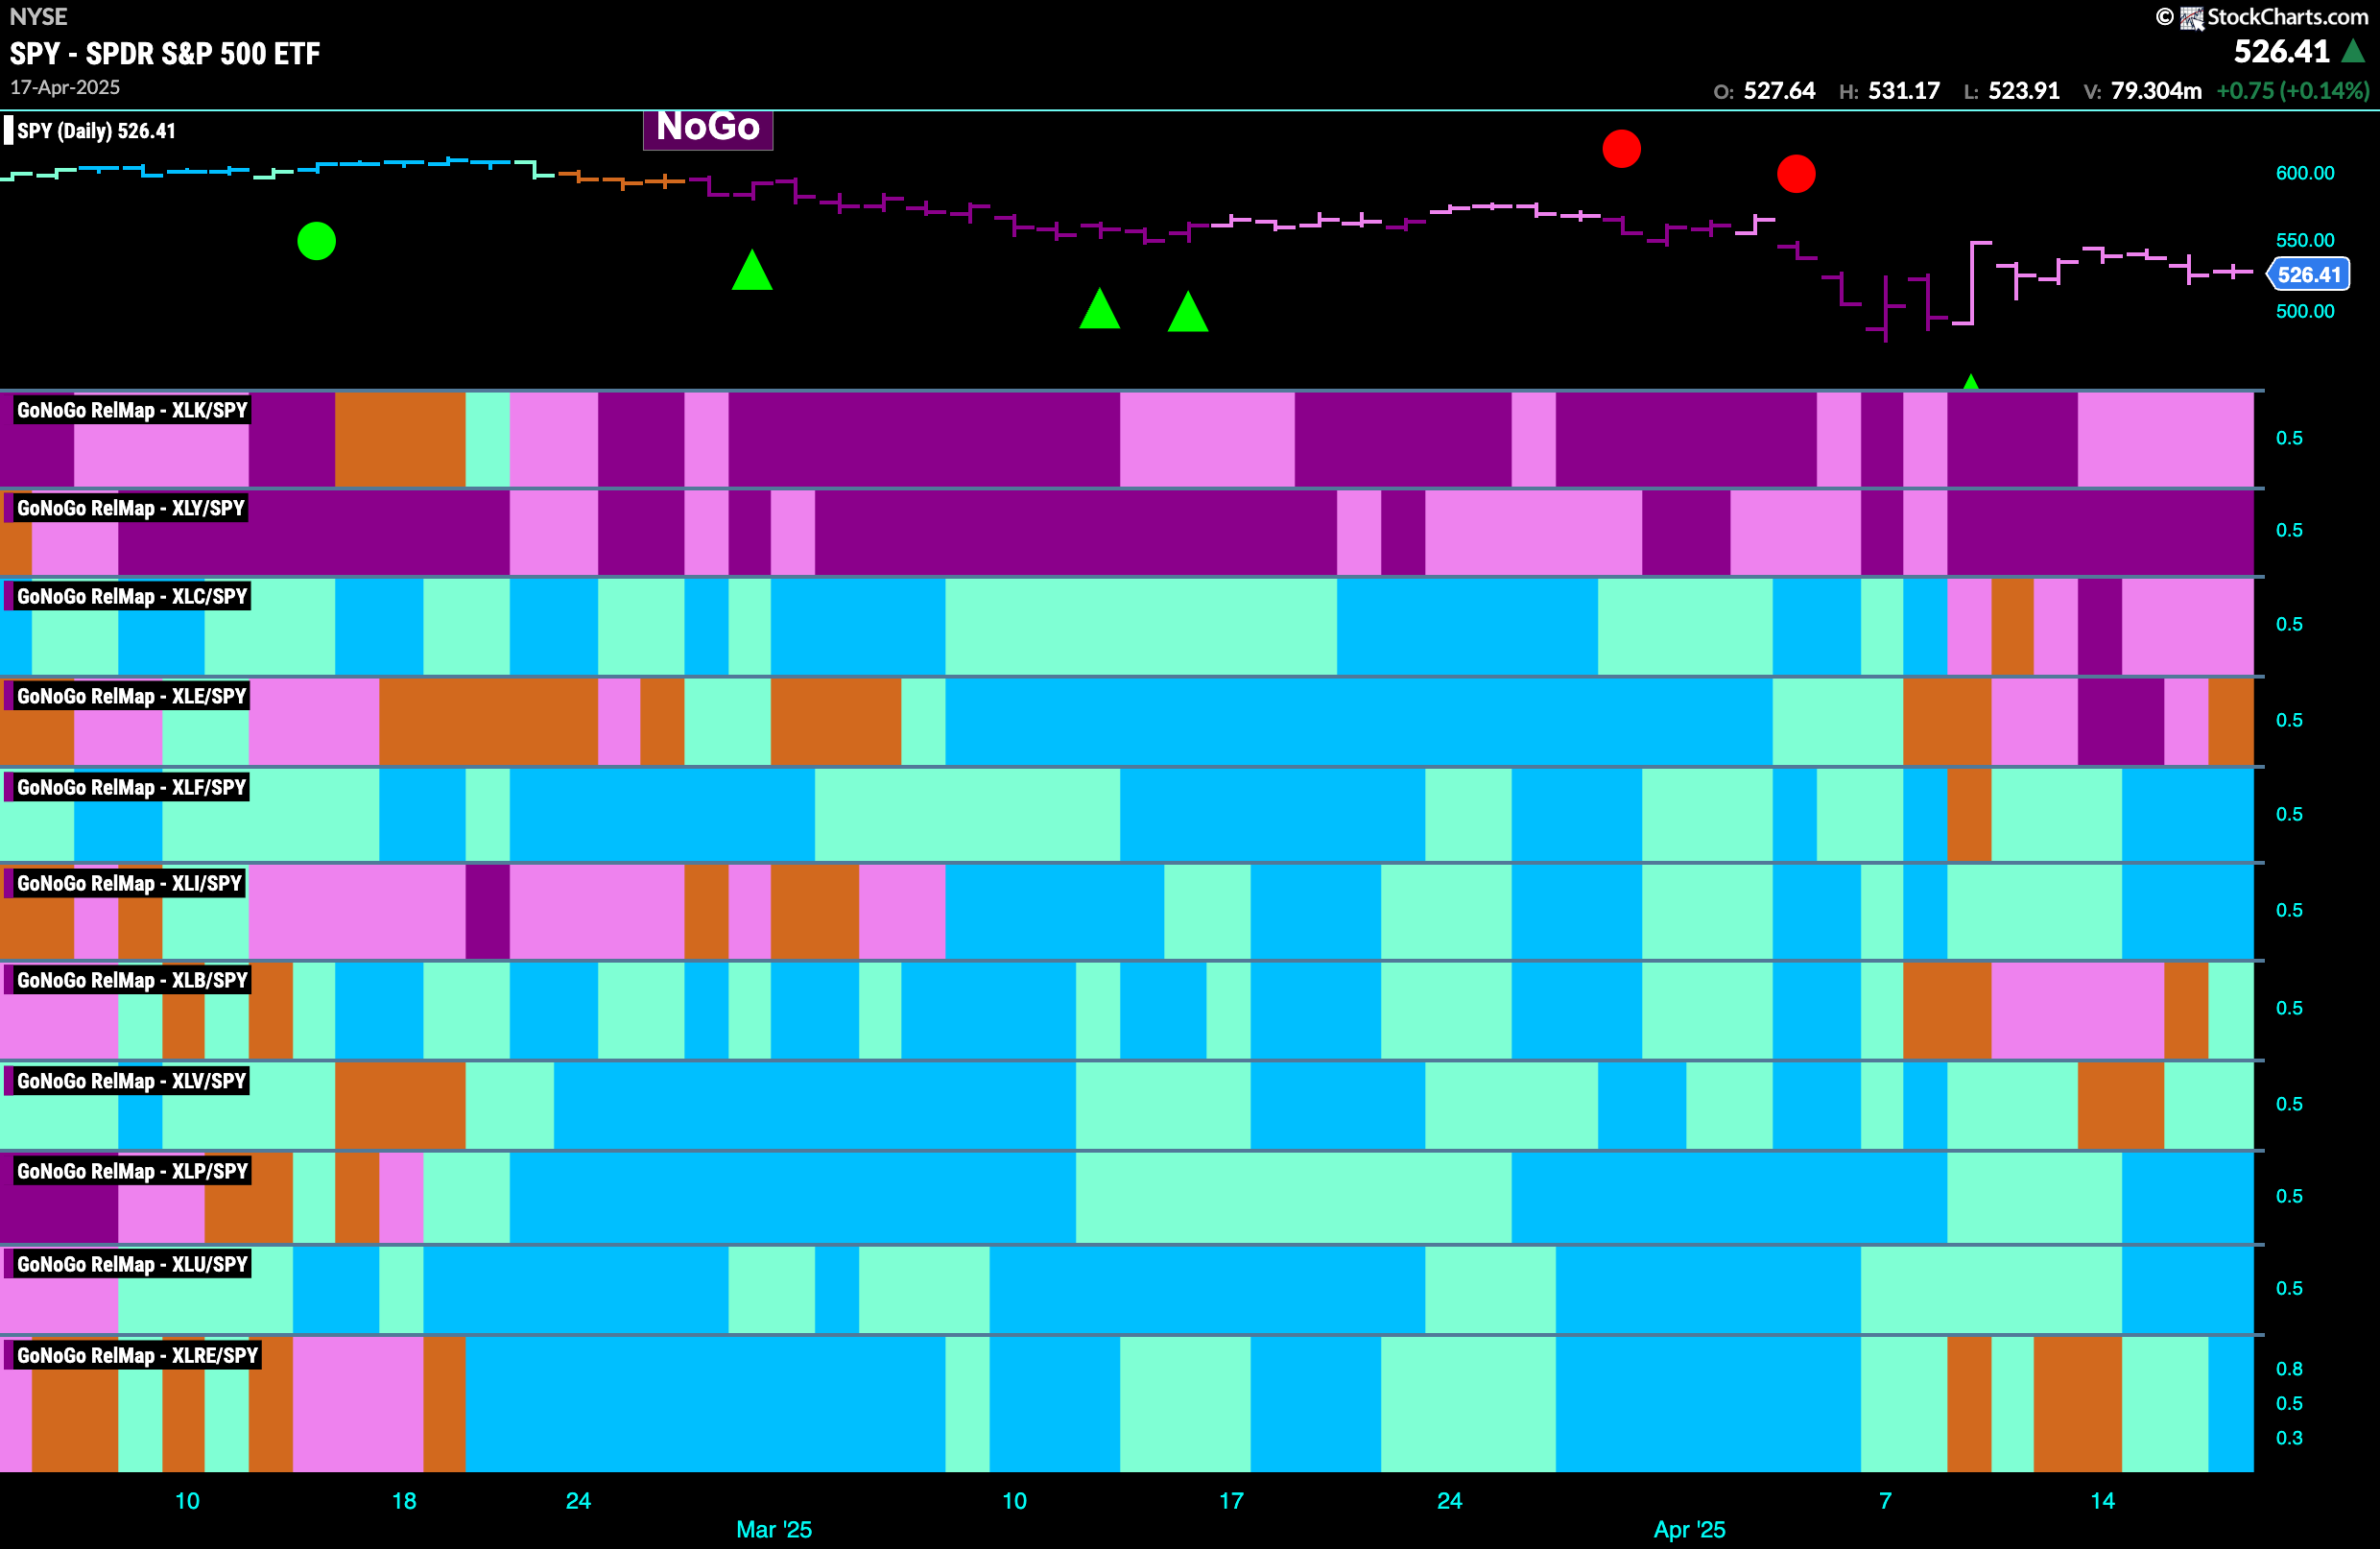
Below is the GoNoGo Sector RelMap. This GoNoGo RelMap applies the GoNoGo Trend to the relative strength ratios of the sectors to the base index. With this view we can get a sense of the relative out performance and relative underperformance of the sectors. 7 sectors are in relative “Go” trends. $XLF, $XLI, $XLB, $XLV, $XLP, $XLU and $XLRE are painting relative “Go” bars.
Utilities Sub-Group RelMap
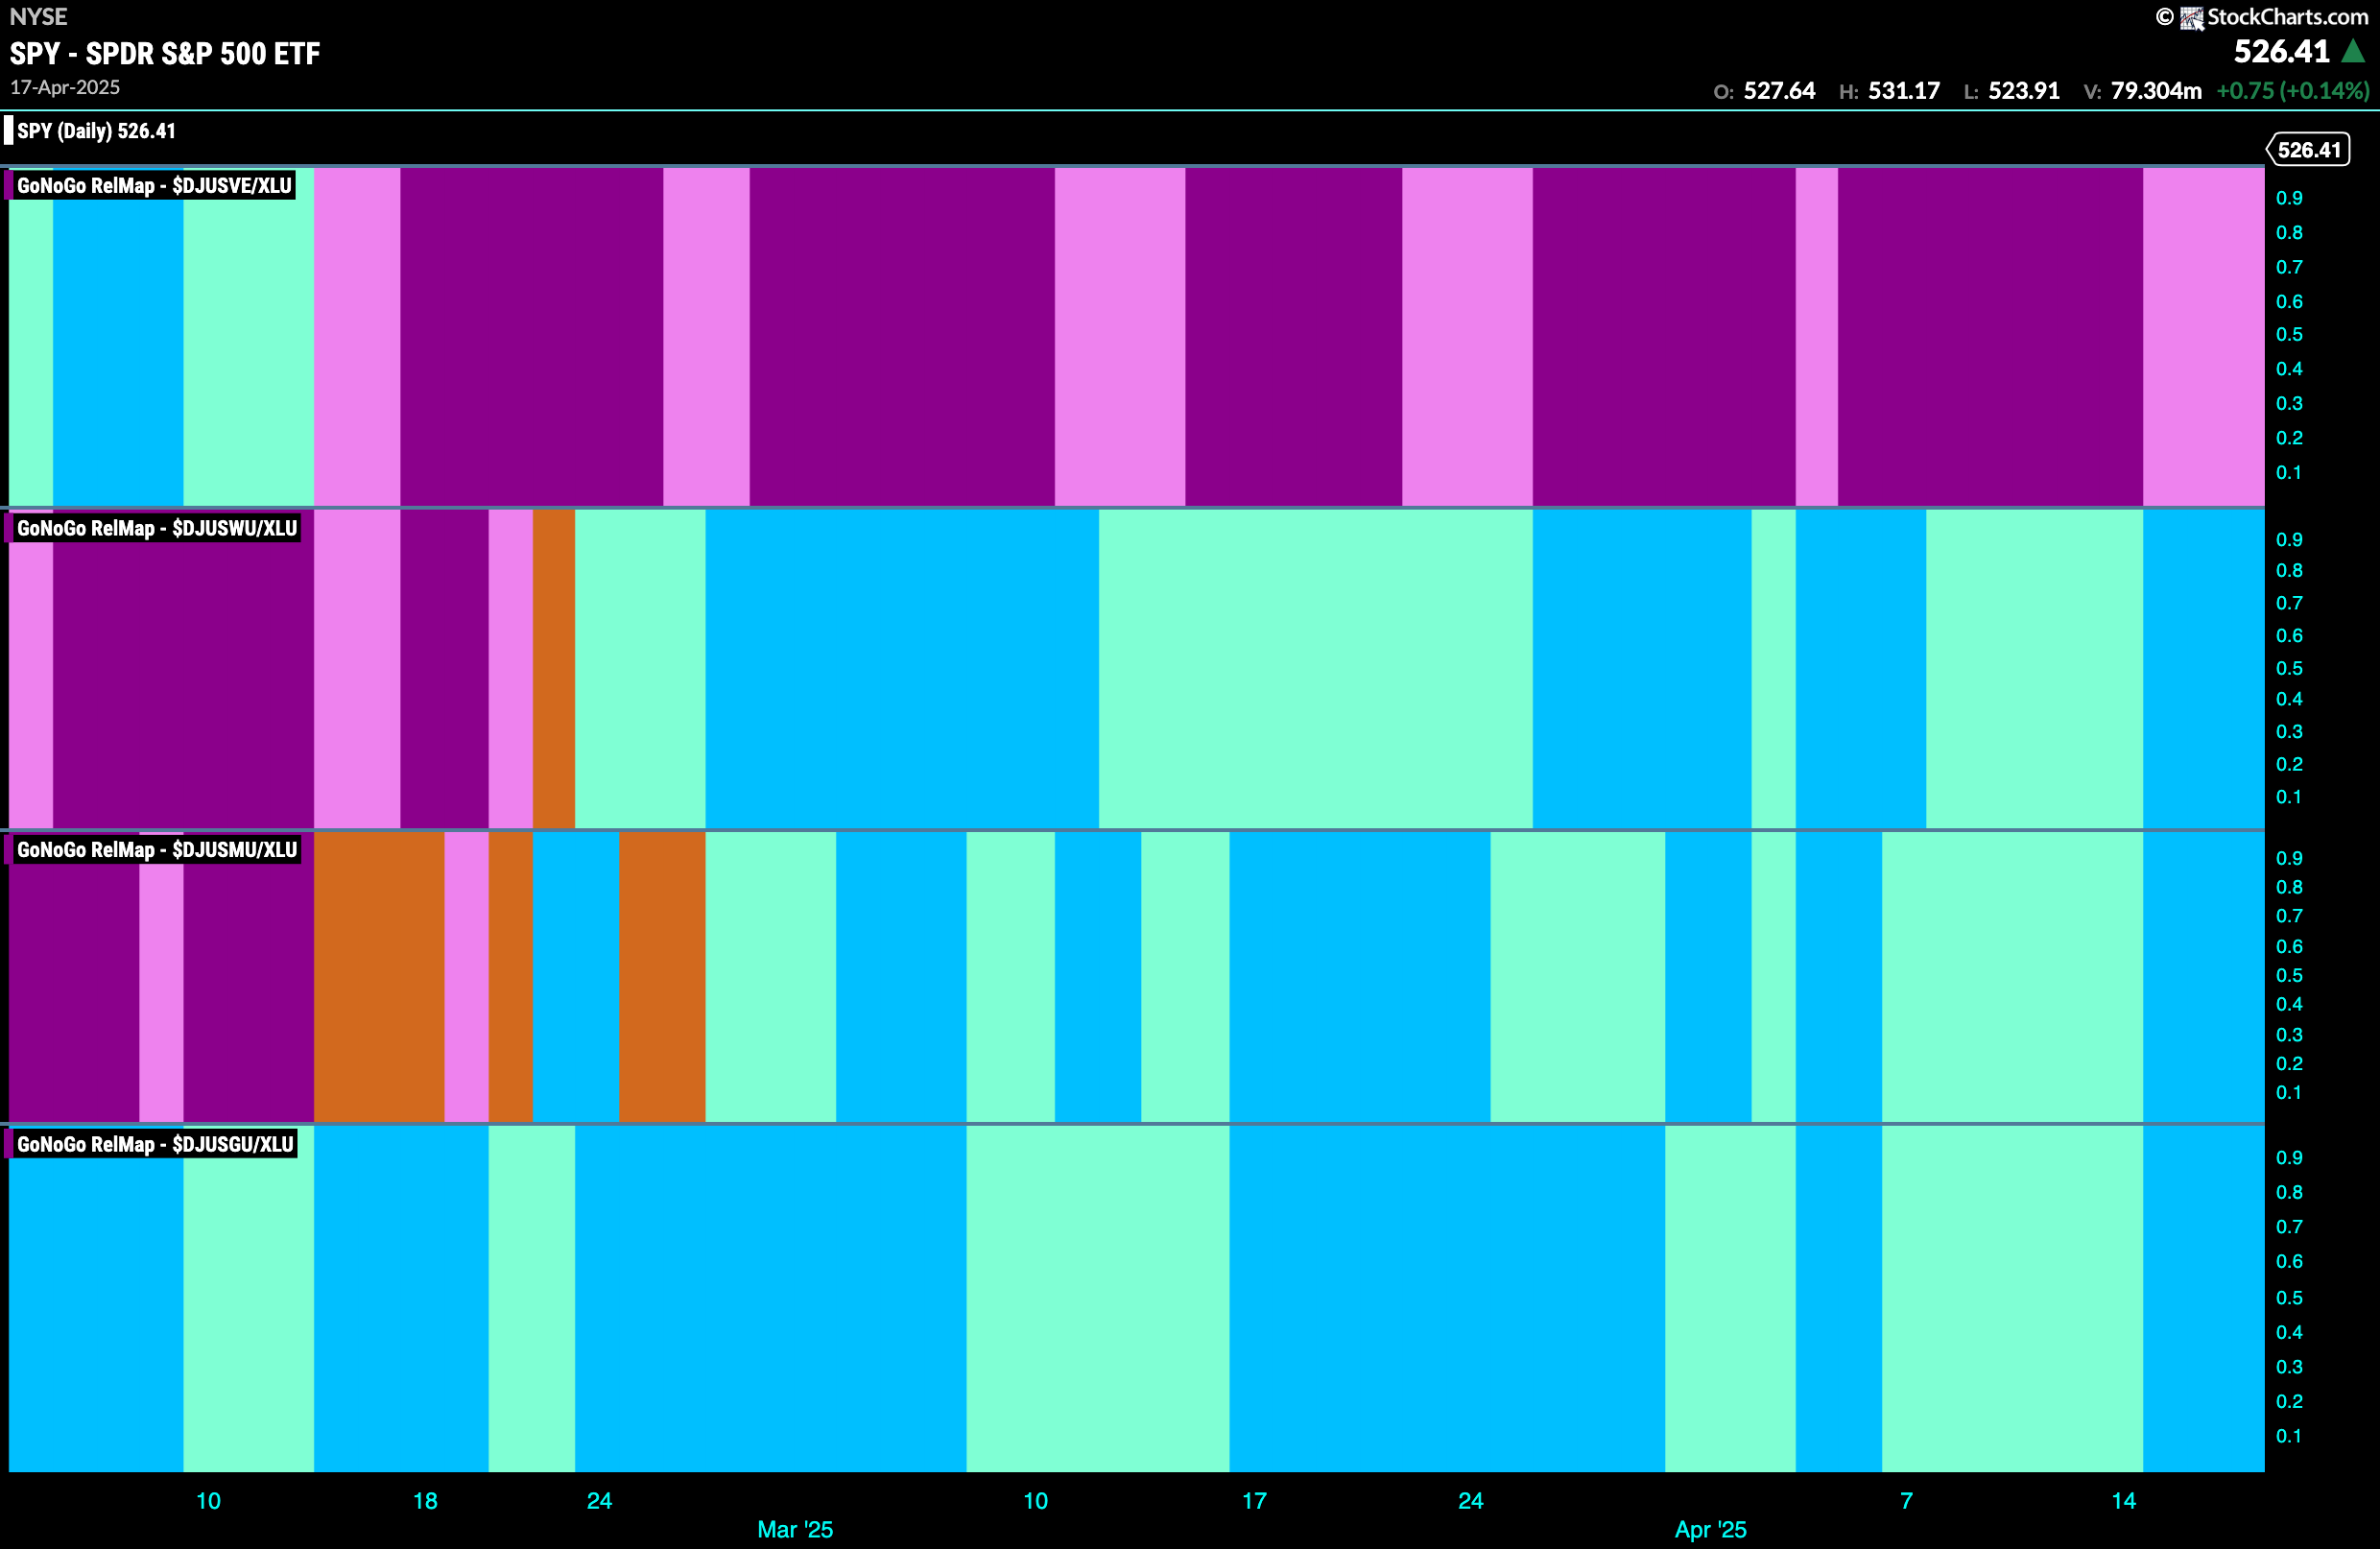
The chart below shows a relative trend breakdown of the sub groups within the utilities sector this week. The Sub-Group RelMap plots the GoNoGo Trend of each sub index to the $XLU. We saw in the above GoNoGo Sector RelMap that $XLU is one of the longest remaining out-performers of the base index. When we look at the below RelMap we can see that in the 3rd panel, the multi utilities index has been out-performing for some time.
$ENGIY Breaks to New High
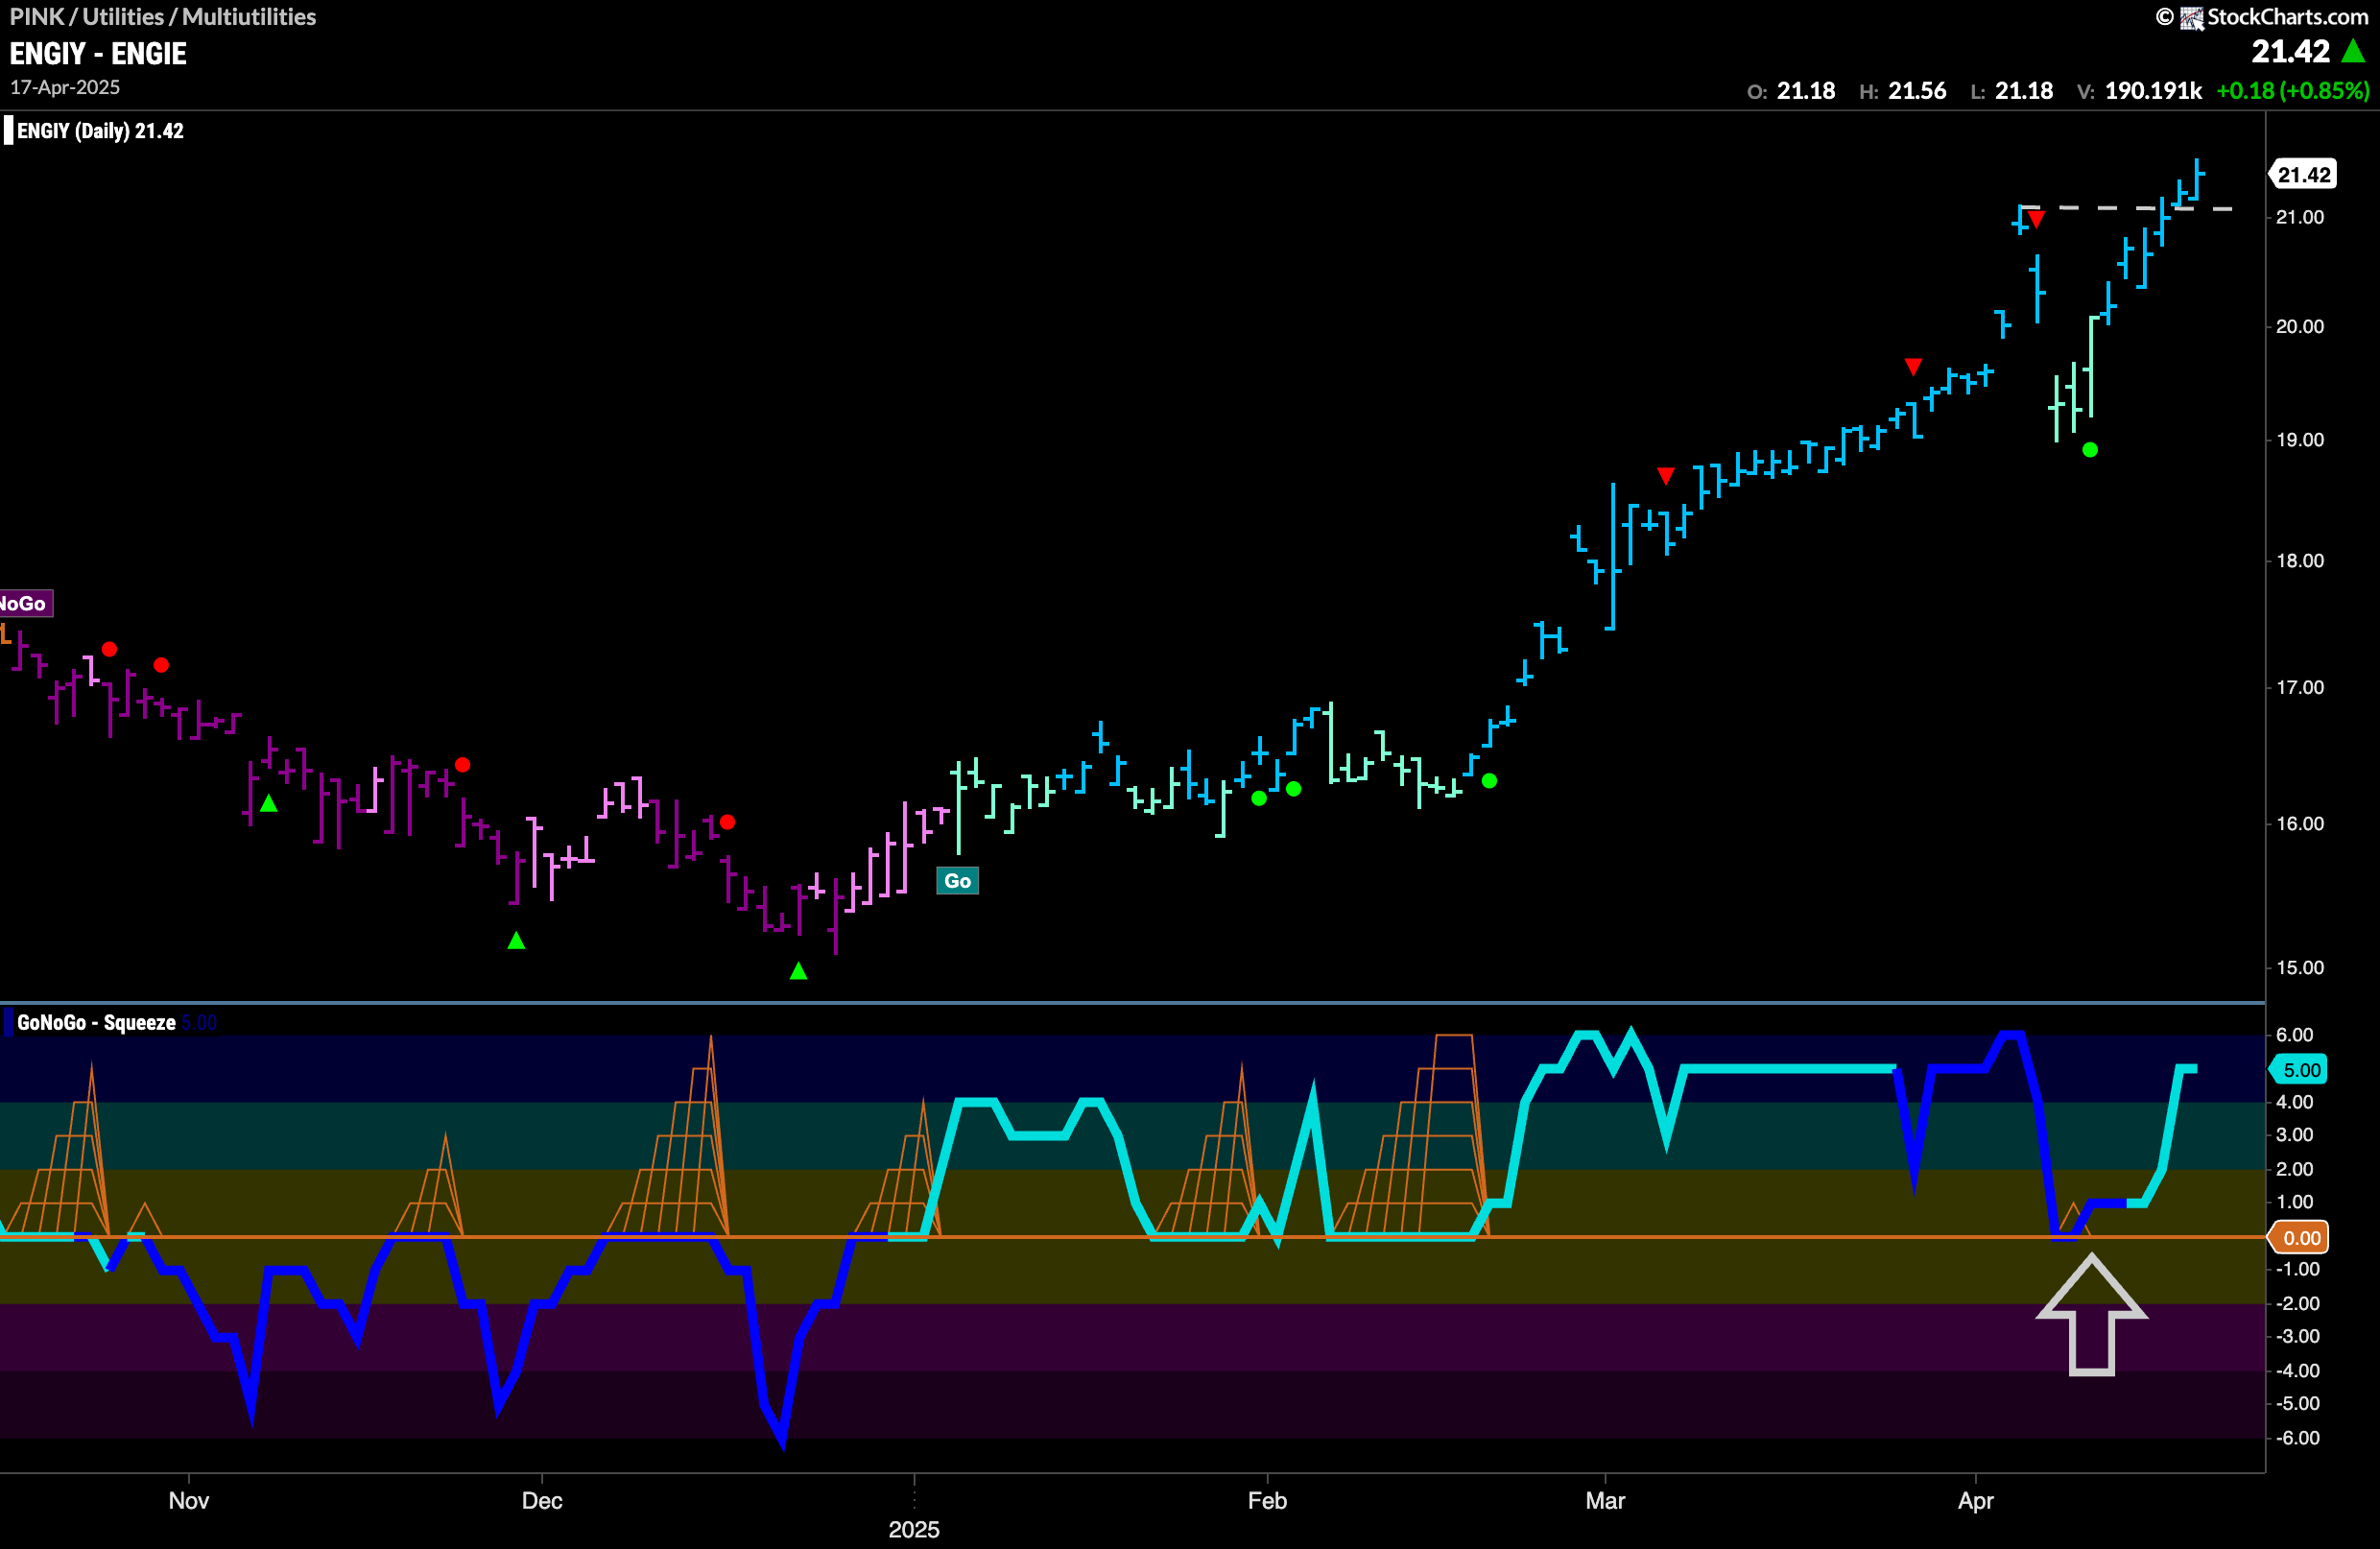
GoNoGo Trend shows that after some weakness just over a week ago, the trend has regained its strength by painting strong blue “Go” bars. This came after GoNoGo Oscillator found support at the zero line. We saw a Go Trend Continuation Icon (green circle) telling us that momentum was resurgent in the direction of the underlying “Go” trend. This gave price the push it needed to challenge the prior high. We will watch to see if price can consolidate now at these elevated levels.
$RNW Flags New “Go” Trend
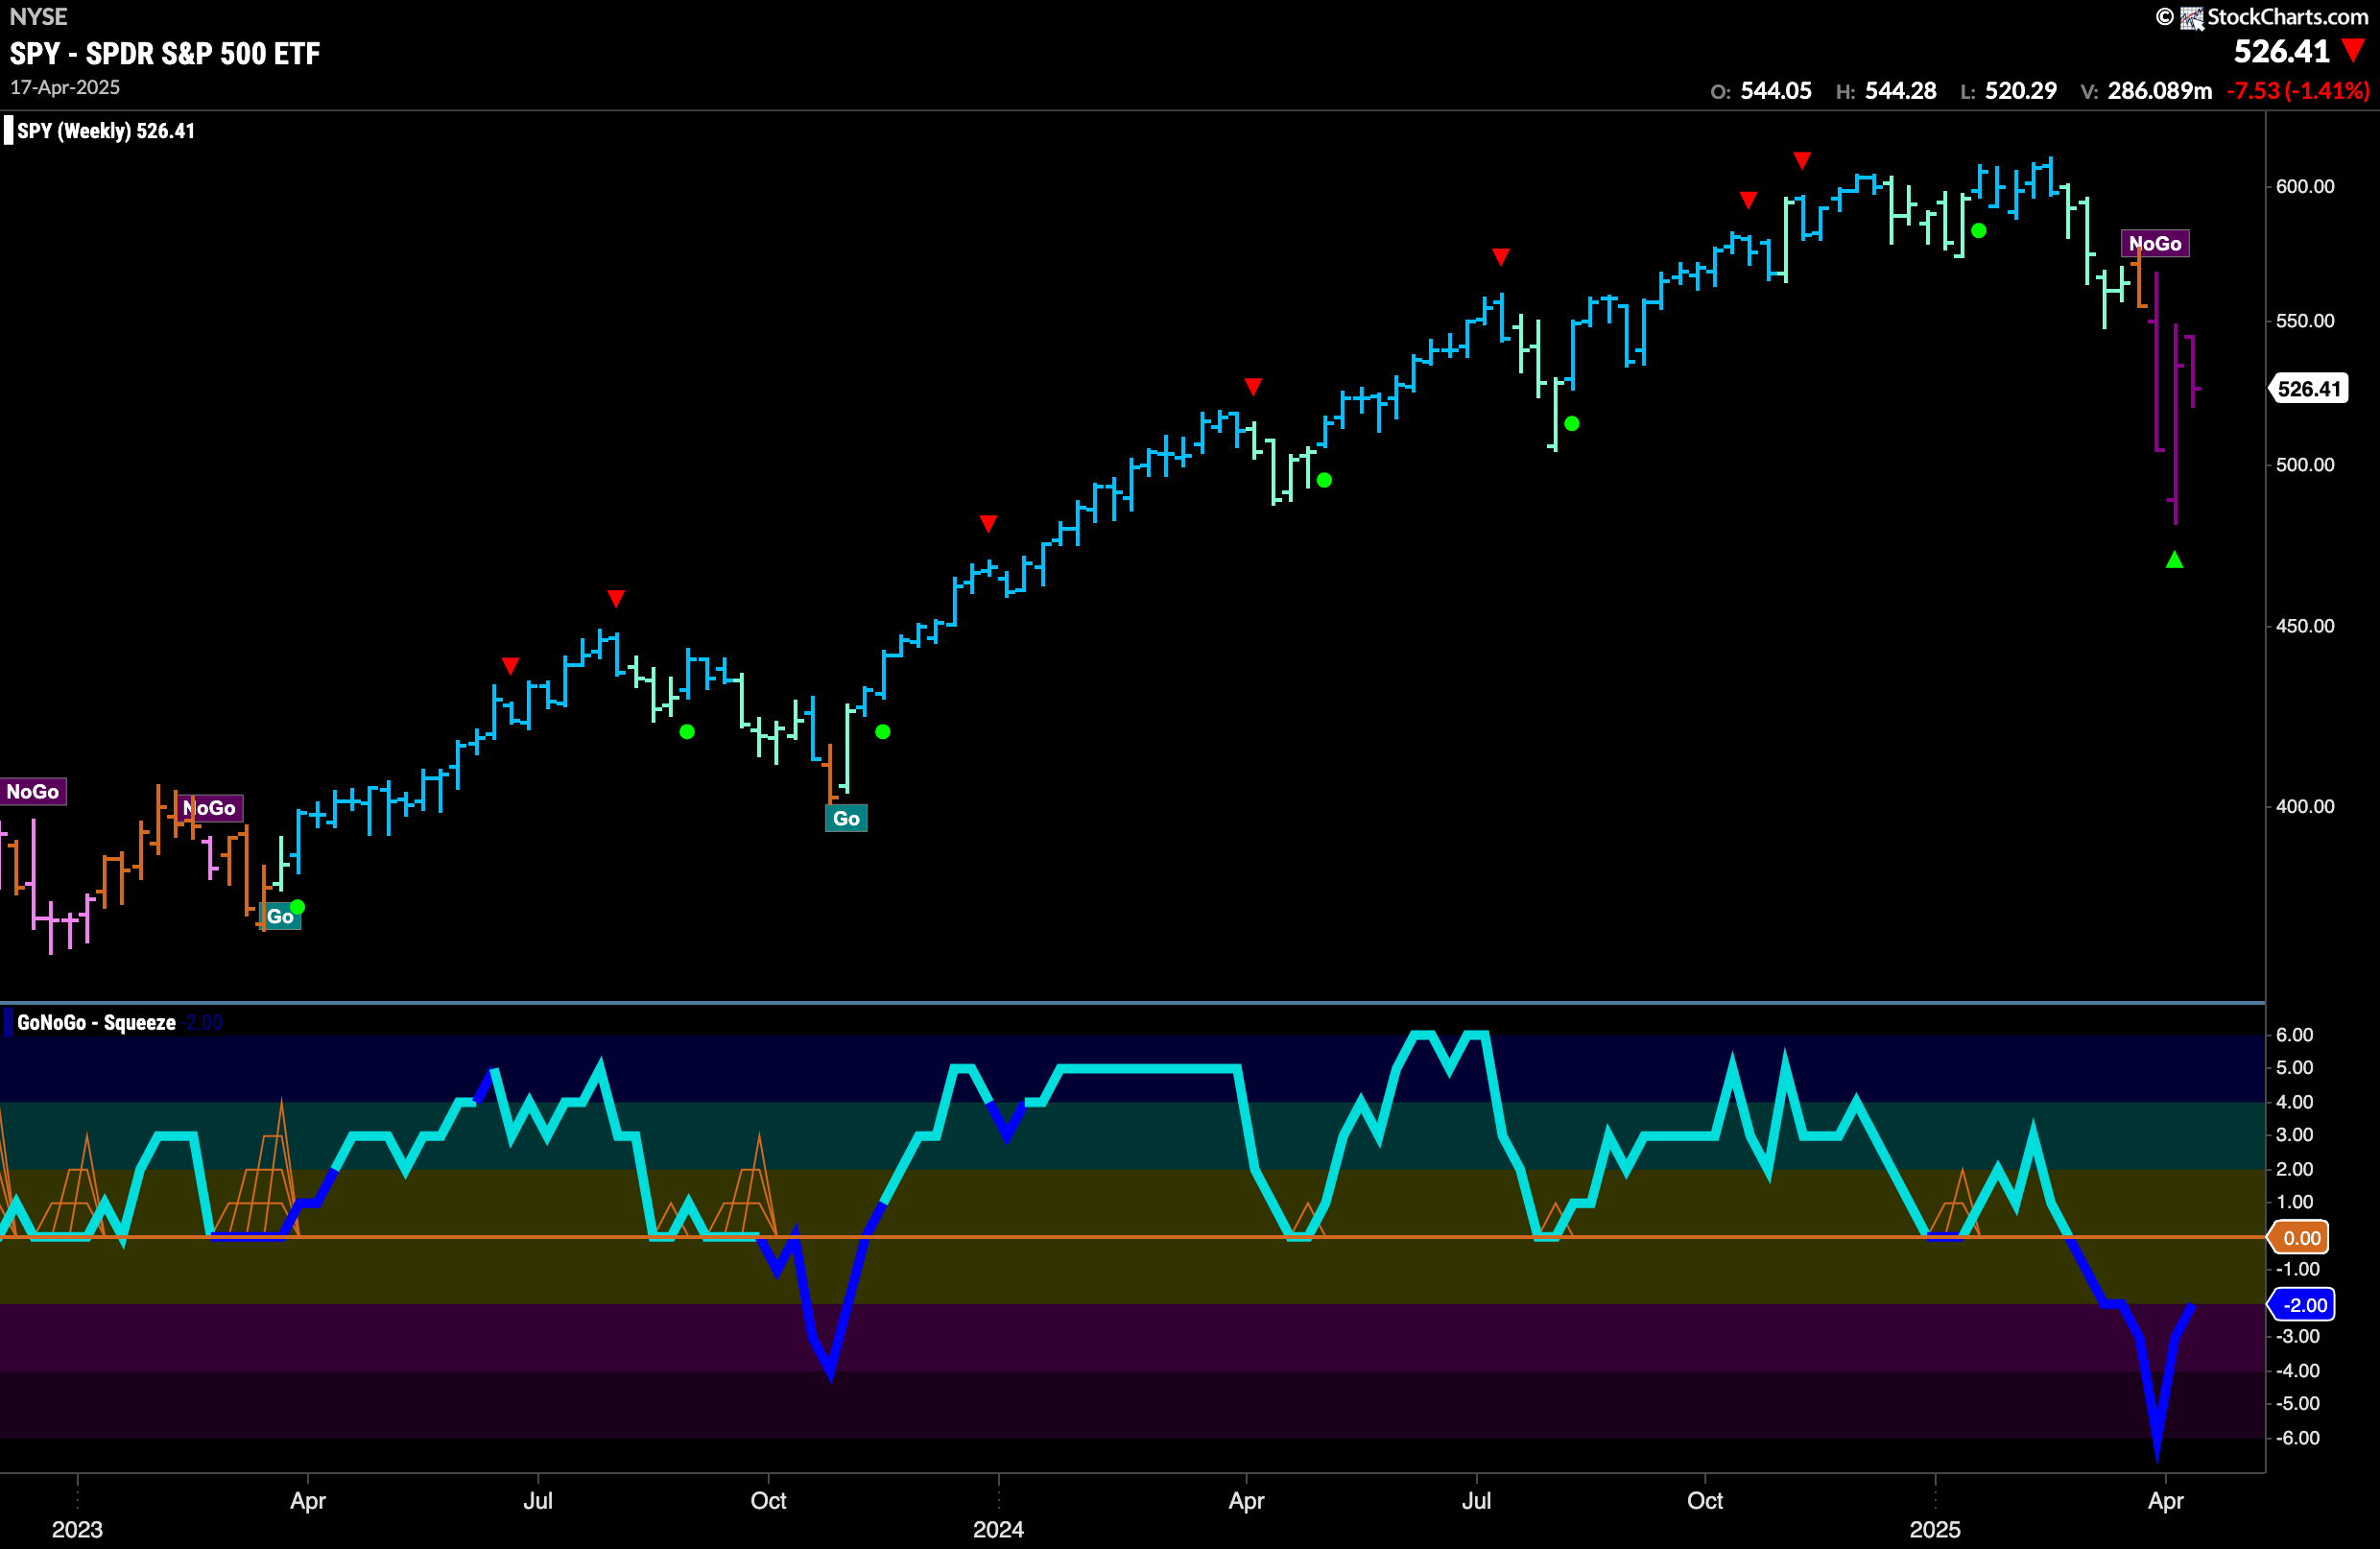
The chart below of $RNW shows that after a prolonged “NoGo” trend the indicator has spotted a change. First we saw GoNoGo Oscillator rally back into positive territory on heavy volume. This was quickly followed by the GoNoGo Trend indicator painting a first aqua “Go” bar as price tries to break above downward sloping resistance. With momentum confirming the new “Go” trend, we will look to see if price can climb further from here.
