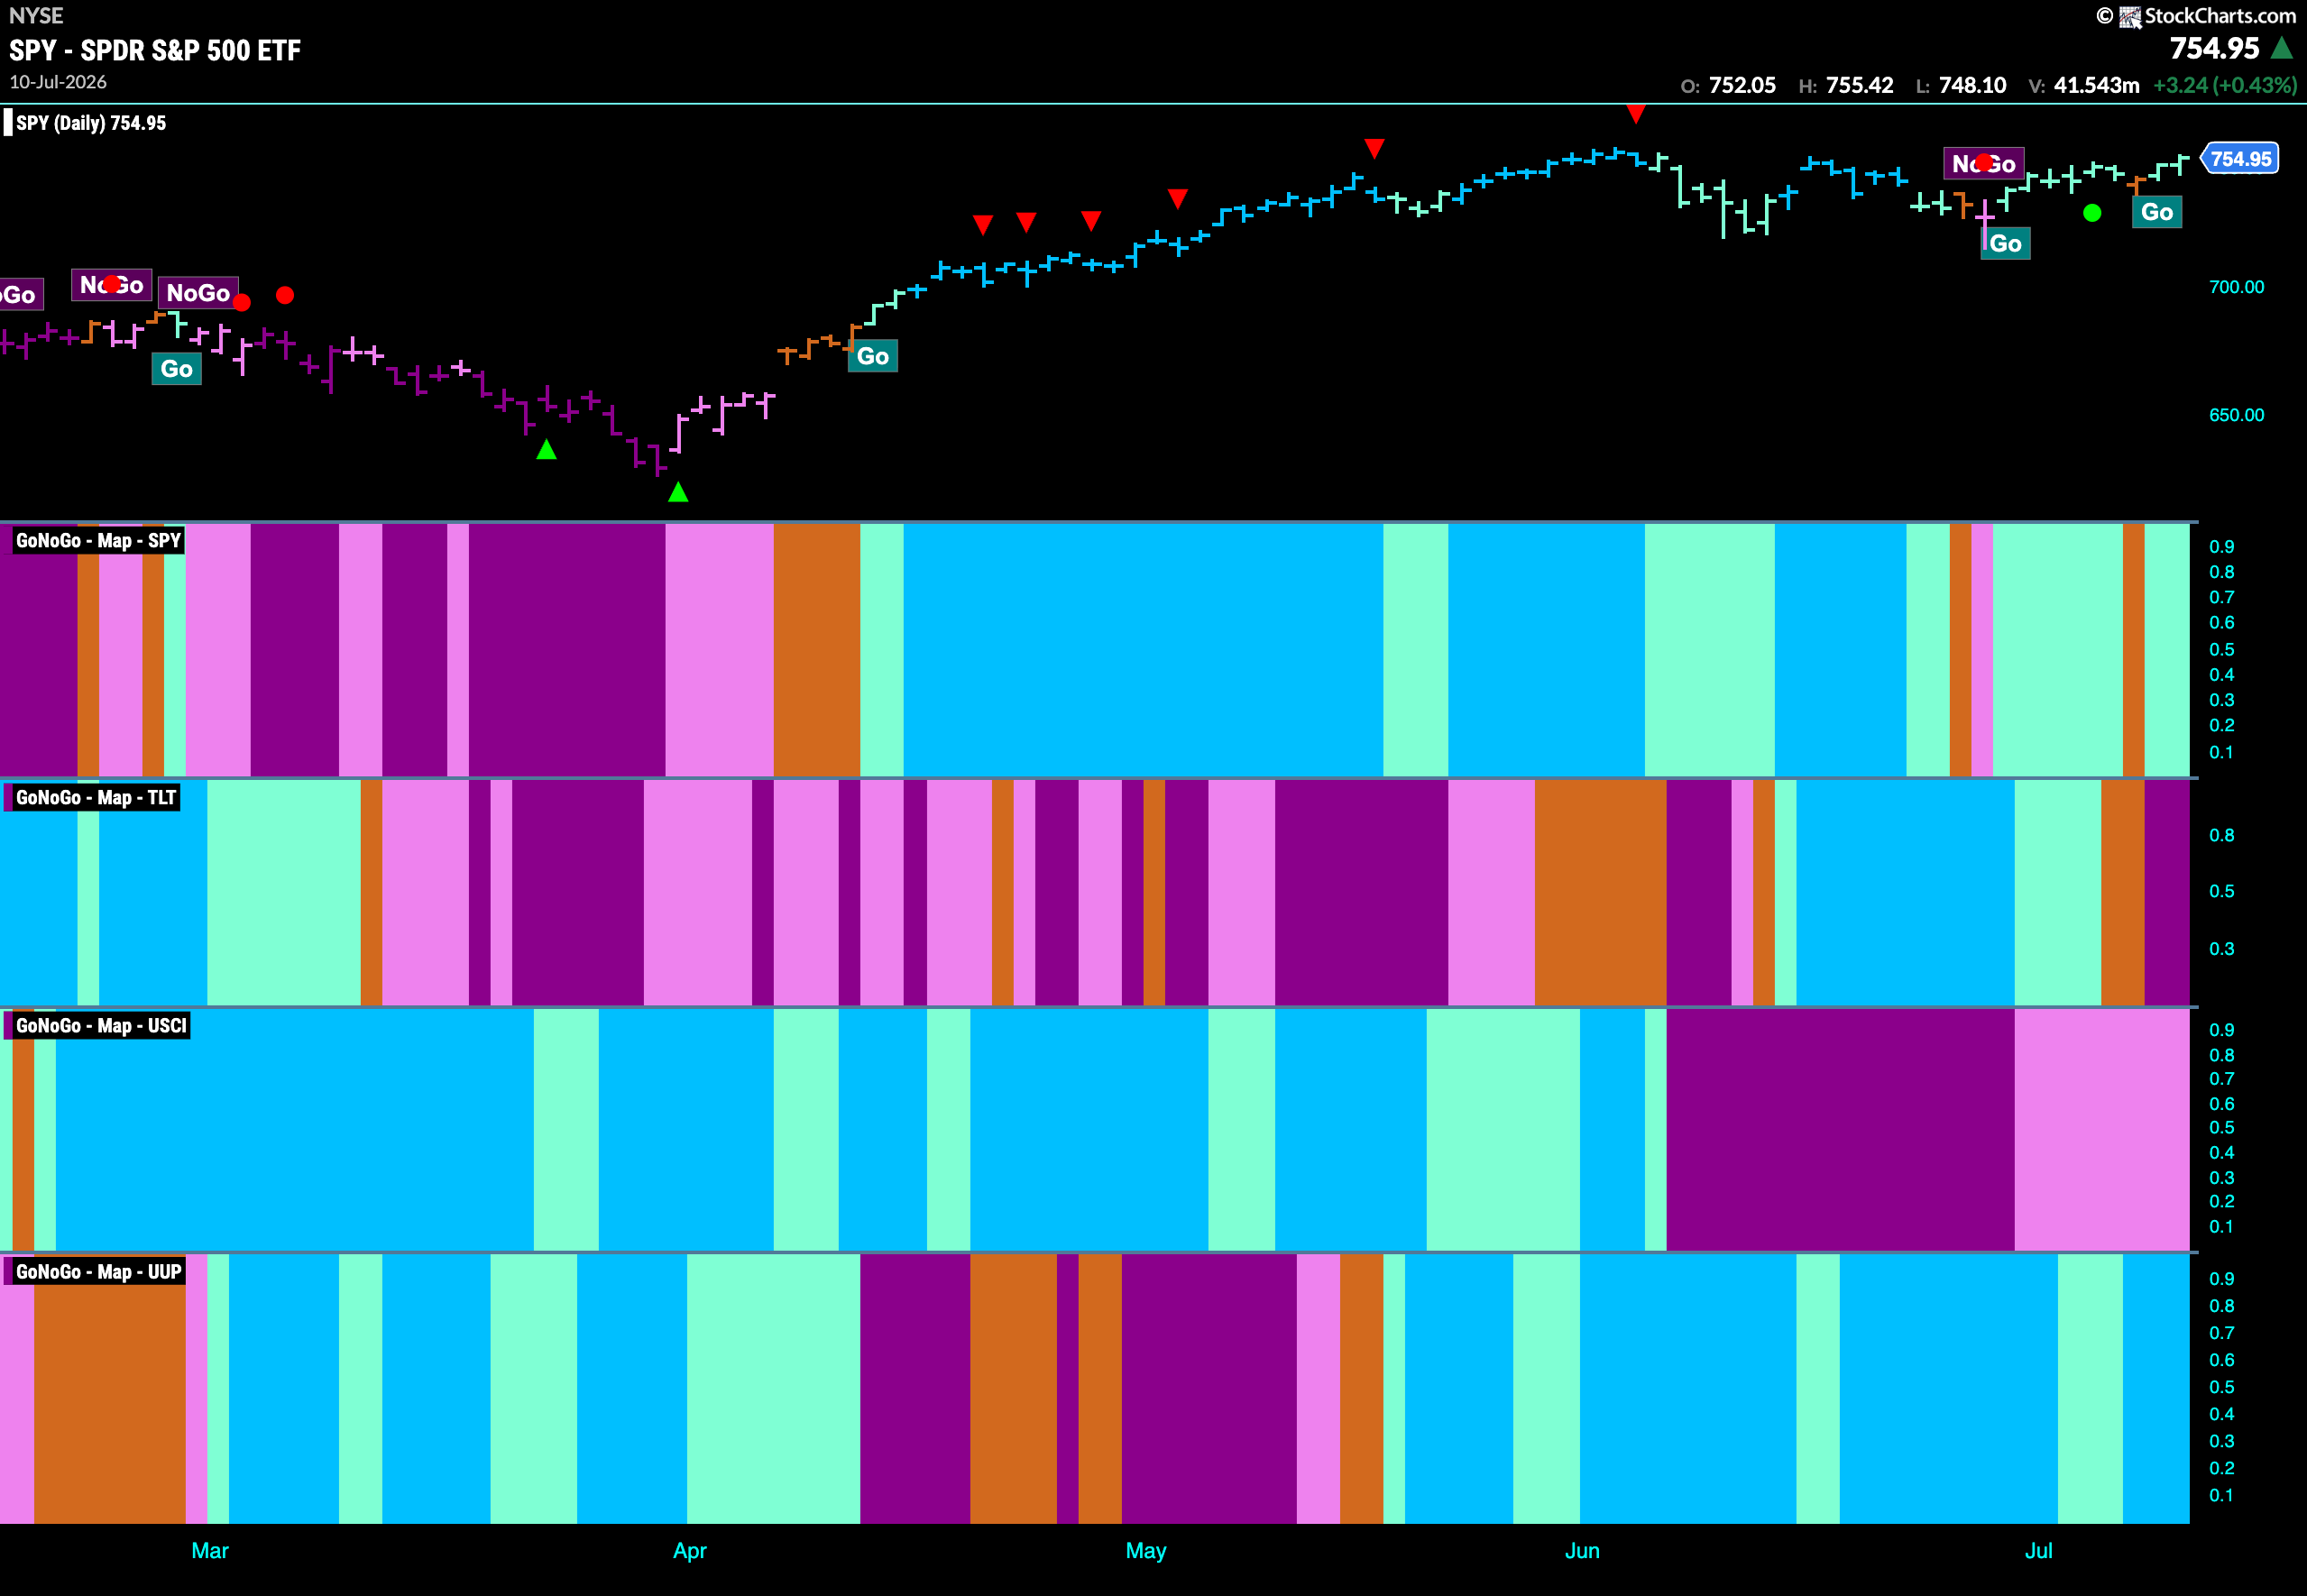
Good morning and welcome to this week’s Flight Path. The equity showed another amber “Go Fish” bar of uncertainty but aqua “Go” bars persisted by the end of the week. Treasury bond prices painted strong “NoGo” bars after a few amber “Go Fish”. U.S. commodities painted another week of “NoGo” bars but they were weaker pink bars. The dollar remained in a “Go” trend and as the week progressed we saw strength return as the indicator painted bright blue bars.
$SPY Hangs on to “Go” Trend
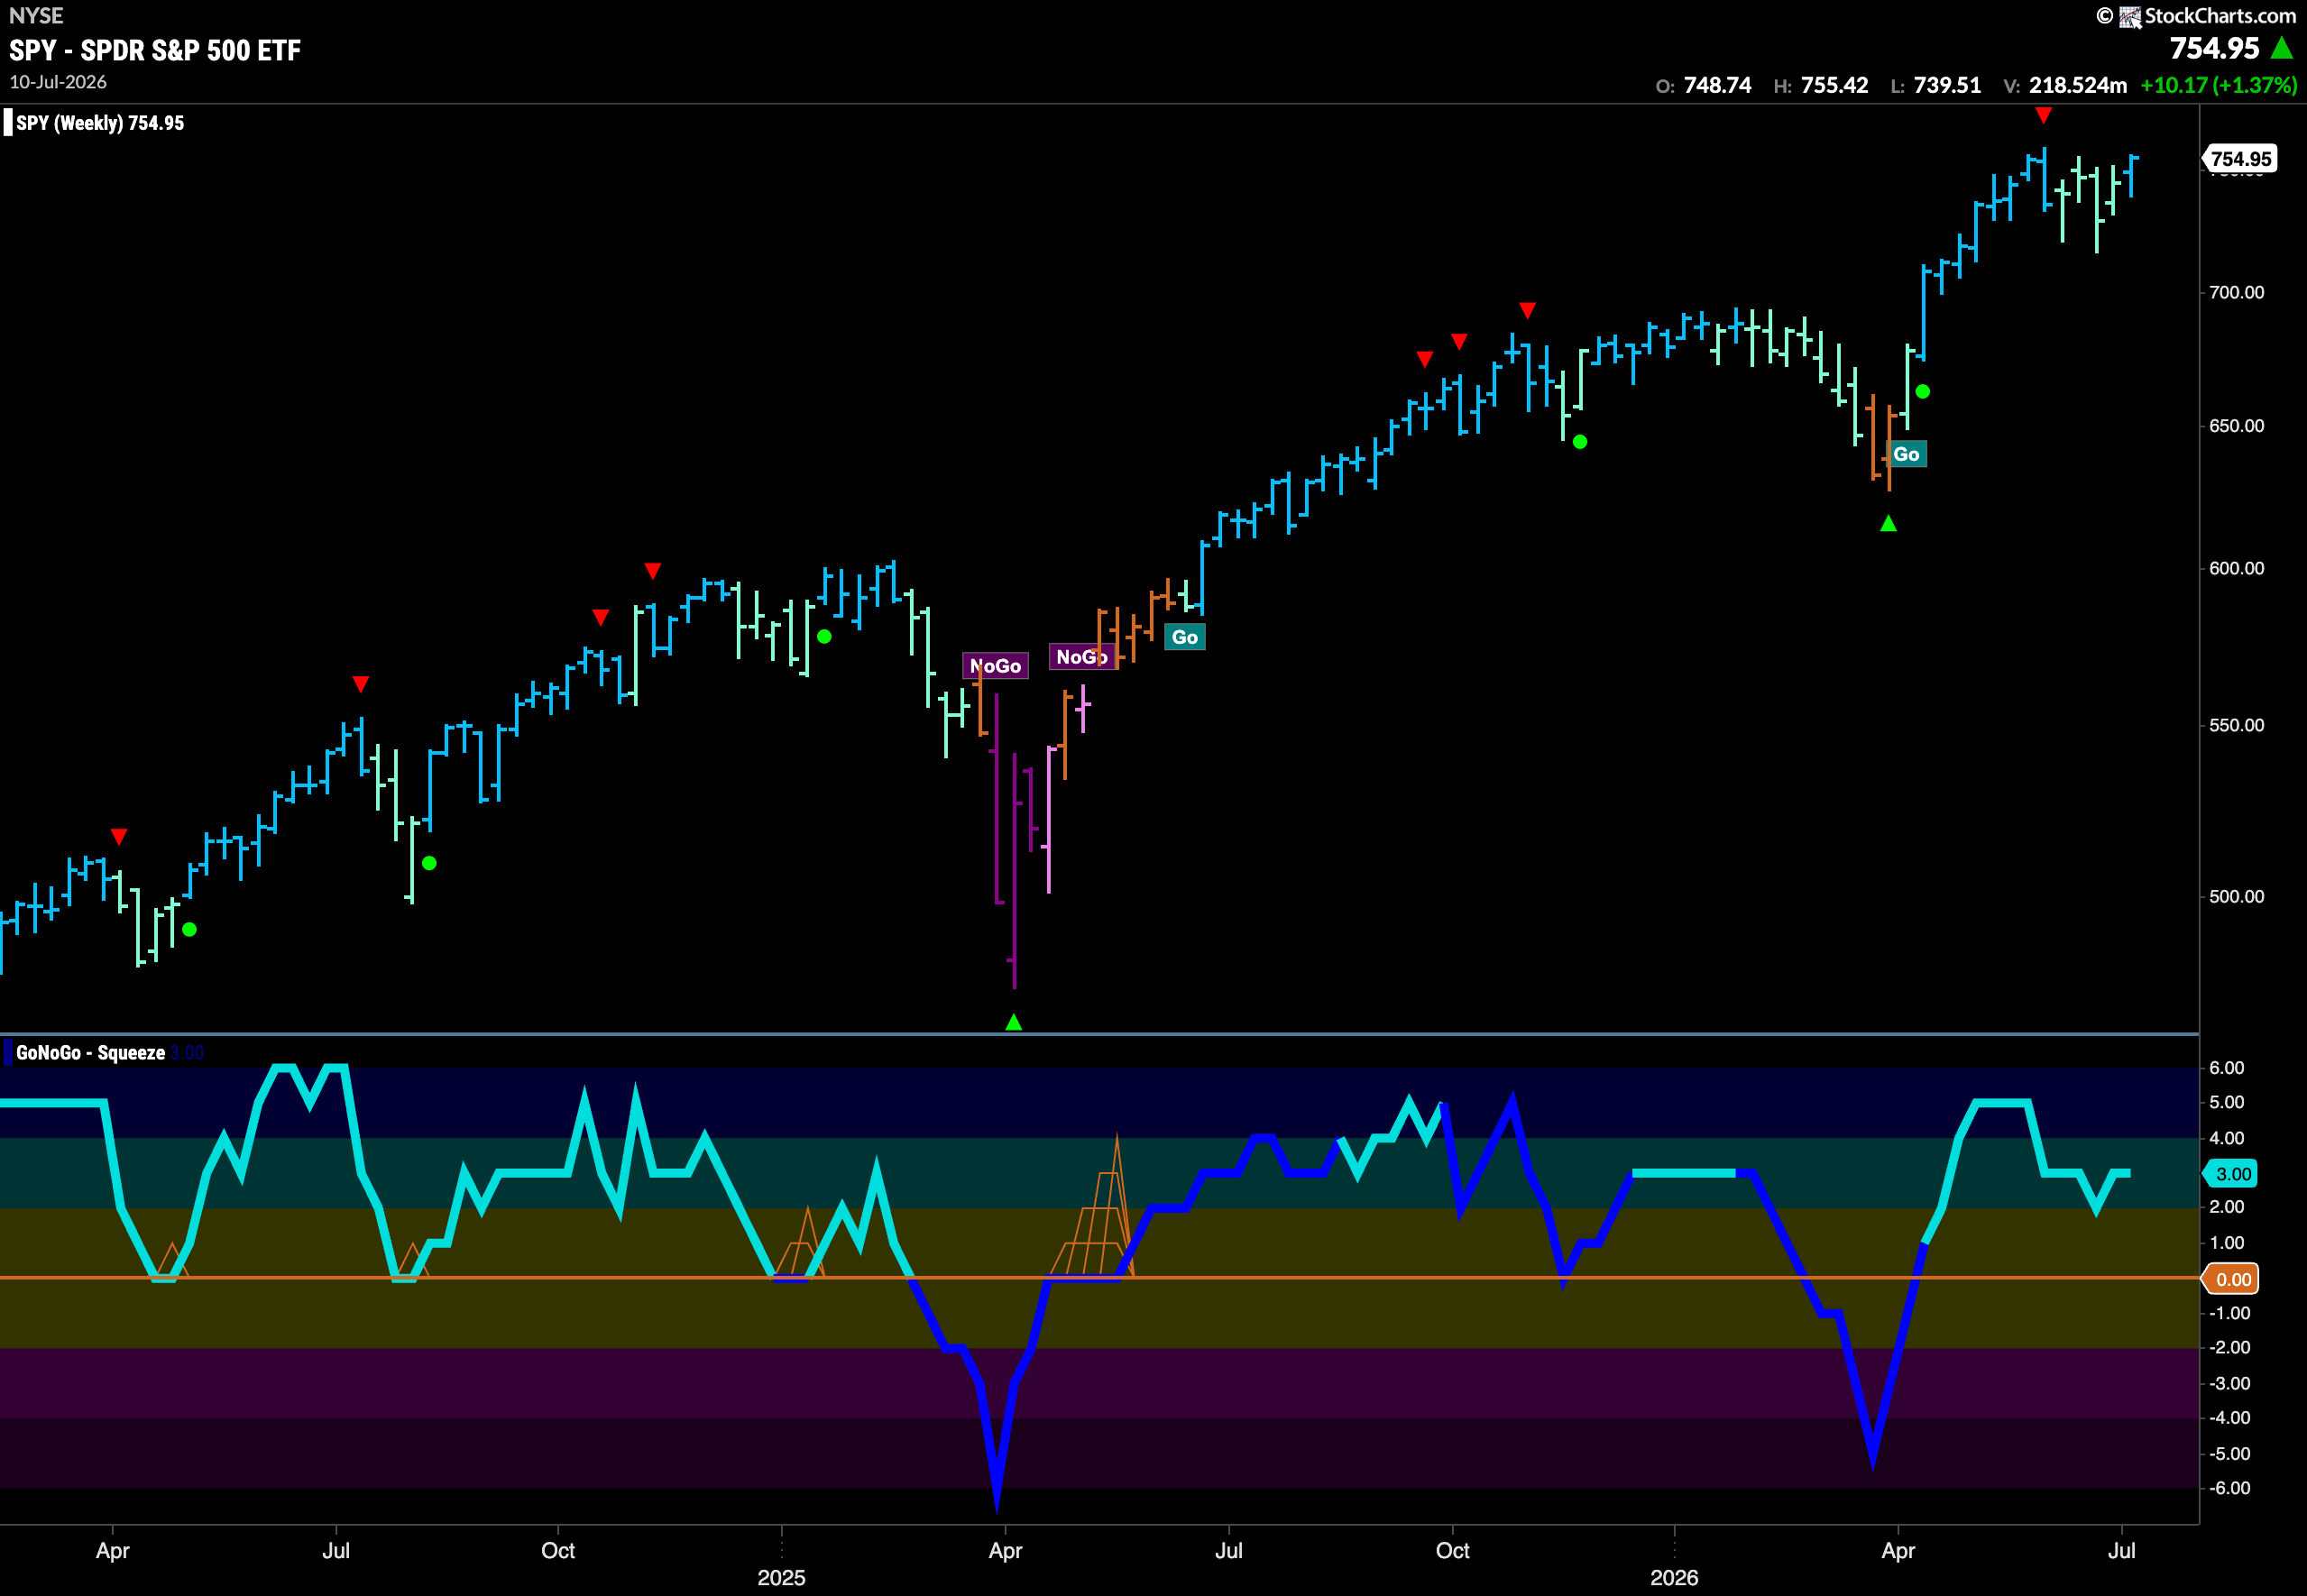
The GoNoGo chart below shows that price continued to carefully rally from the last low and after a single “Go Fish” bar reflecting market uncertainty we saw the “Go” trend survive the week with more aqua bars. If we turn our eye to the lower panel we see that the Oscillator has found its way more comfortably into positive territory and is now at a value of 3.
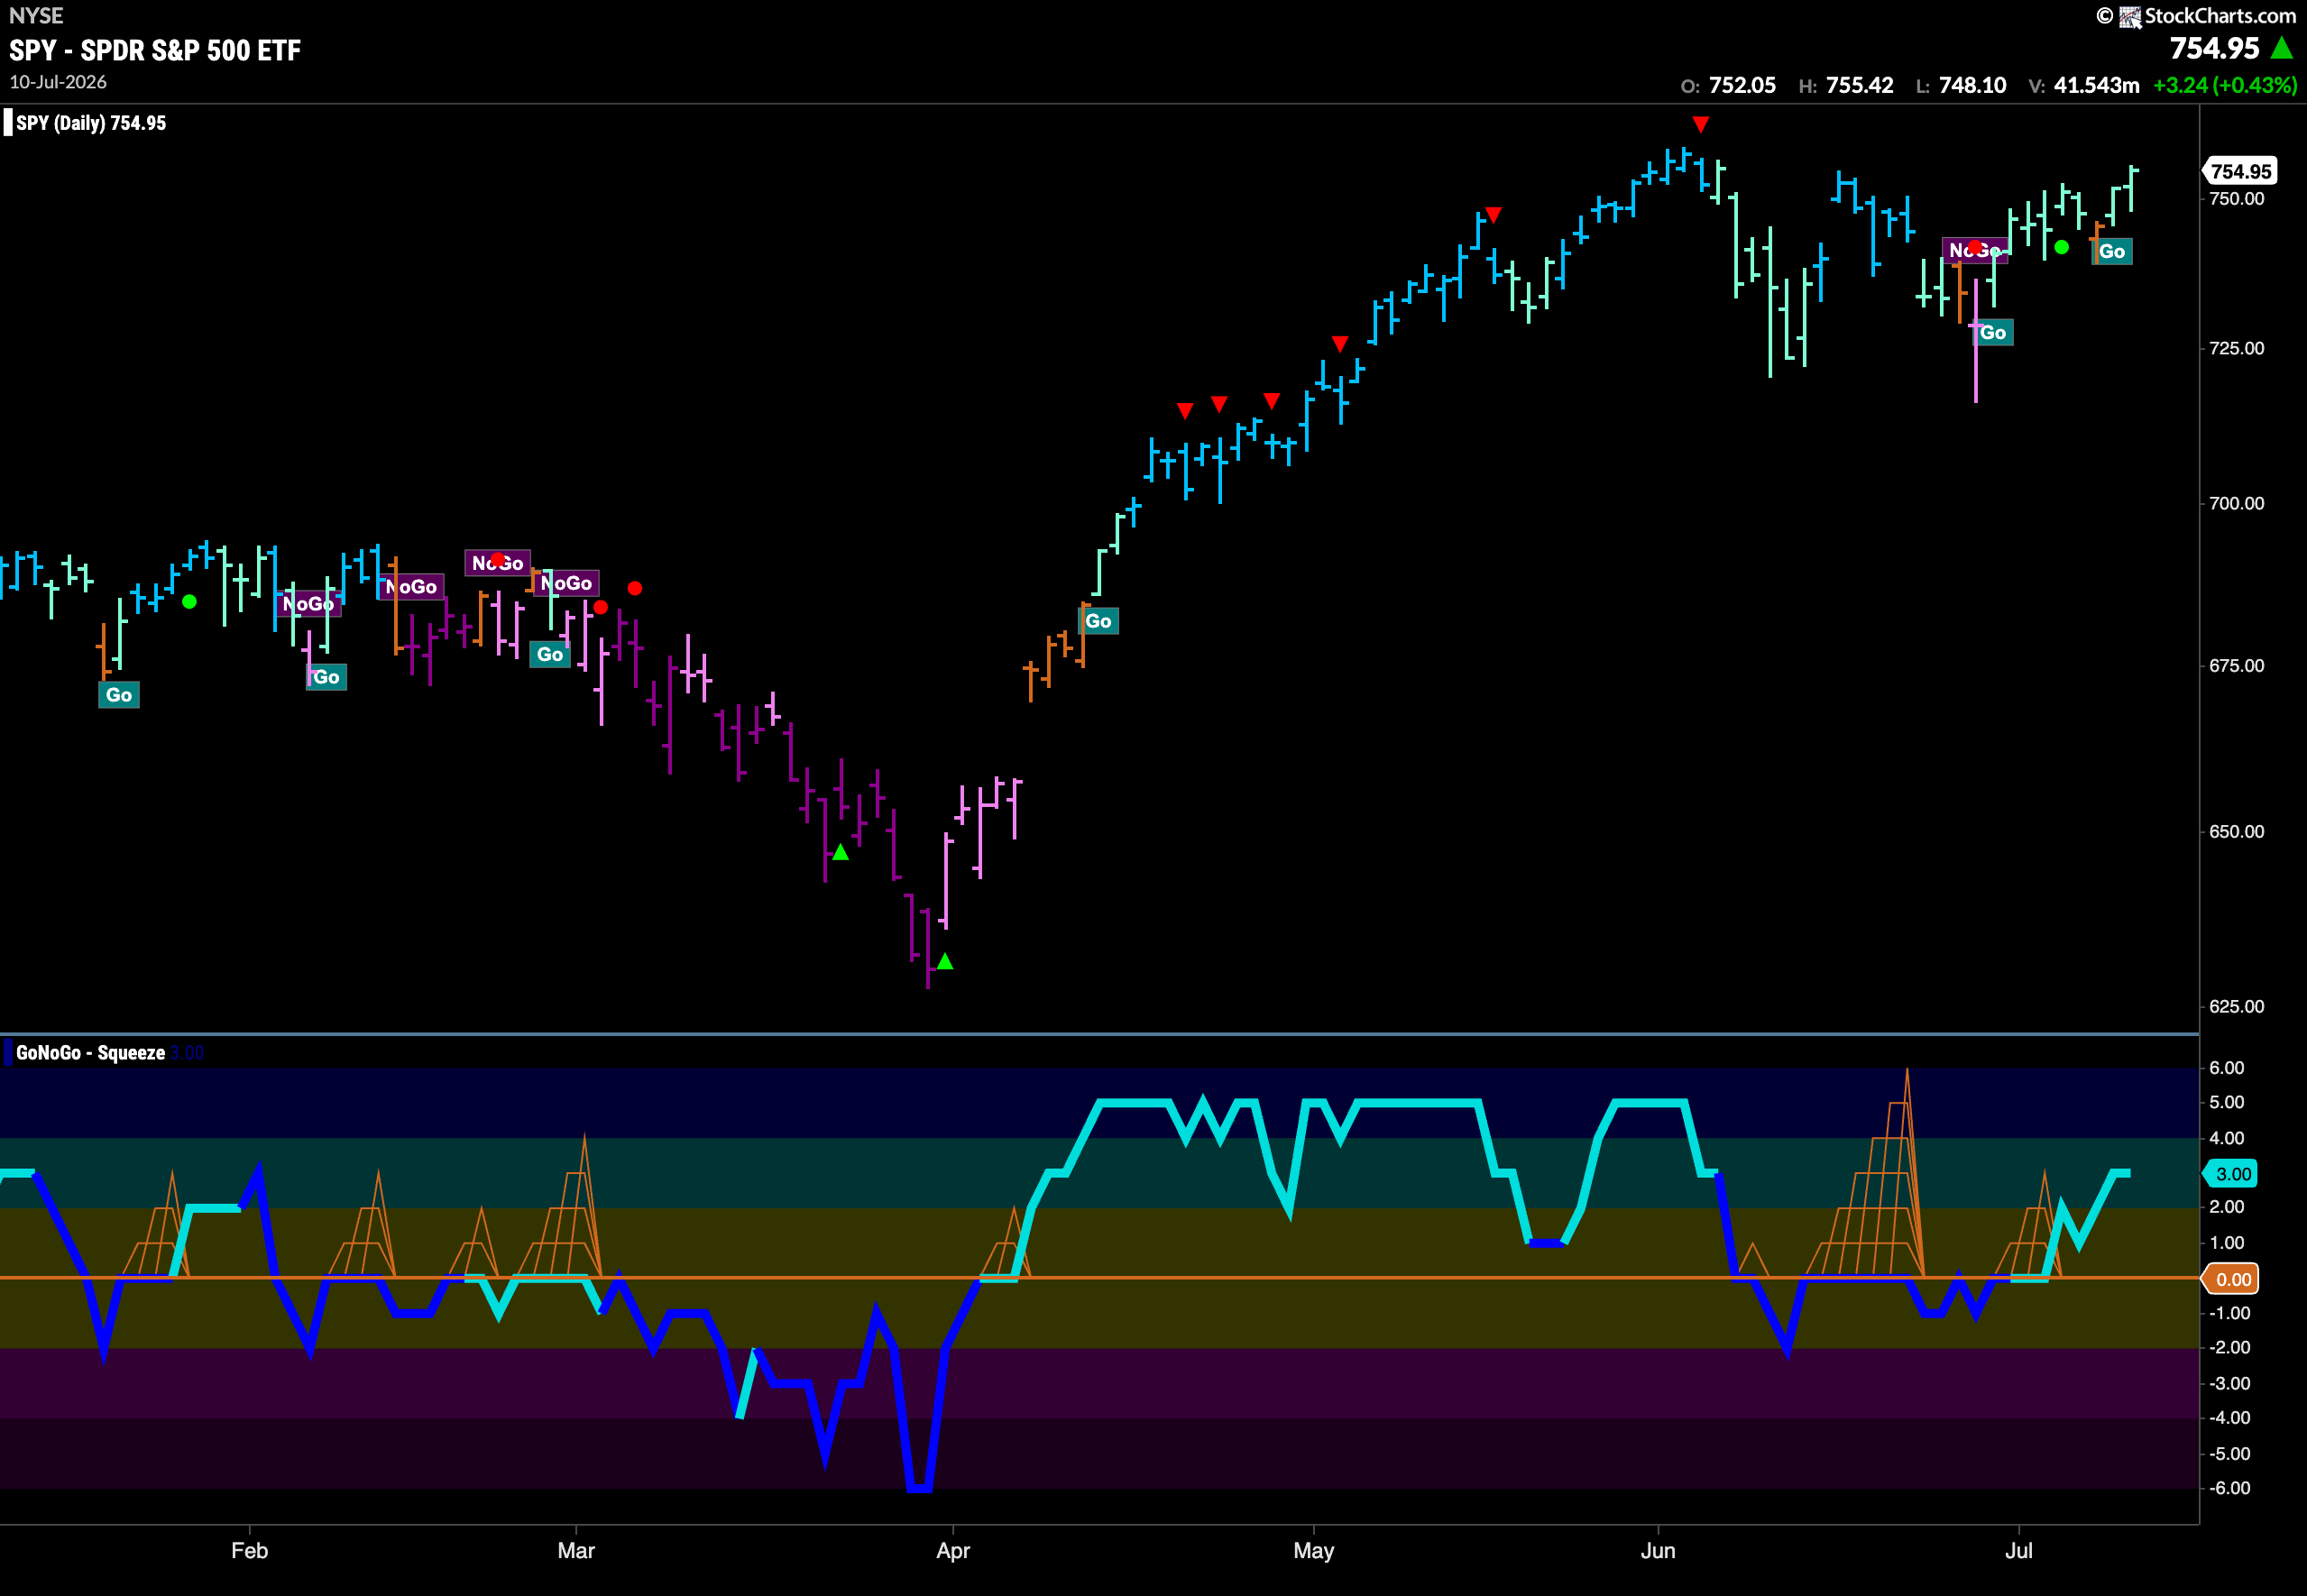
The weekly chart shows that the “Go” trend has closed higher again this week and not only survived but strengthened. We see a first strong blue “Go” bar after a month of weakness as price pushes closer to the last high. GoNoGo Oscillator is in positive territory but not yet overbought at a value of 3.
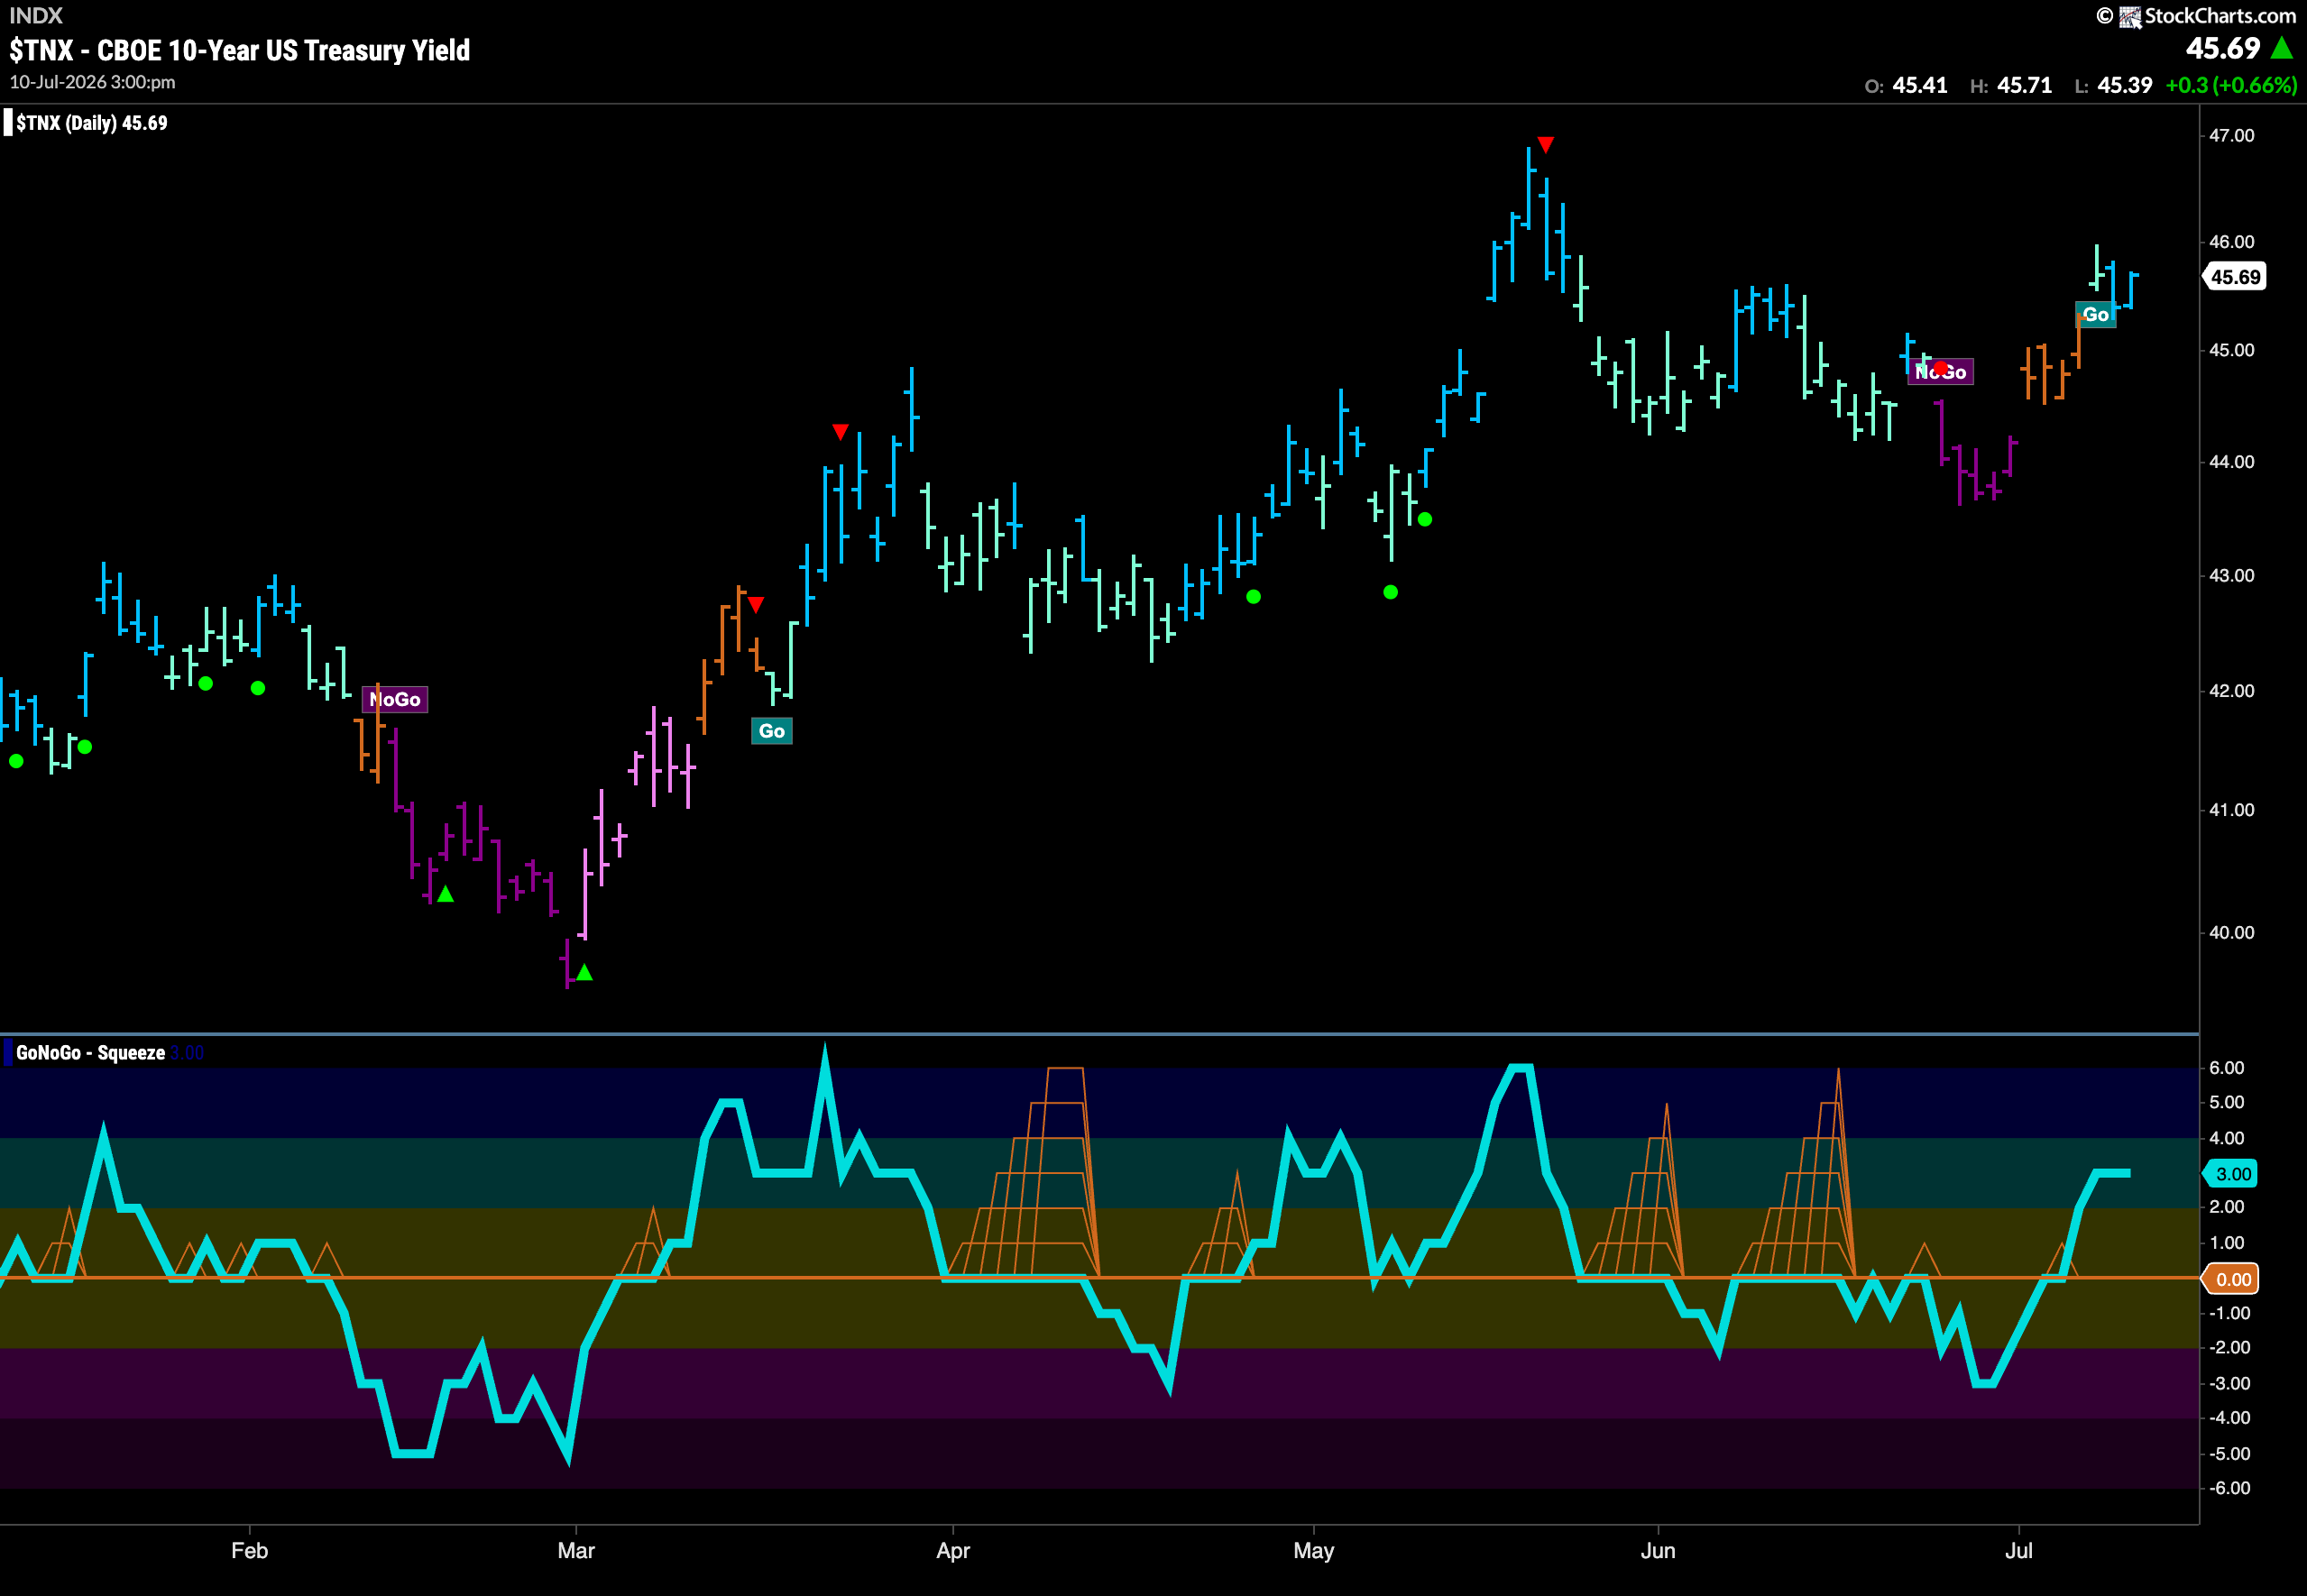
Treasury Rates Return to a “Go” Trend
GoNoGo Trend shows that a “Go” trend for rates has emerged from several consecutive amber “Go Fish” bars and the indicator is now painting strong blue bar after first entering a “Go” trend with an aqua bar. This comes after GoNoGo Oscillator broke back through the zero line into positive territory and is now at a value of 3. We know that momentum is therefore confirming the new “Go” trend that we see in the upper panel.
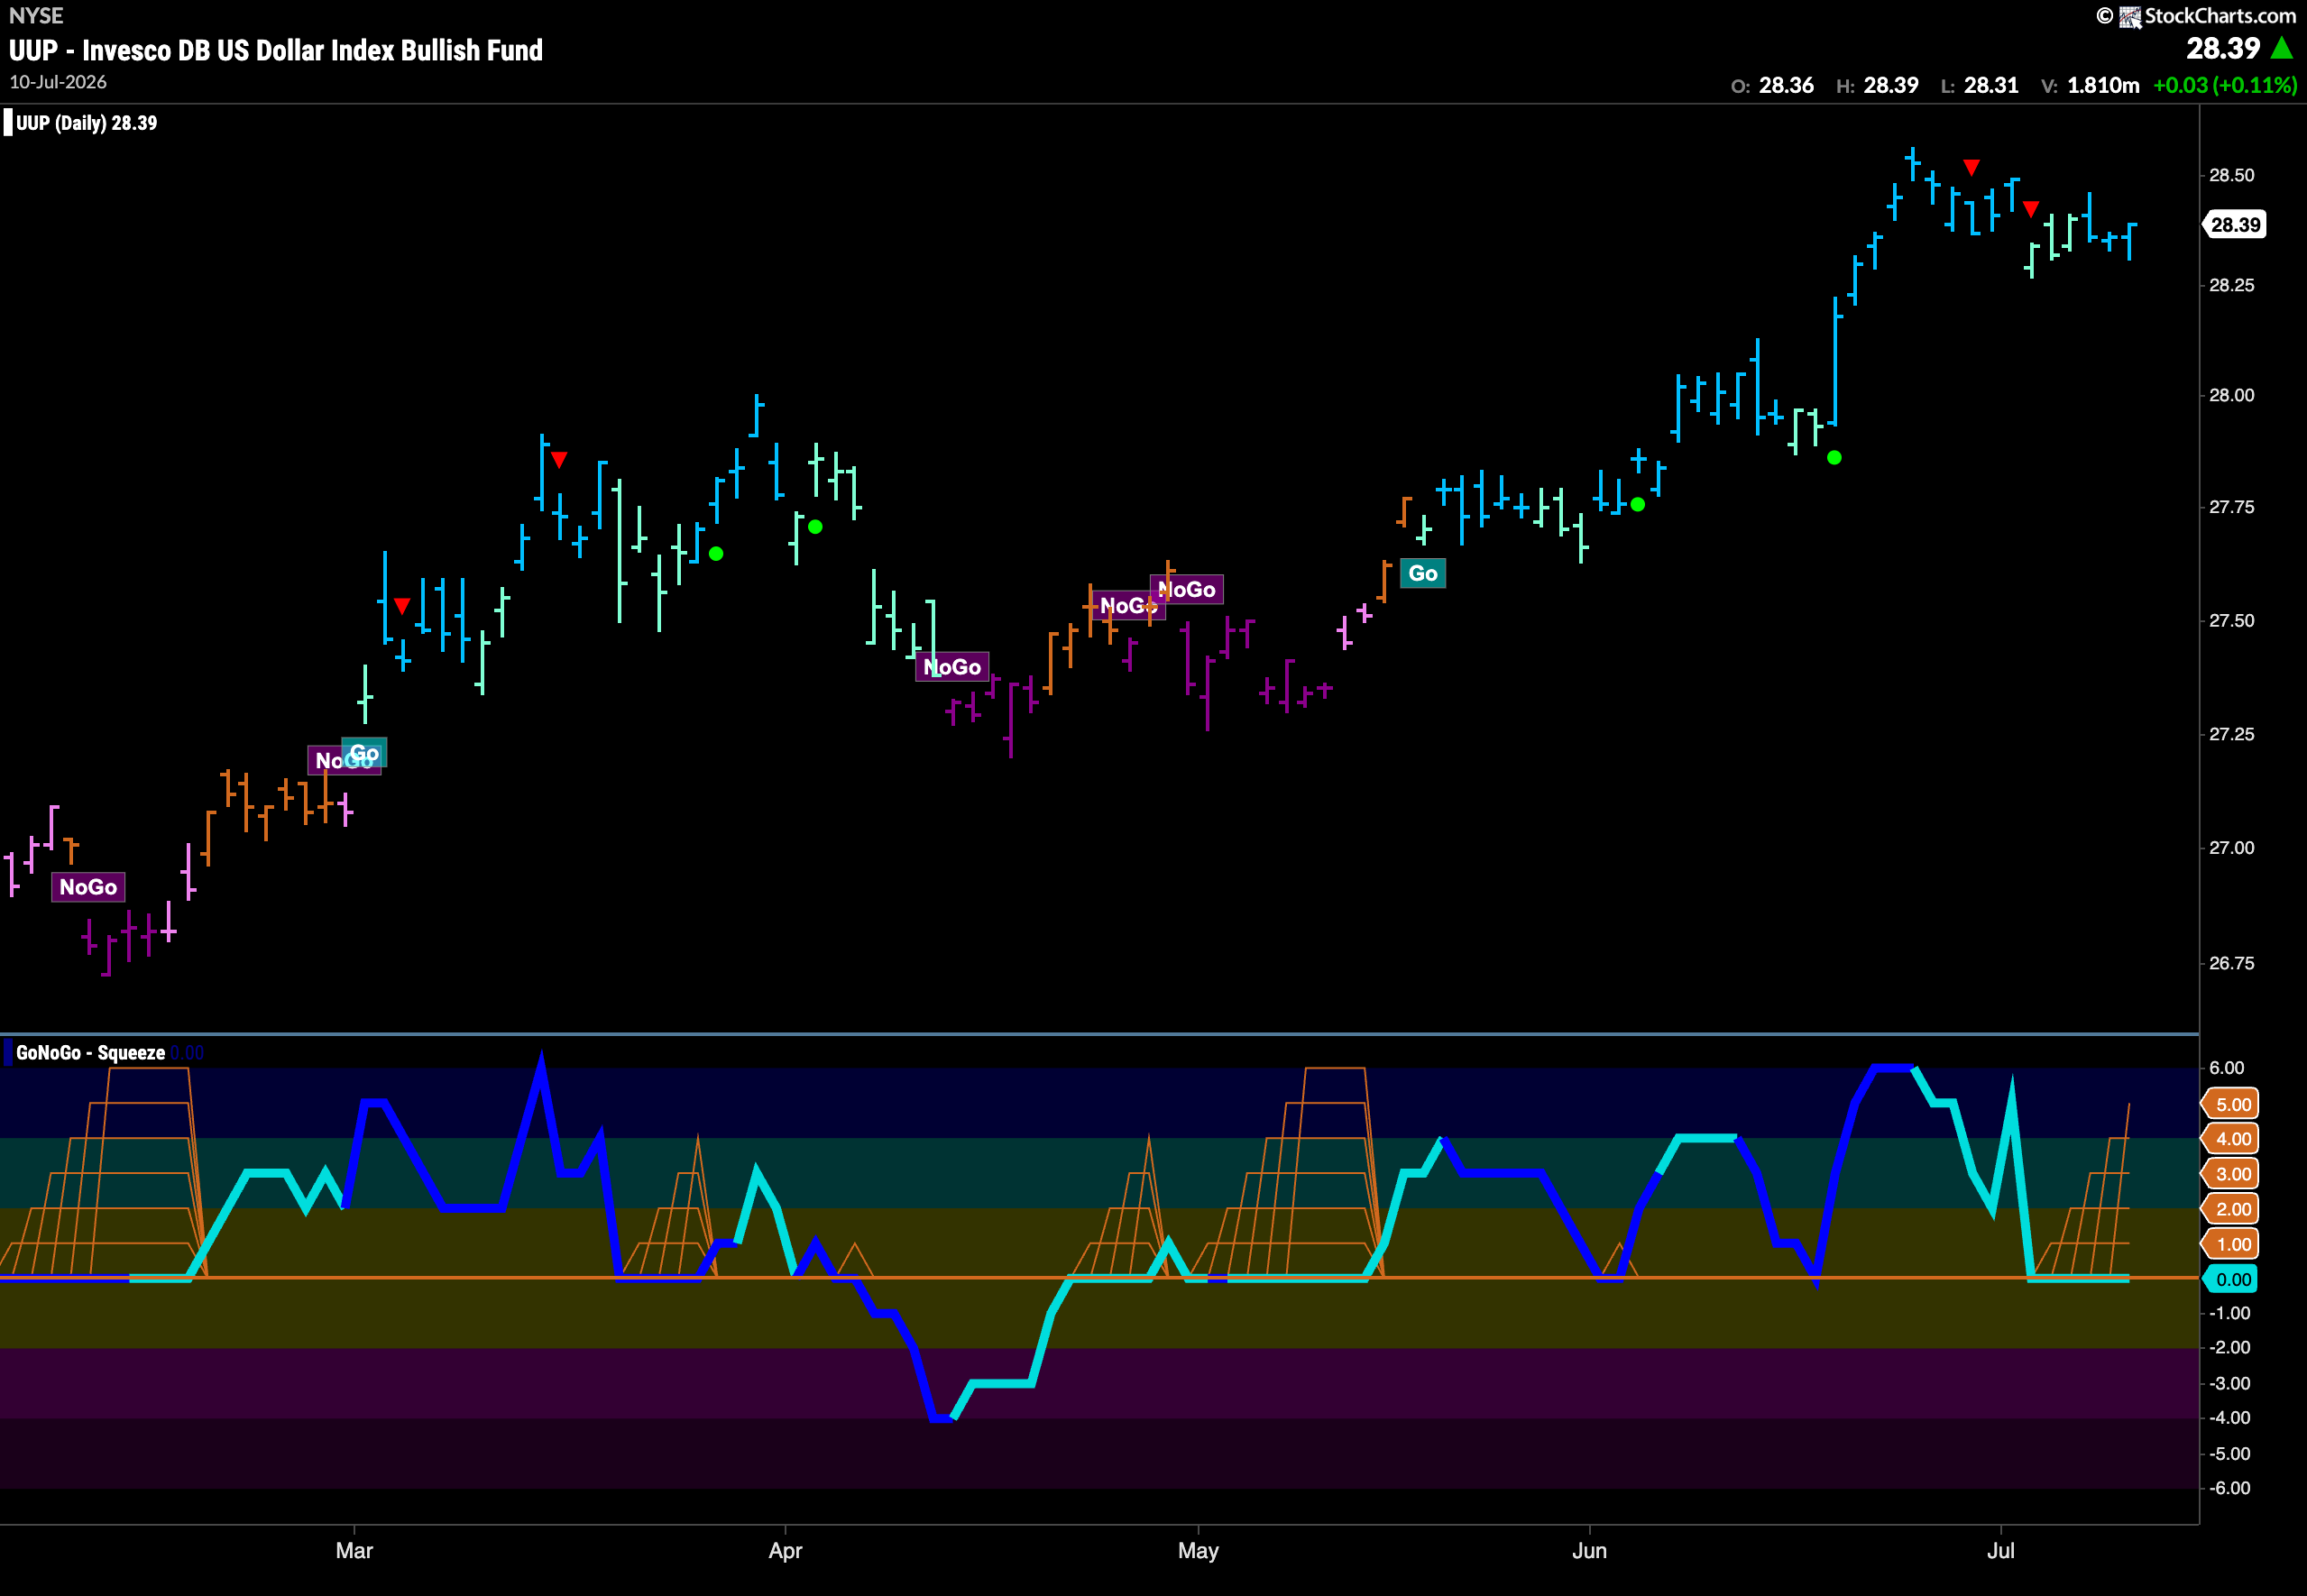
Dollar ($UUP) Remains in “Go” Trend
The chart below shows that the “Go” trend has remained in place for another week and the indicator paints bright blue bars as price looks to stabilize at these elevated levels. GoNoGo Oscillator has fallen to test the zero line from above and we see a GoNoGo Squeeze rising to its Max. We will watch to see in which direction the Squeeze is broken. If the oscillator breaks into positive territory then we will expect price to make an attempt at a higher high.
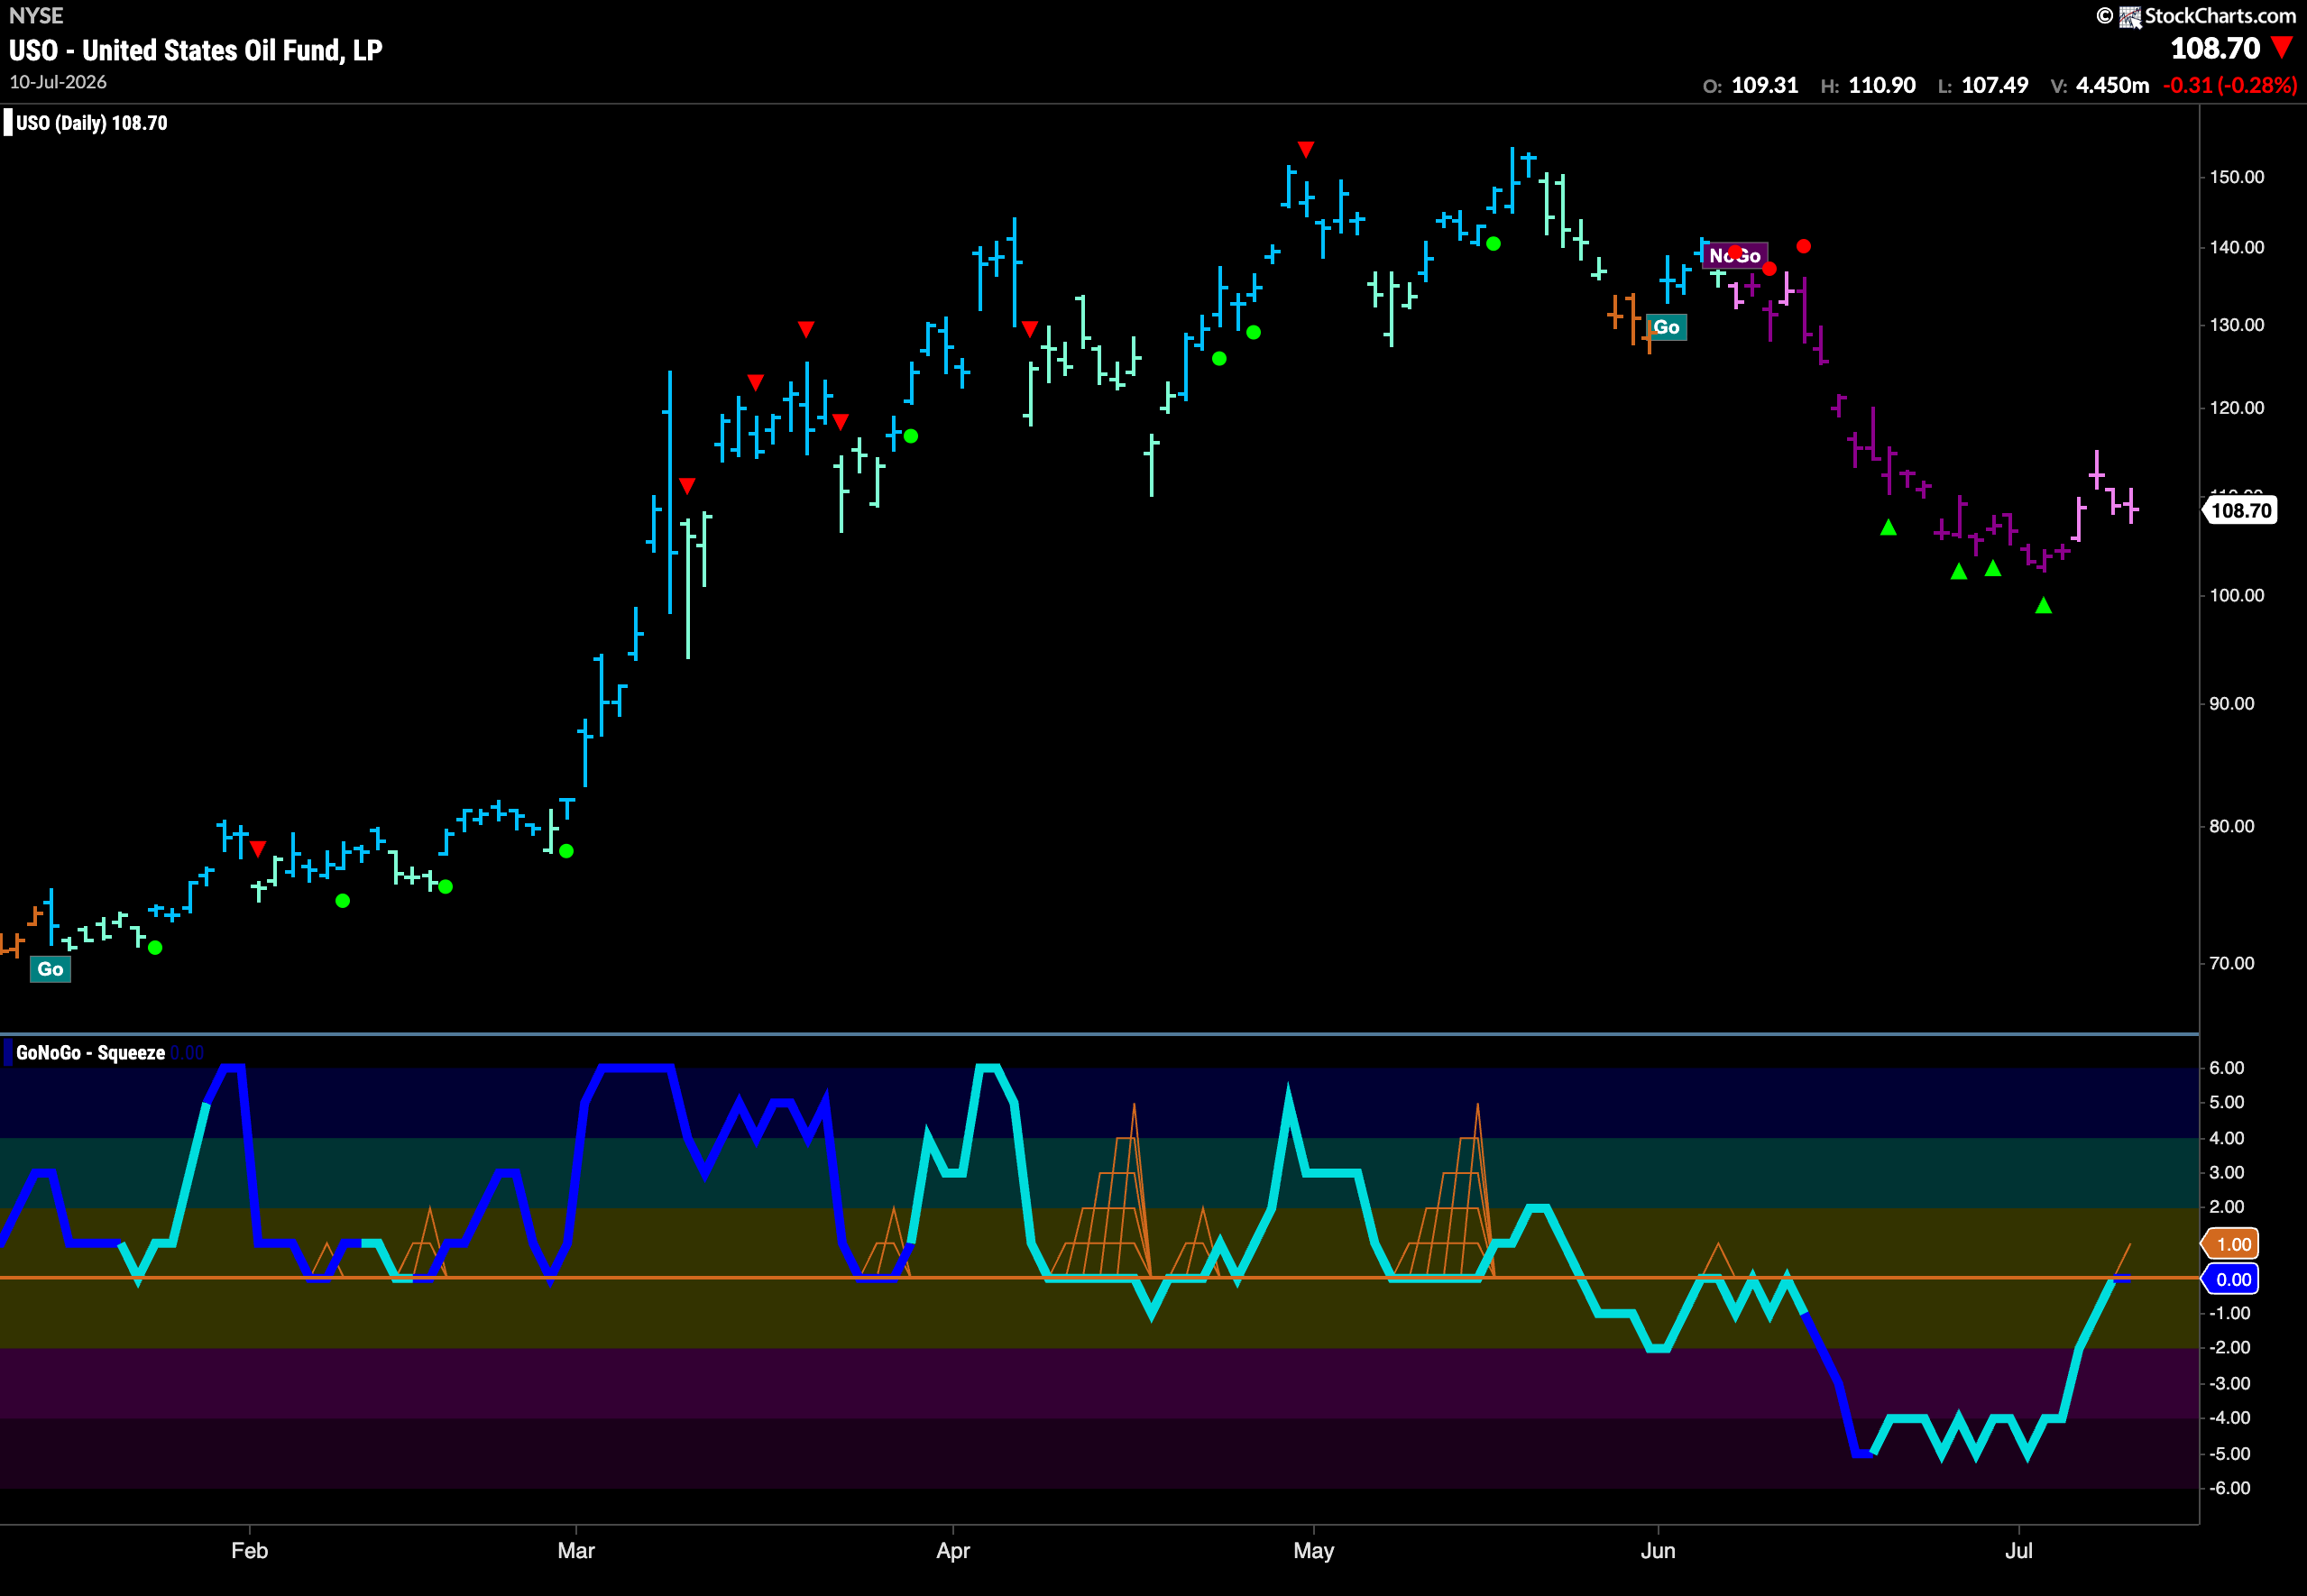
Oil ($USO) Remains in “NoGo” Trend but Paints Weakness
GoNoGo Trend shows that the “NoGo” trend in oil has continued this week but we do see weakness with the indicator painting weaker pink bars as price rallies from the low. If we look at the panel below, we can see that GoNoGo Oscillator has rallied to test the zero line from below and we will watch to see if it gets turned away at this level or if it is able to regain positive territory.
Gold ($GLD) “NoGo” Trend Continues
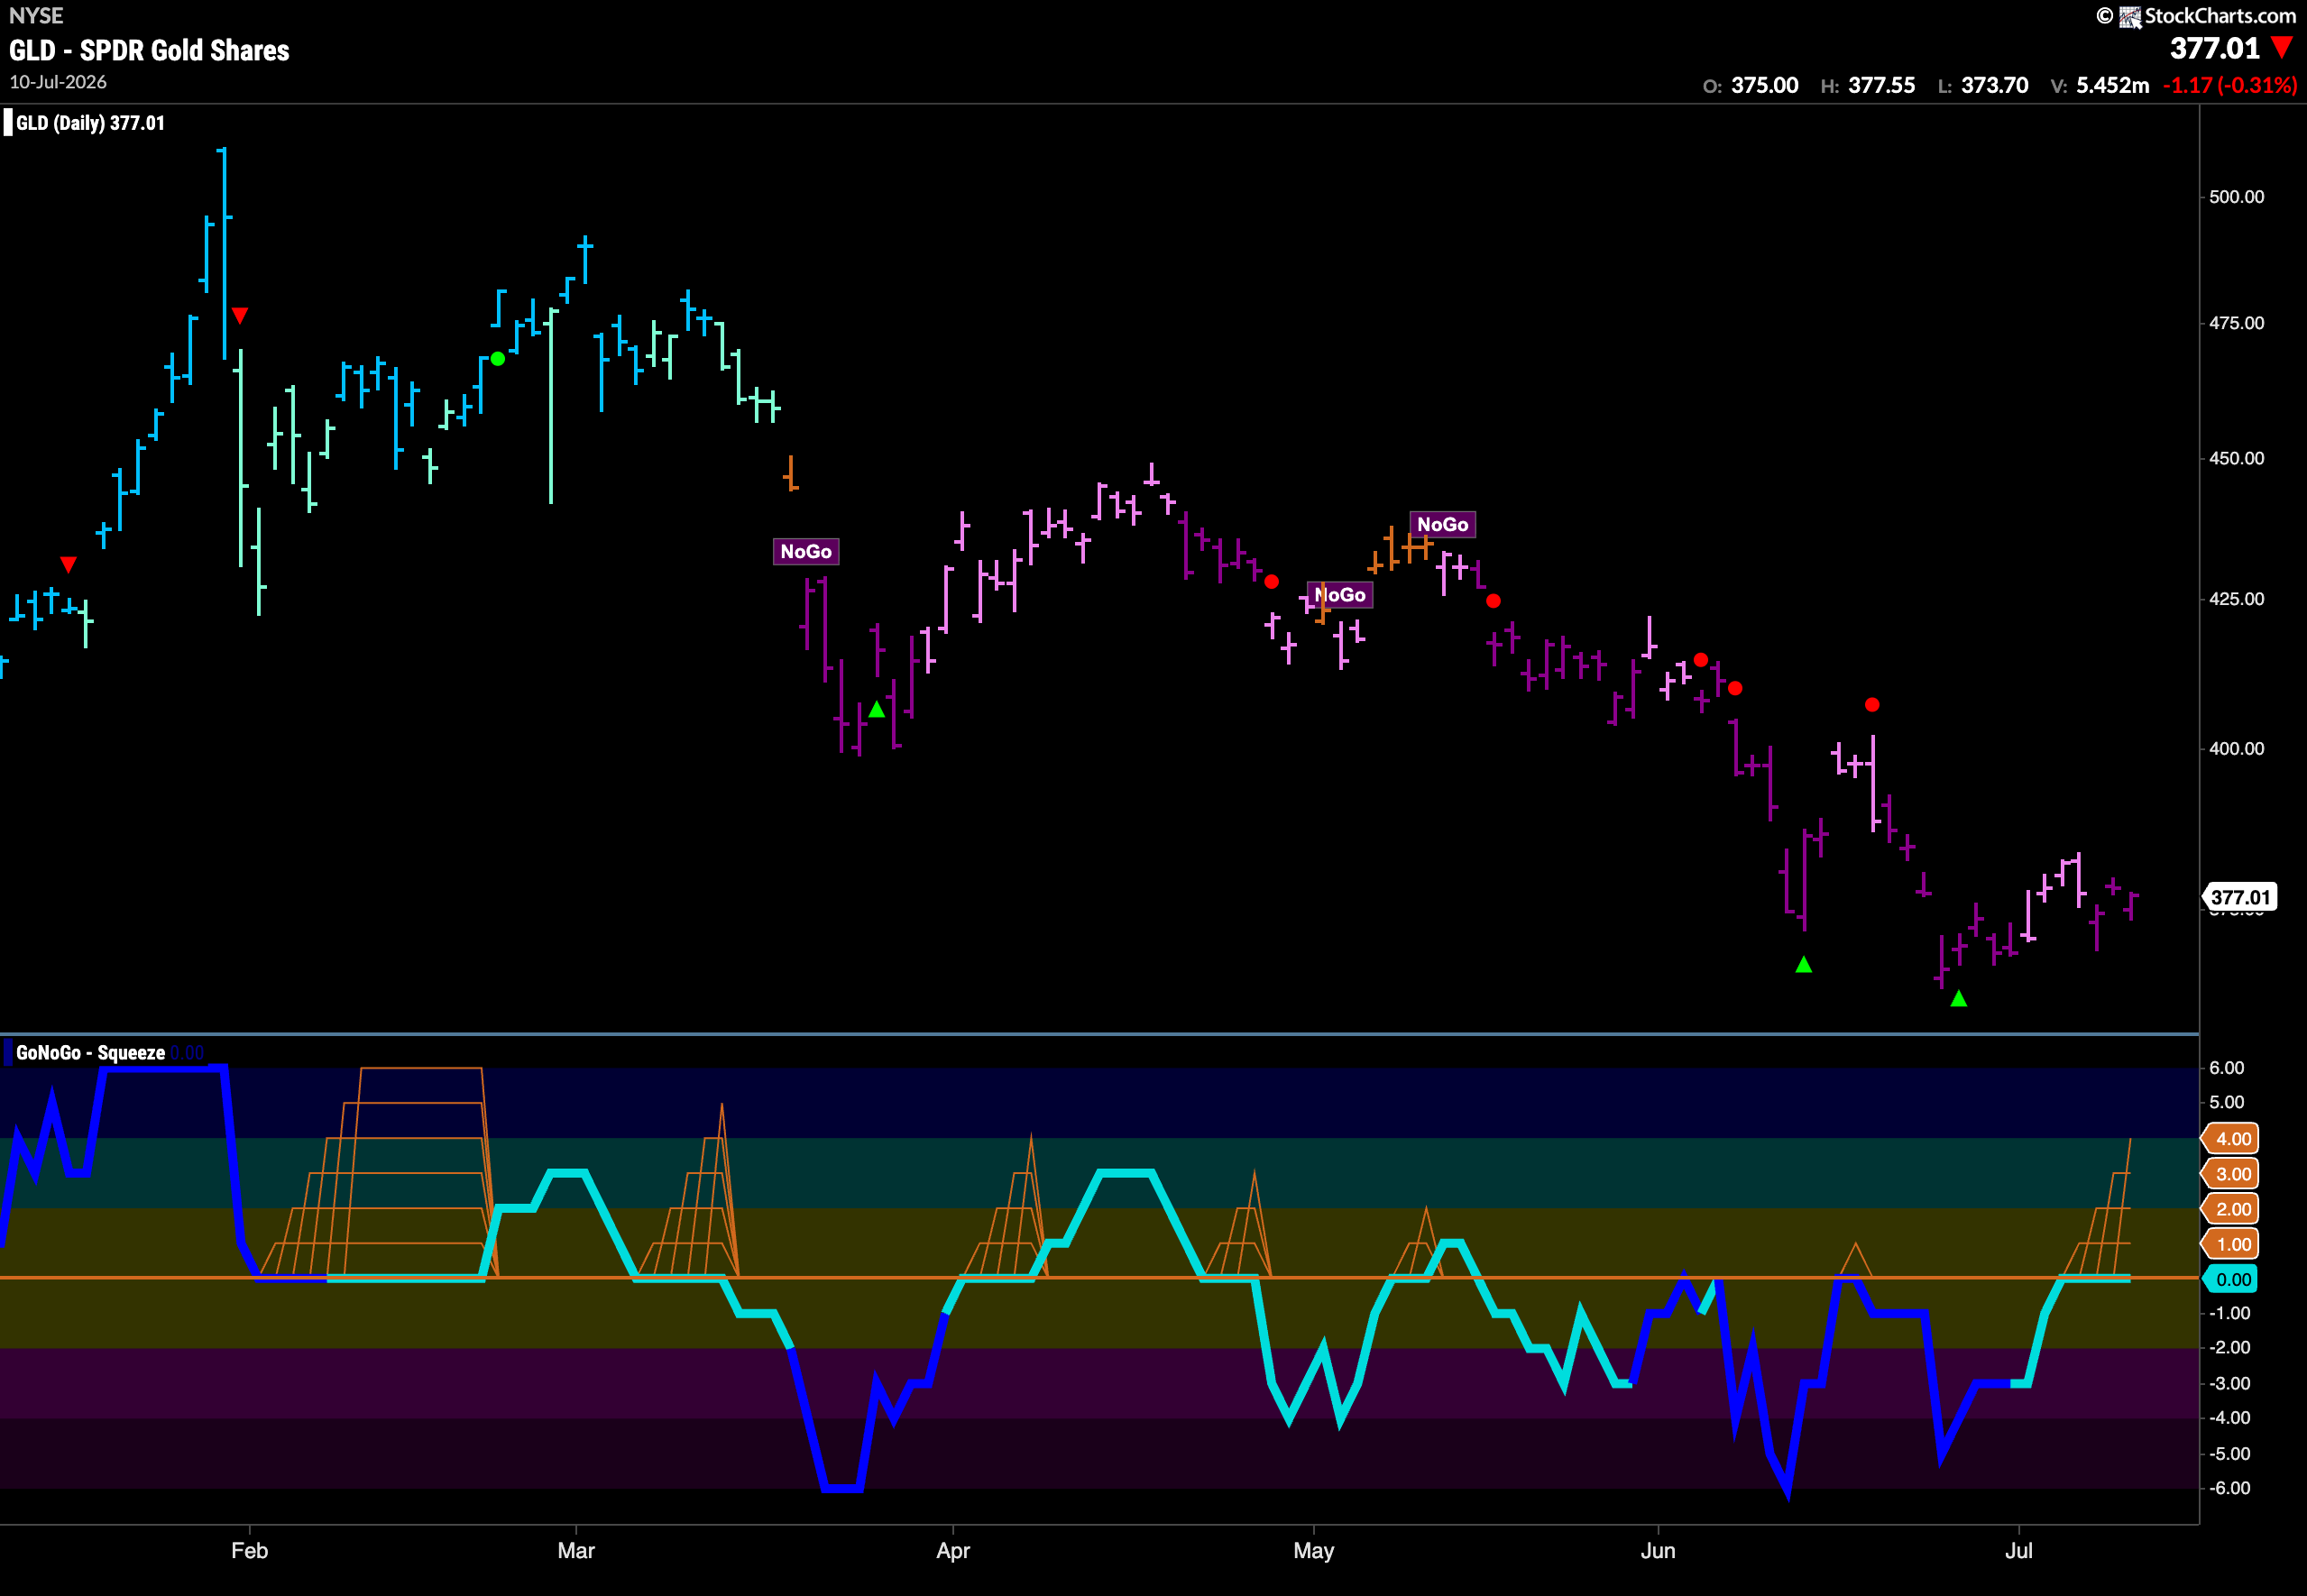
The “NoGo” trend continues for gold and after several weaker pink bars the trend has strengthened with purple bars. We will watch to see if this helps price threaten new lows. GoNoGo Oscillator is riding the zero line after rising to it from below and we see a GoNoGo Squeeze climbing reflecting the tug of war between buyers and sellers at this level. We will watch closely this week for the direction of the break.
Sector RelMap
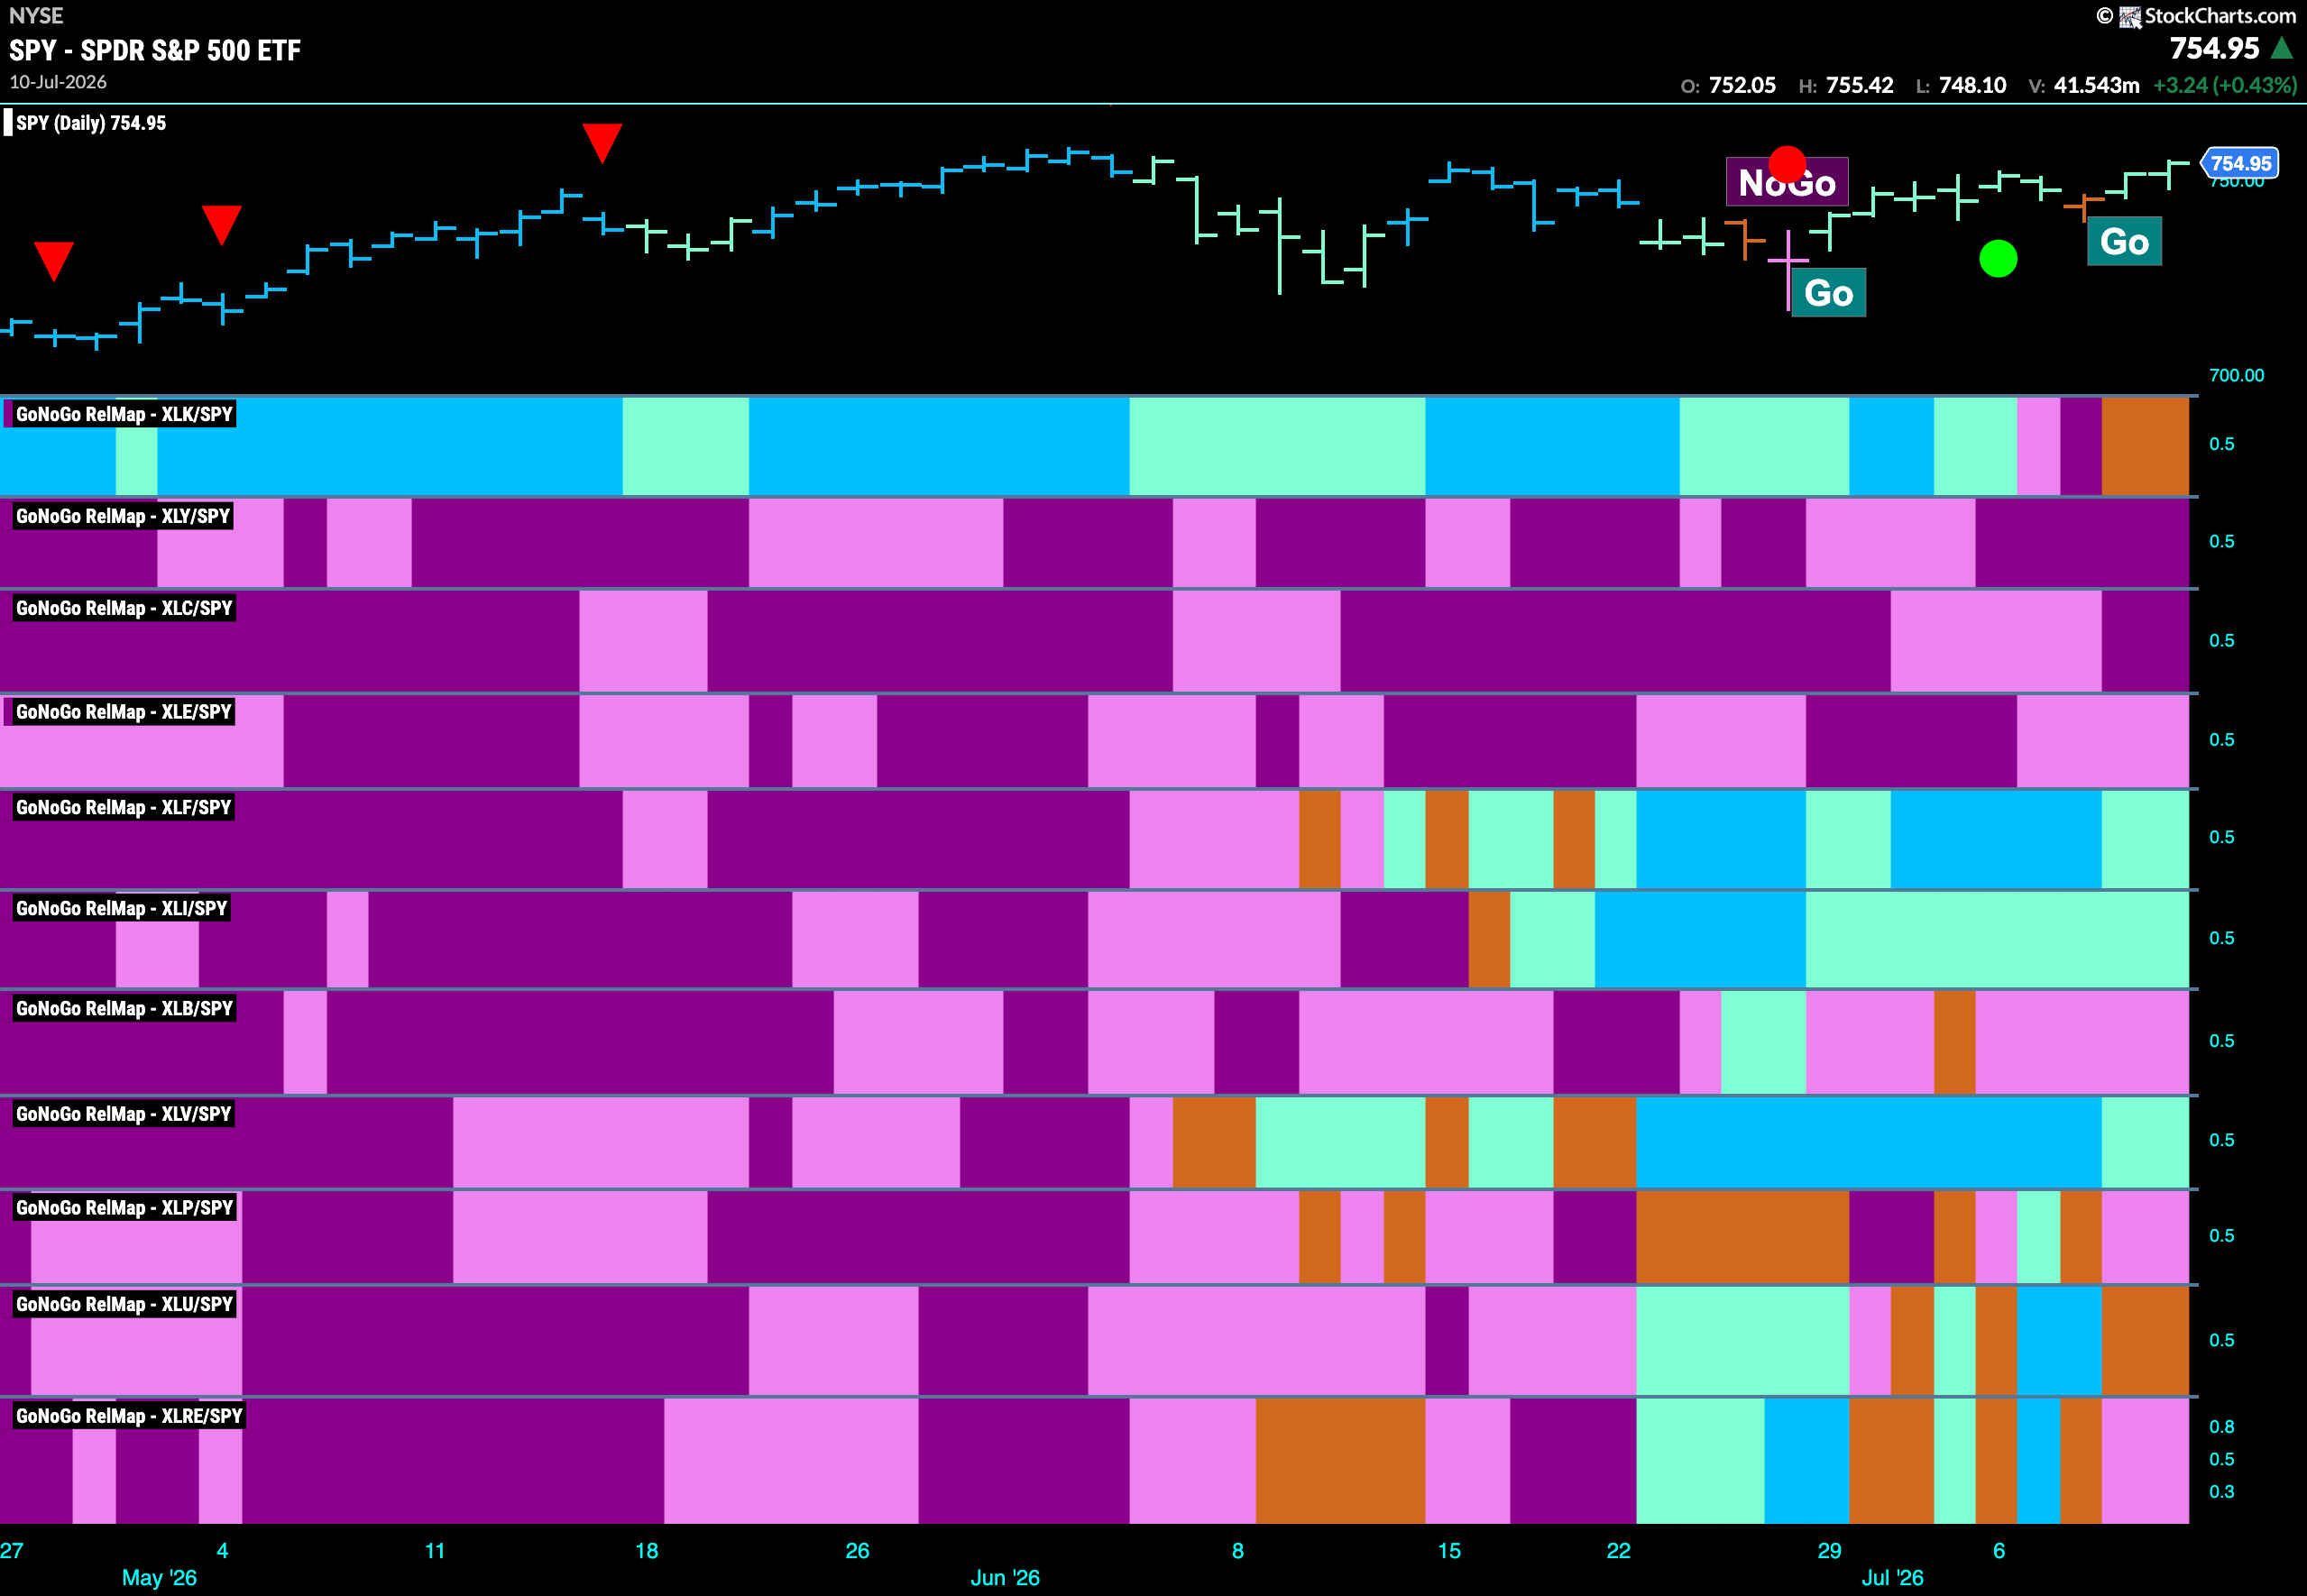
Below is the GoNoGo Sector RelMap. This GoNoGo RelMap applies the GoNoGo Trend to the relative strength ratios of the sectors to the base index. With this view we can get a sense of the relative out performance and relative underperformance of the sectors. 3 sectors are in a relative “Go” trend.$XLF, $XLI, & $XLV, are painting blue relative “Go” bars.
Industrials Sub-Group RelMap
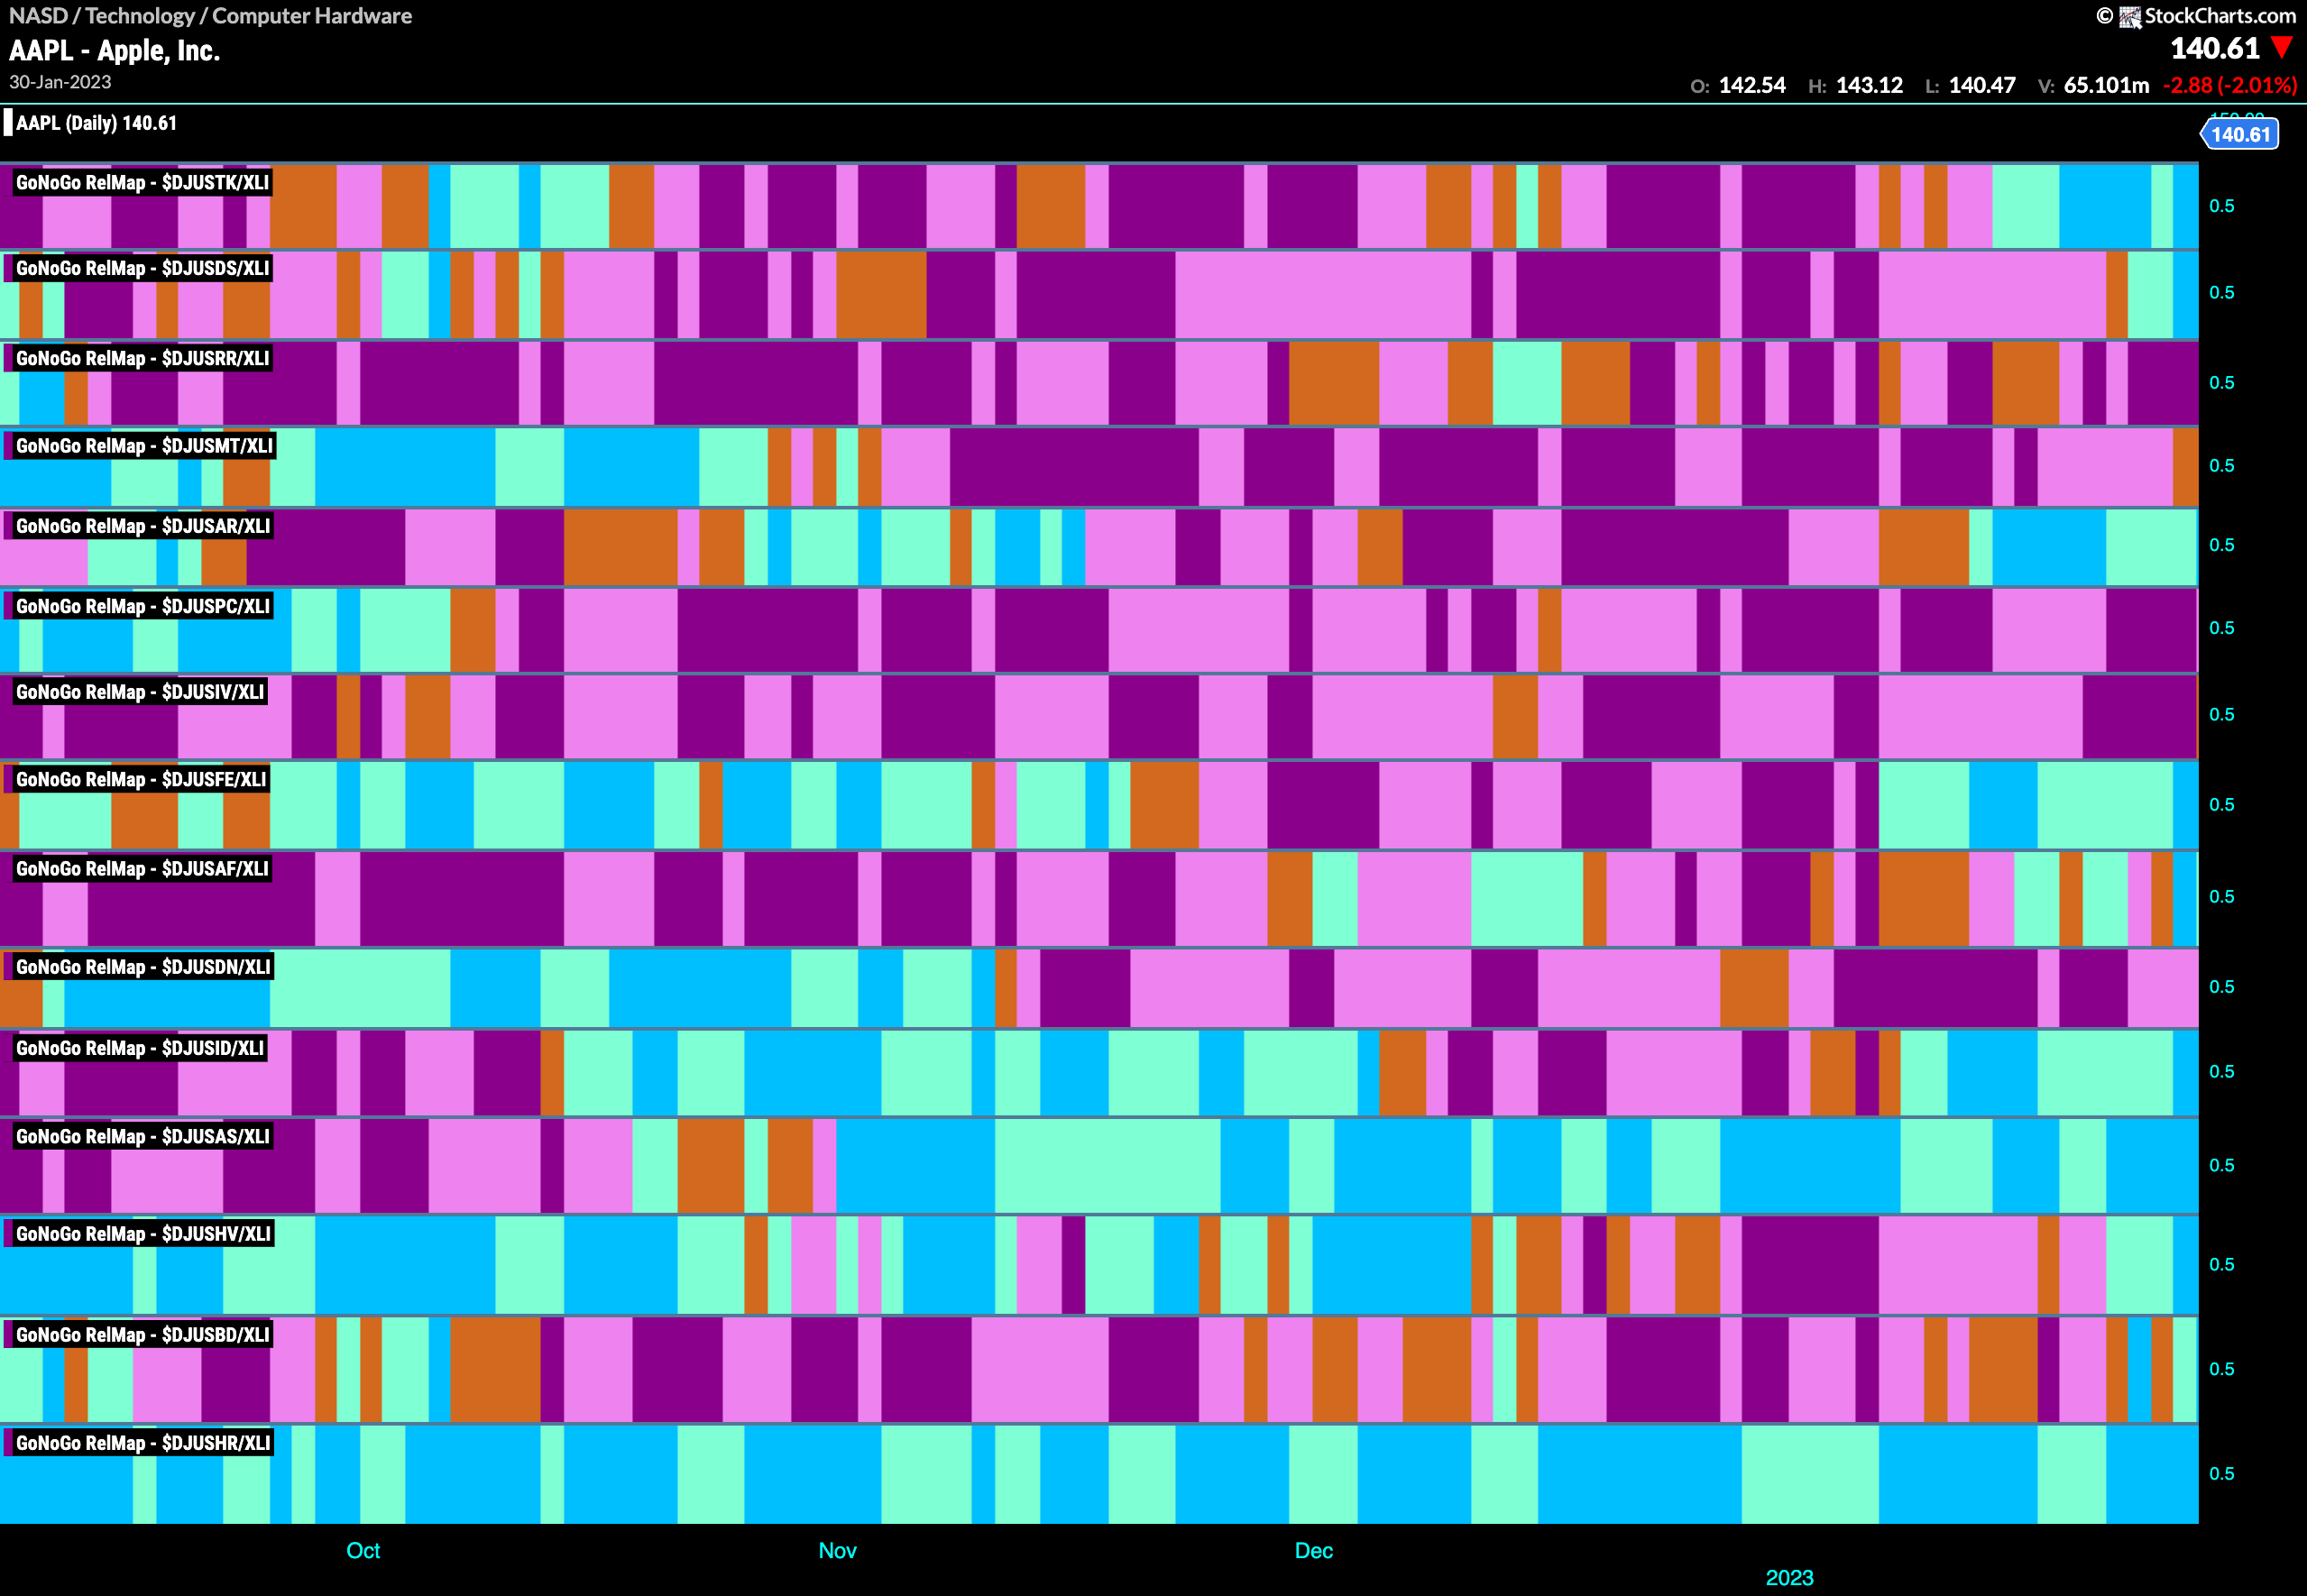
The chart below shows a relative trend breakdown of the sub groups within the industrials sector this week. The Sub-Group RelMap plots the GoNoGo Trend of each sub index to the $XLI. We saw in the above GoNoGo Sector HeatMap that $XLV is painting relative “Go” bars. When we look at the below RelMap we can see that the commercial trucking index in the last panel is painting strong blue “Go” bars on a relative basis.
$CAT Looks For Support in “Go” Trend
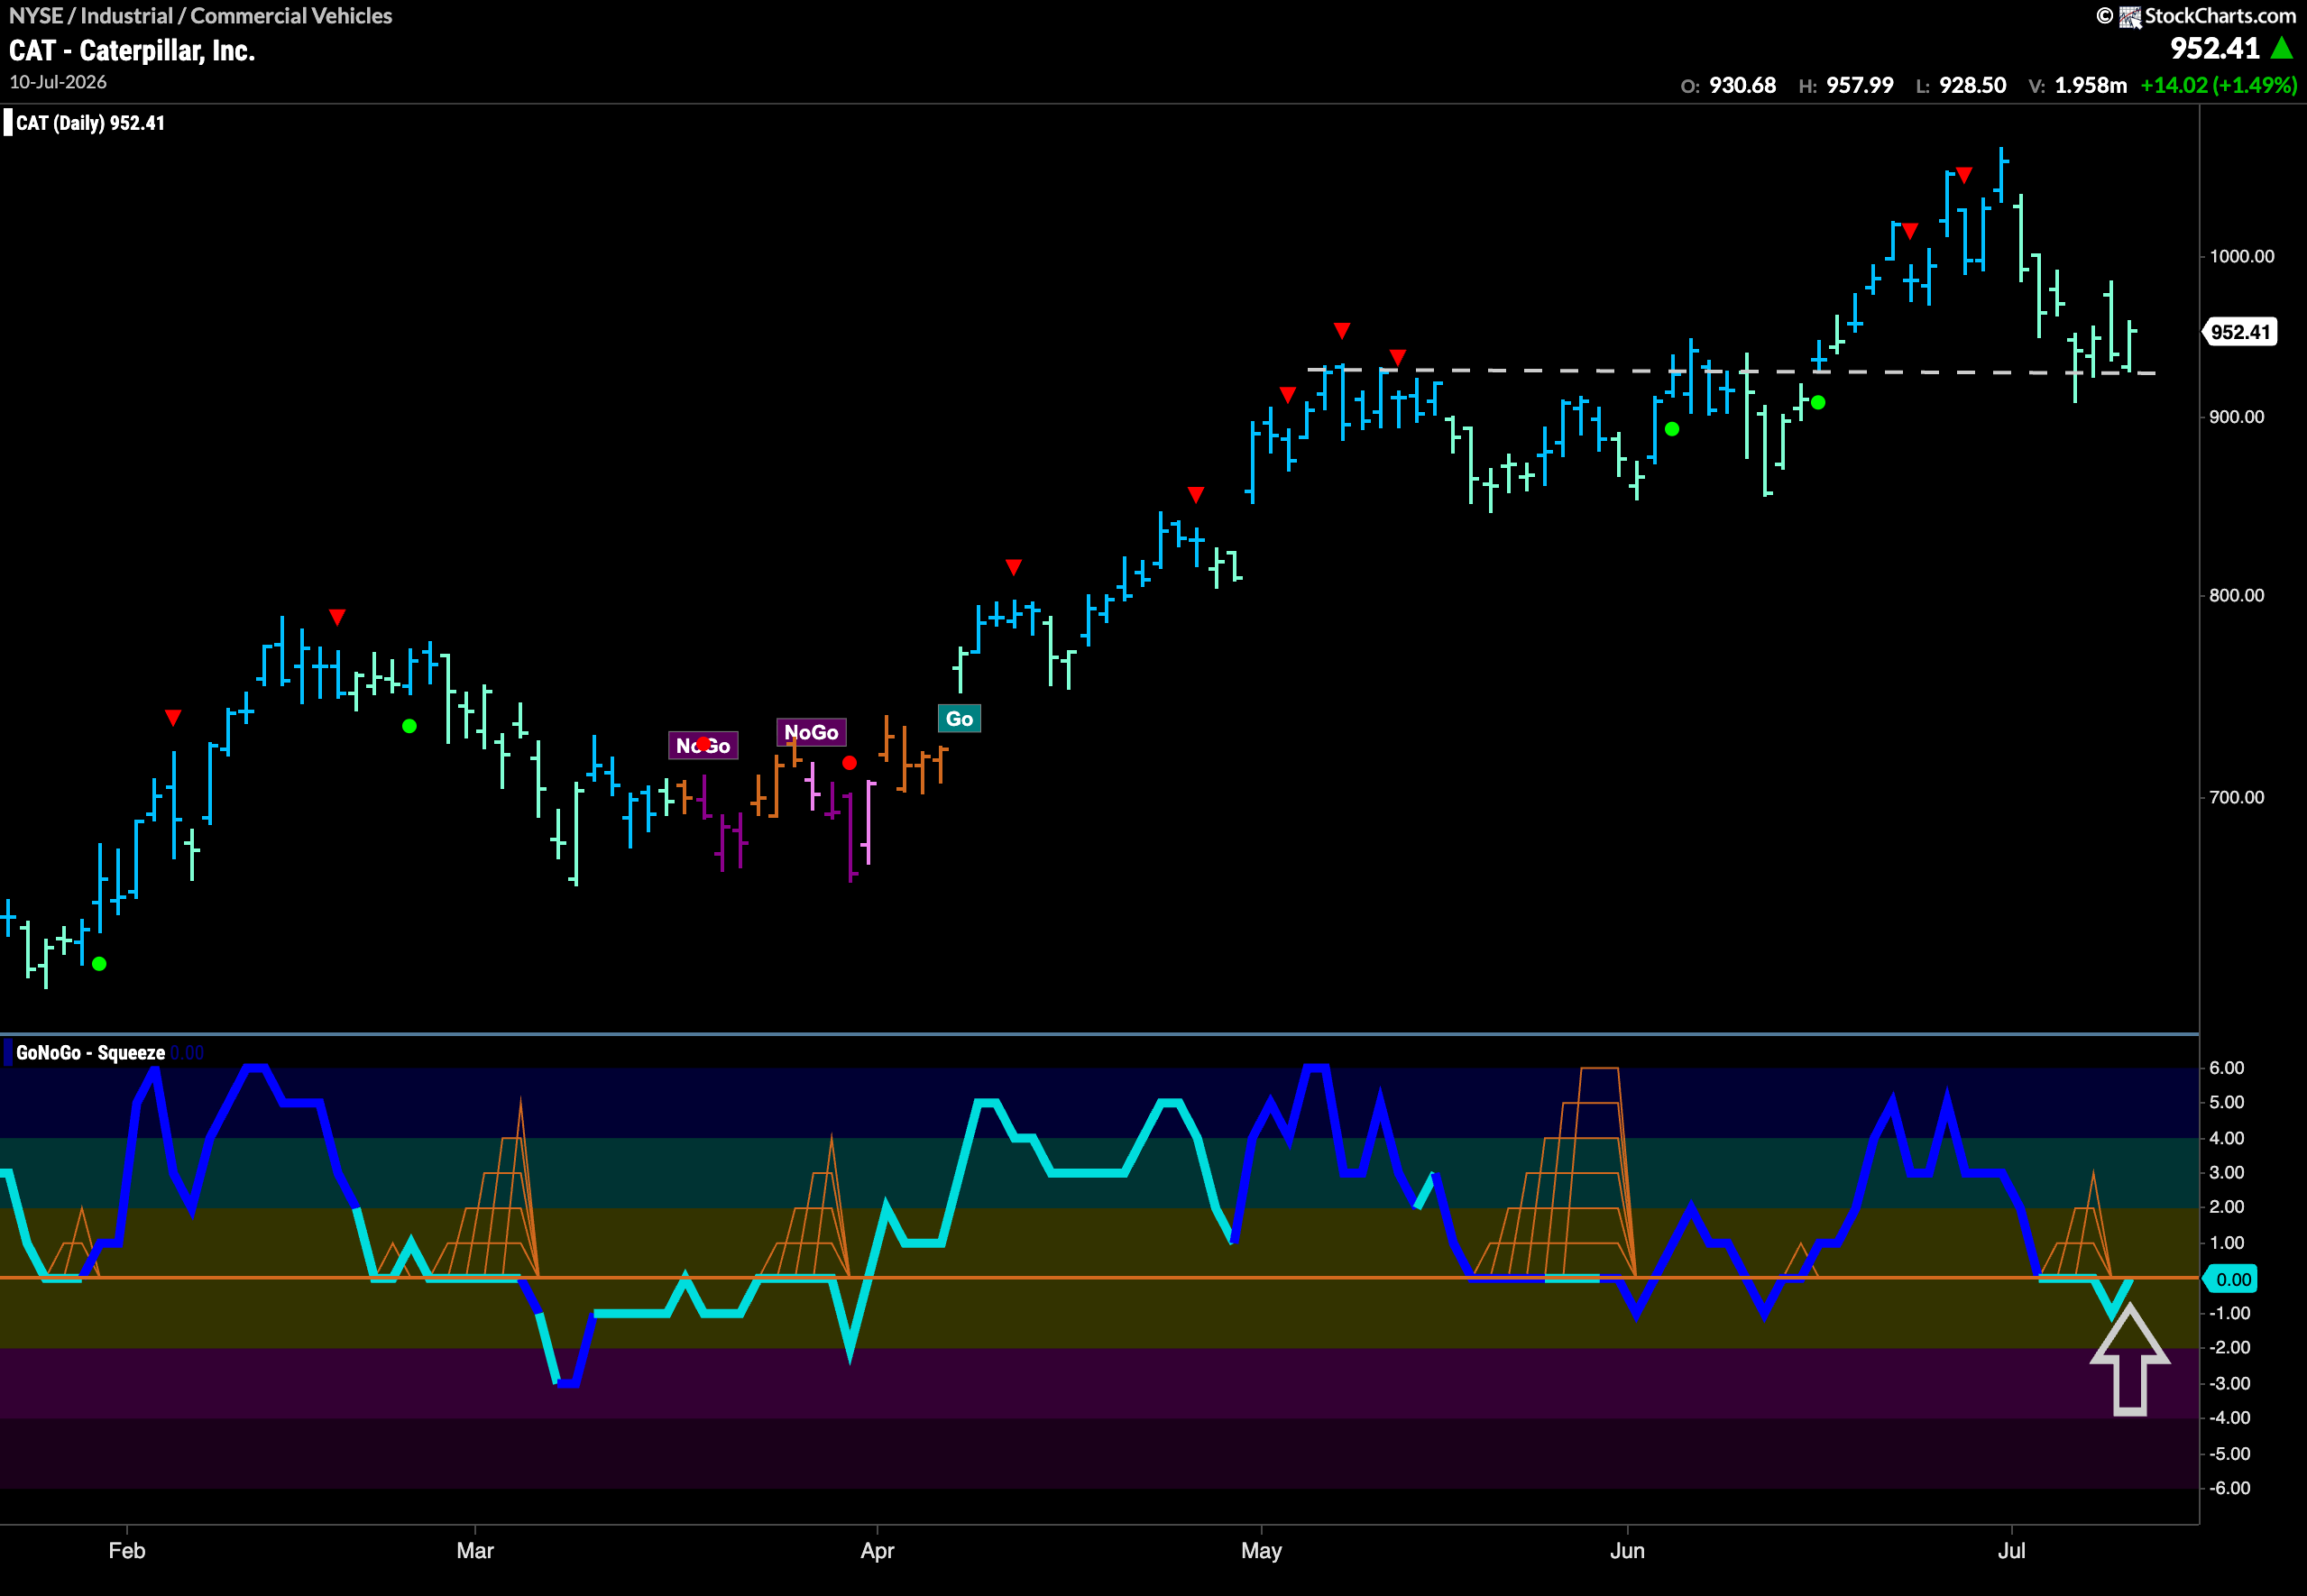
The GoNoGo Chart below shows that price has been in a “Go” Trend since April. We have seen higher highs and higher lows and GoNoGo Oscillator has been at or above the zero line for the majority of that time. Now, we see that after the last high and a couple of Go Countertrend Correction Icons (red arrows) price has fallen and GoNoGo Trend paints weaker aqua bars. However, there looks to be a natural level of support from prior highs. GoNoGo Oscillator is back testing the zero line from below. In order for the “Go” trend to remain healthy we would want to see the oscillator stay at or above zero.
$CVGI Looks for a Return to “Go” Colors
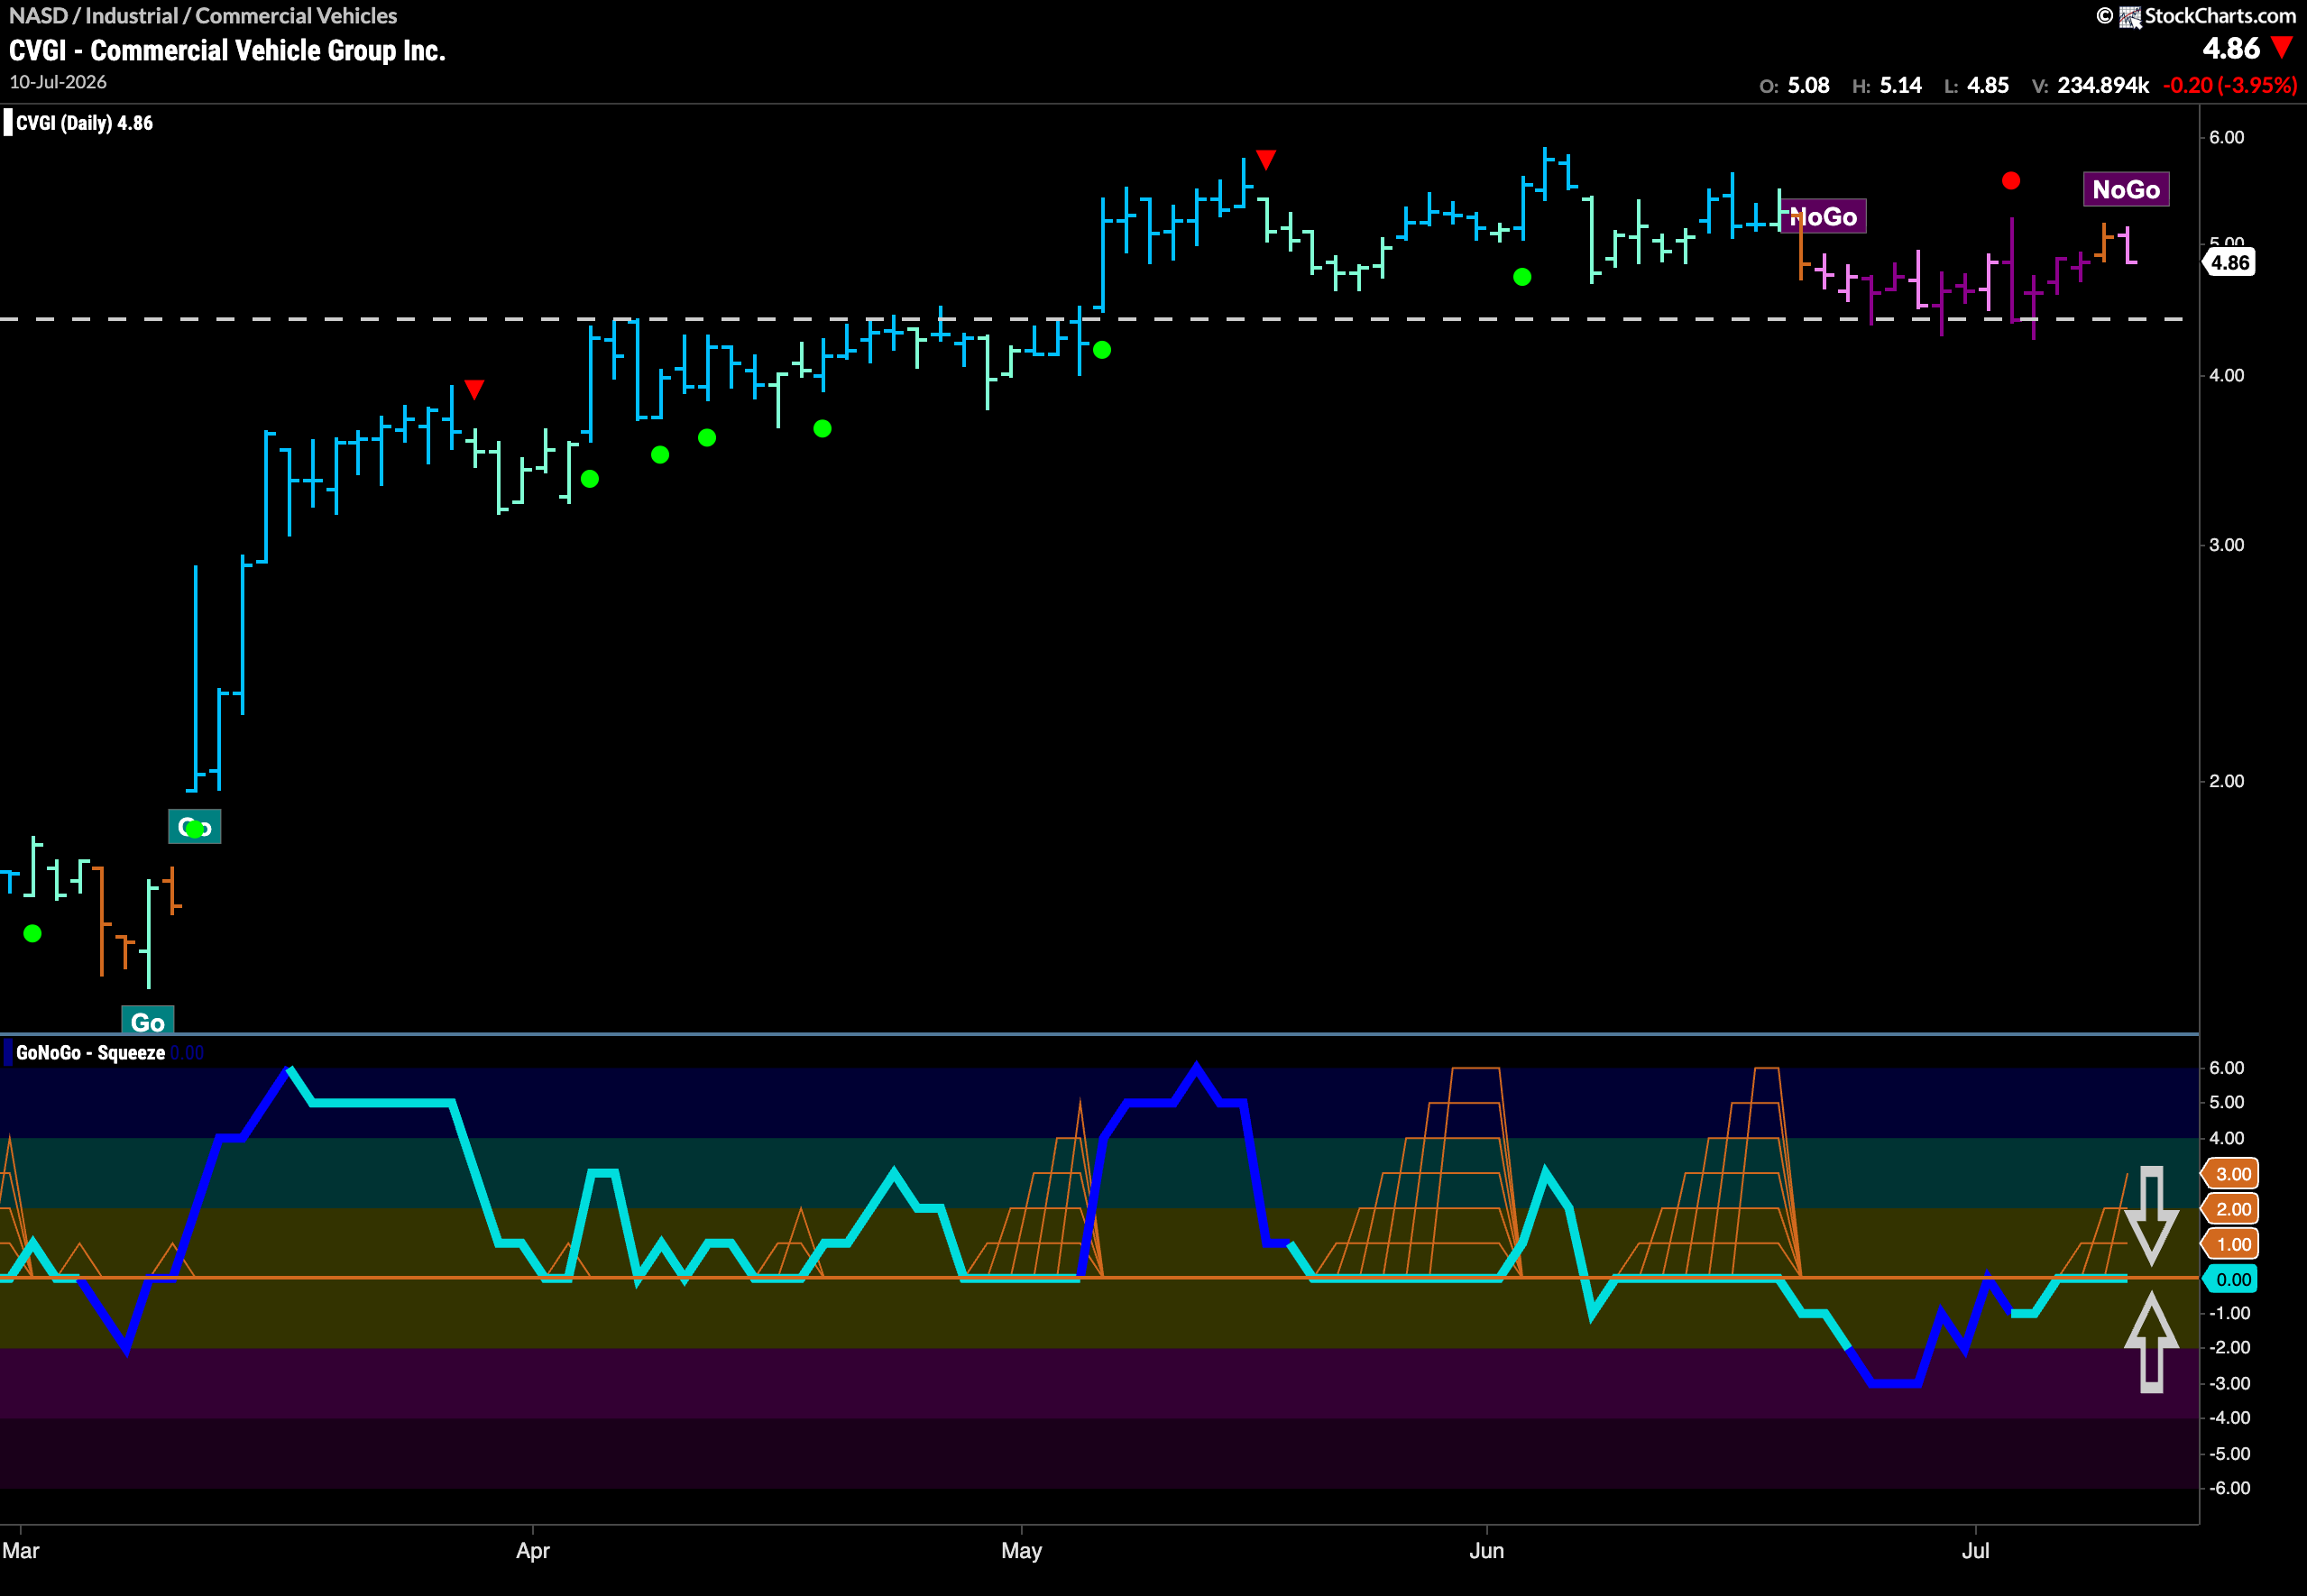
The chart below shows that $CVGI has moved mostly sideways for several months and GoNoGo Trend has painted “NoGo” colors of late. However, we note that there is strong horizontal support on the chart and will expect that to continue. GoNoGo Oscillator is riding the zero line and we see the beginnings of a GoNoGo Squeeze. We will watch to see if the oscillator can regain positive territory. If it does, that may lead to trend change in the panel above and an attempt to move higher.