Good morning and welcome to this week’s Flight Path. Equities rebounded this week as we saw a string of strong blue “Go” bars and price hit a new higher high. Treasury bond prices returned to a “Go” trend with their own week of strong blue bars. Commodities struggled again as GoNoGo Trend was unable to maintain “Go” colors. The dollar shows uncertainty at the end of the week with an amber “Go Fish” bar.
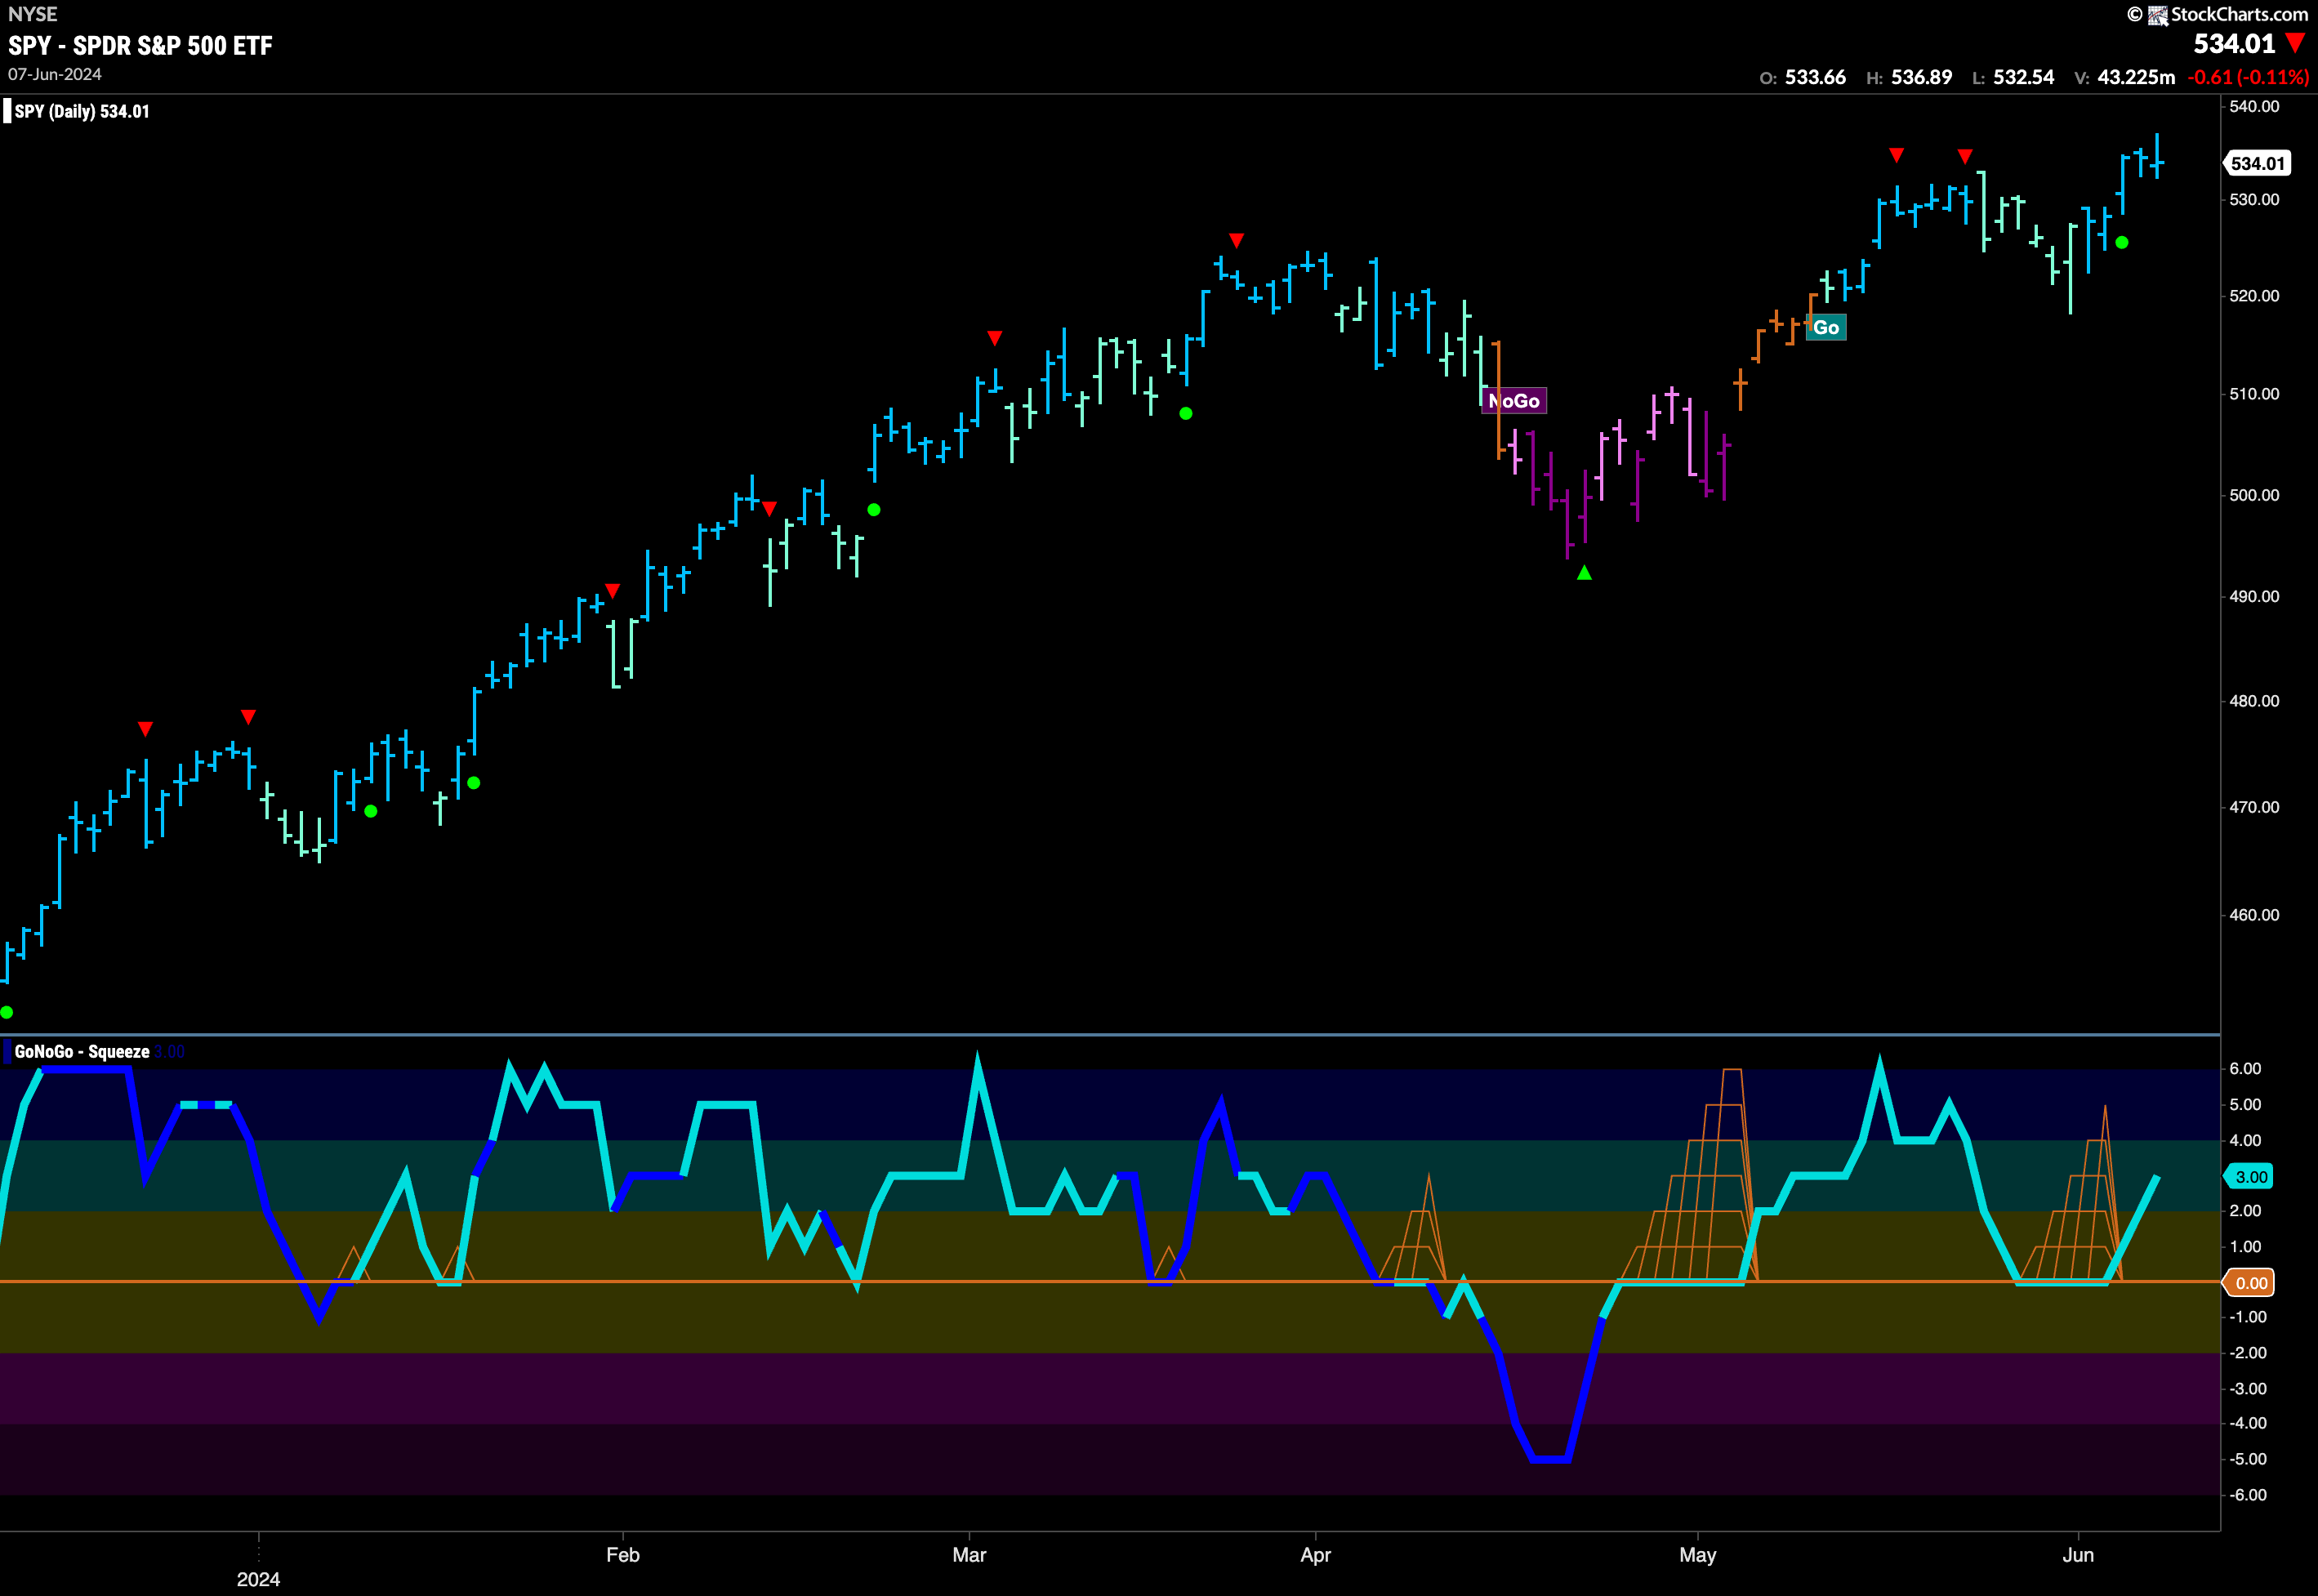
$SPY Paints Strong Blue “Go” Bars at All Time Highs
After the weakness we saw the week before, GoNoGo Trend shows that the strength in the “Go” trend returned this week as we saw a run of bright blue bars and price made a new higher high. This came with signs of trend continuation as GoNoGo Oscillator broke out of a GoNoGo Squeeze into positive territory. This tells us that momentum is resurgent in the direction of the “Go” trend.
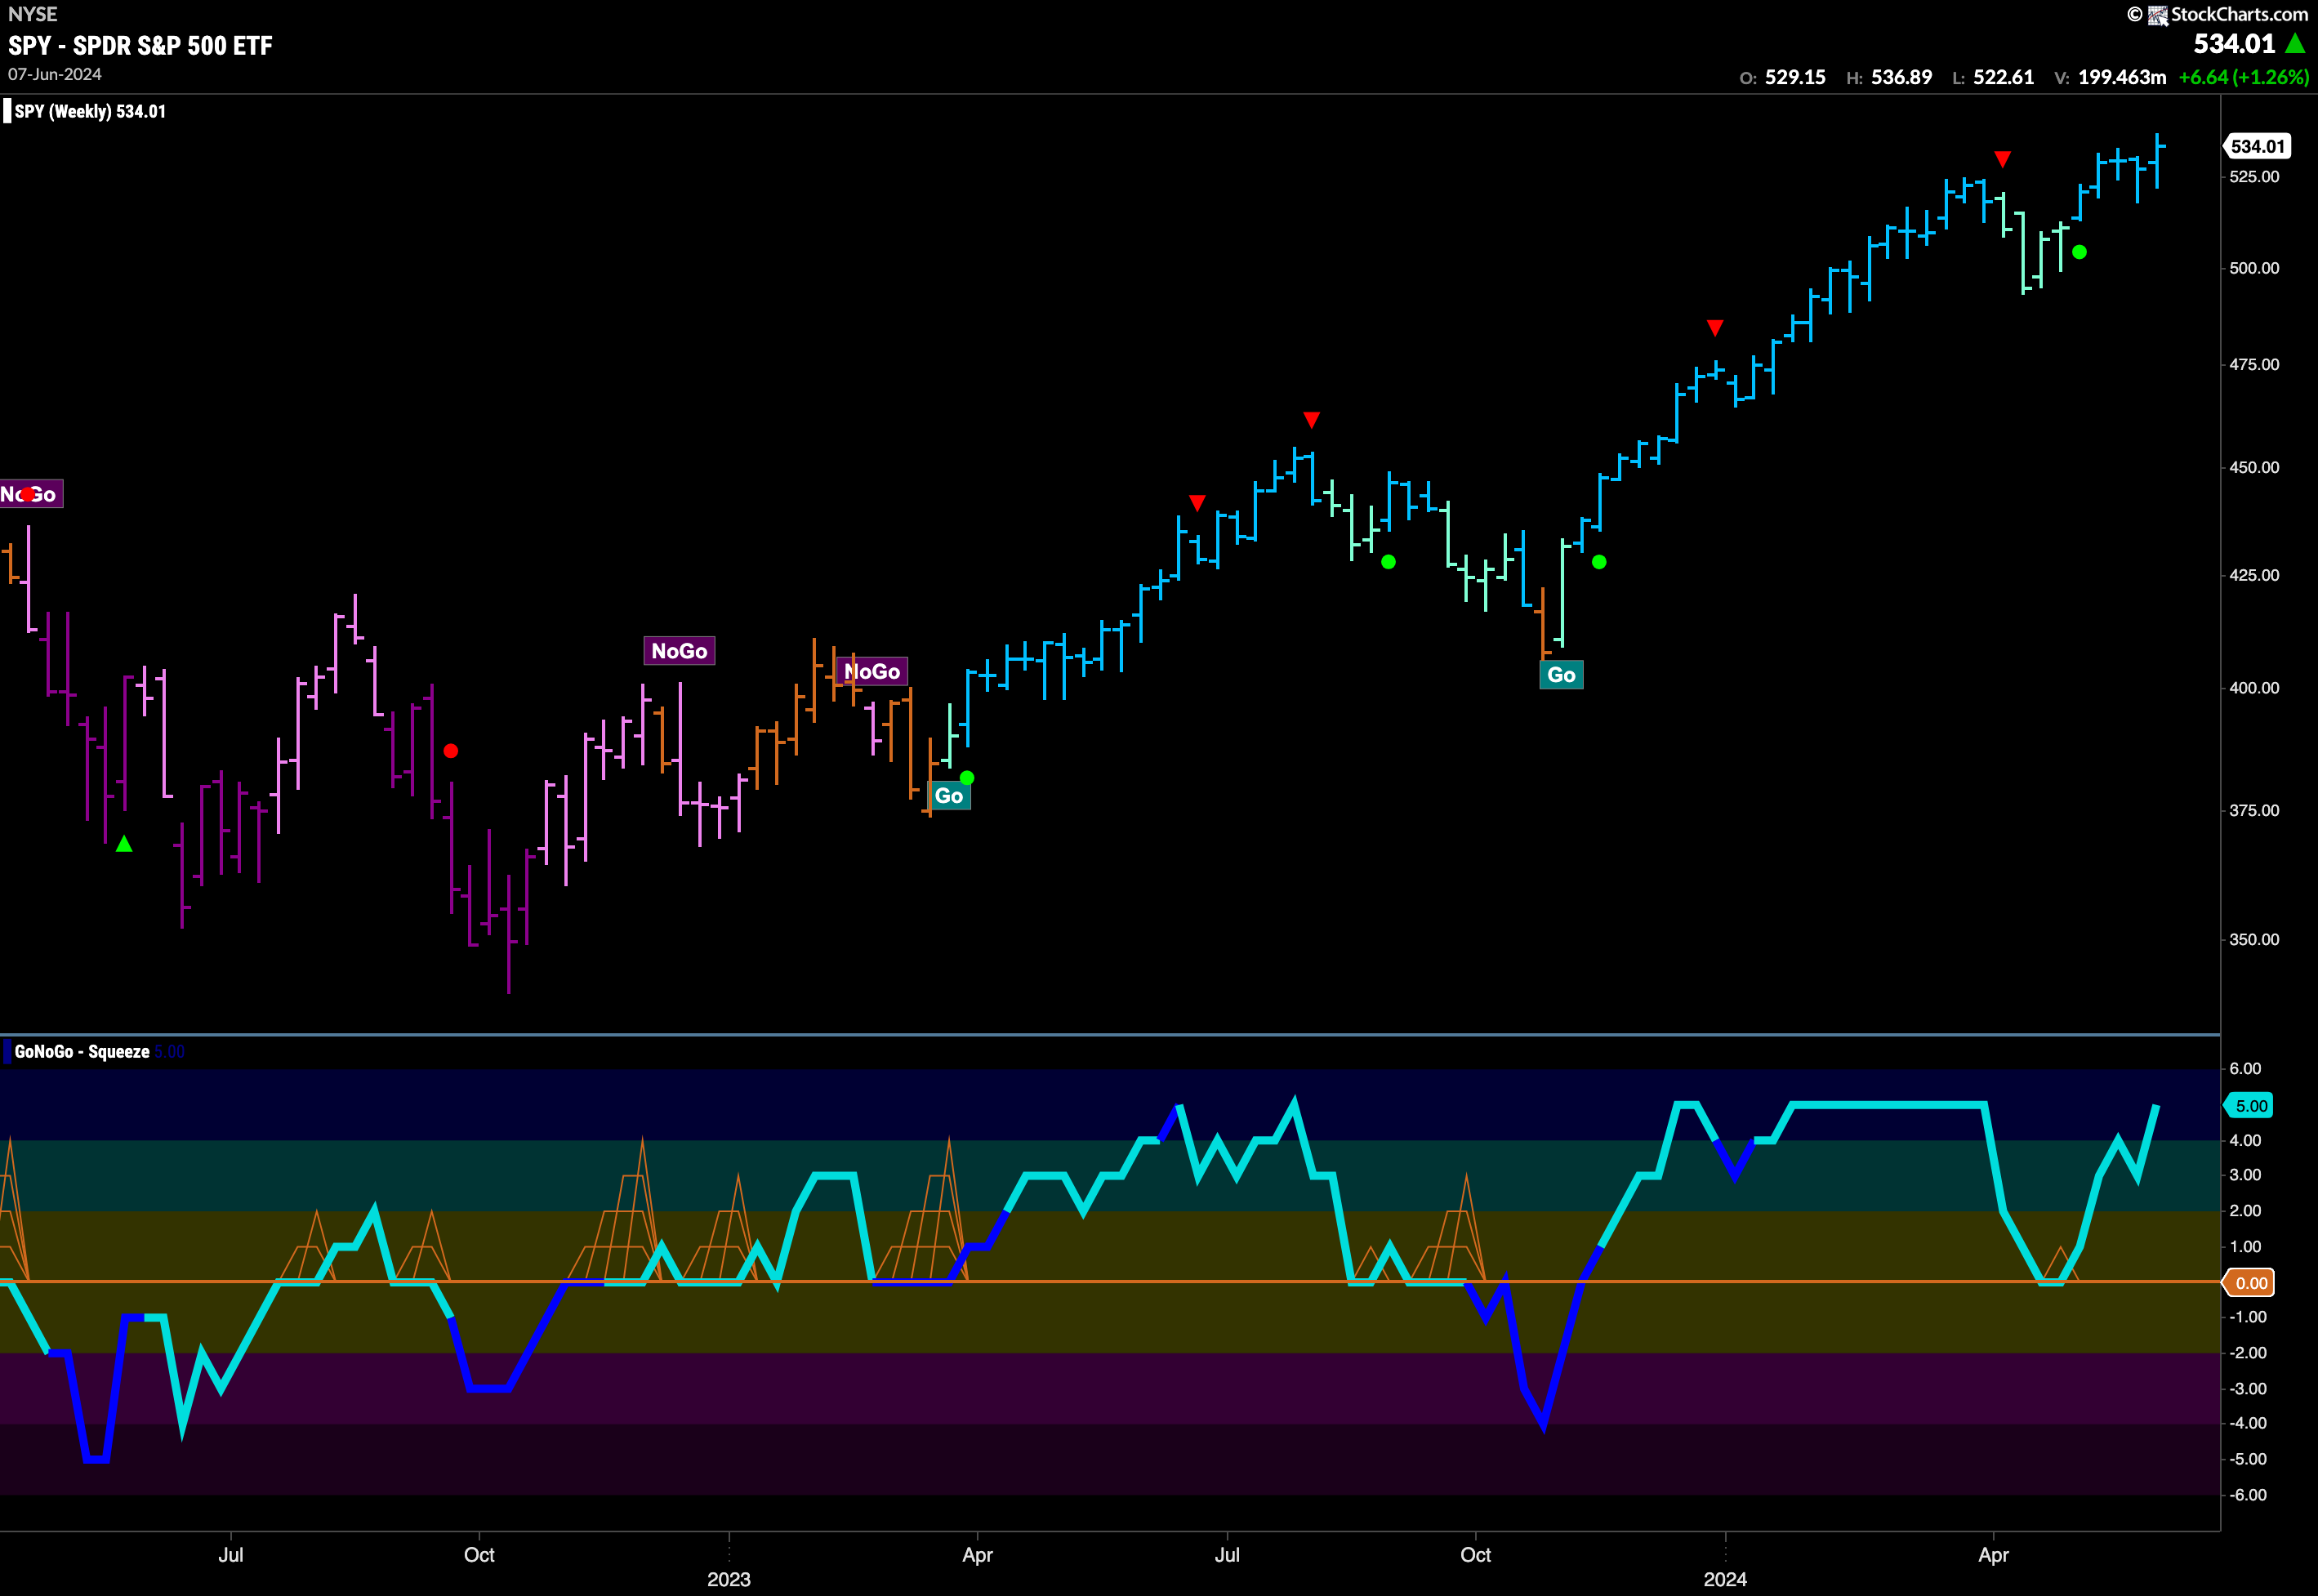
The larger weekly chart shows that the “Go” trend continues to be strong with another bright blue bar and a higher weekly close. GoNoGo Oscillator is now back in overbought territory at a value of 5 and this shows market enthusiasm in the “Go” trend.
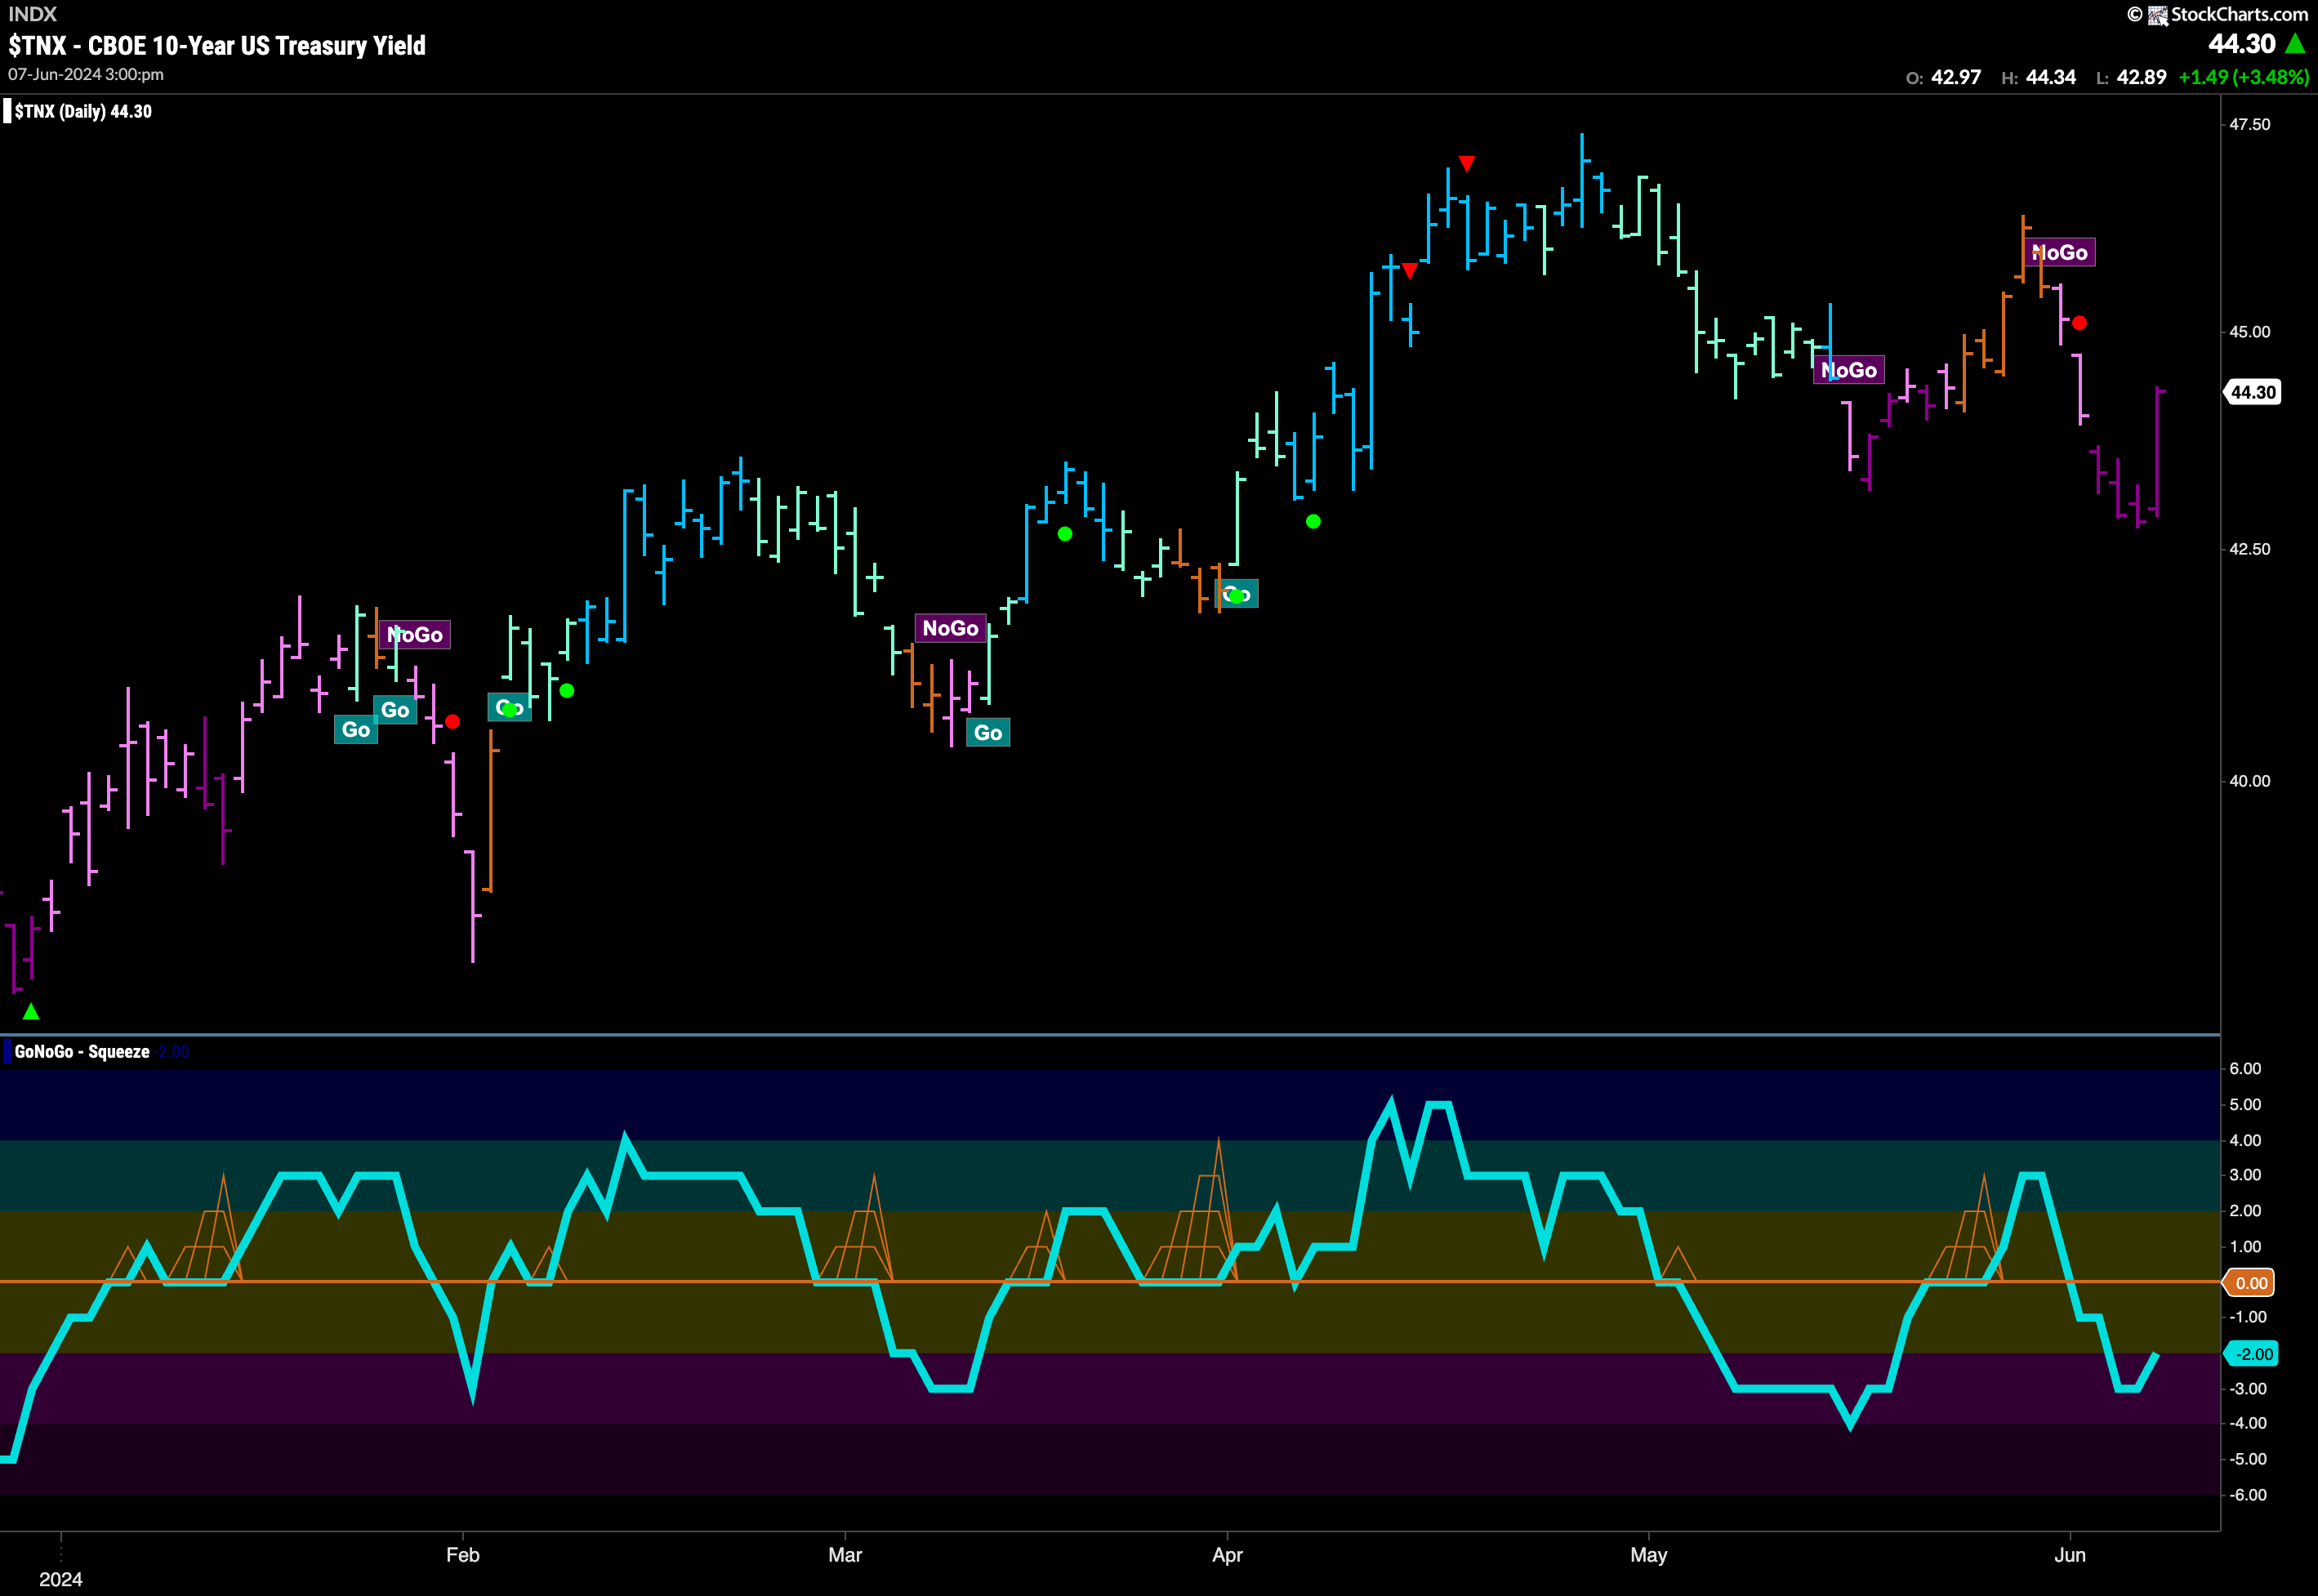
Treasury Rates Remain in “NoGo”
GoNoGo Trend painted strong purple “NoGo” bars for much of this week even in the face of a strong final bar. This week saw a new lower low as the “NoGo” trend was strong. GoNoGo Oscillator is in negative territory but not oversold. Friday’s strong bar saw the oscillator turn up and so we will watch to see if it finds resistance at the zero line in this “NoGo” trend.
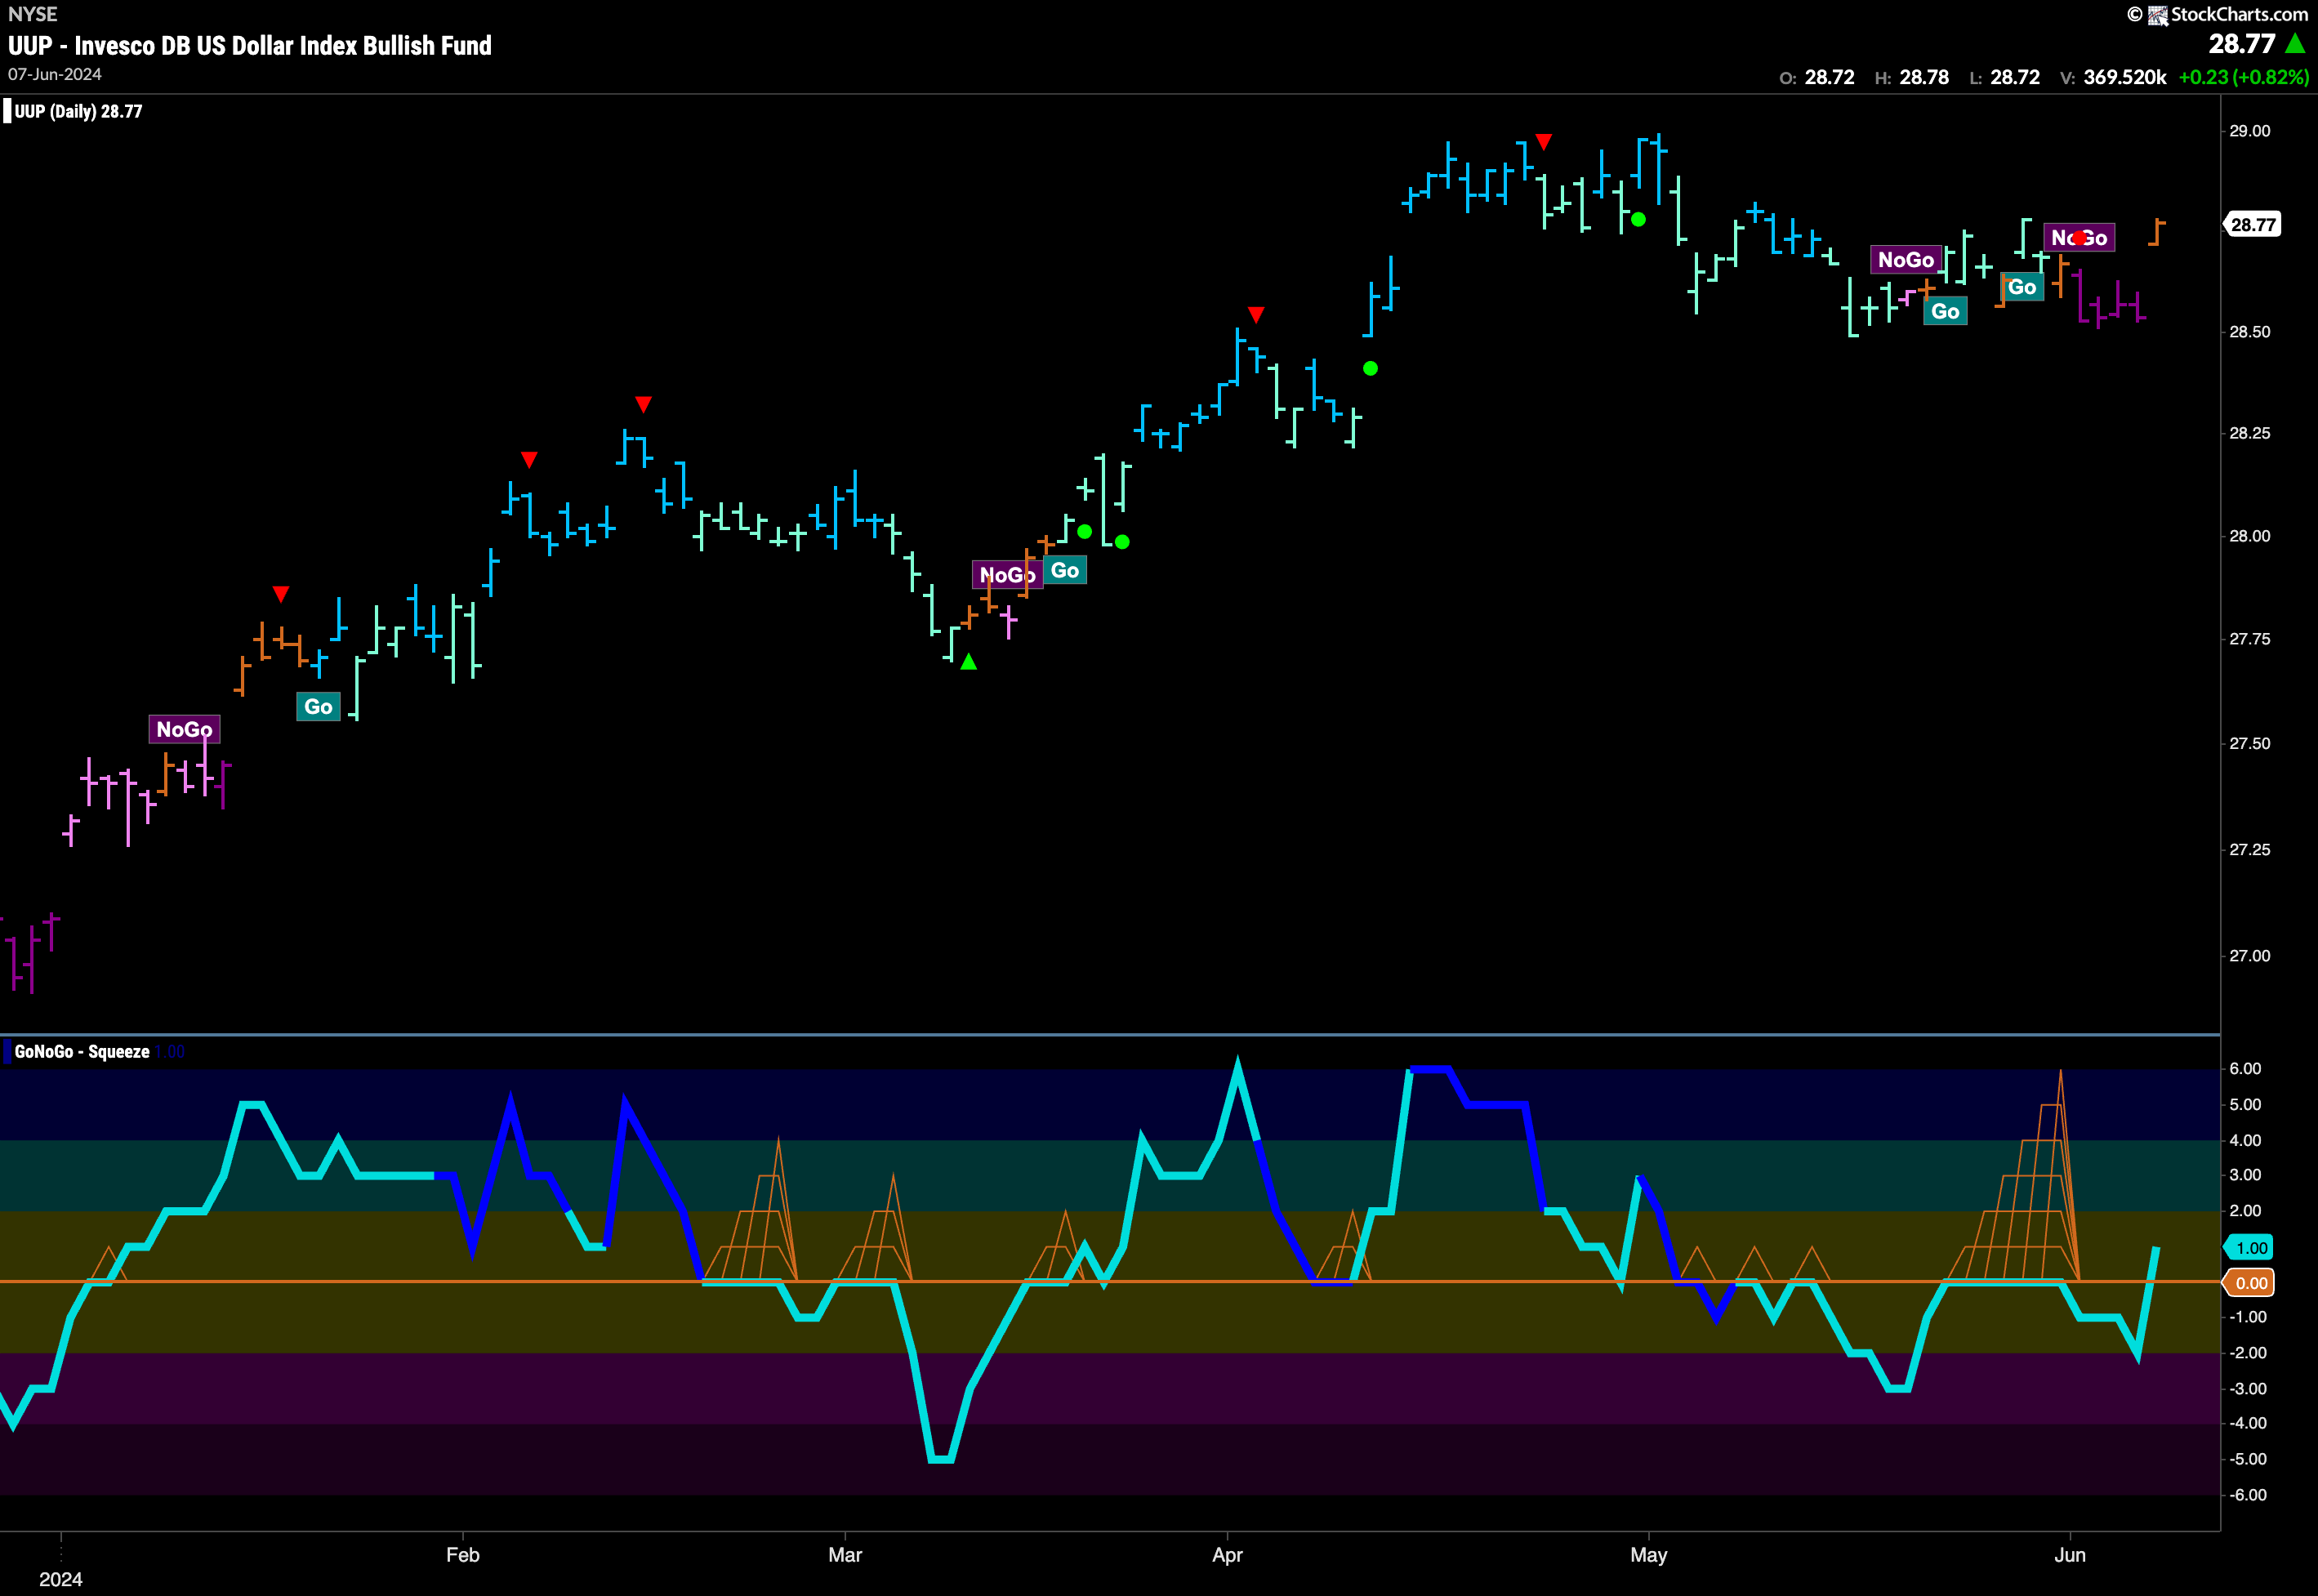
Dollar Shows Uncertainty with “Go Fish” Bar
This week saw a “NoGo” take over the greenback for much of the week. However, on Friday, GoNoGo Trend painted an amber “Go Fish” bar and so we will watch to see in which direction the trend goes this week. As price jumped higher to paint the amber bar, GoNoGo Oscillator reversed course sharply from moving lower in negative territory to a value of +1. We will be interested to see if the oscillator remains in positive territory or if it retests the zero line right away.
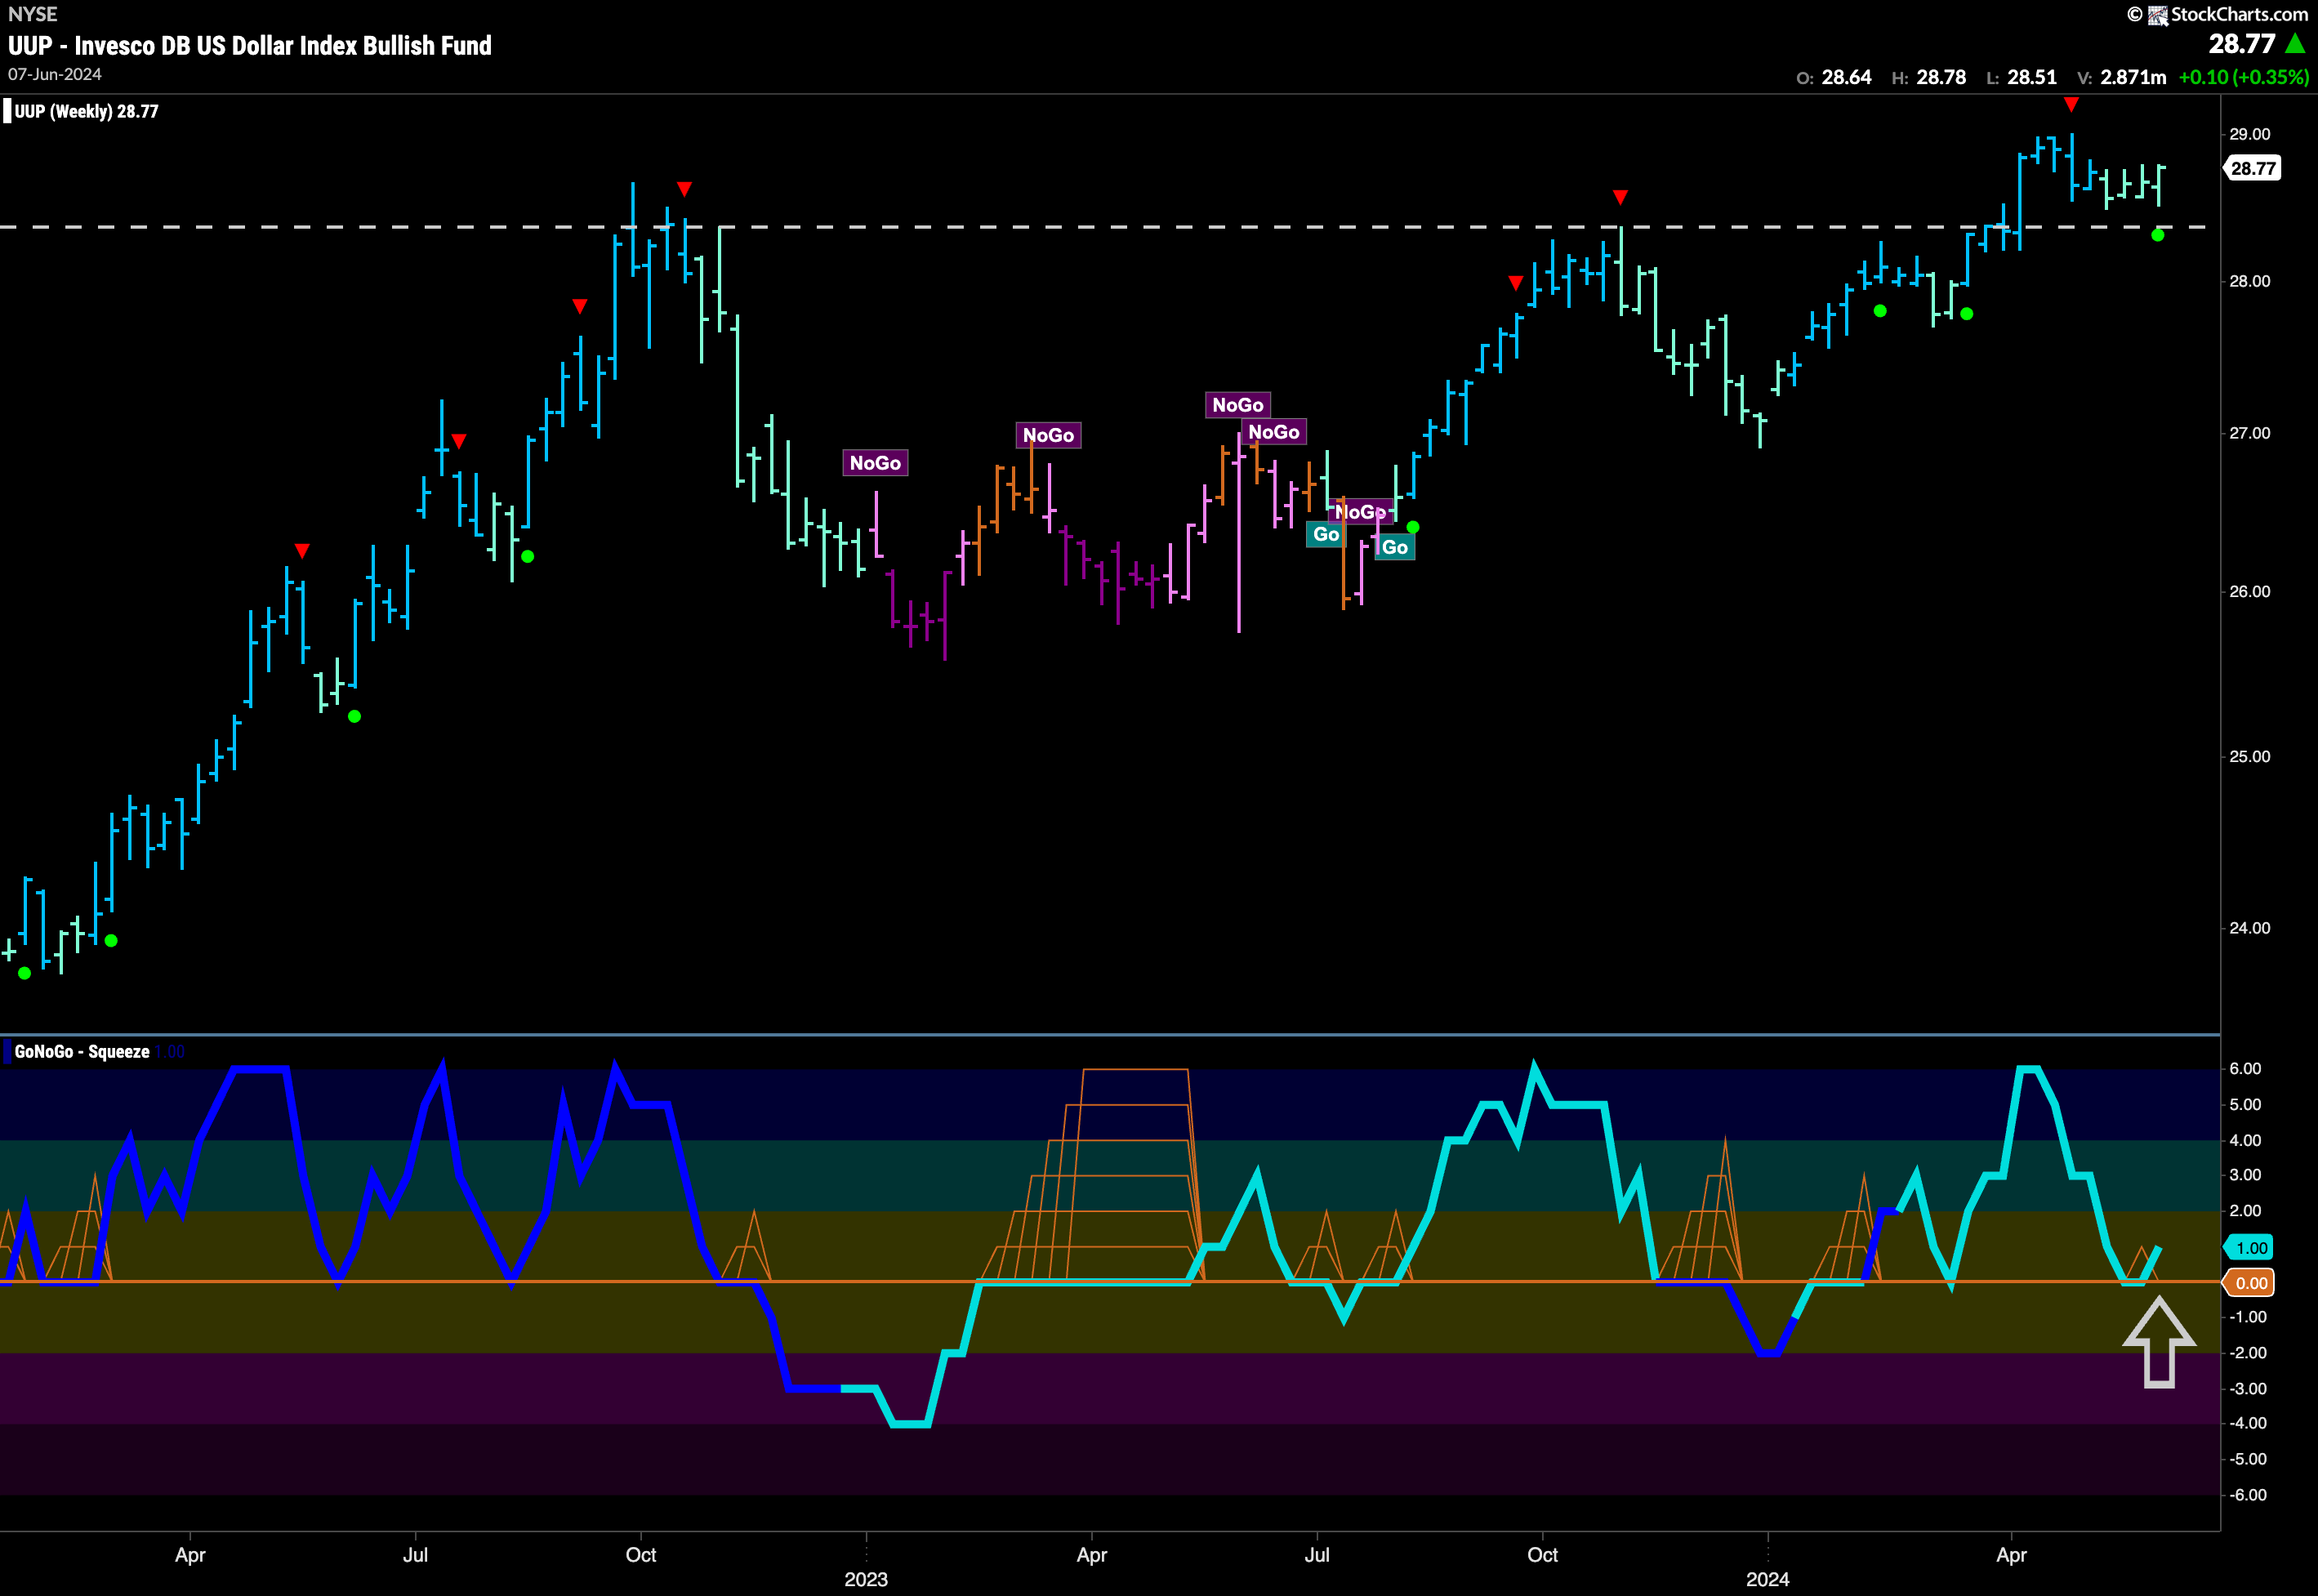
The weekly chart shows that from a long term perspective the bulls remain in control. With price consolidating above levels that were strong areas of resistance earlier in the chart, we can expect support at those levels if needed going forward. While GoNoGo Trend is painting consecutive weaker aqua “Go” bars, we see that GoNoGo Oscillator has bounced off the zero line and is back in positive territory. This gives us a Go Trend Continuation Icon (green circle) under the price bar and we can say that momentum is resurgent in the direction of the “Go” trend.
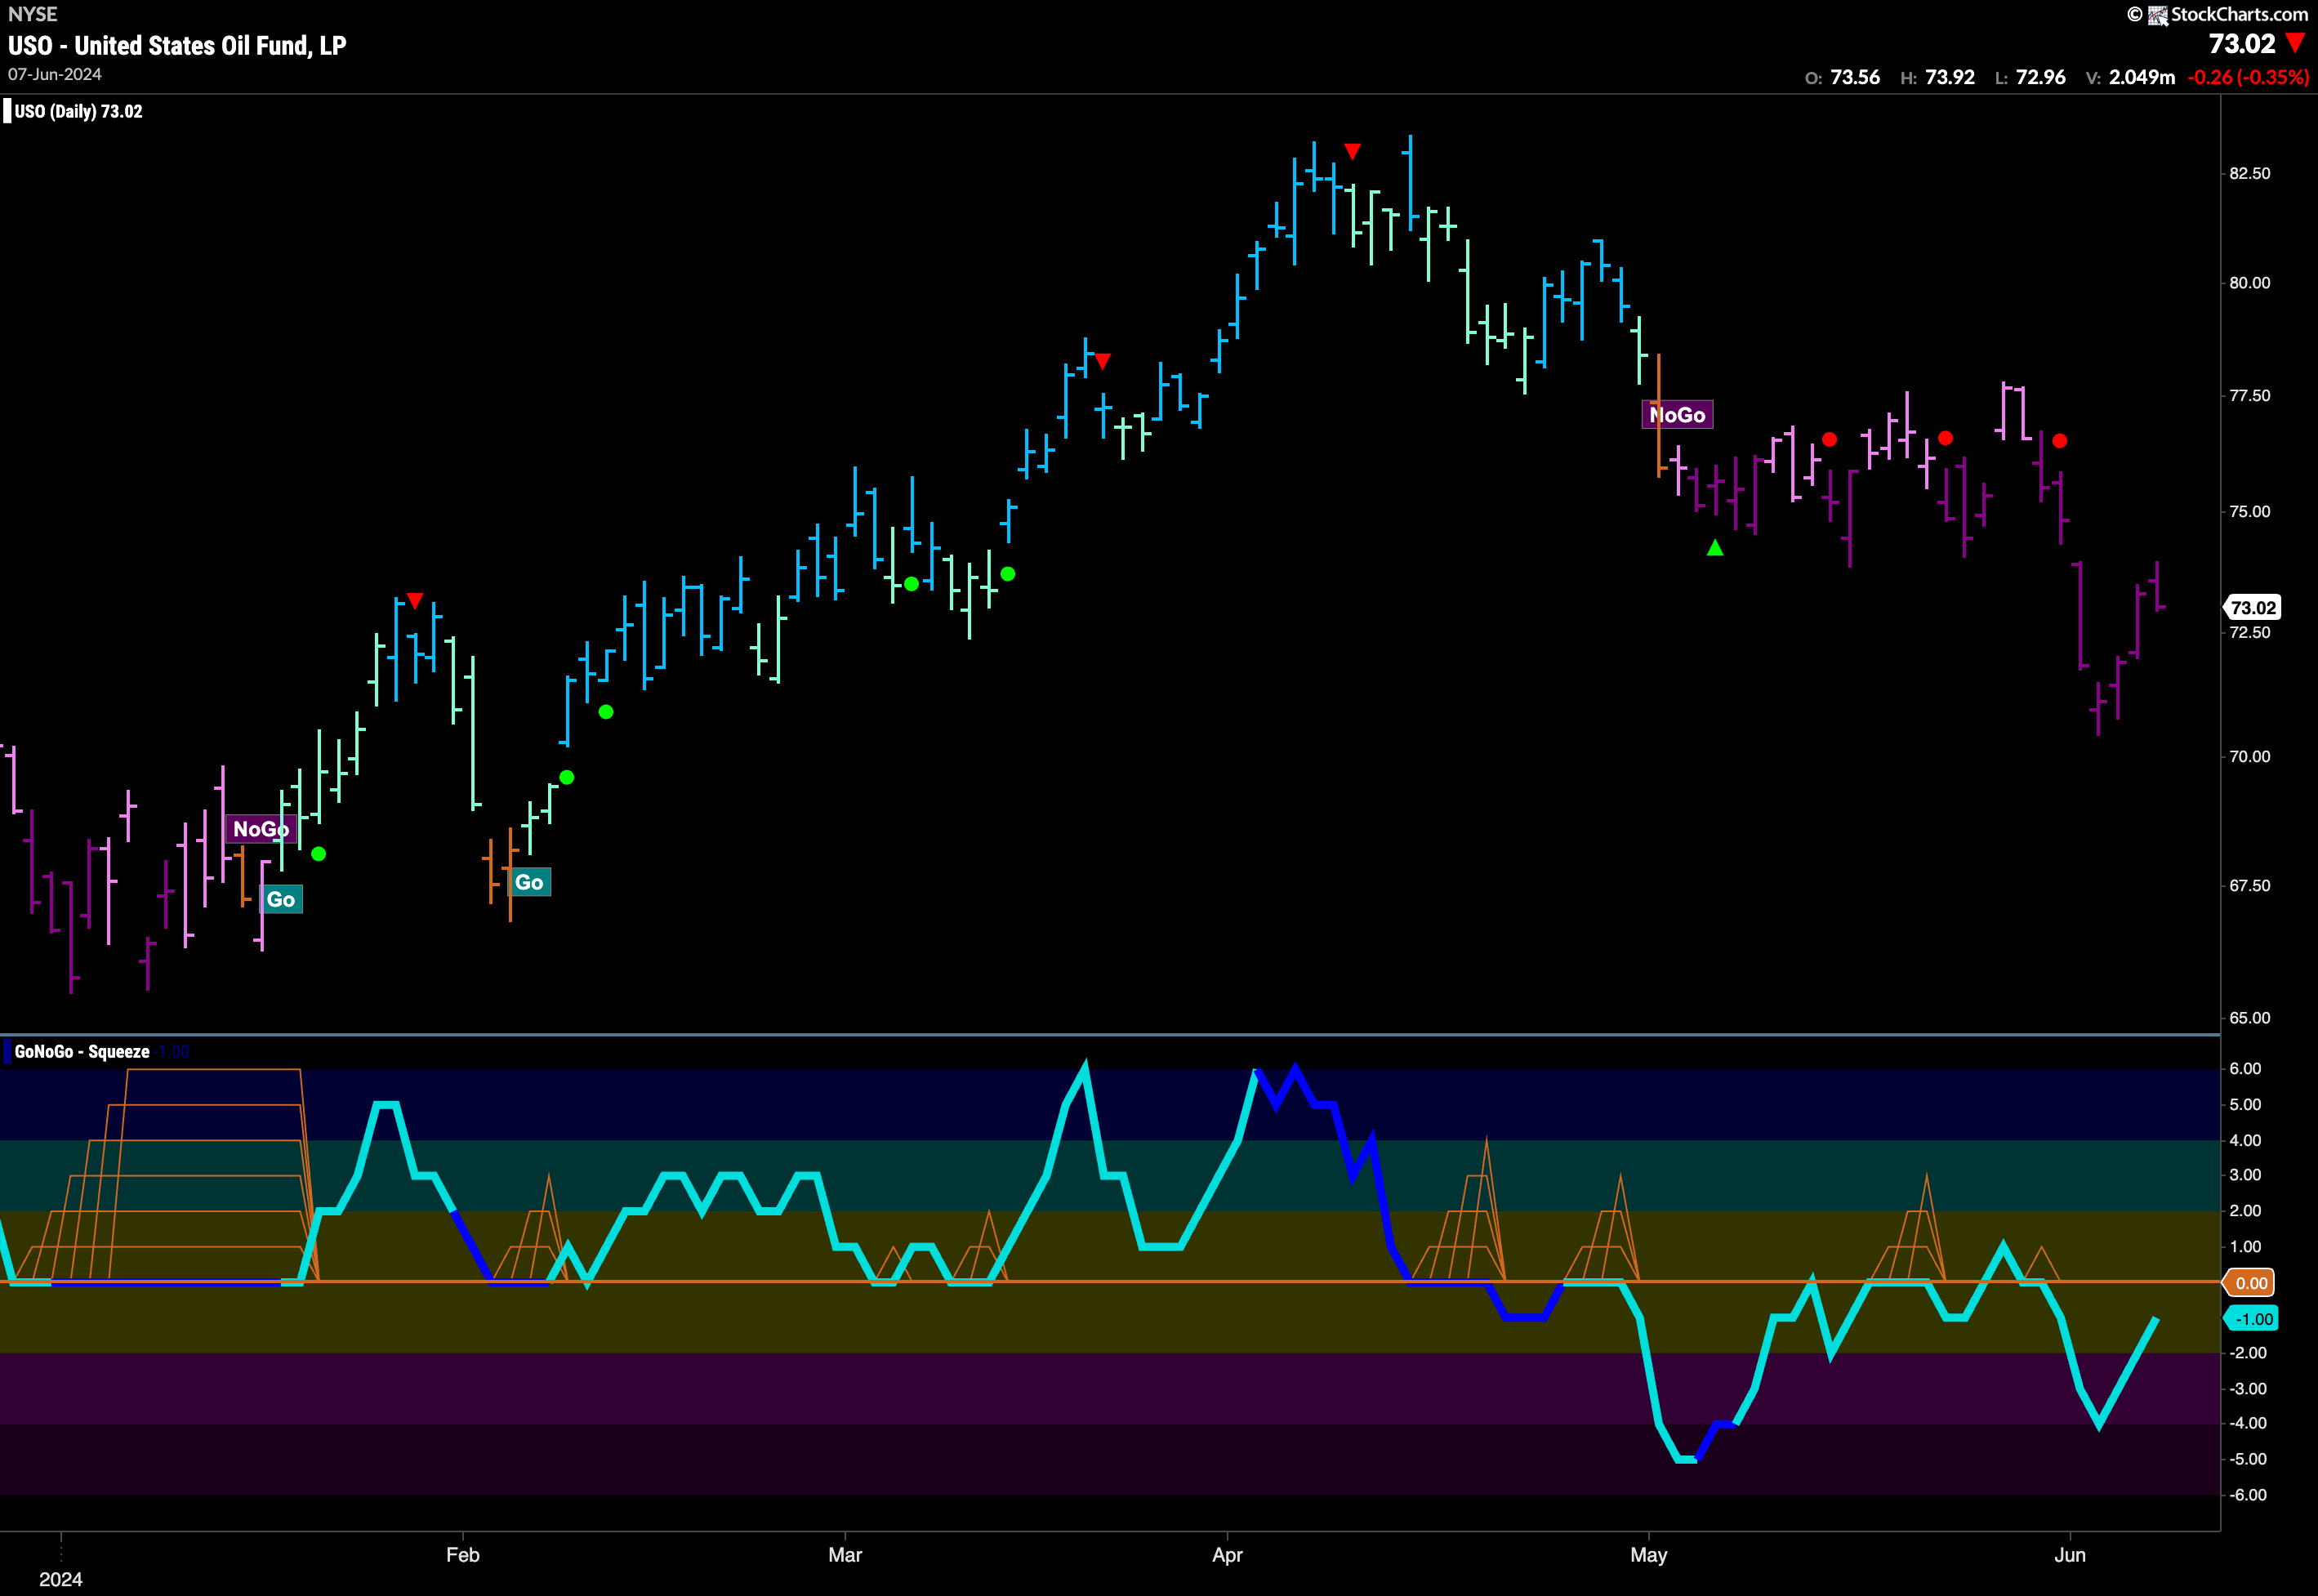
Oil Rallies after Hitting new Lower Low
The “NoGo” trend was strong again this week as the GoNoGo Trend indicator painted a complete week of purple bars. After setting a new lower low, price rallied but is still below what may be resistance in the form of prior lows. GoNoGo Oscillator is rising but is not yet at the zero level. If it gets there, we will look to see if it finds resistance and gets turned back into negative territory. If this happens, we would see signs of NoGo Trend Continuation.
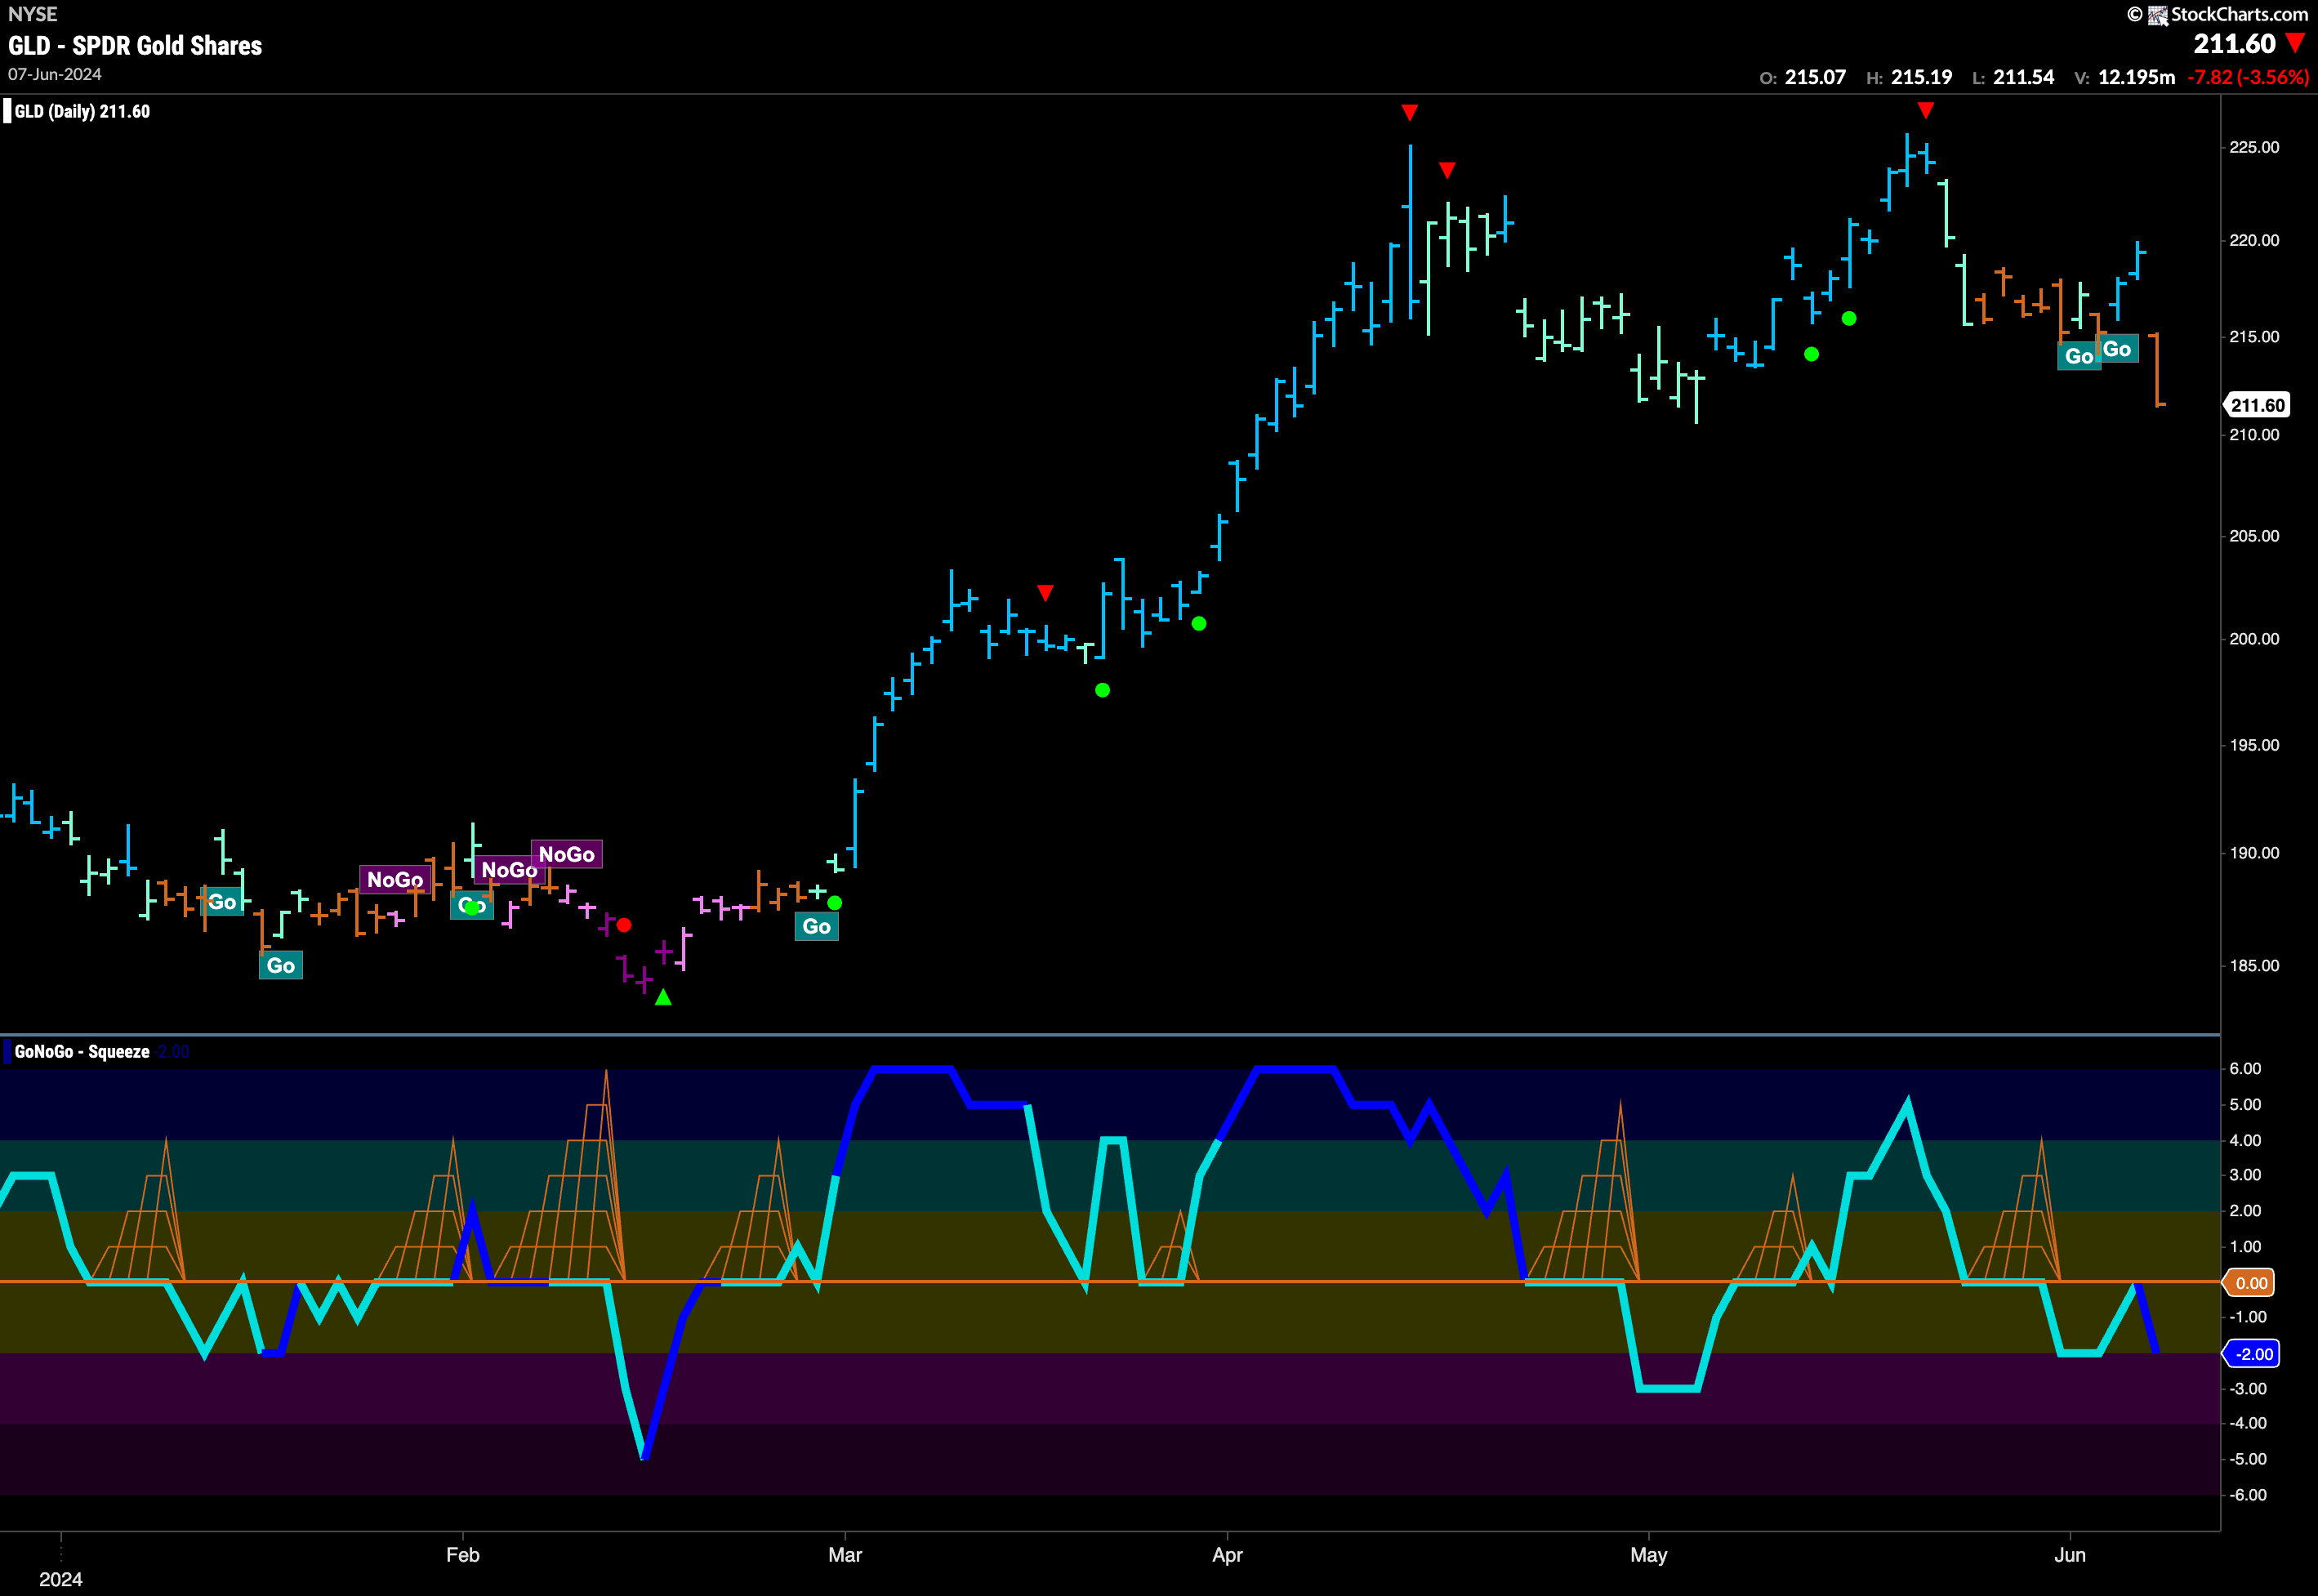
Gold Still Struggling for Direction
A mid week rally saw GoNoGo Trend paint a couple of blue “Go” bars but Friday saw an amber “Go Fish” bar return as the market was not convinced. We will watch to see what happens this week as price closes in on an area that could be support from May’s prior low. Worryingly for the Gold bulls, GoNoGo Oscillator has been turned away by the zero line and is in negative territory on heavy volume.
Sector RelMap
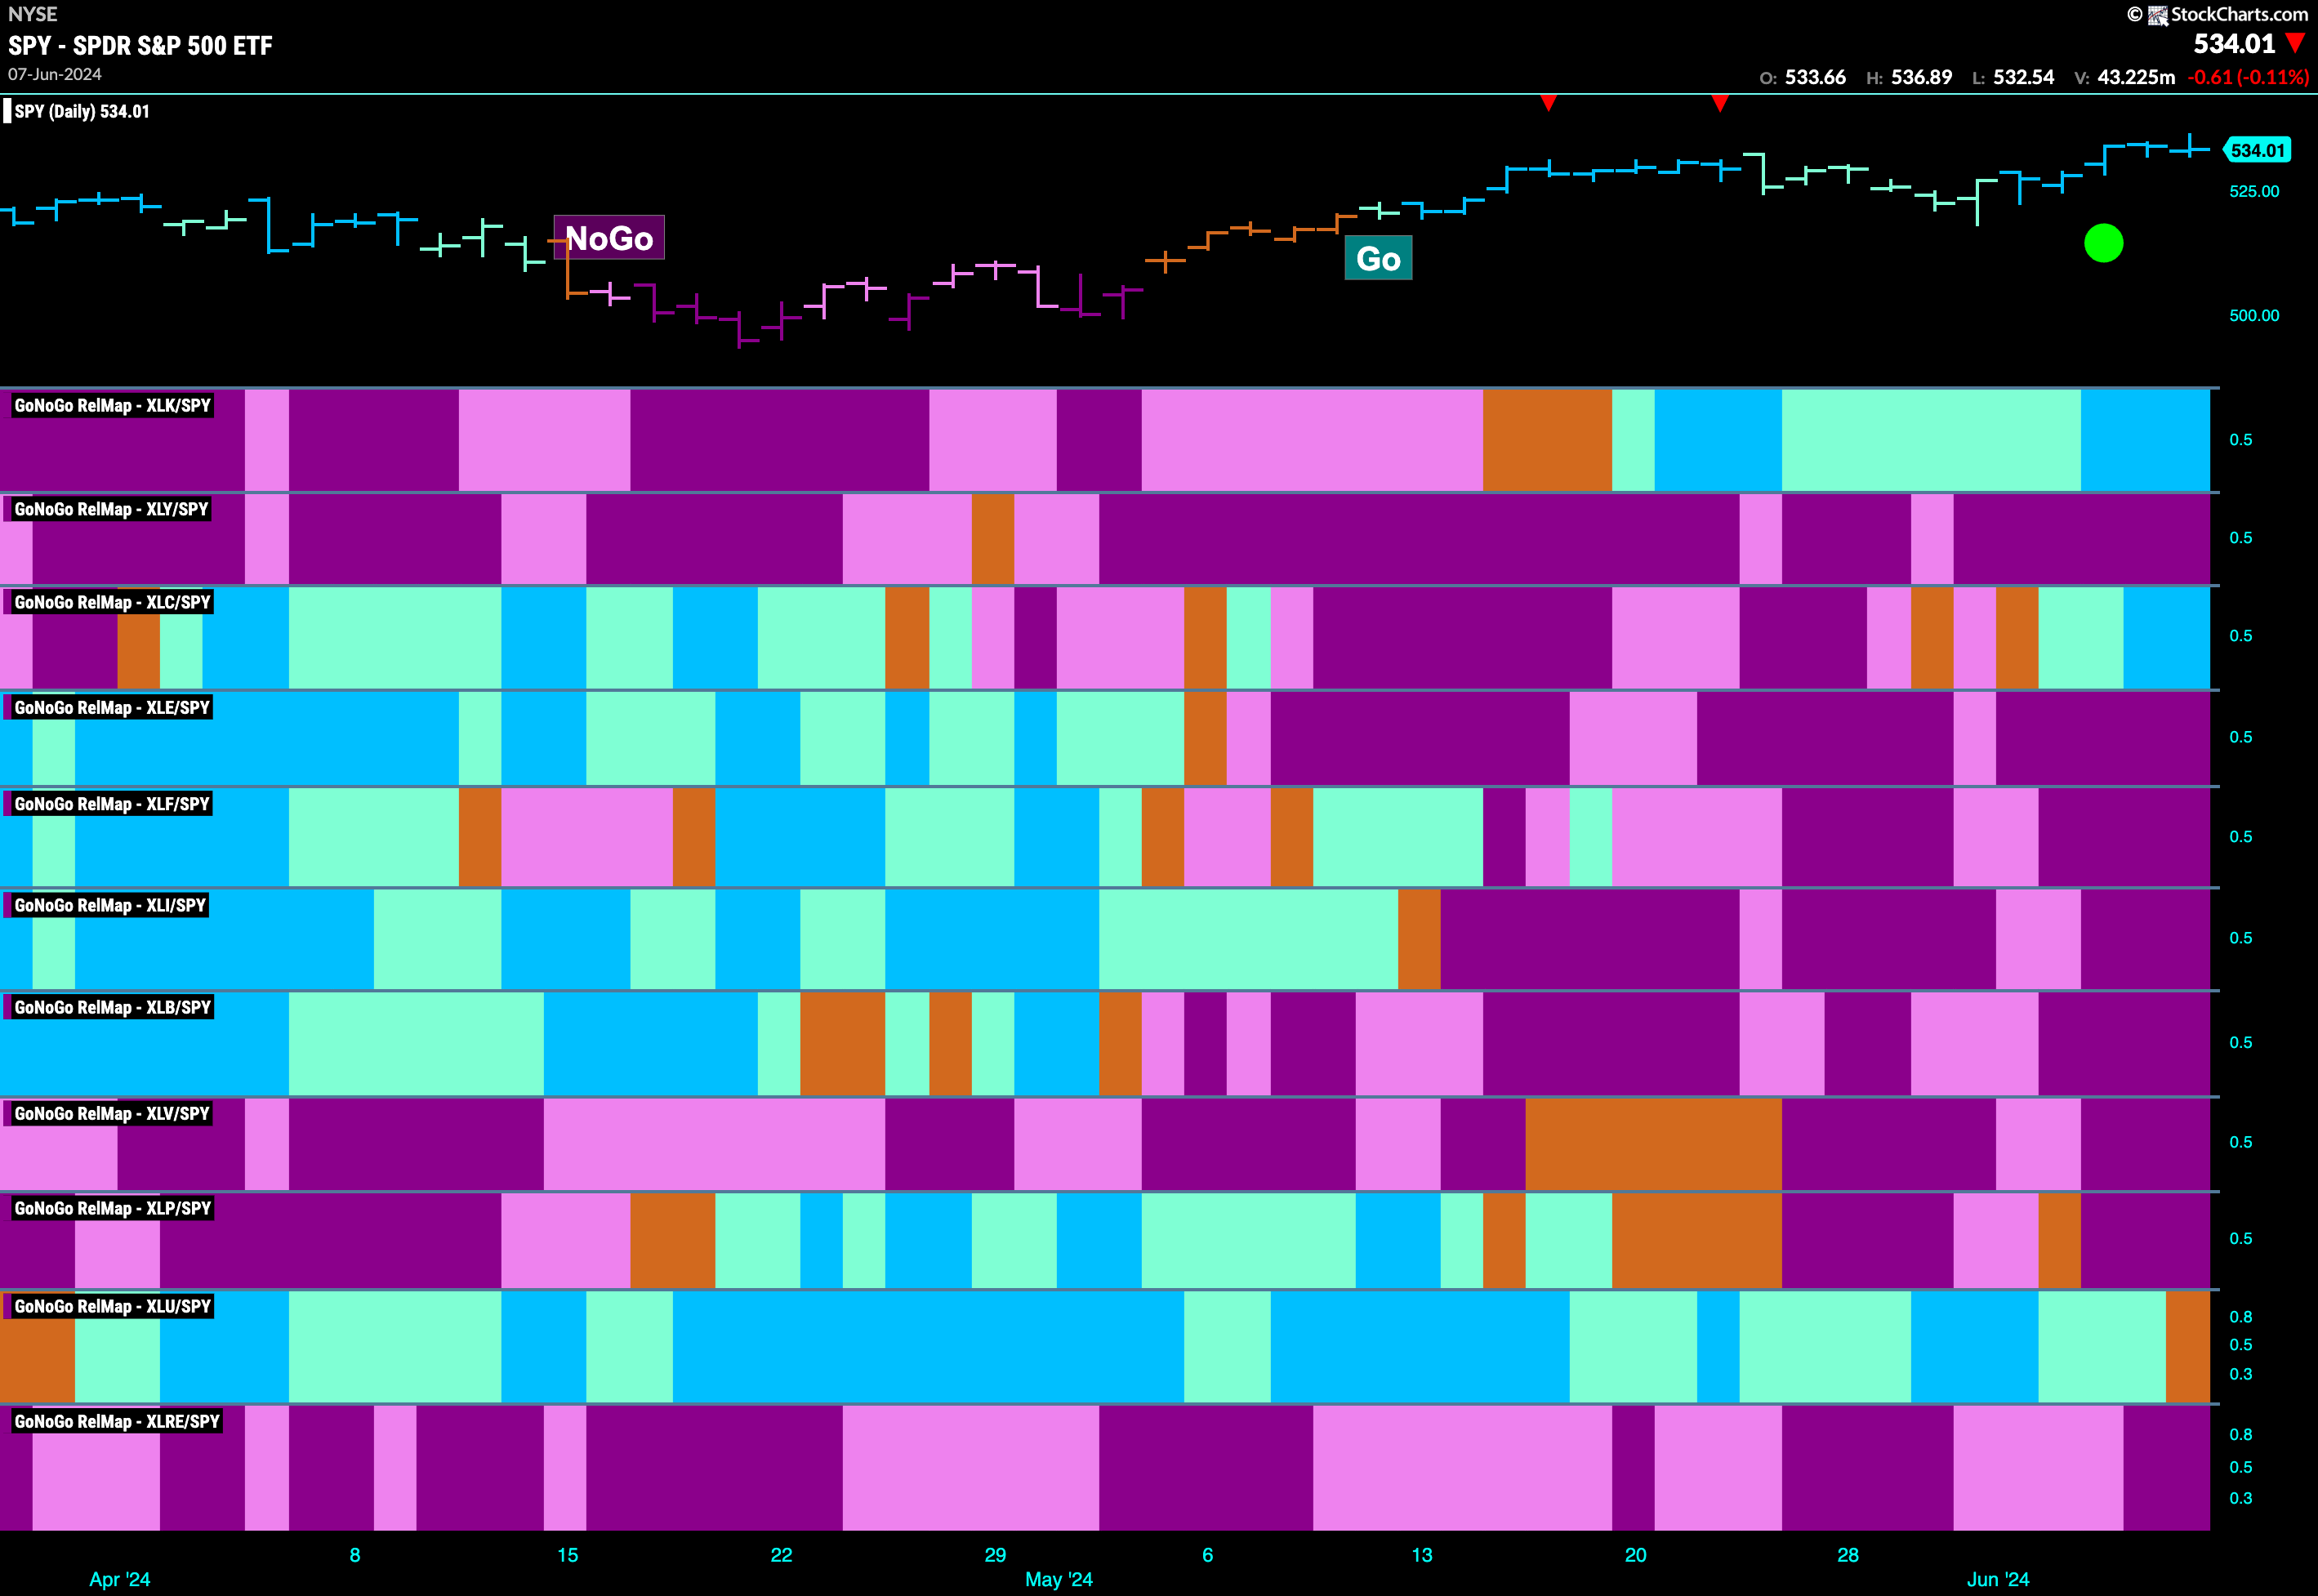
Below is the GoNoGo Sector RelMap. This GoNoGo RelMap applies the GoNoGo Trend to the relative strength ratios of the sectors to the base index. Looking at the map, we can see that only 2 sectors are outperforming the base index this week. $XLK, and $XLC are painting relative “Go” bars.
Communications Sub-Group RelMap
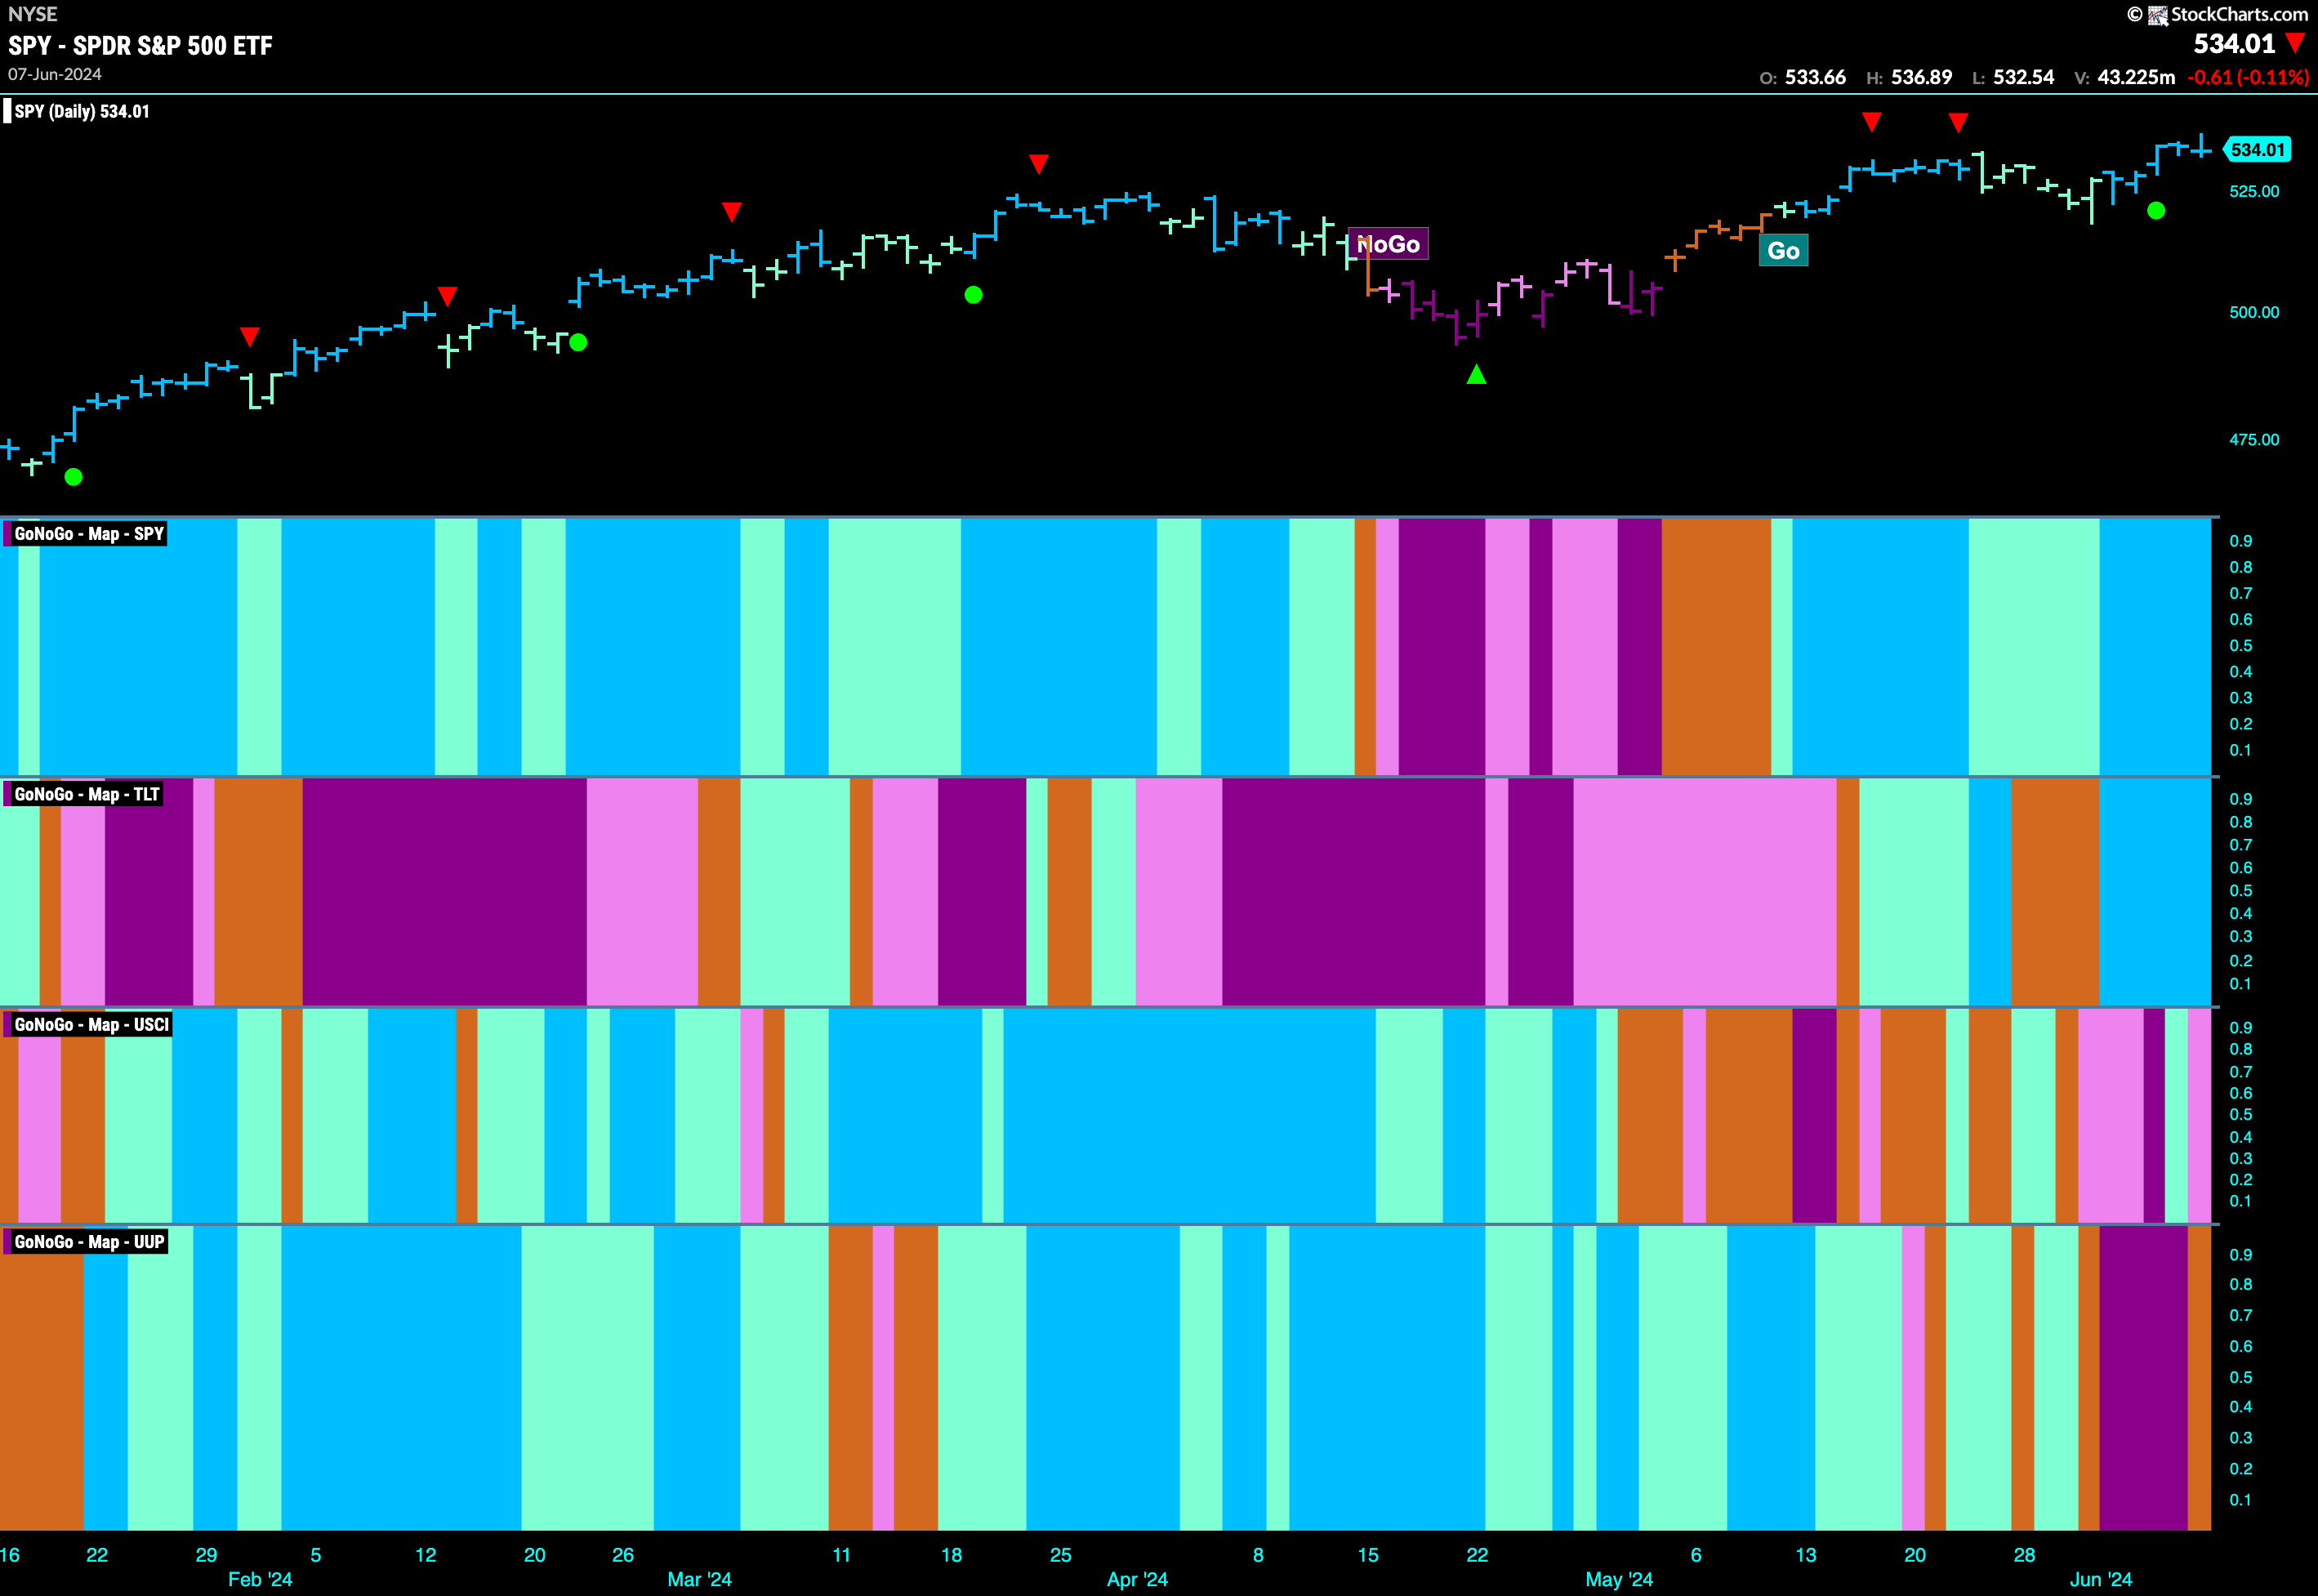
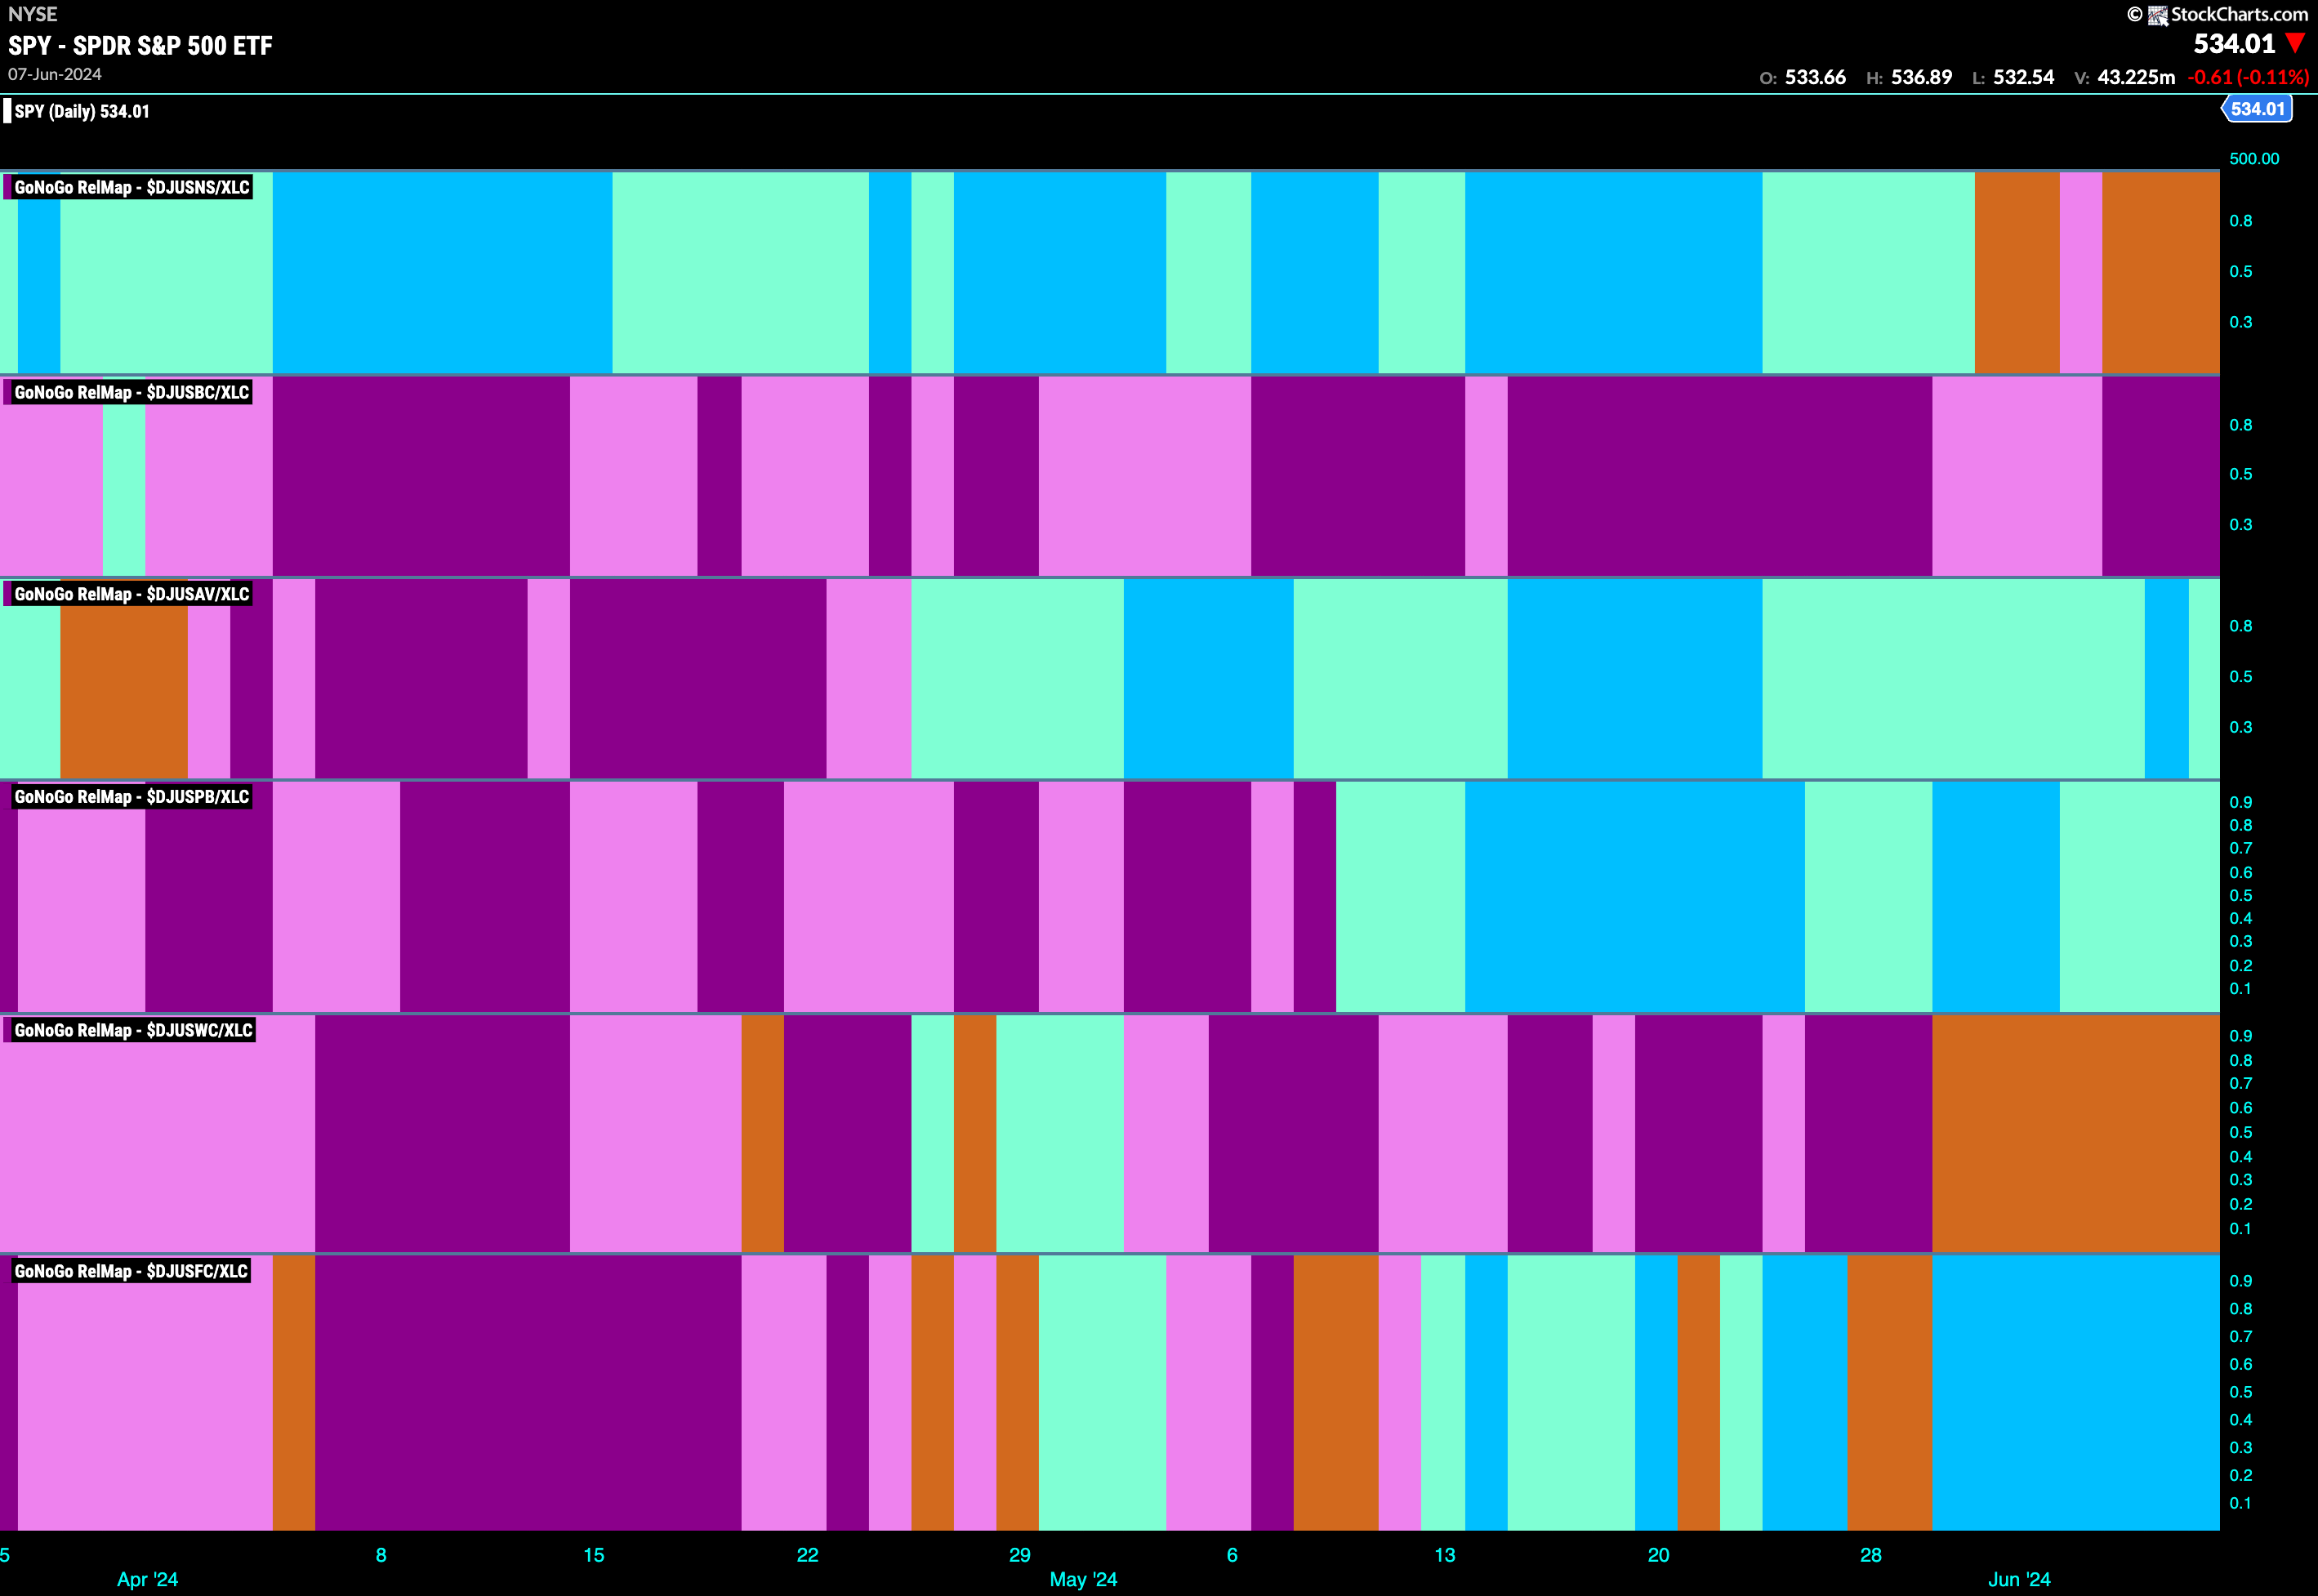
The GoNoGo Sector RelMap above shows that the communications sector has joined technology as a relative out-performer. We also can see that the relative “Go” trend has strengthened and the ratio is painting strong blue bars. Let’s take a look at the sub groups of the communications sector to see which sub indexes are driving that relative out performance. We can see that there are a few that are in relative “Go” trends but it is fixed line communications in the last panel that is showing consistent strength with bright blue “Go” bars.
$TEF Pulls Back from New High
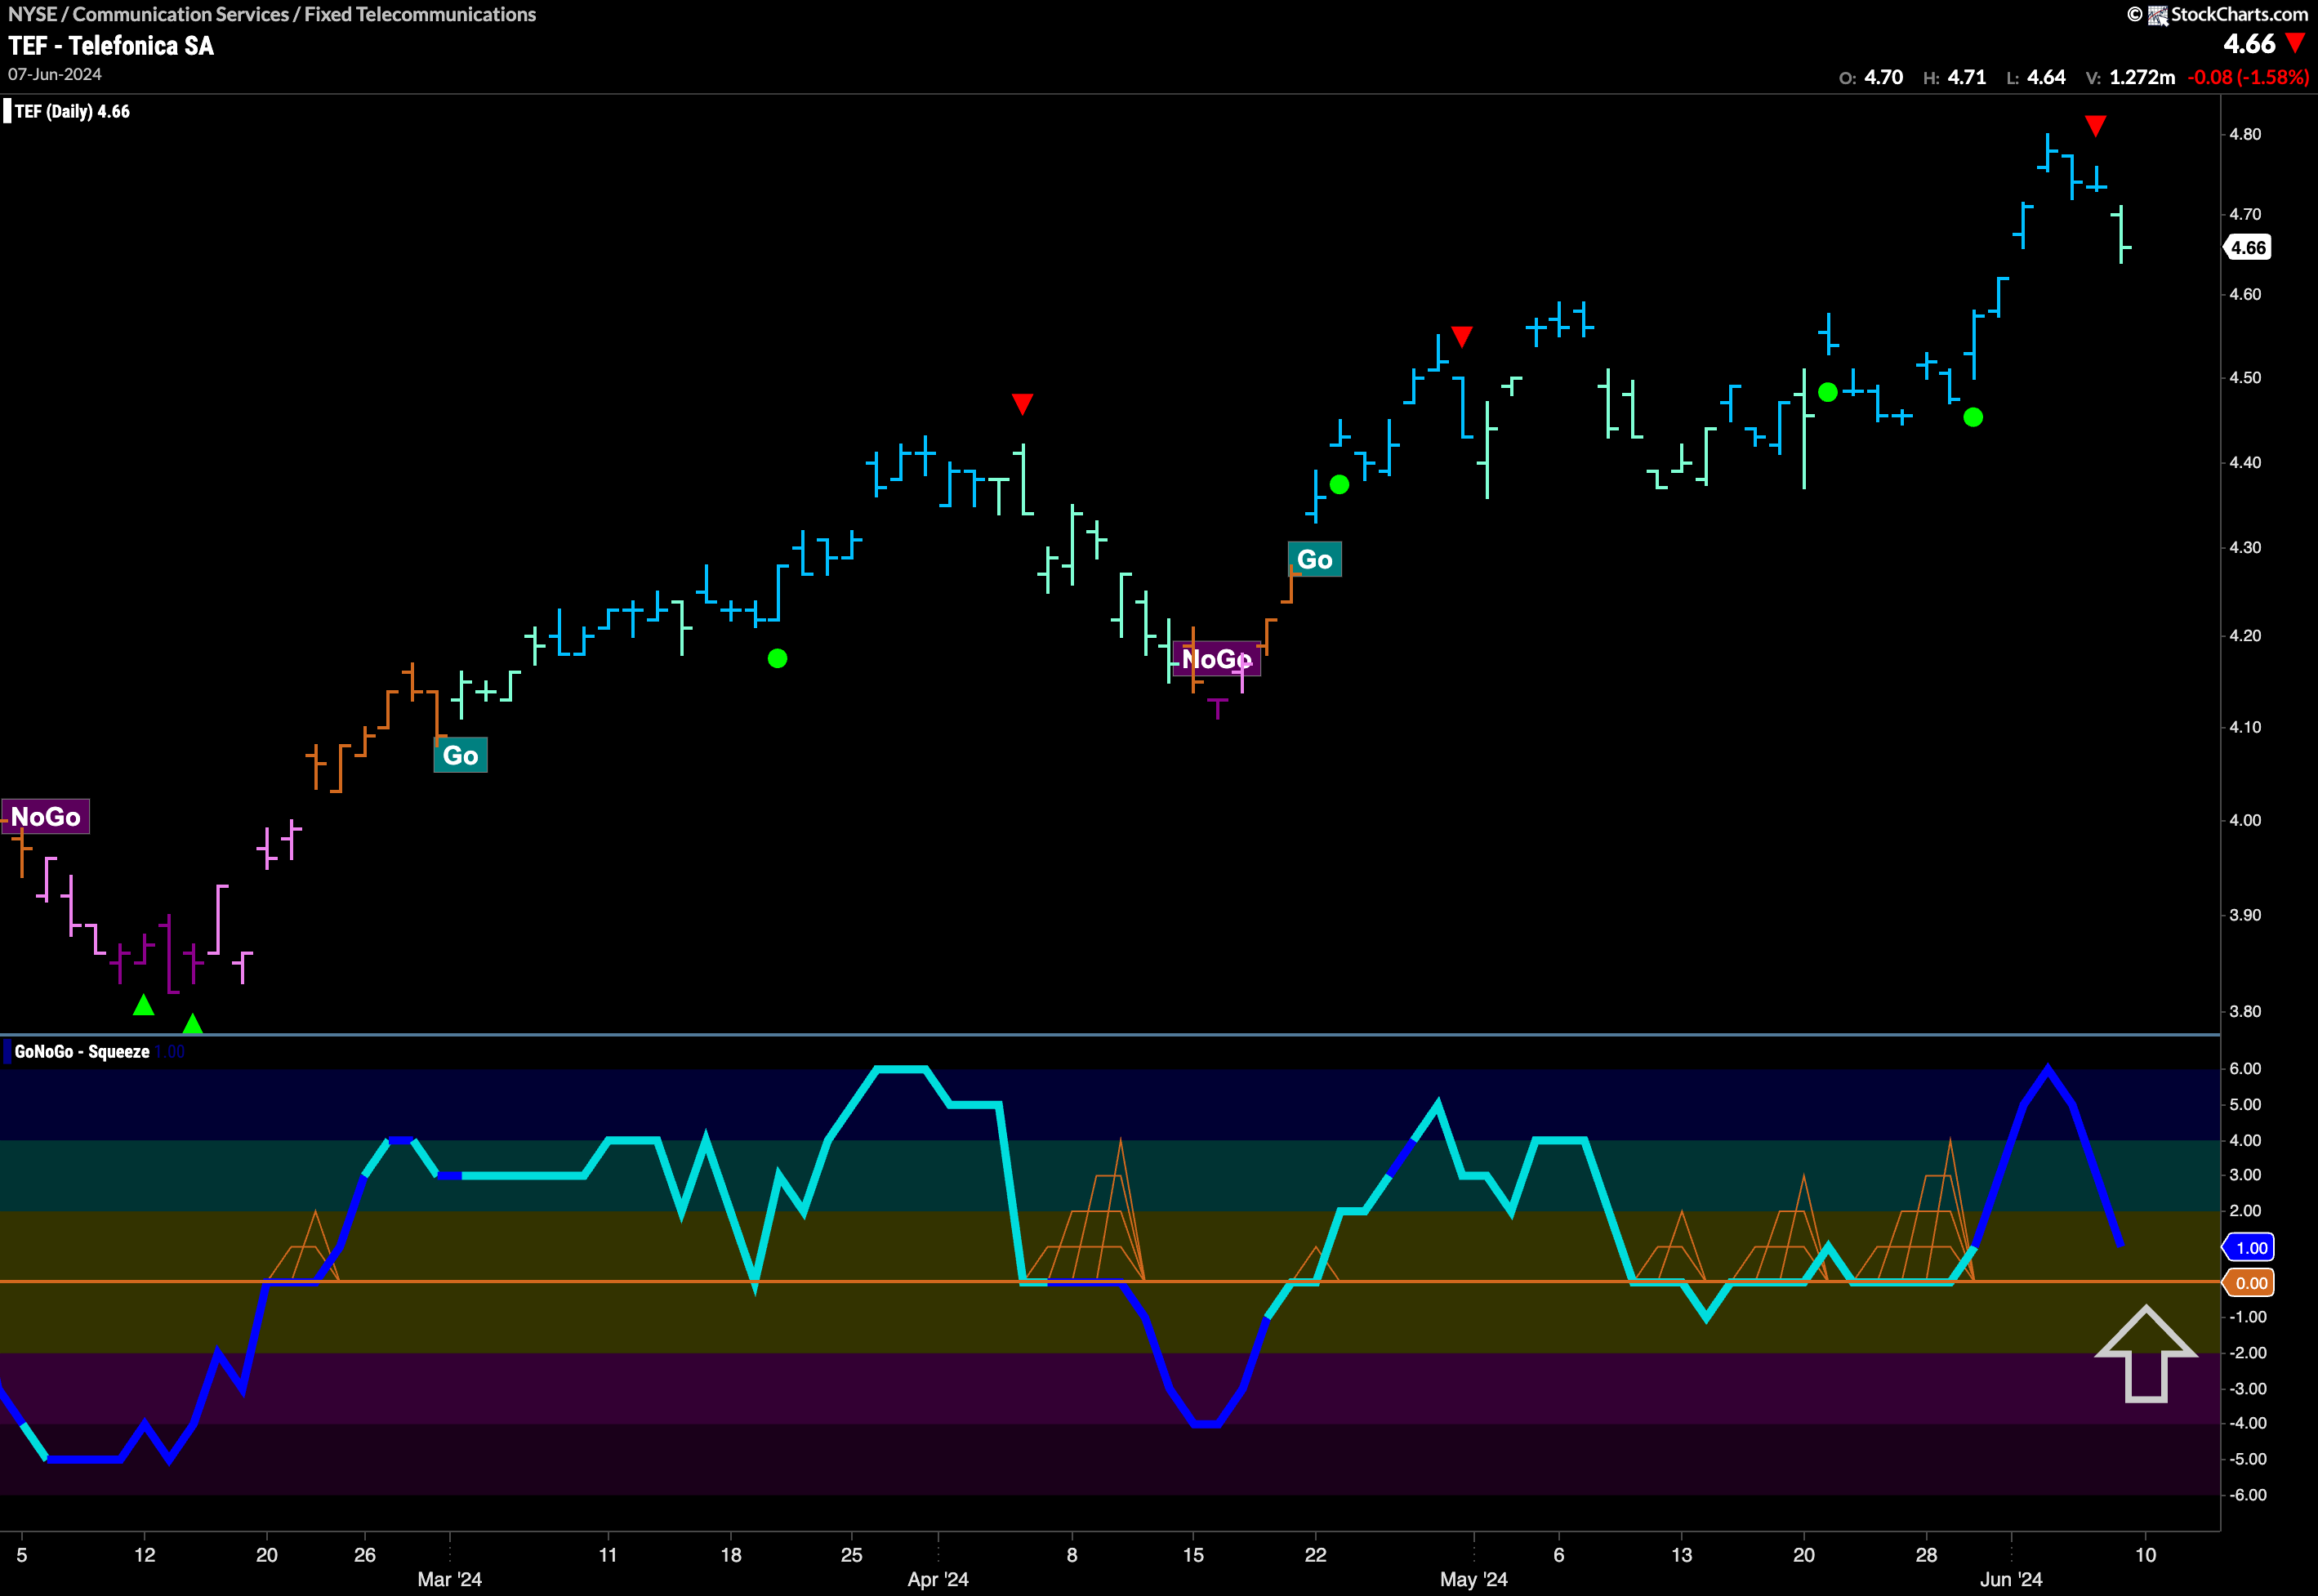
Telefonica is in a “Go” trend and we have seen a series of higher highs and higher lows. After the most recent high, we saw a Go Countertrend Correction Icon (red arrow) that tells us price may struggle to go higher in the short term. Indeed, as price falls we see a weaker aqua “Go” bar reflecting that weakness. GoNoGo Oscillator is fast approaching the zero line and volume is heavy. We will watch closely to see what happens if the oscillator hits that level. If it finds support and rallies back into positive territory then we will know that momentum is resurgent in the direction of the “Go” trend and will expect price to make an attempt at a new high.
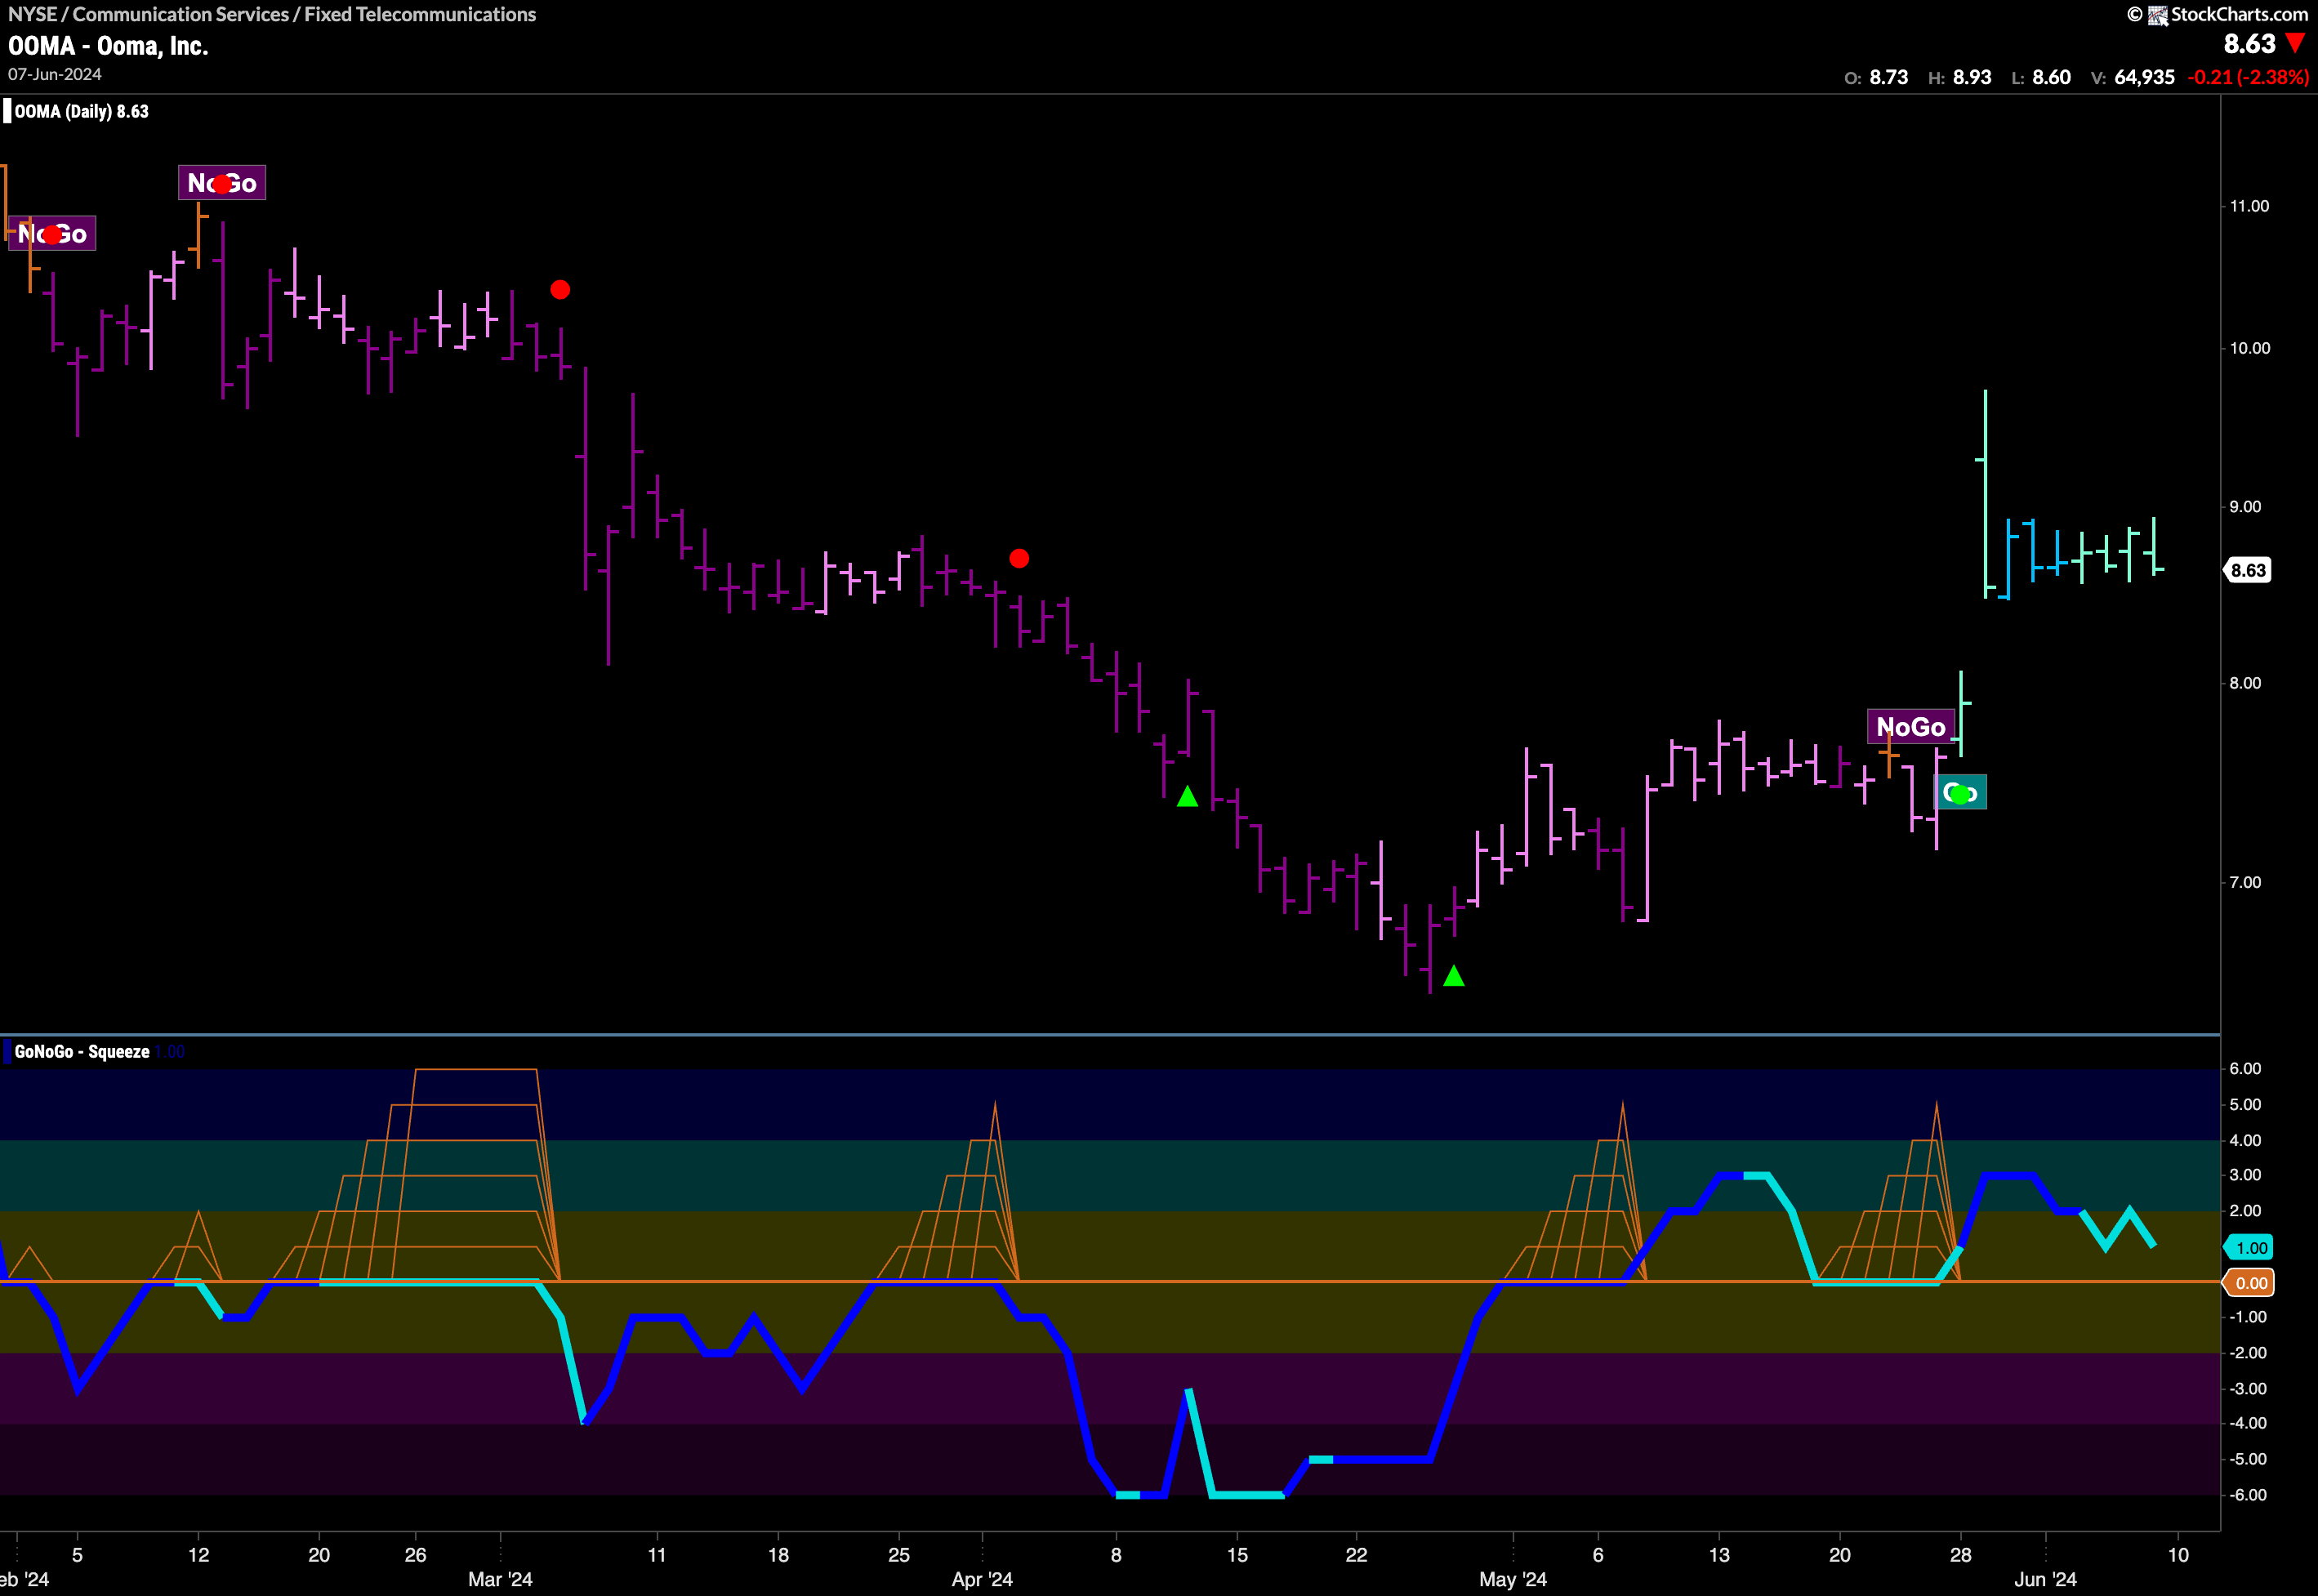
$OOMA Consolidates after Jump
$OOMA has long been a relative under performer in a “NoGo” trend that lasted several months and was destructive in terms of price action. However, as the communications saw strength over the last several weeks, so did Ooma, Inc. We first saw GoNoGo Oscillator break into positive territory out of a GoNoGo Squeeze, and it has held at or above the zero line since. Then we saw GoNoGo Trend recognize the changing technical environment a bar before the gap higher. We will look for support at the gap and for GoNoGo Oscillator to remain at or above zero to give price the chance it needs to move higher.
