
Good morning and welcome to this week’s Flight Path. Let’s take a look at the below GoNoGo Asset Map for this week. There are some cracks emerging now. The asset map shows the GoNoGo Trend applied to the major asset classes and displayed as a panel as the colors change with price trend. The top panel shows the S&P and we can see that the “Go” trend that took hold at the end of March is in trouble. We saw 3 amber “Go Fish” bars creep in to the mix last week. With momentum in negative territory, there is a lot to be concerned about. Treasury bond prices remain in a strong “NoGo” with no let up in sight. Commodities and the dollar remain in “Go” trends as Bitcoin struggled this week, painting “NoGo” bars.

Struggles for the S&P 500
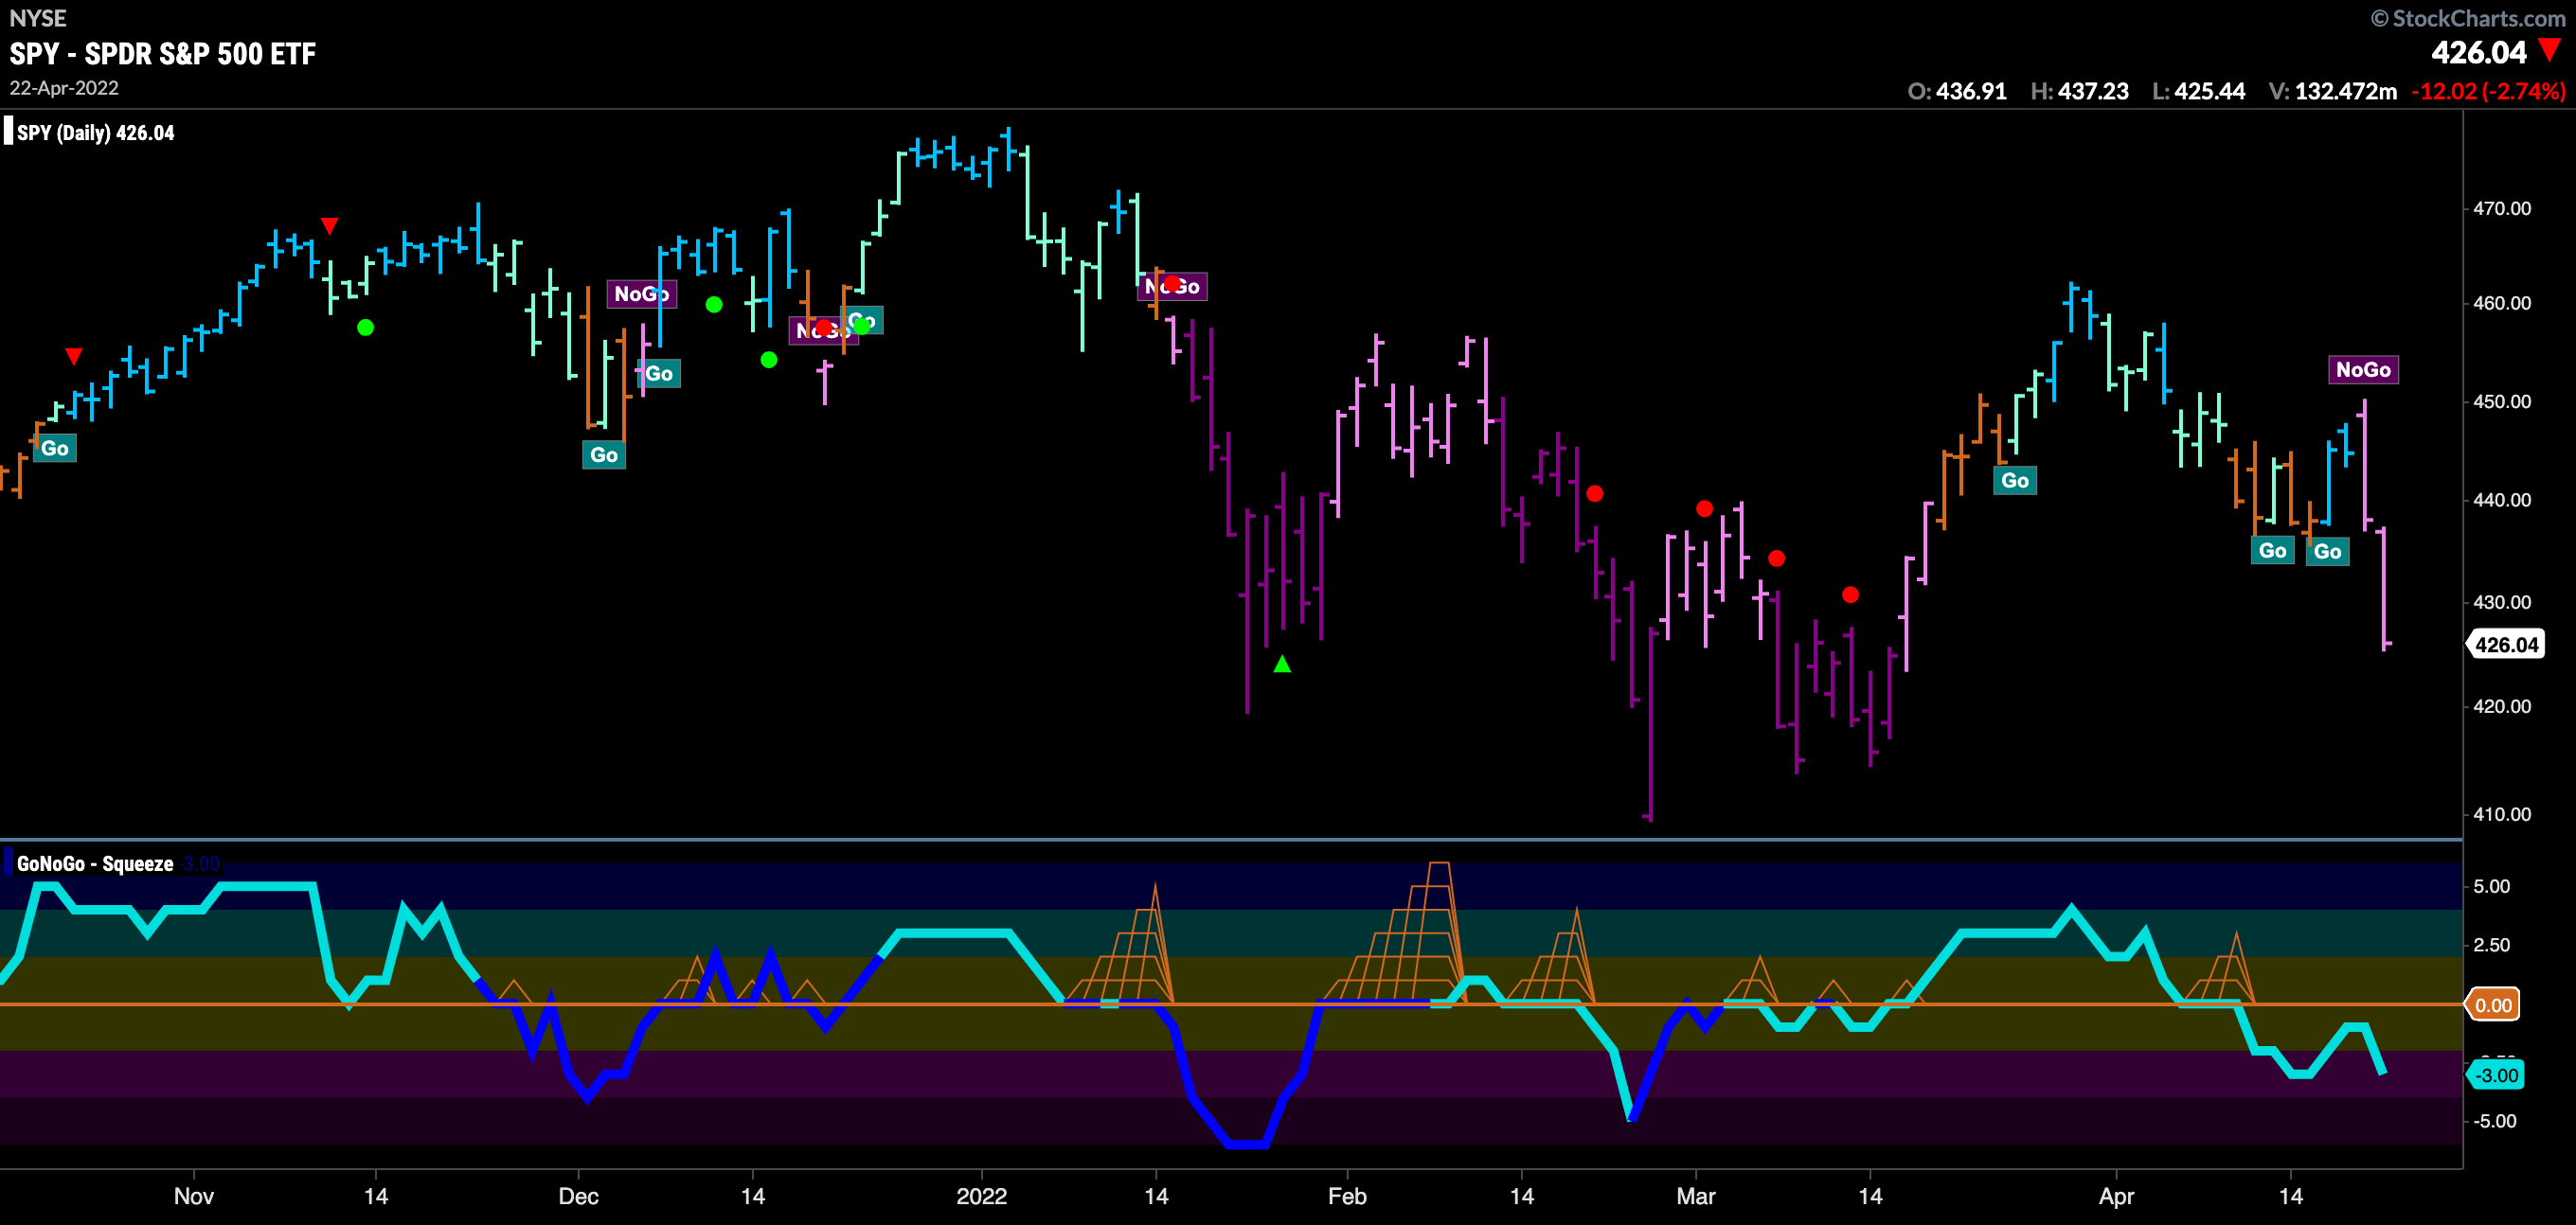
Below is the chart of $SPY with GoNoGo Trend and GoNoGo Oscillator applied. GoNoGo Trend was unable to maintain “Go” colors throughout the week as we saw several “Go Fish” bars appear. In the lower panel, those looking for support at the zero line would have been disappointed. GoNoGo Oscillator fell below zero as GoNoGo Trend painted amber “Go Fish” bars. Instead of rallying quickly back to test zero from below the oscillator has continued to fall further into negative territory to end the week.

Sector Performance
Below is the GoNoGo Sector Relmap. This GoNoGo Relmap applies the GoNoGo Trend to the relative strength ratios of the sectors to the base index. Looking at this map, we can quickly see where the relative outperformance is coming from as well as which sectors are lagging on a relative basis. This picture remains similar to weeks past. The defensive sectors continue to lead, utilities, healthcare, real estate. Materials are also looking strong since early March. Technology, discretionary and communications continue to struggle.

Technology in Trouble
Below is the weekly GoNoGo chart of the technology sector, $XLK. We can see that the trend has been a “NoGo” now since March and price recently corrected against that trend but has put in a lower high as the trend strengthened once again to strong purple bars. The lower panel shows the GoNoGo Oscillator warned of this coming trend change when it broke below zero ahead of the color change in the price panel above. Now, after testing the zero line from below and finding resistance, the oscillator is moving back into negative territory as we see a NoGo Trend Continuation icon (red circle) above the latest price bar.

Western Digital Corp Ready to Test Lows
In the technology sector therefore, we could look for opportunities on the short side. Below is the GoNoGo Chart of Western Digital Corp with the GoNoGo Trend and Oscillator applied. The “NoGo” trend is in place and has been strong since late January of this year with a series of lower highs and lower lows as the pinks and purples have been unbroken. While the oscillator has made a couple of brief forays into positive territory during this trend, it has most recently been turned away by the zero line after a “GoNoGo” squeeze built. With momentum plummeting, we can look for price to attempt to set a new lower low below $45.

Materials on the Mend
One of the sectors that continues to display leadership on a relative basis during this time is the materials sector. The GoNoGo Chart below shows that unlike the S&P the “Go” trend hasn’t faltered, instead it has strengthened this week as strong blue bars return and we see a Go Trend Continuation Icon (green circle) under price indicating that momentum remains on the side of the trend. This being the case, we would look for price to set a new high above $90.

U.S. Steel Still Strong
The GoNoGo Chart below of $X shows that a “Go” trend is in place and strengthened to paint strong blue bars this week. GoNoGo Oscillator suggested the emergence of the “Go” trend in February when it broke out of a GoNoGo Squeeze into positive territory. GoNoGo Trend then painted a mix of amber “Go Fish” and pink “NoGo” bars before identifying the “Go” trend proper at the end of the month. Since then, GoNoGo Oscillator has remained in positive territory. Now, as prices have moved mostly sideways since hitting highs at the end of March, GoNoGo Oscillator has fallen to the zero line where it has stayed. A max GoNoGo Squeeze has built up (climbing orange grid) and we will watch to see in which direction the Squeeze is broken. If the trend is strong in the materials sector and U.S. Steel, we can look for the oscillator to break out of the squeeze into positive territory which would allow price to make an attempt at a new higher high.

Utilities Still on the Up
Another sector that we saw displaying leadership qualities in the GoNoGo Sector Map at the top of this note, was the utilities sector. Below is the GoNoGo Chart of $XLU. We can see that like materials, and unlike the S&P at large, the “Go” trend remains a force to be reckoned with. After setting a higher high a week ago, price momentum has cooled and as price has corrected sideways after the Go CounterTrend Correction red arrow, the oscillator has fallen and is approaching the zero line. We will watch to see if it finds support at this level, as it should in a “Go” trend.

Let’s See Some NRG!
With the trend in the utilities sector looking strong, let’s turn to a stock within that sector to perhaps capitalize and capture some alpha. $NRG is the security displayed in the GoNoGo Chart below, As you can see it has lagged the utilities sector in that the “Go” trend has been more recently identified. However, what we like about this chart is that having established a “Go” trend in early April we are seeing a fresh Go Trend Continuation Icon (green circle) under the last bar. This tells us that while the “Go” trend is in place, there is a resurgence of momentum in the direction of the trend. All else being equal we would expect price to make a new swing high above $40.


