Good morning and welcome to this week’s Flight Path. Equities maintained the “NoGo” trend this week but we did see some weakness in that trend as prices tried to rally. The indicator painted weaker pink bars. Treasury bond prices also saw the strong purple give way to weaker pink “NoGo” bars this week. Commodity prices stayed strong as we see blue “Go” bars and the dollar continued to show nothing but strength.
Equities Below Resistance
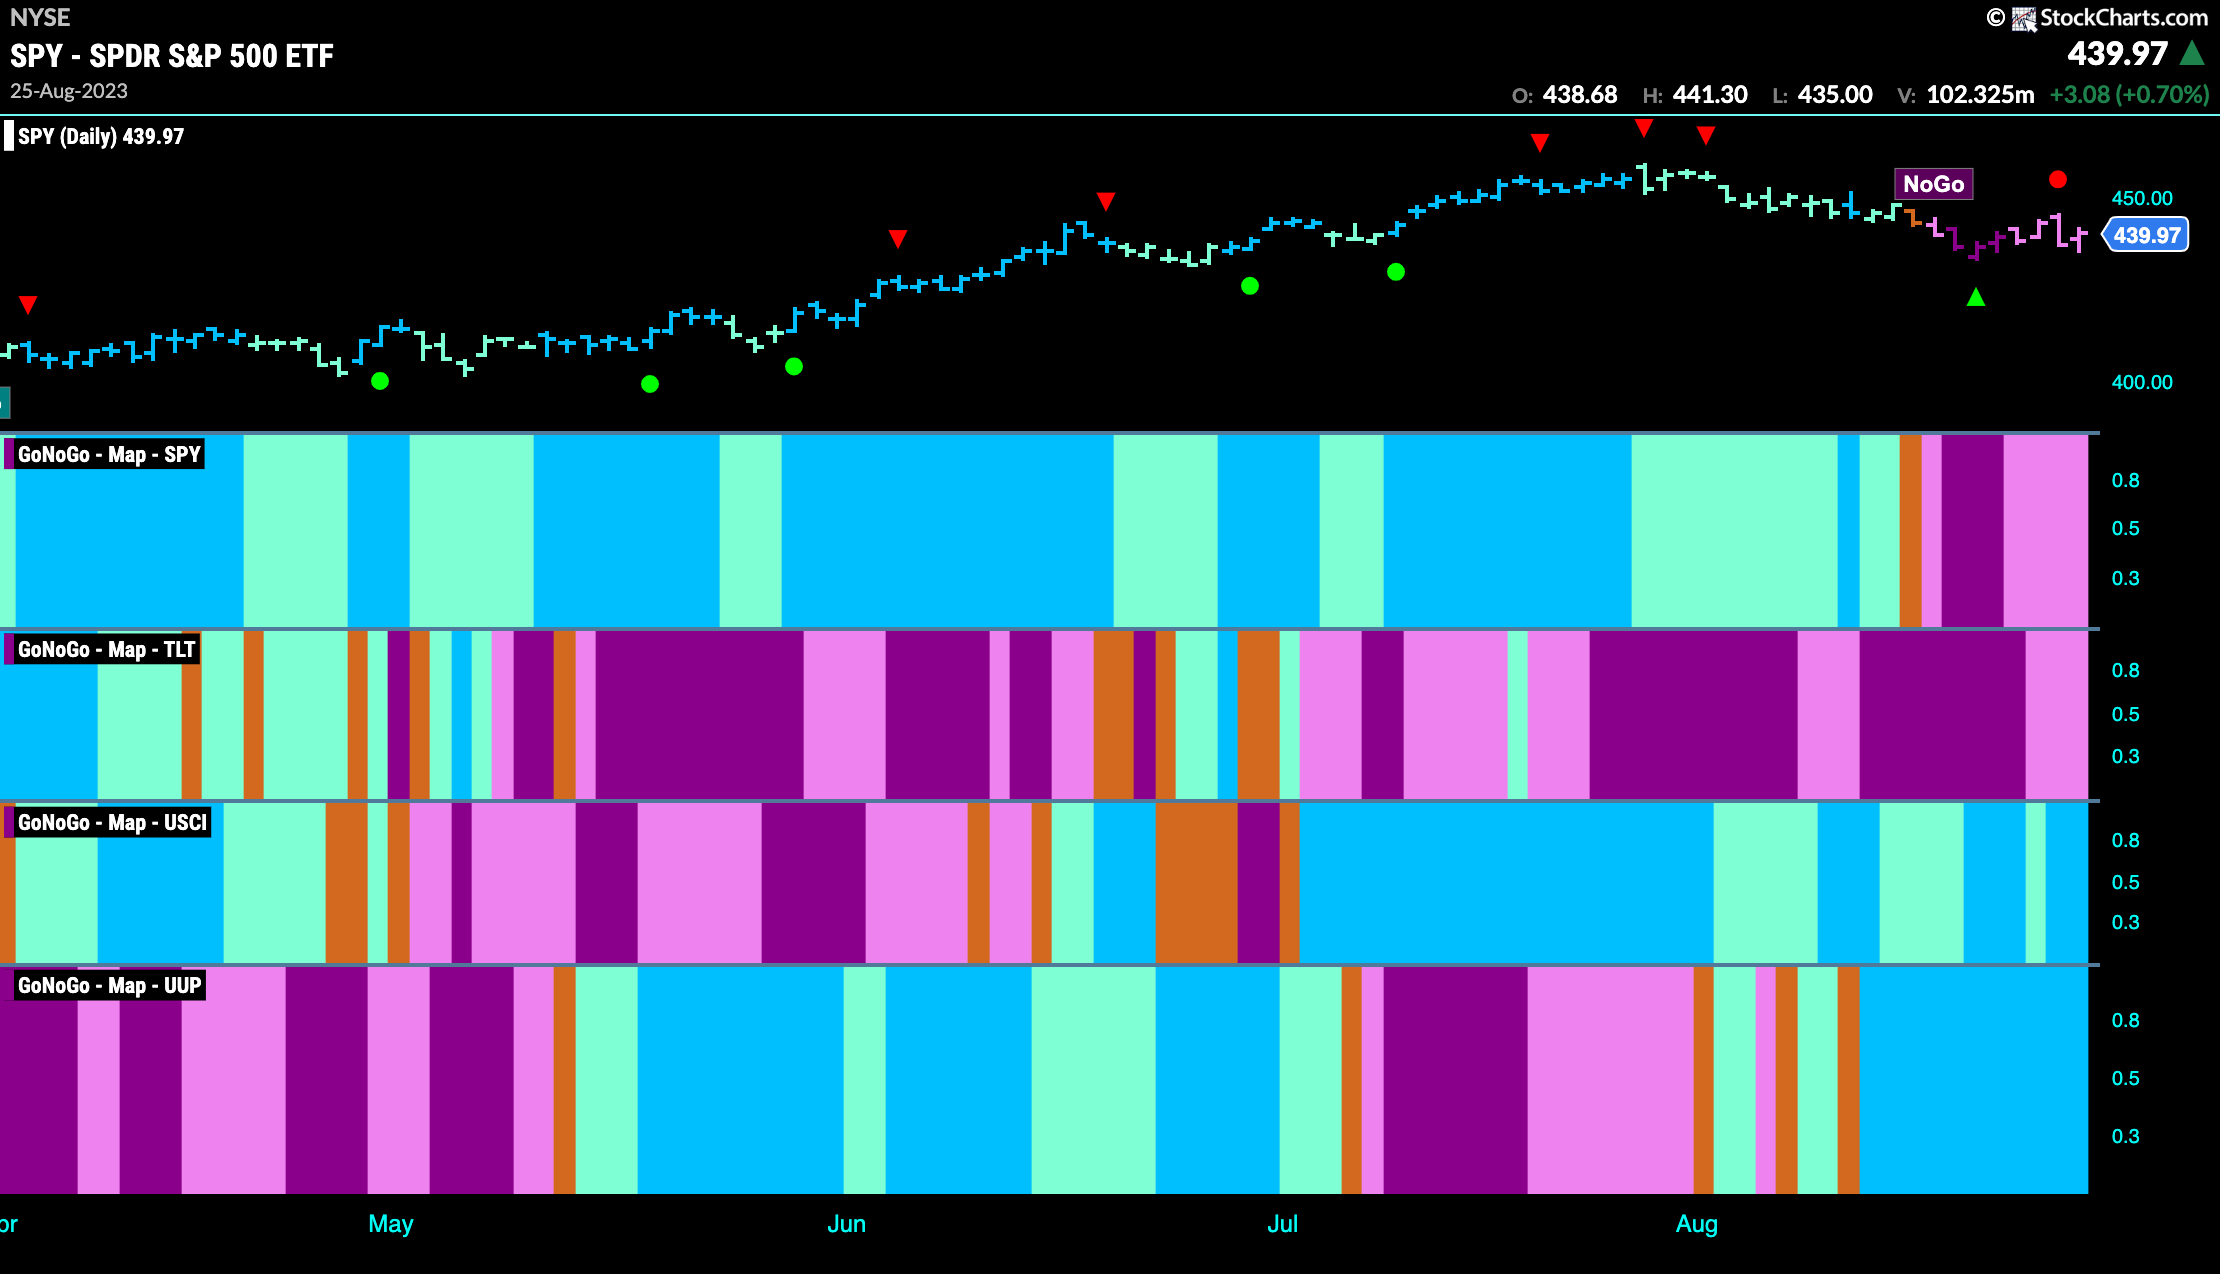
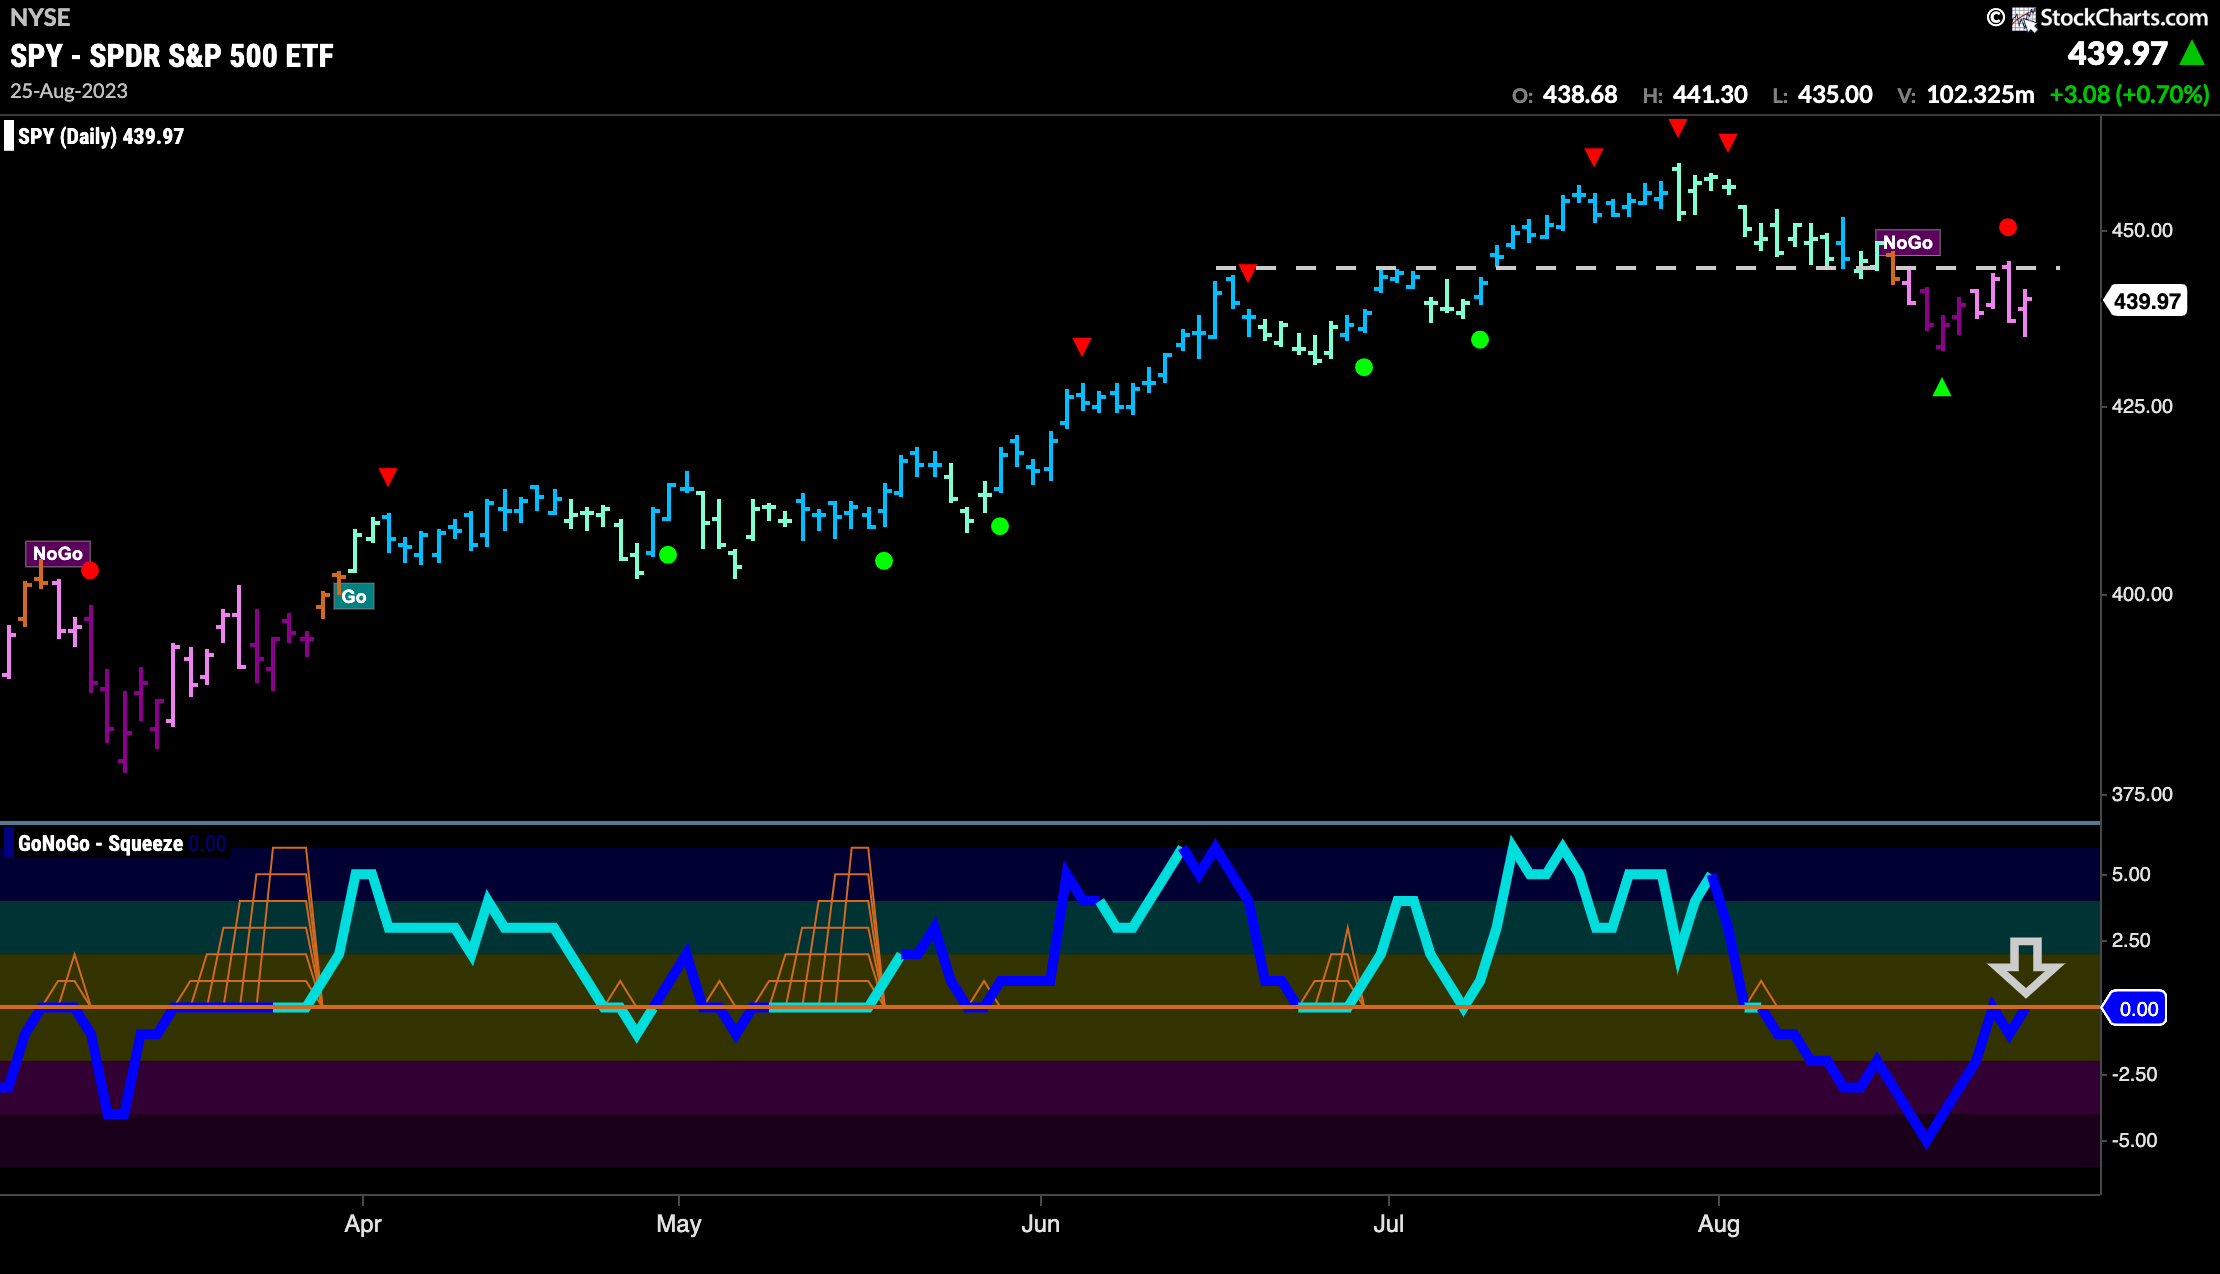
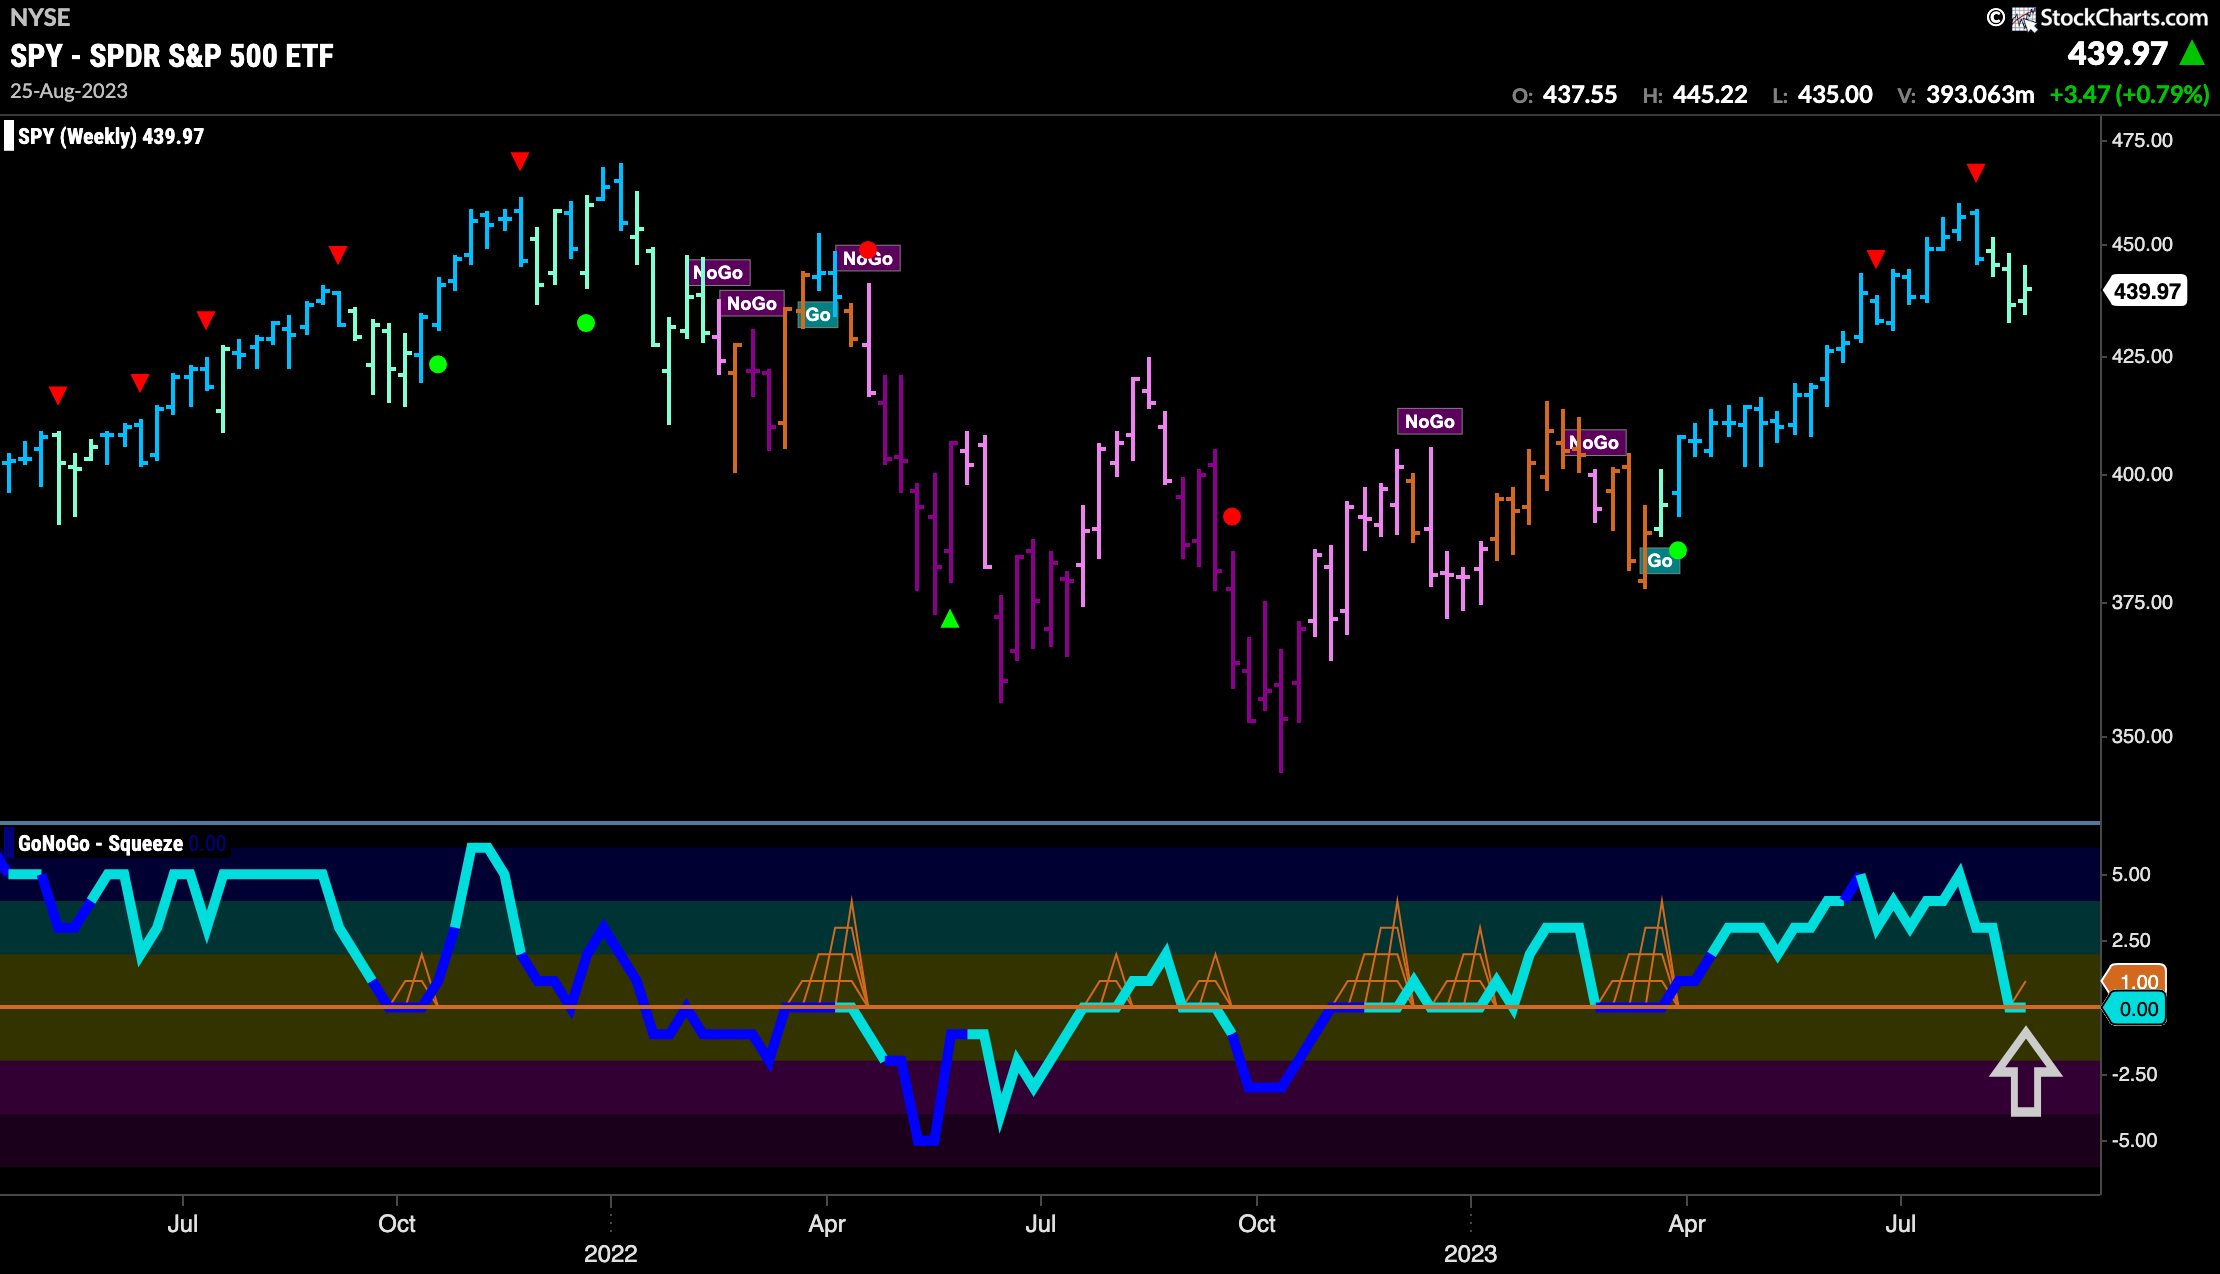
Prices tried to rally this week as we see pink “NoGo” bars. However, overhead resistance seems to have been strong enough to keep prices depressed. GoNoGo Oscillator tested the zero line once this week and was rejected but is now back trying again at that level. Volume is heavy. We will watch to see if the oscillator is rejected again. If so, we will look for prices to fall as the “NoGo” would be likely to continue.
The longer term weekly chart remains in a “Go” trend. As we noted last week however, we are seeing some weakness. GoNoGo Trend has painted a third weaker aqua bar and GoNoGo Oscillator remains at the zero line this week. This tells us that there is no directional momentum to confirm the “Go” trend. We will watch as the oscillator makes up its mind. If it finds support here then we can expect the longer term trend to hold. A break into negative territory would be a concern for the “Go” trend.
Treasury Rates Cool Slightly
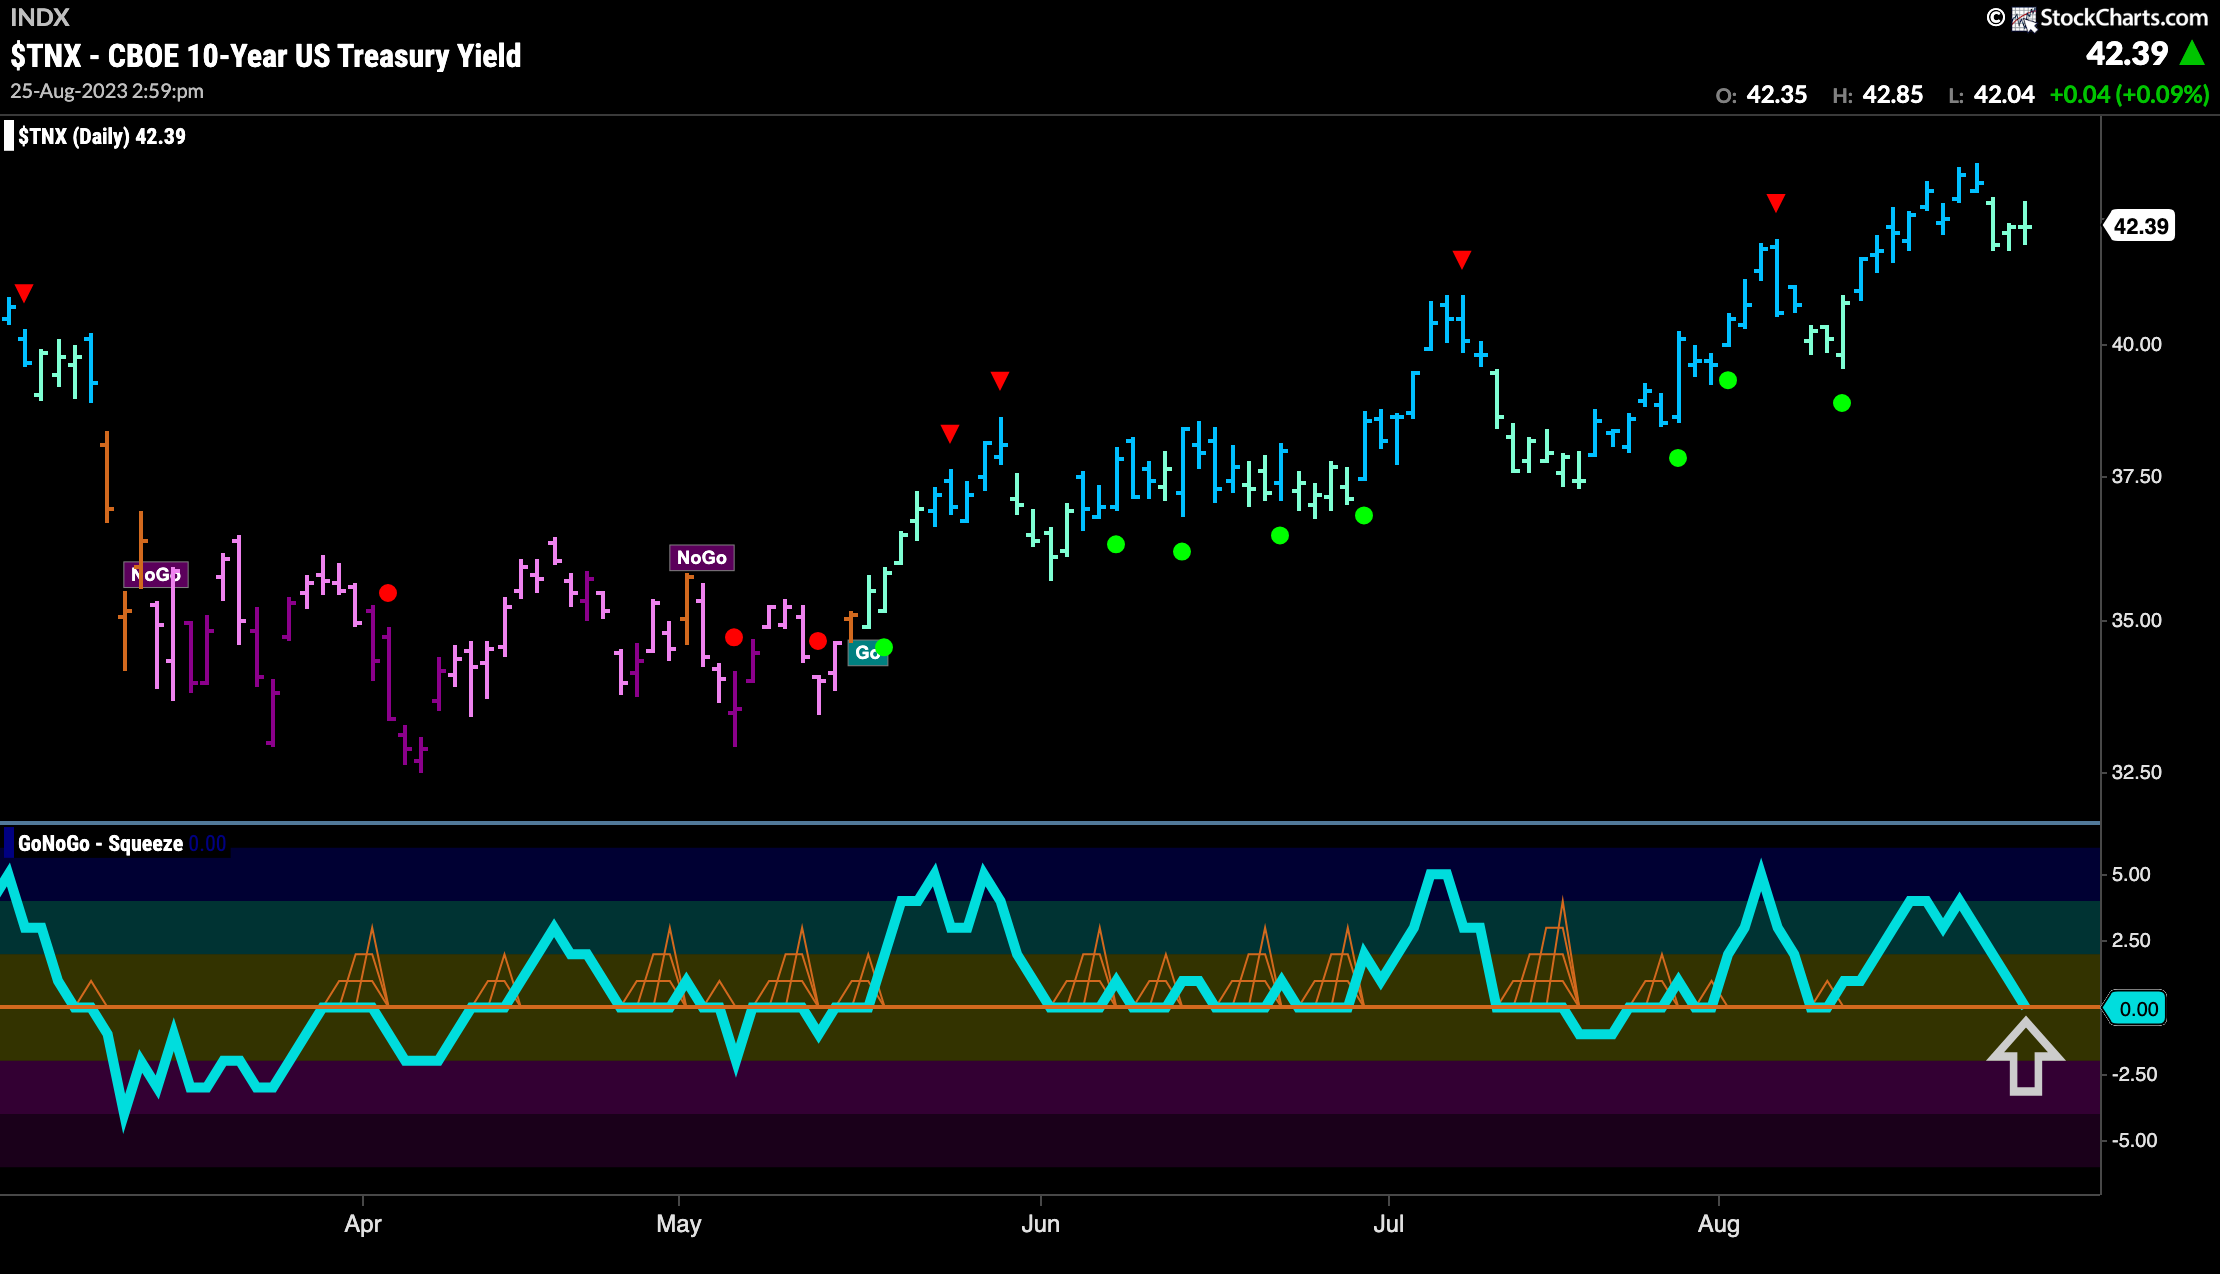
Treasury bond rates fell from a new high as the week ended. GoNoGo Trend painted several weaker aqua bars and GoNoGo Oscillator fell to test the zero line from above. We will watch to see if the oscillator finds support here and if it does we can expect price to make an attack on those highs.
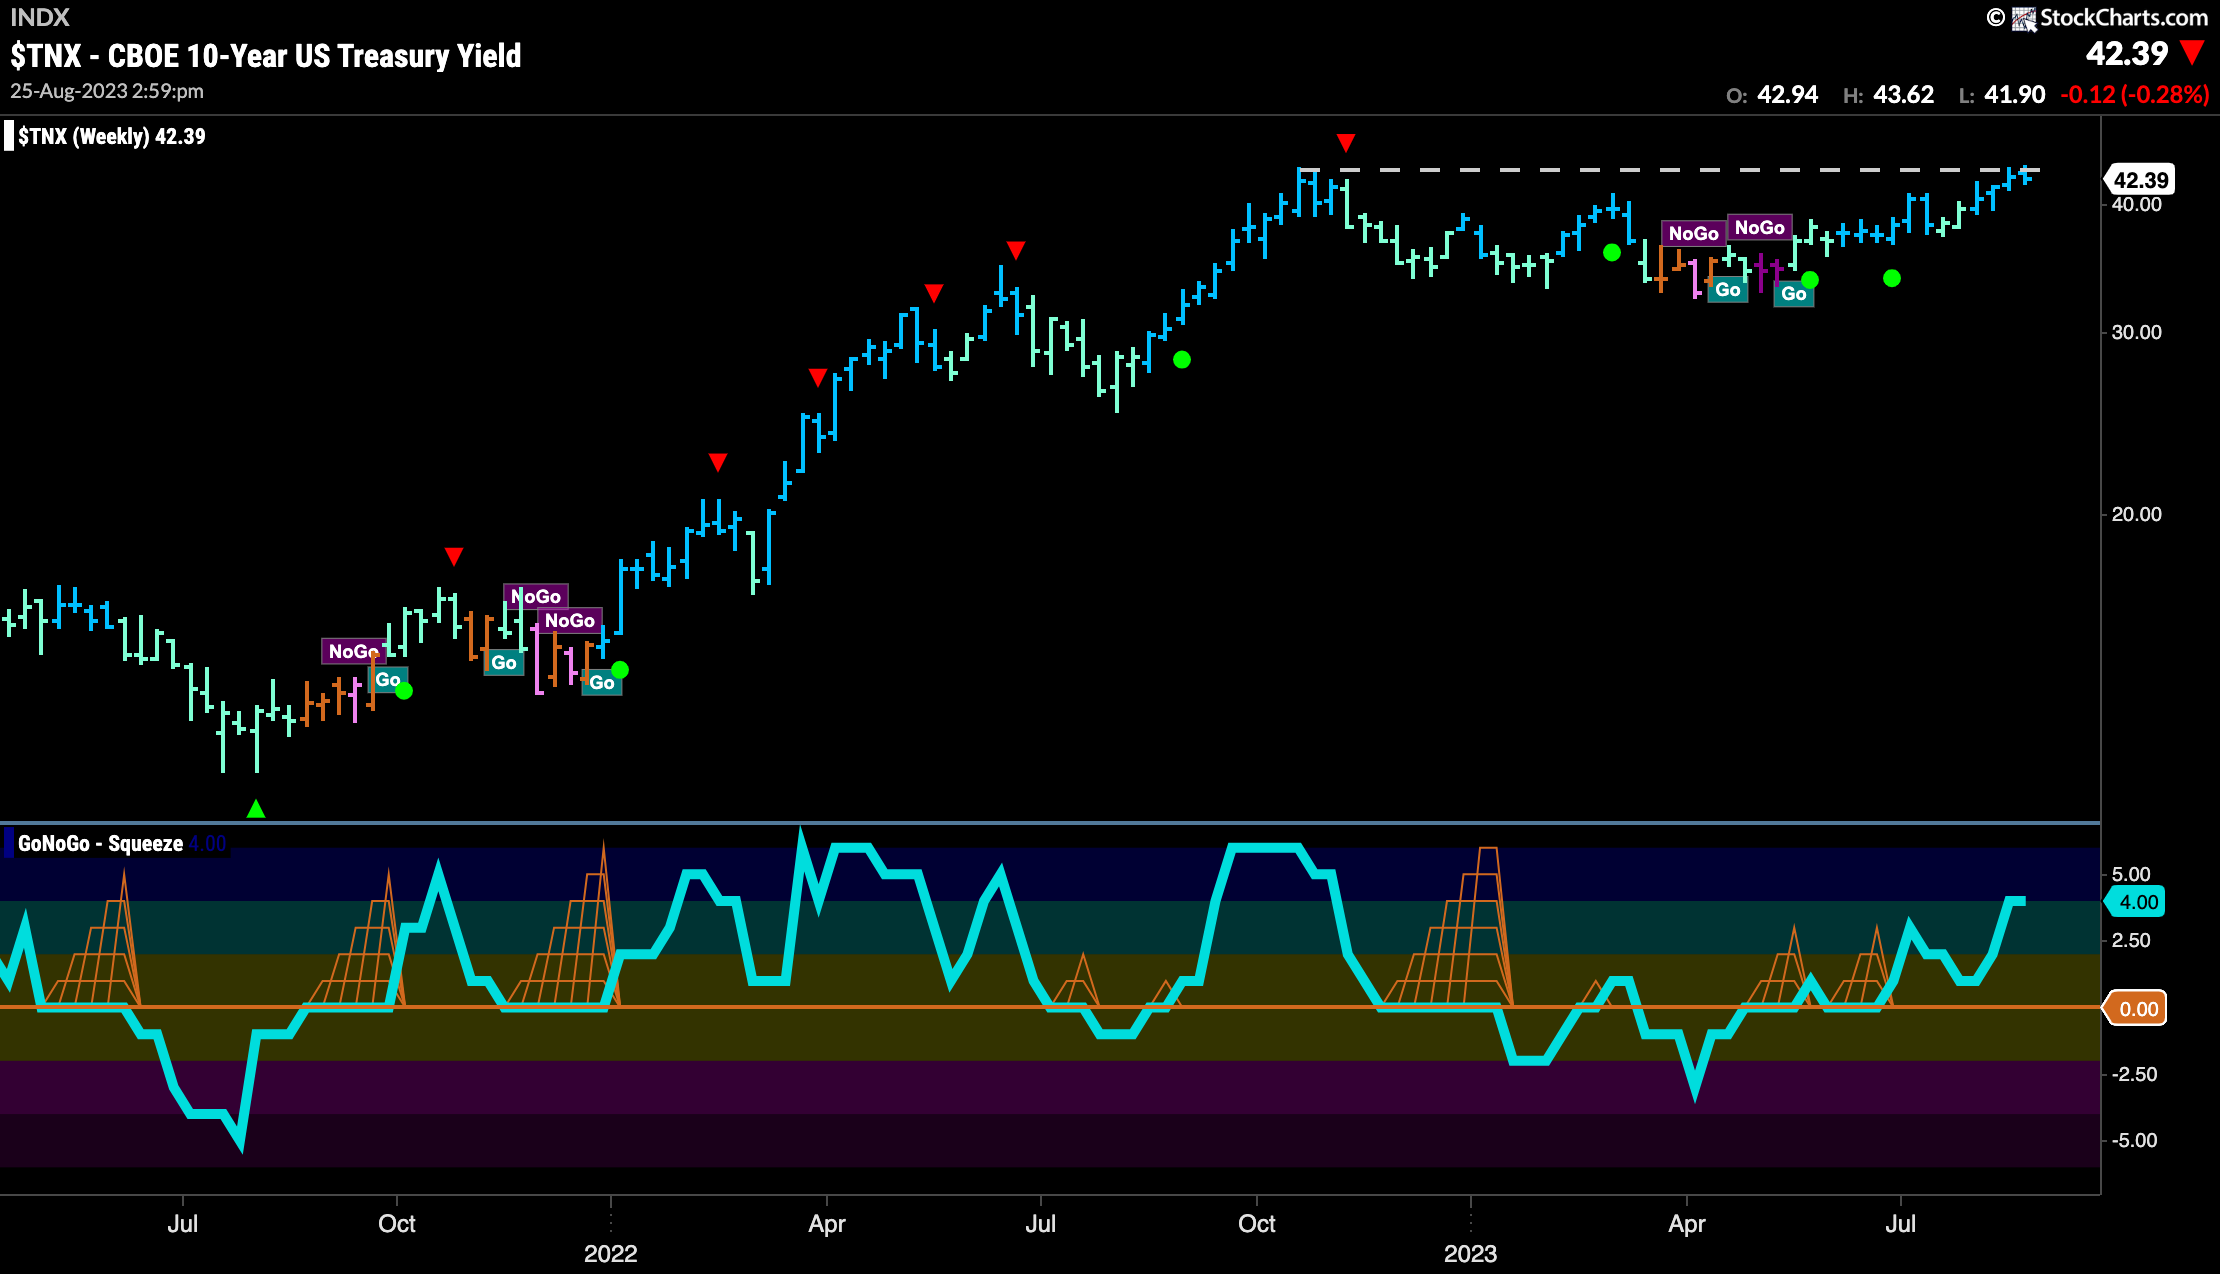
The weekly chart shows price is in a strong “Go” trend but that it is still struggling to get above horizontal resistance. We will need price to set a new high to be convinced that we are back to a rising rate environment. This could then put further pressure on equity prices.
Dollar Breaks Higher
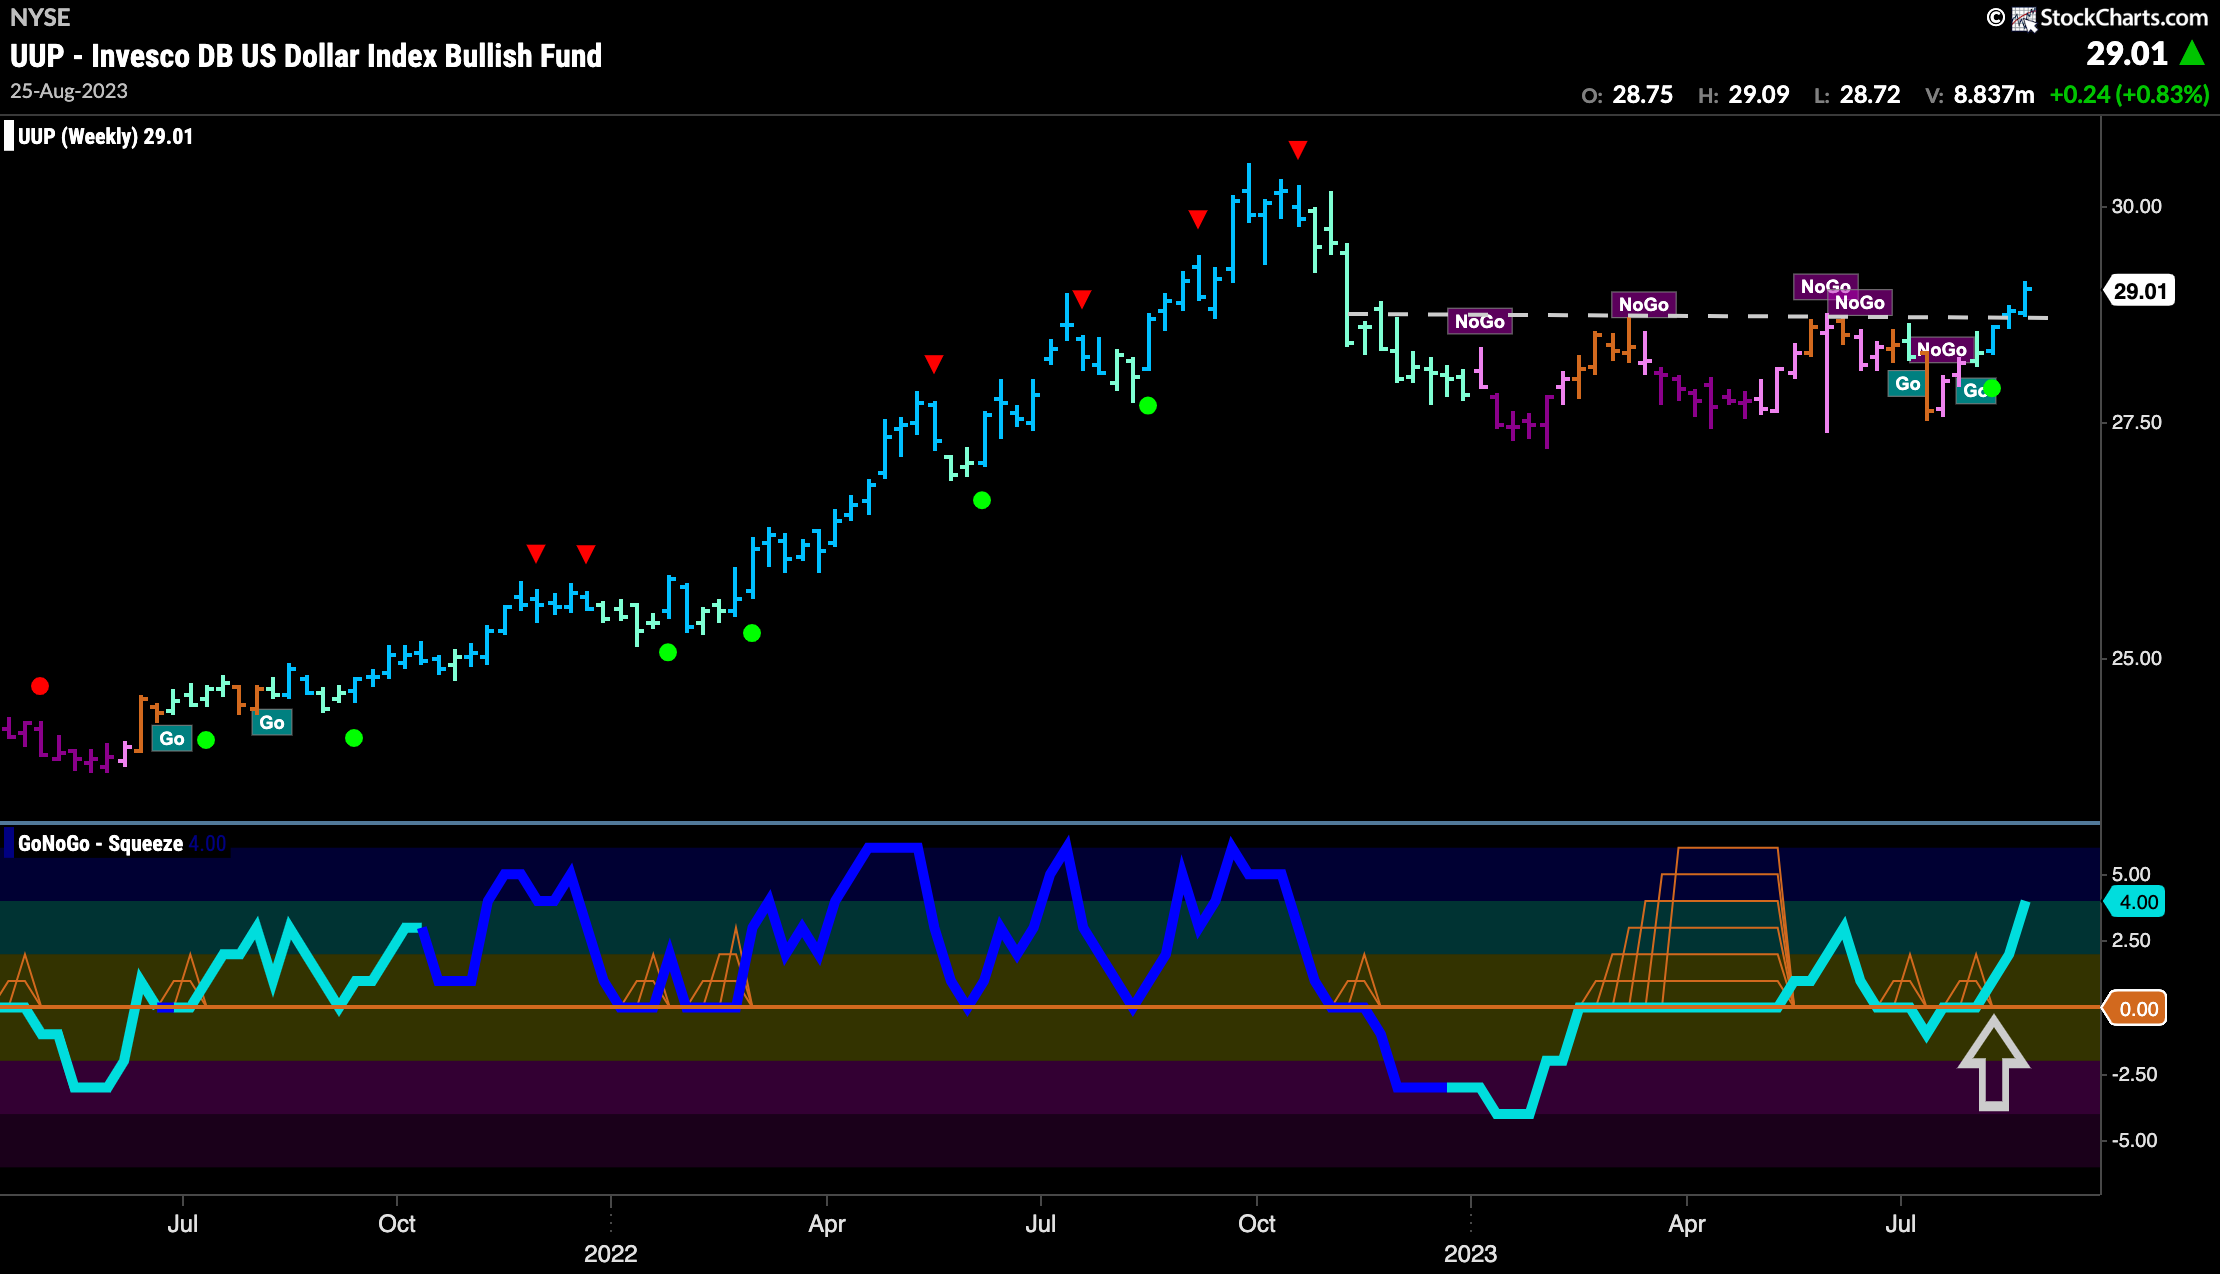
Looking at the weekly chart of the dollar below, we can see that price had a strong week. GoNoGo Trend painted another strong blue “Go” bar as it climbed above horizontal resistance. This is the third strong “Go” bar in a row and we can see GoNoGo Oscillator has broken significantly into positive territory and is moving quickly higher.
Oil Remains in “Go” Trend
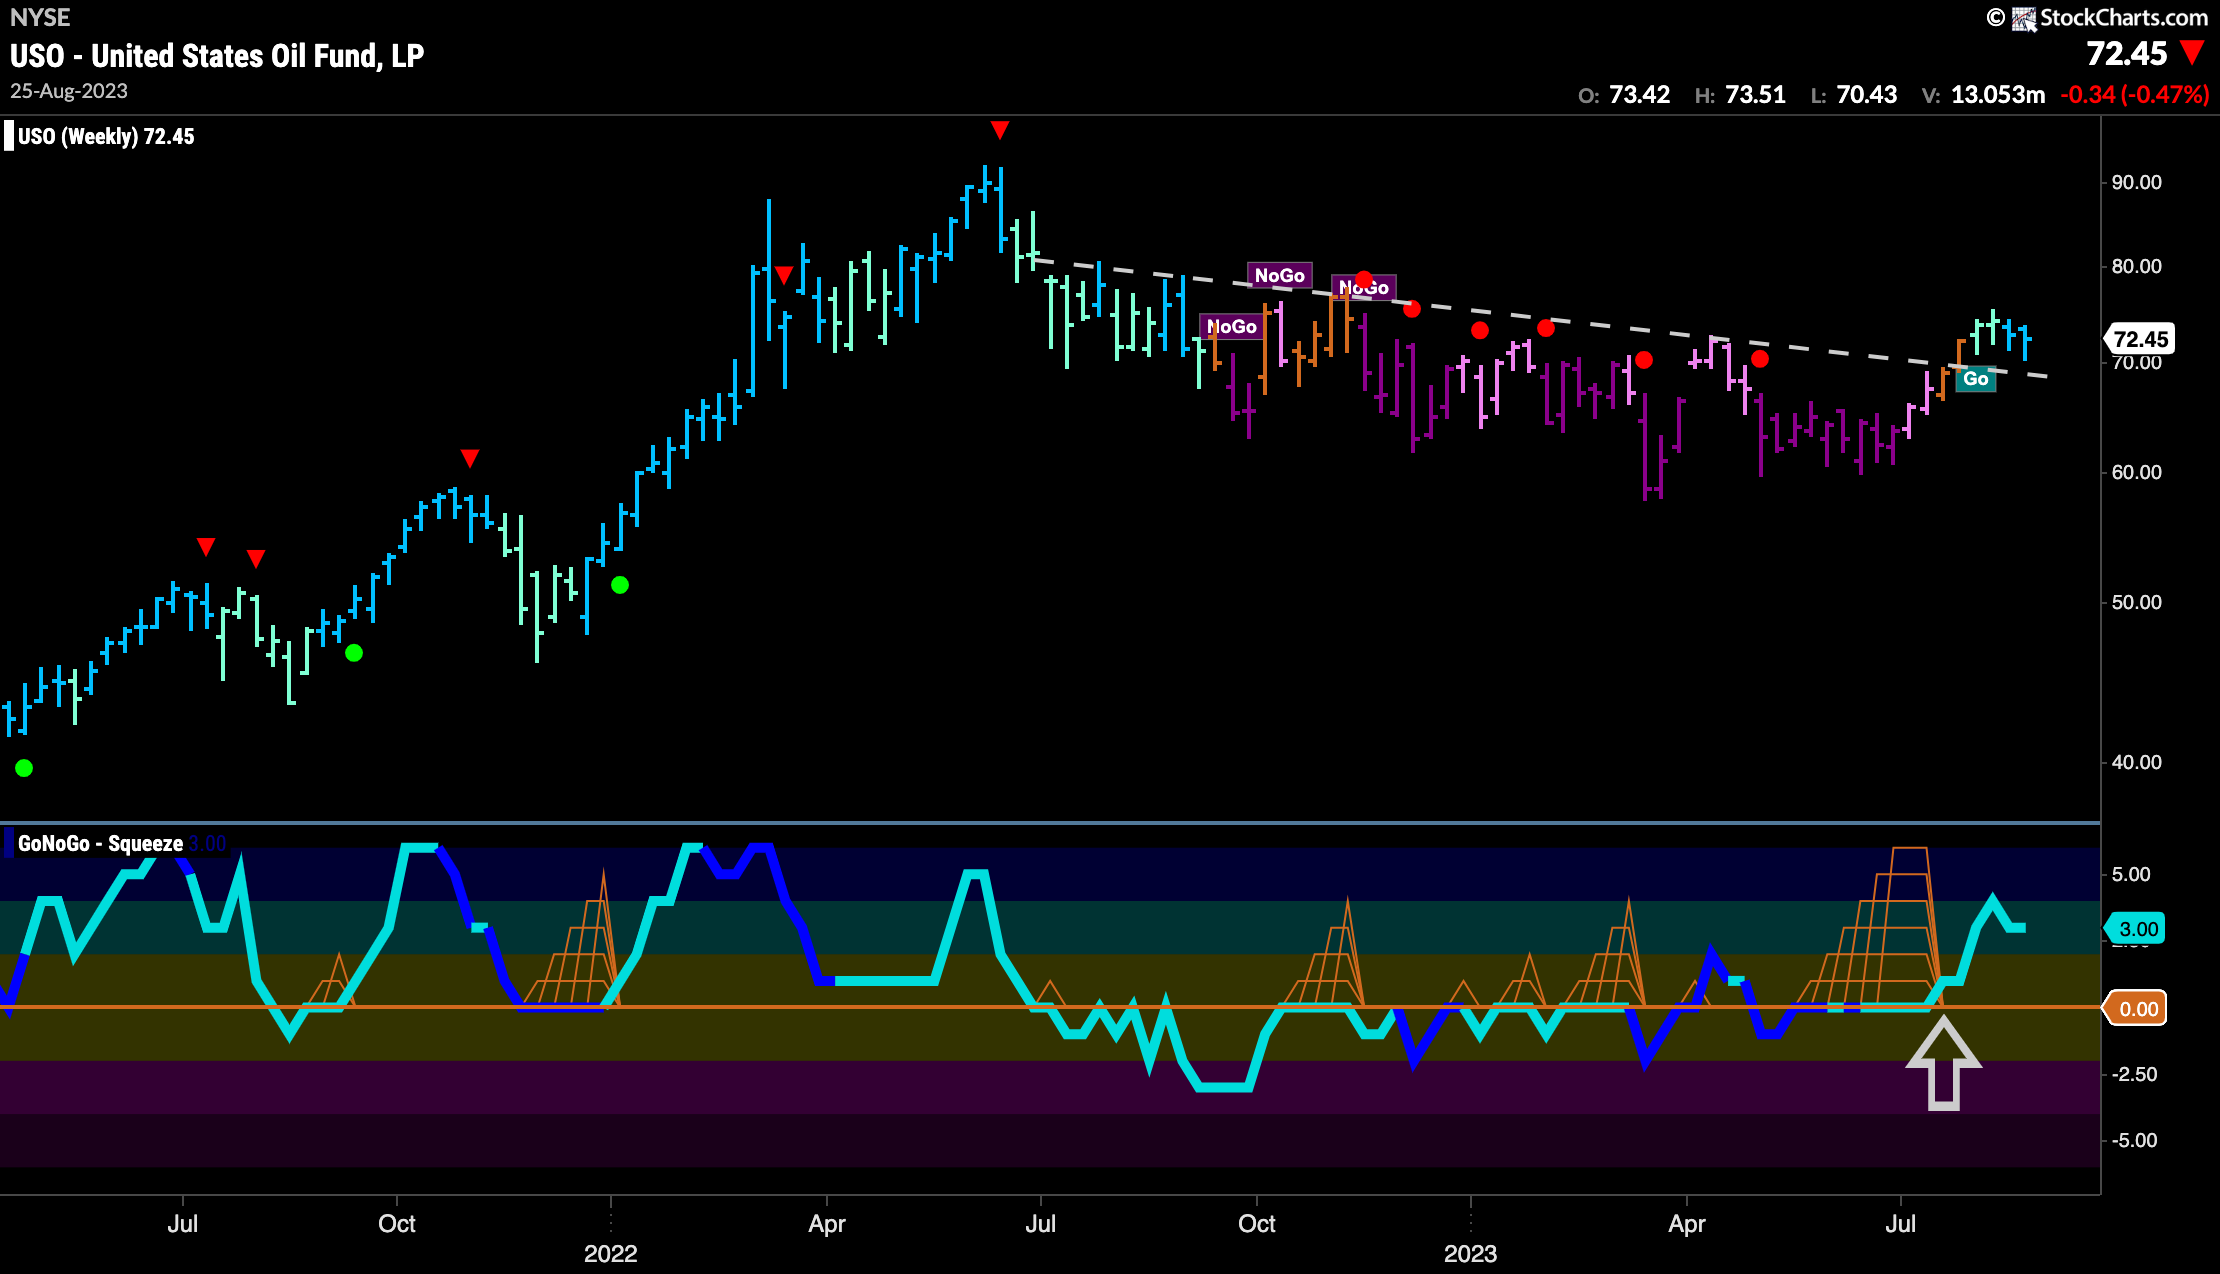
Oil prices continue to show strength this week. A second strong blue “Go” bar even as price edges lower. Price creeps toward the downward sloping trend line that it fought so hard to climb above. We expect this to now provide some support as the concept of polarity tells us that what was once resistance will become support. GoNoGo Oscillator is in positive territory but not yet overbought.
Gold “NoGo” Intact
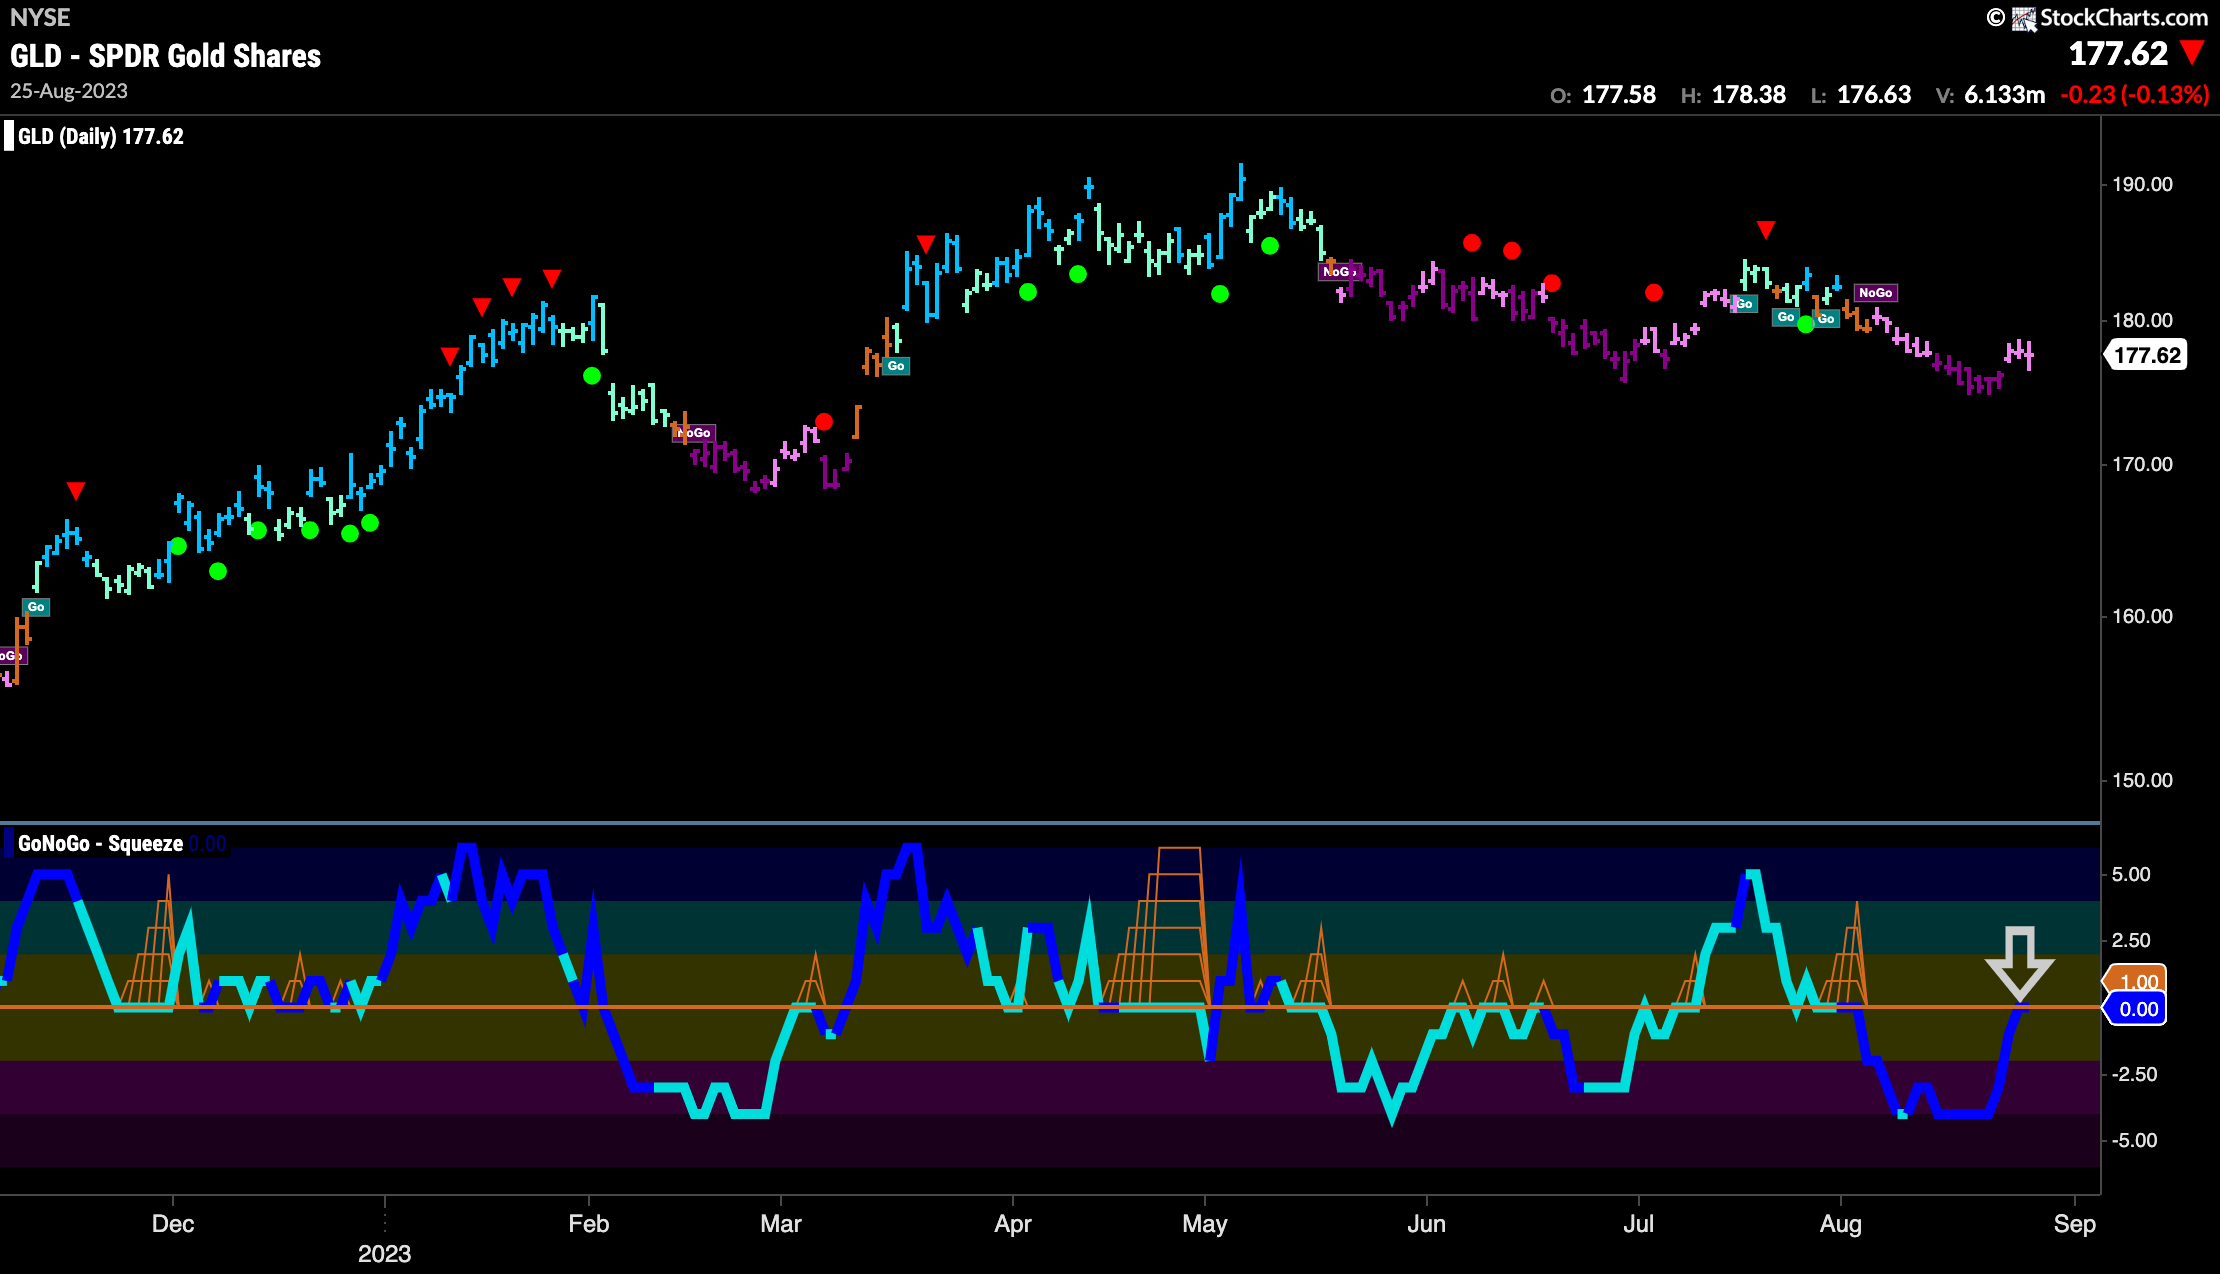
GoNoGo Trend shows the “NoGo” trend remains in place as GoNoGo Trend paints weaker pink bars. We see GoNoGo Oscillator rising on heavy volume to test the zero line from below where we will watch to see if it finds resistance. If it gets turned away back into negative territory we will expect the “NoGo” to continue and for price to make an attempt at a new low.
Sector RelMap
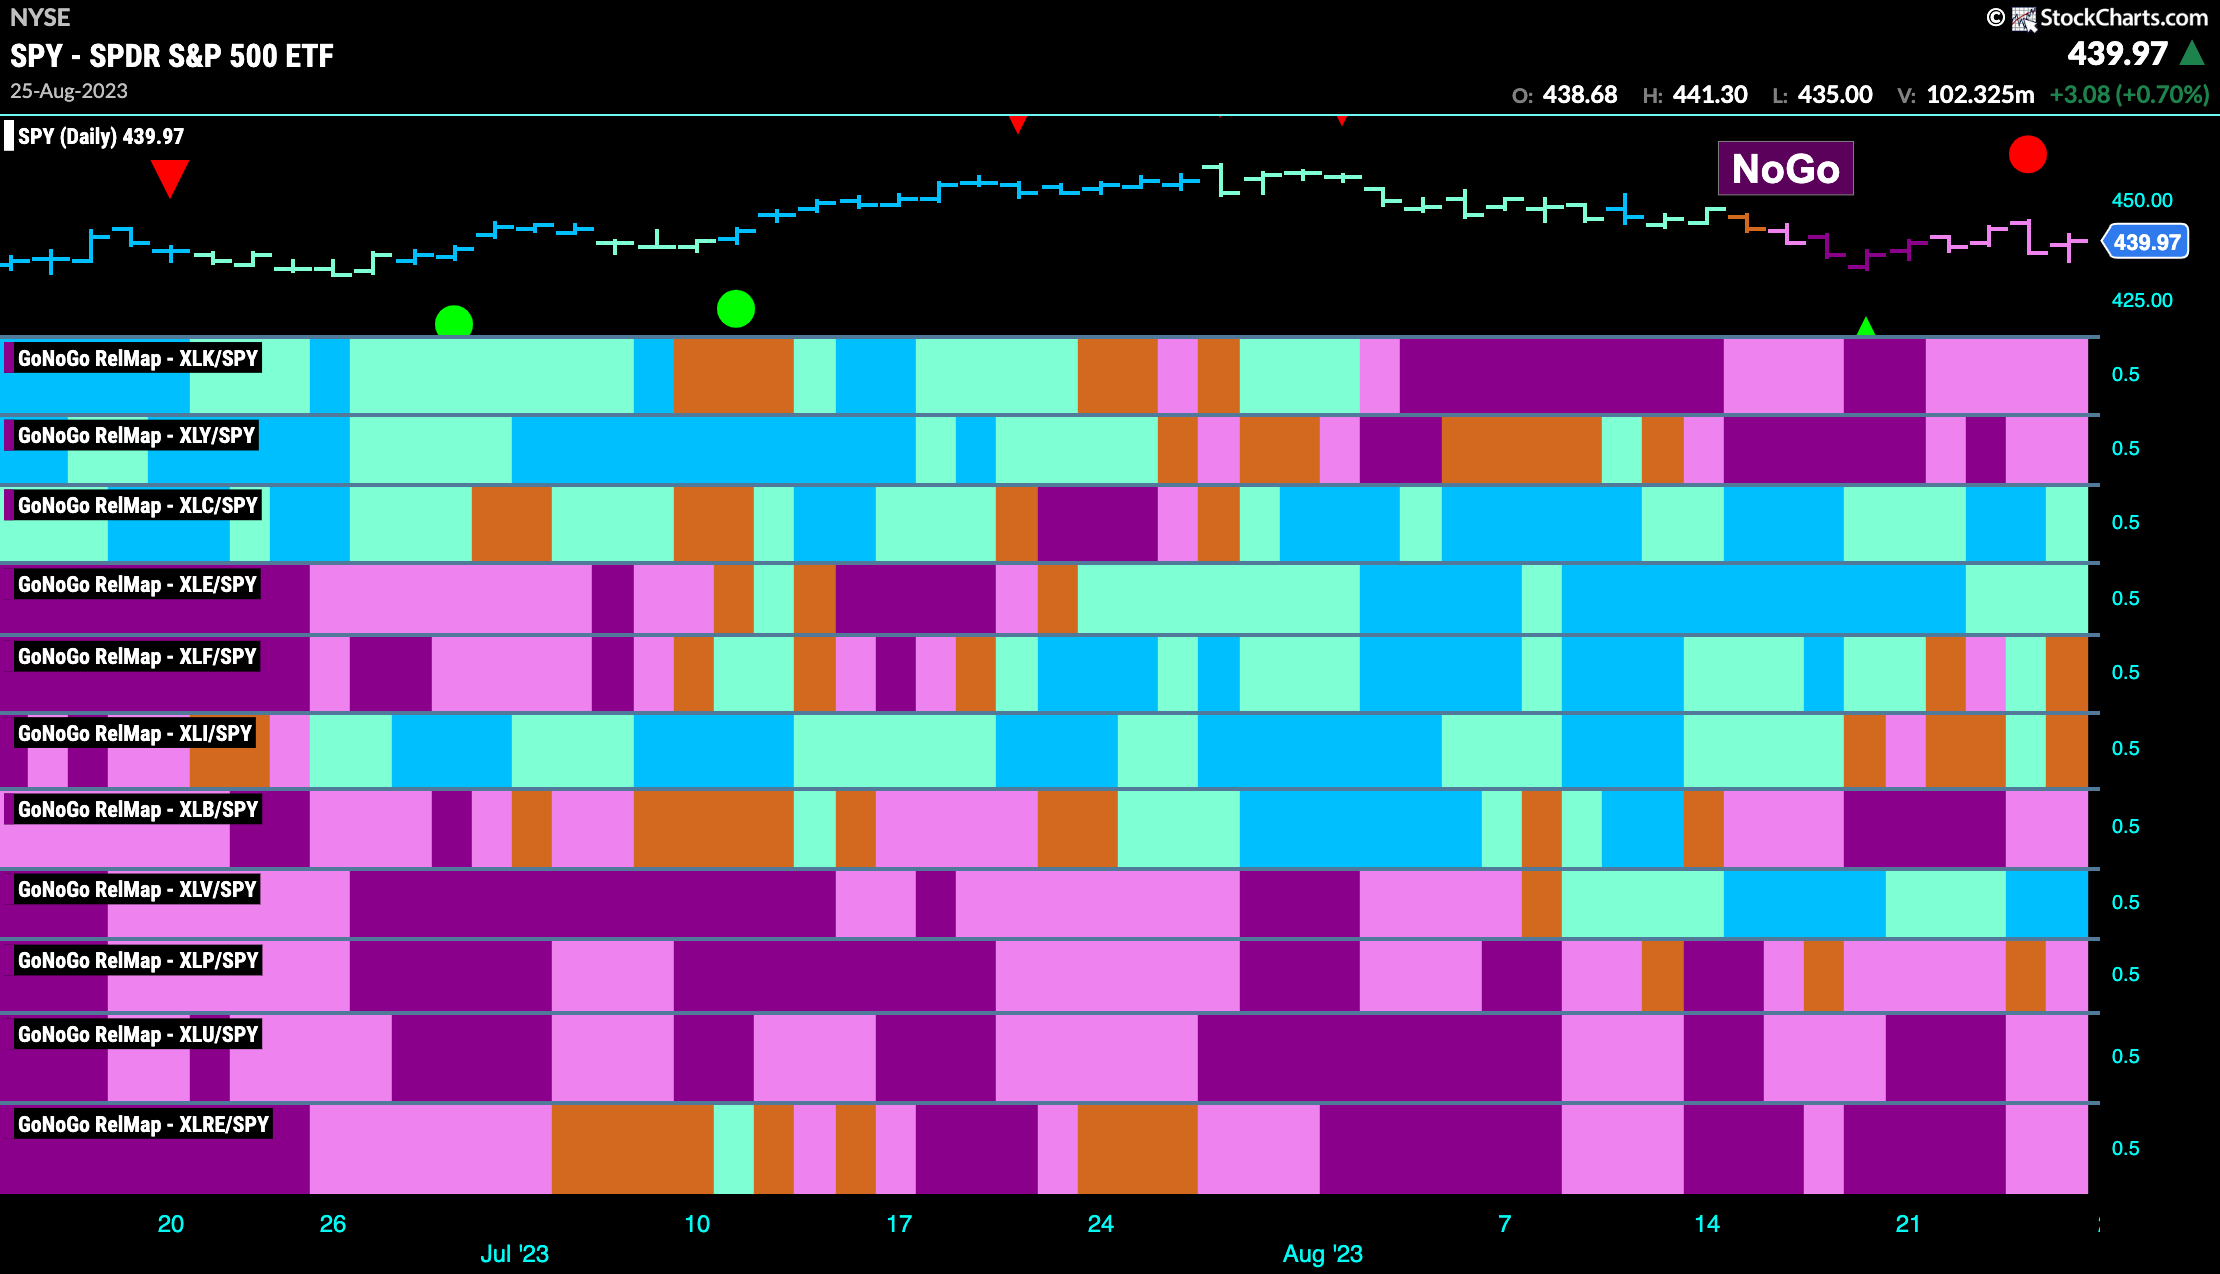
Below is the GoNoGo Sector RelMap. This GoNoGo RelMap applies the GoNoGo Trend to the relative strength ratios of the sectors to the base index. Looking at this map, we can quickly see where the relative outperformance is coming from as well as which sectors are lagging on a relative basis. 5 sectors are outperforming the base index this week. $XLC, $XLE, and $XLV are painting “Go” bars.
Energy Sub Group Map
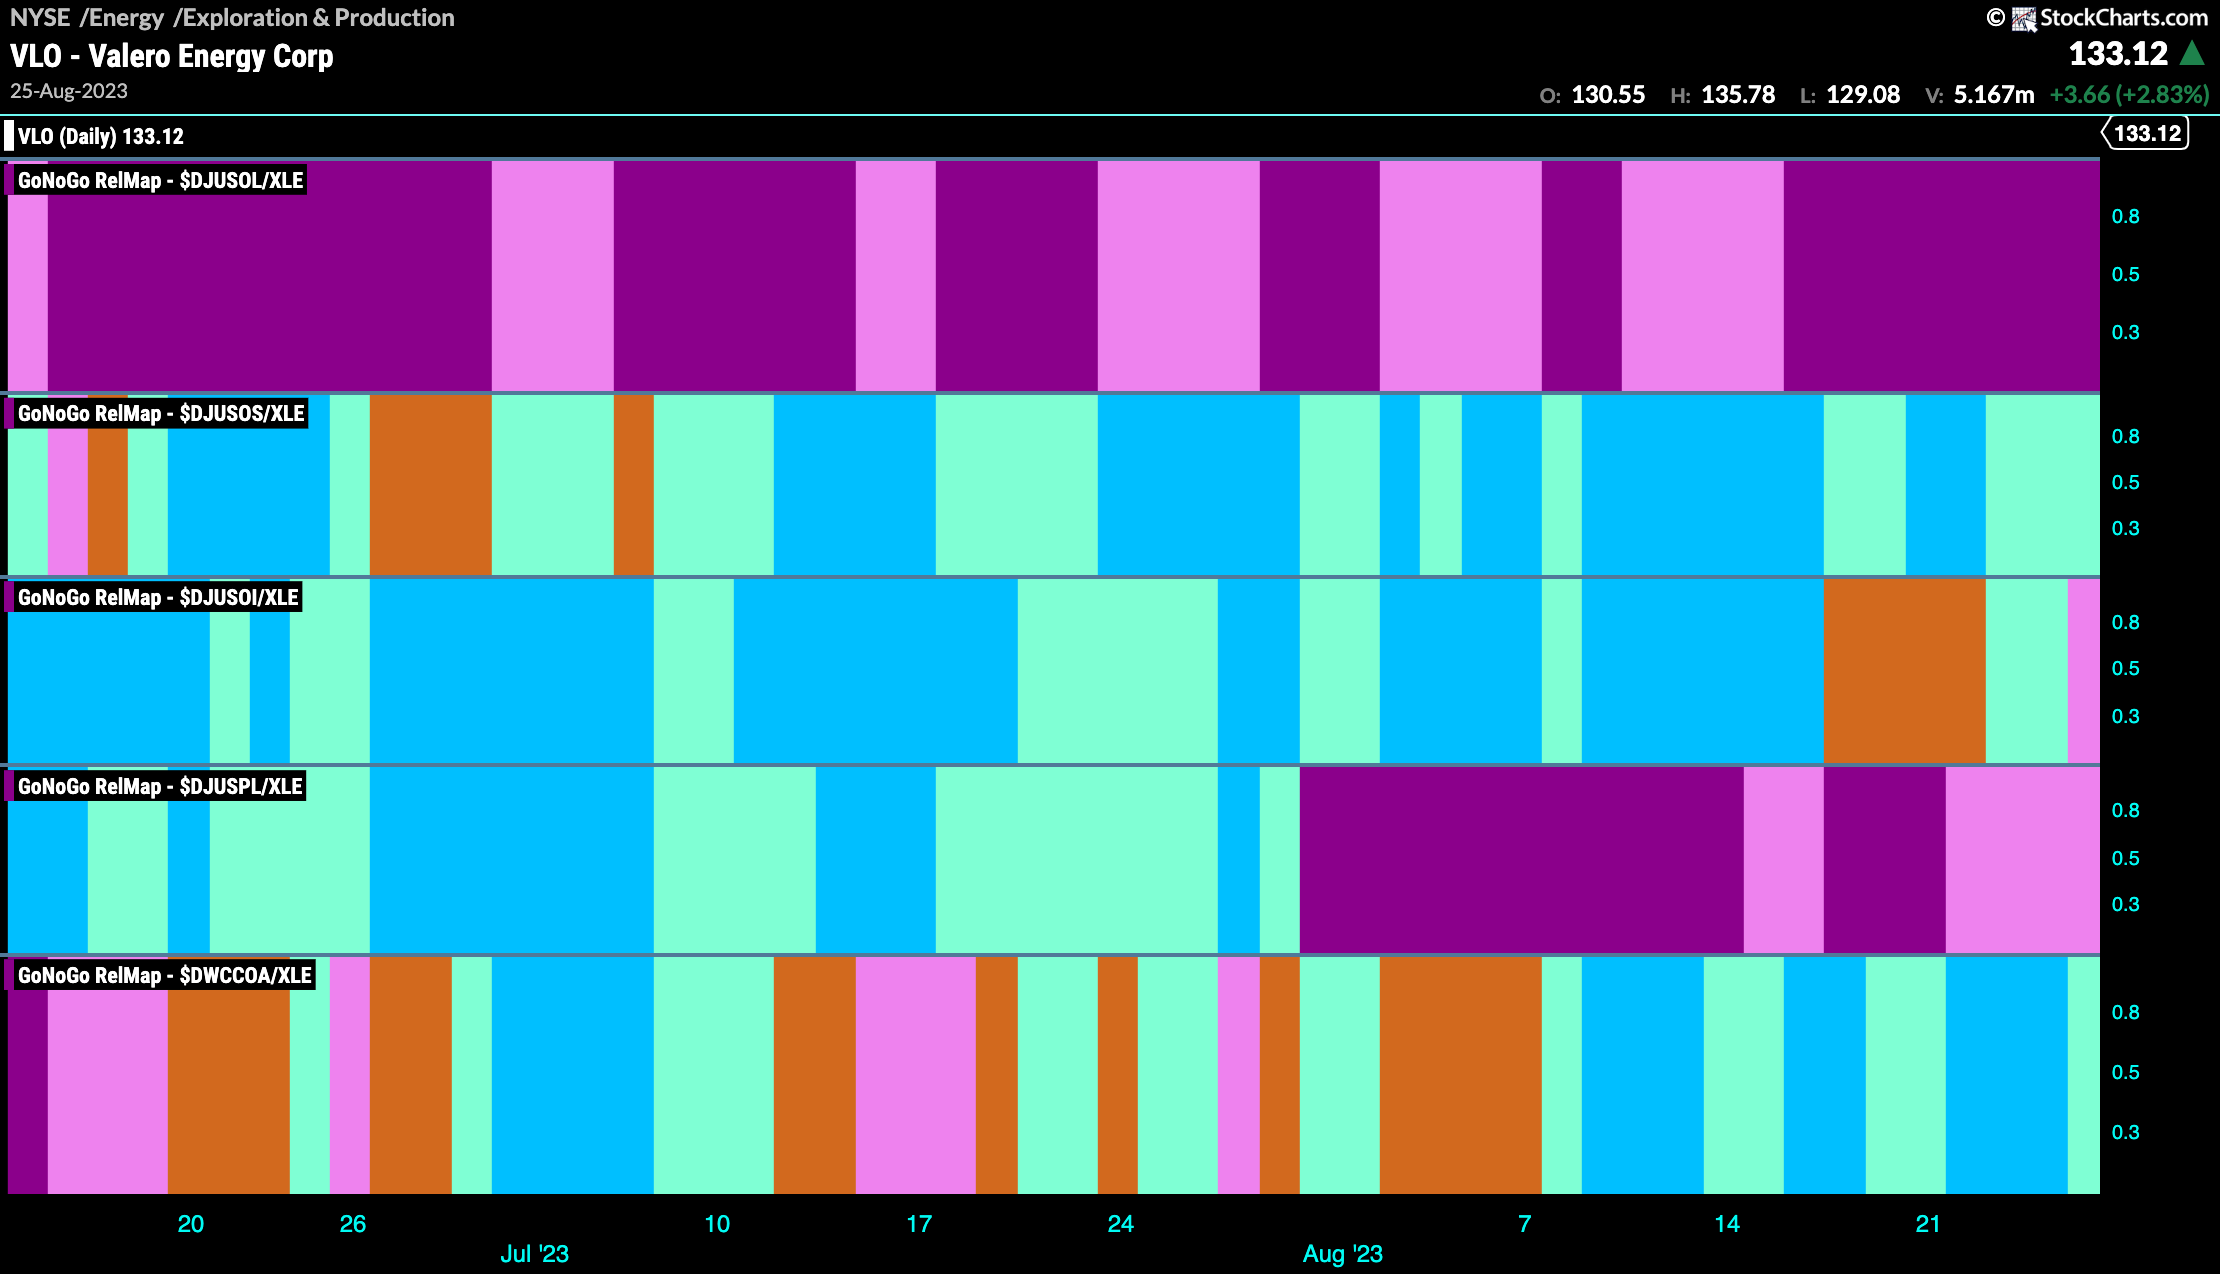
The Sector RelMap above showed that the energy sector continues to outperform the larger index on a relative basis. If we look at the sub industry group map below, we can see that it is exploration and production, the second panel that has been the consistent out-performer in this space.
Valero Looks for Support
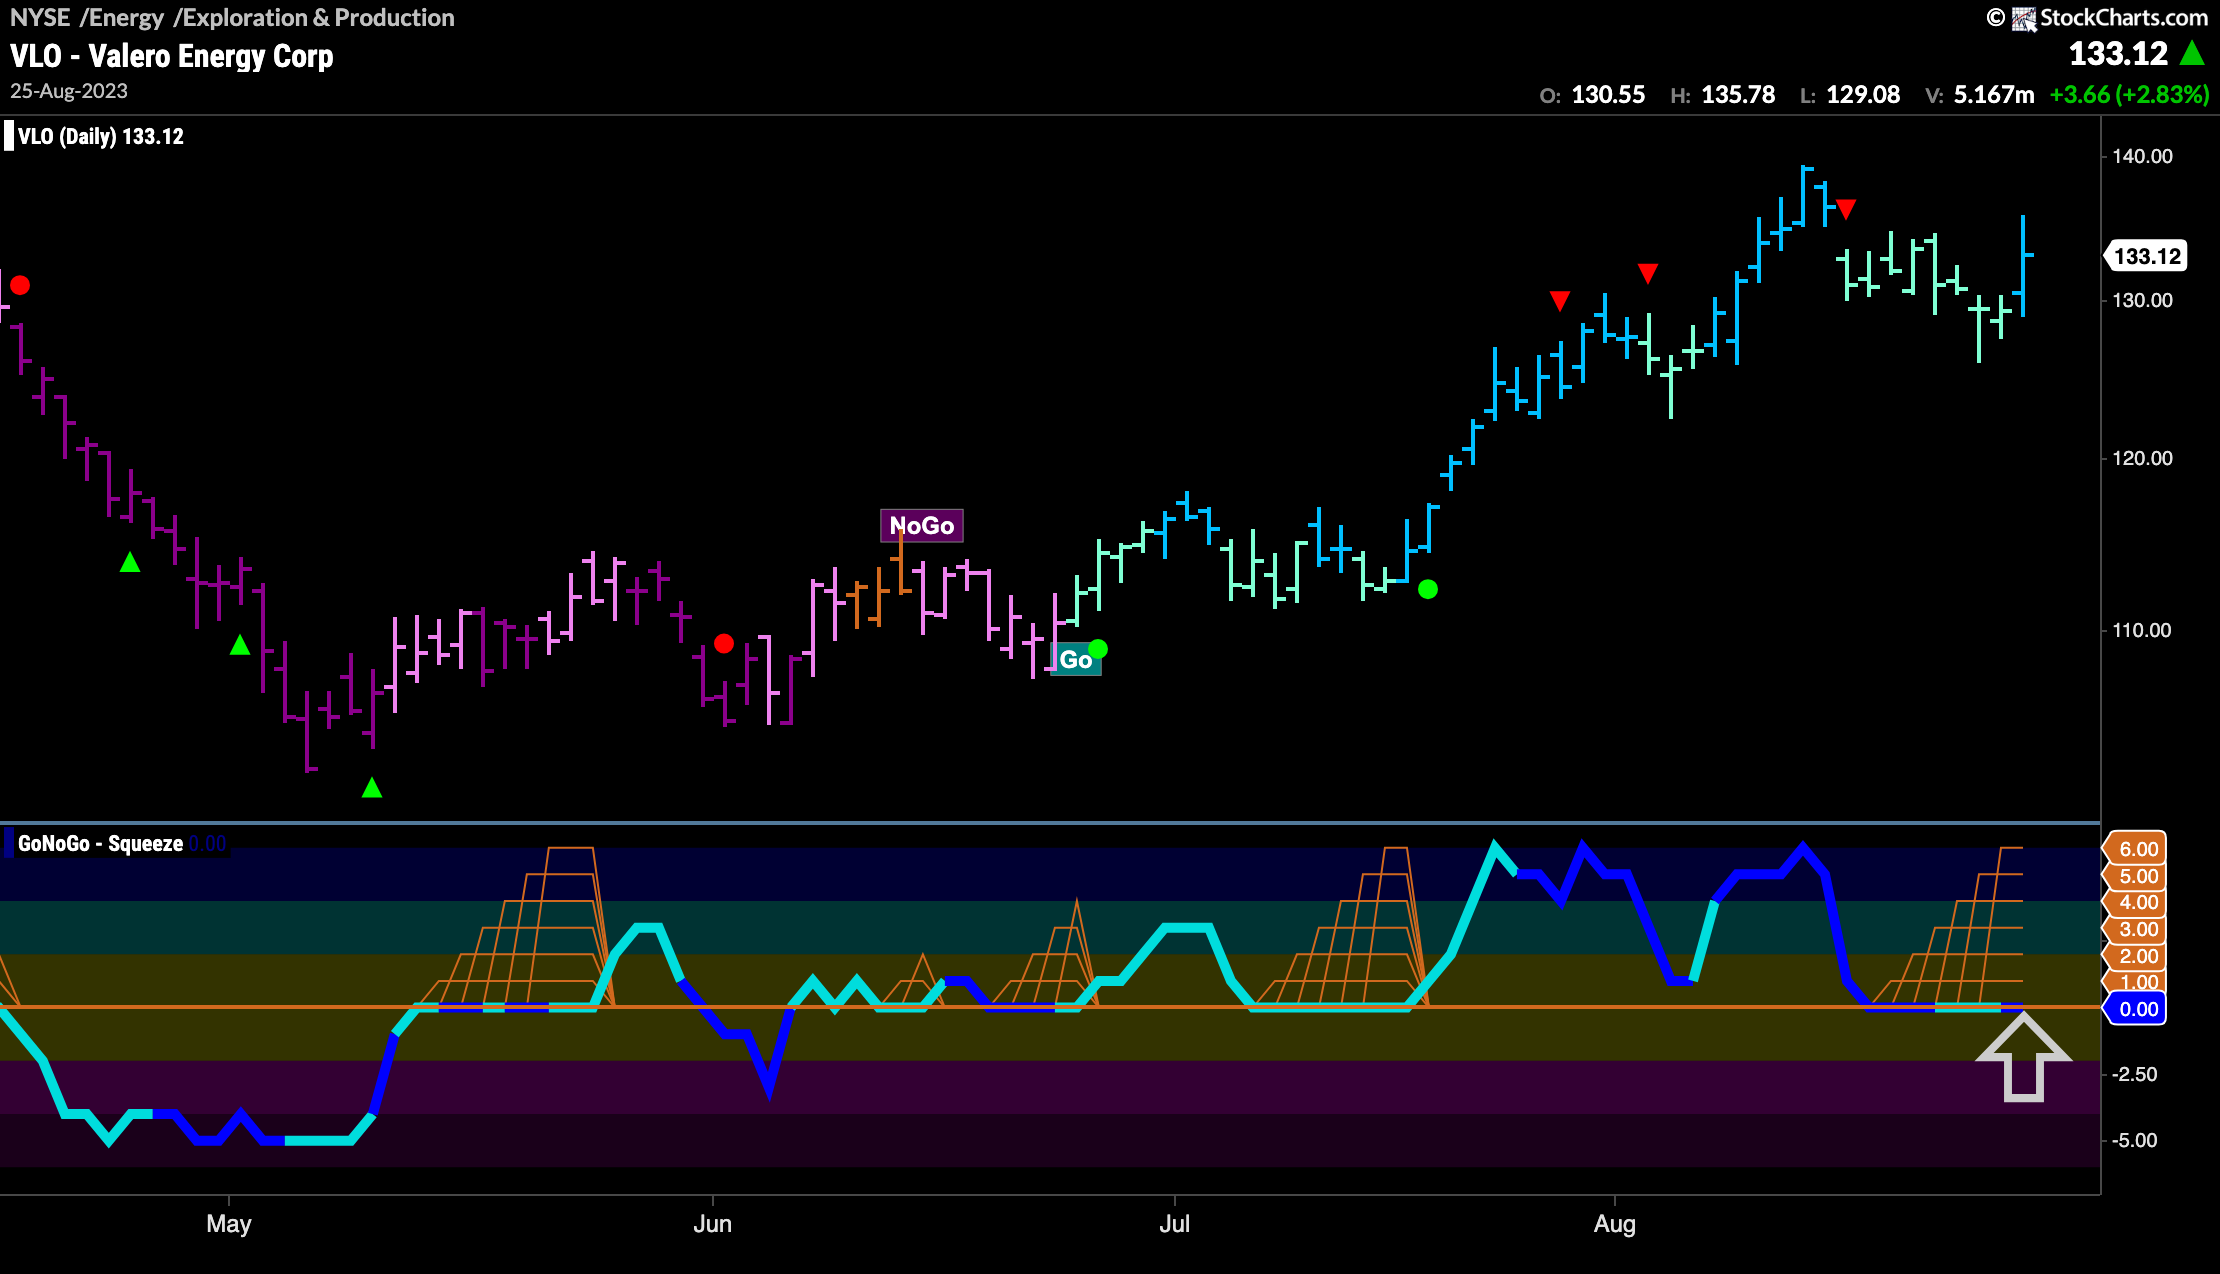
In the above GoNoGo RelMap of the energy sector industry groups we saw that it was exploration and production that was contributing consistently to the outperformance of the sector versus the larger index. We can take a look at a security such as Valero Energy Corp to see if it represents an opportunity to participate in that out-performance. As you can see on the daily chart below, $VLO has been in a “Go” trend since early July. More recently, after hitting another higher high, we saw a Go Countertrend Correction Icon (red arrow) that indicated that in the short term prices may struggle to go higher. Indeed, GoNoGo Trend painted a succession of weaker aqua bars and GoNoGo Oscillator crashed to the zero line. The Oscillator has been riding the zero line since, causing the climbing grid of GoNoGo Squeeze to climb to its max. Representing a tug of war between buyers and sellers, it will be important to see in which direction the Squeeze is broken. With GoNoGo Trend painting a strong blue bar, if the Squeeze is broken to the upside, we can expect price to make an attempt at another higher high.
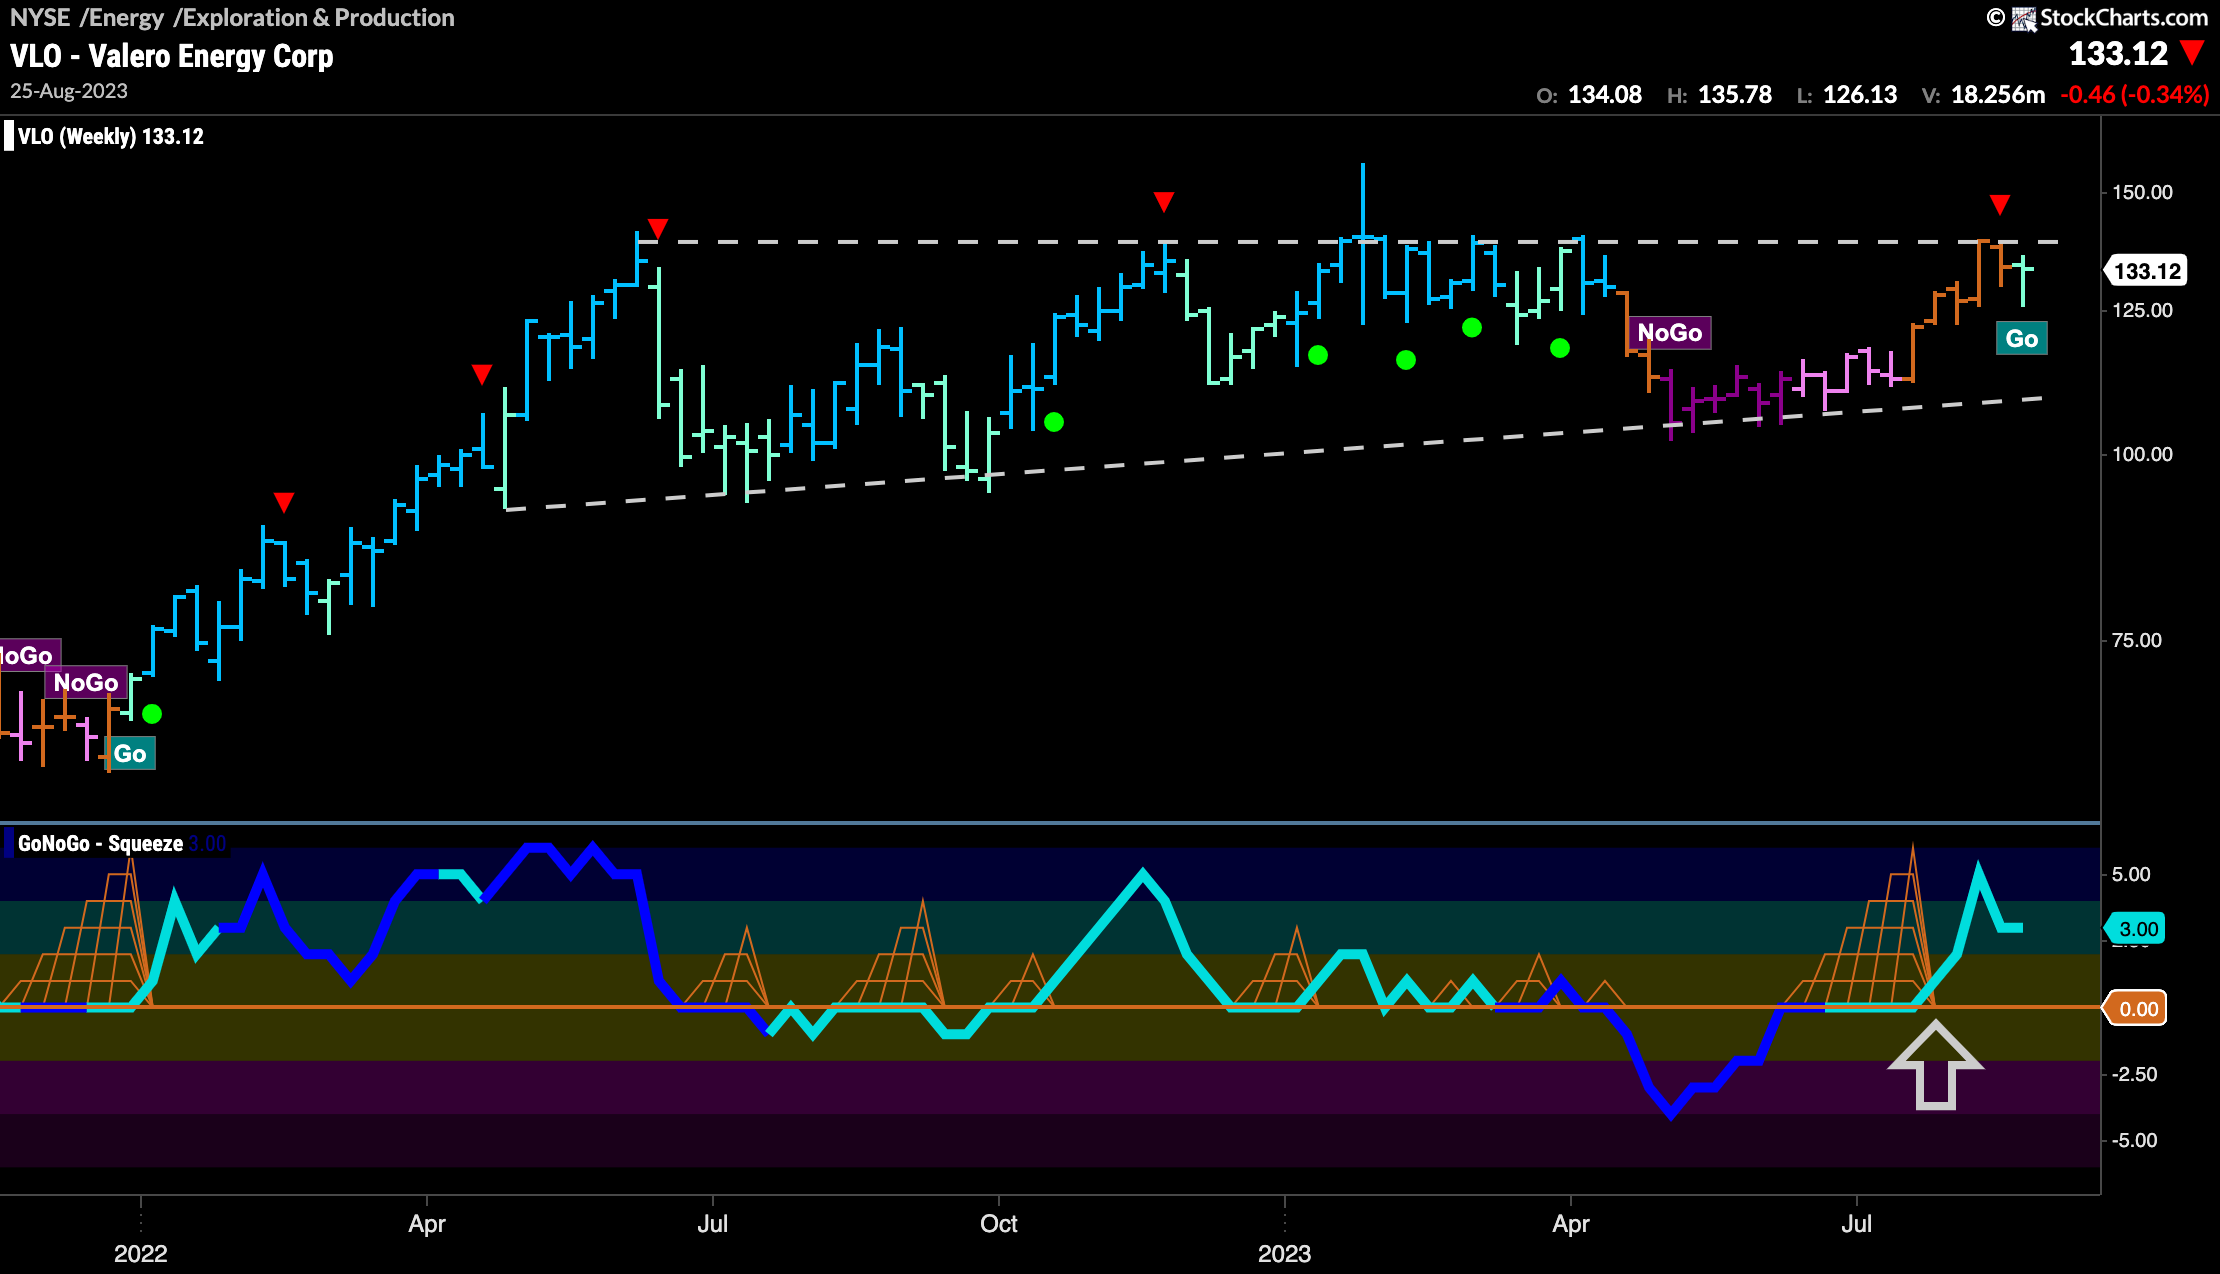
On the weekly chart, we can see that we have been building a long ascending triangle formation. Buyers have been able to push lows ever slightly higher while sellers in the main have held firm at horizontal resistance. As is typical, the right side of the triangle has seen some “NoGo” bars creep in but of late amber “Go Fish” bars have given way to a fresh “Go” trend as price again tests resistance. GoNoGo Oscillator has also broken out of a Max GoNoGo Squeeze and has shot into positive territory, confirming the new “Go” trend in price. We will look to see if price can make a new intermediate high.
