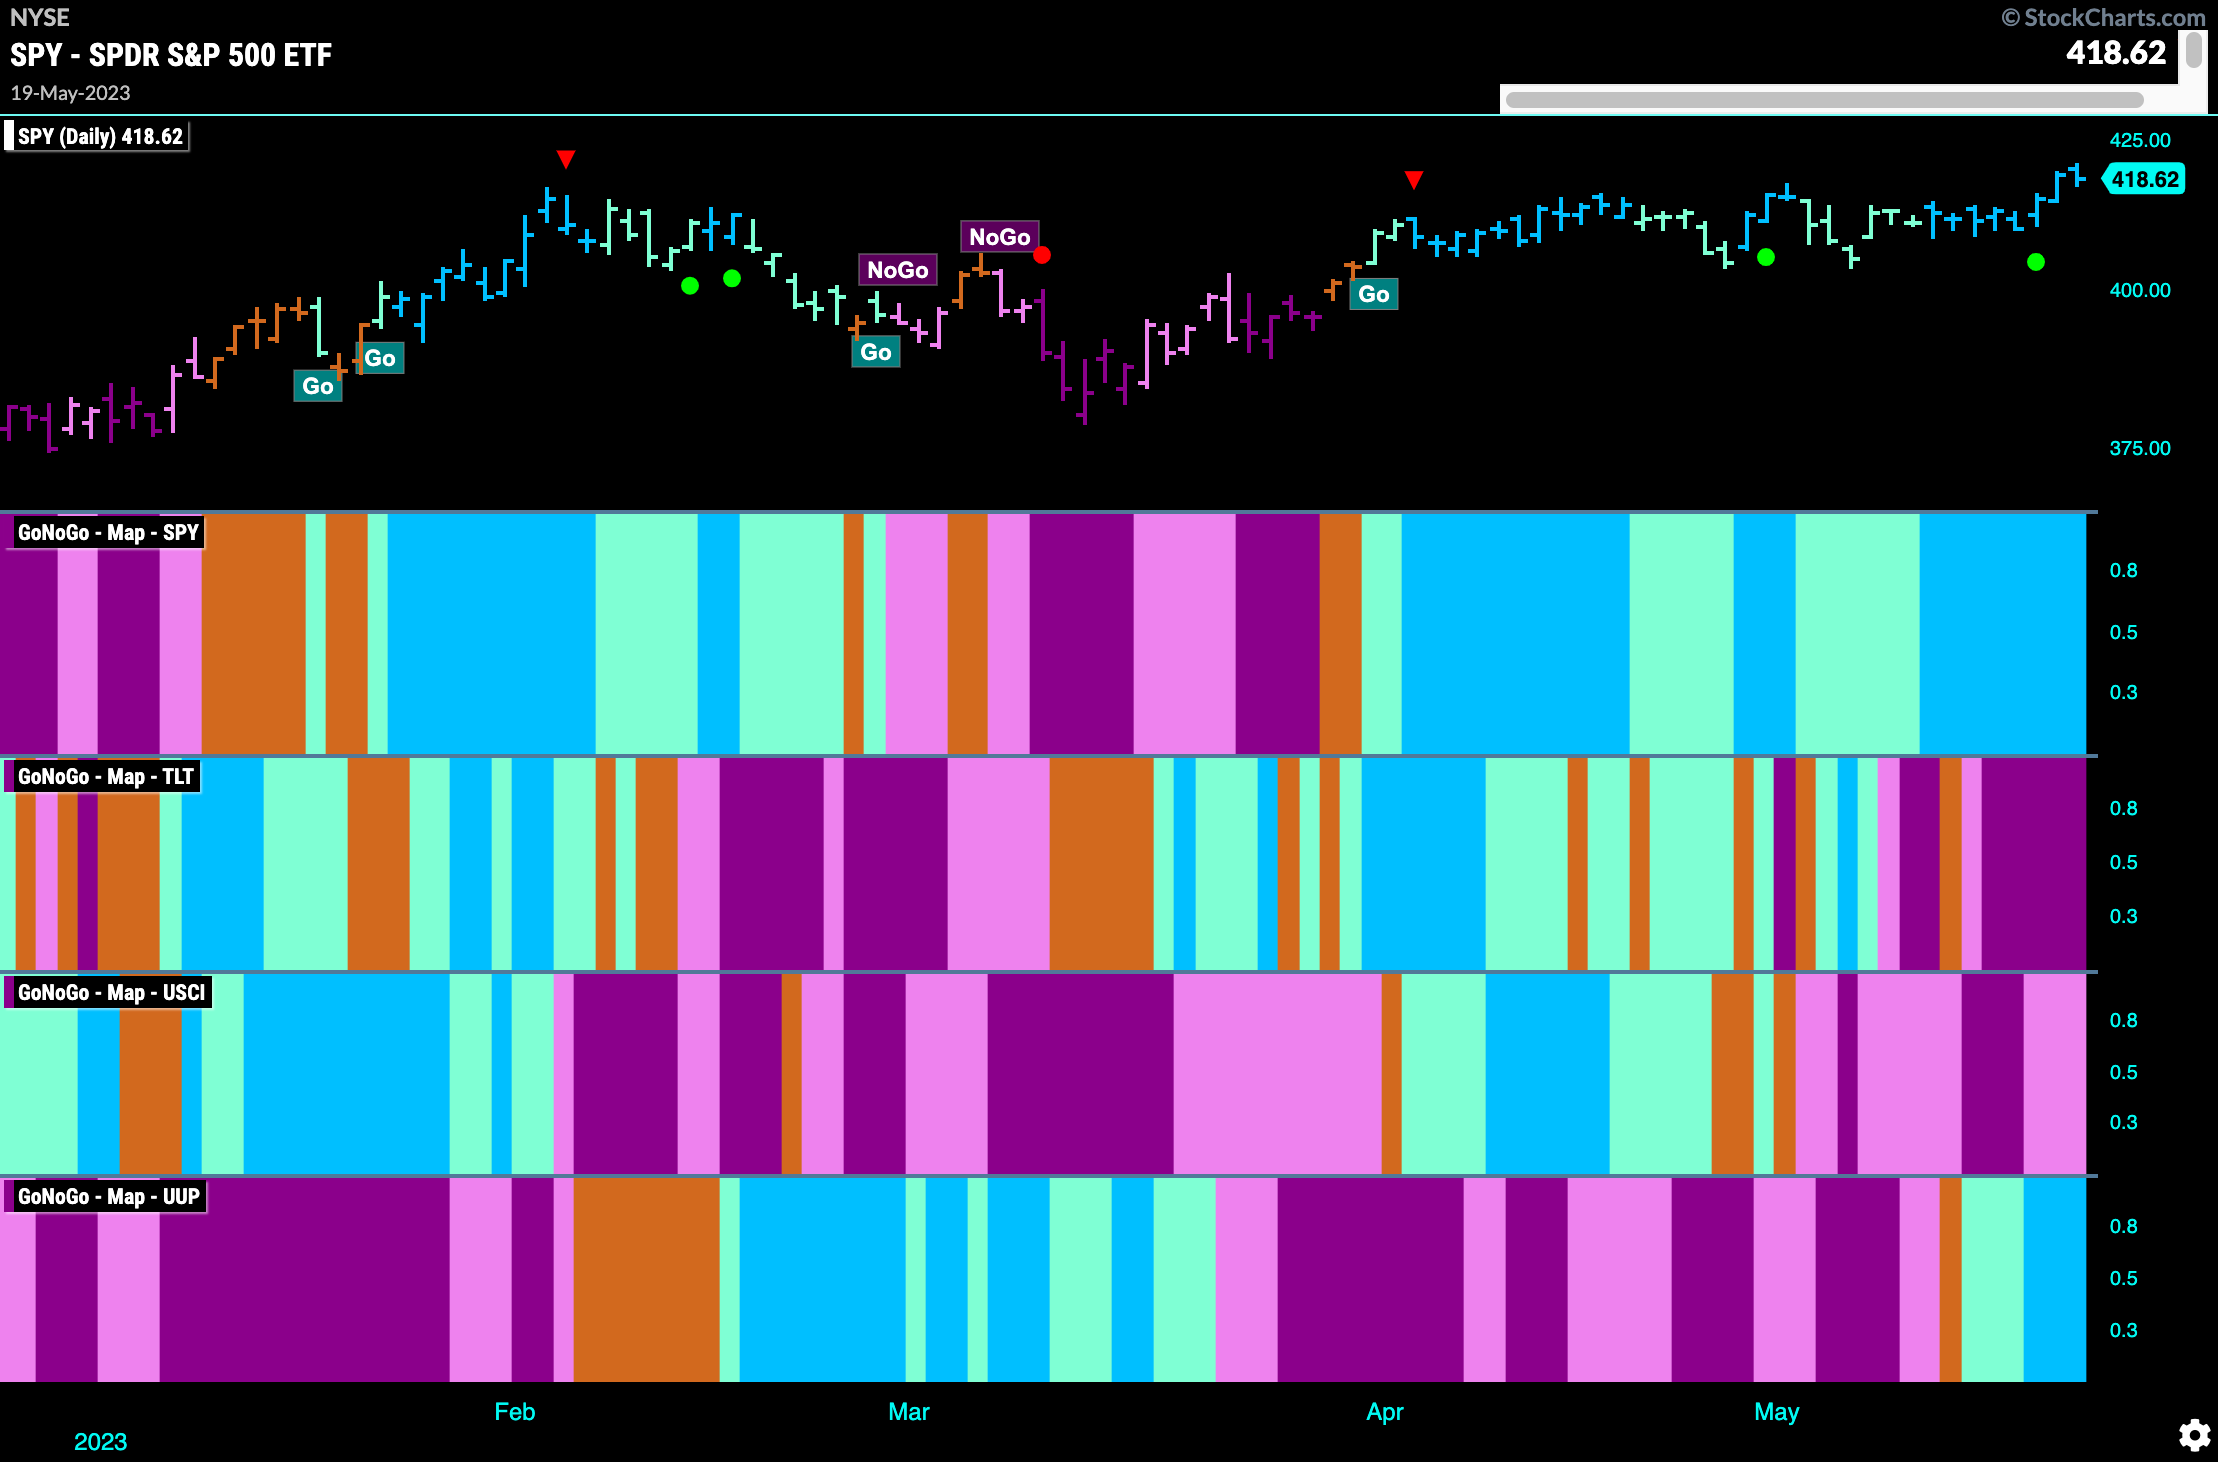
Good morning and welcome to this week’s Flight Path. The Asset Map below shows that the “Go” trend in Equities persists and we have seen stronger blue bars this week as price moved to a new high. Treasury bond prices have fallen further into a “NoGo” trend while commodity prices remain in a “NoGo”. The dollar sees strength in its “Go” trend as GoNoGo Trend paints strong blue bars.
Equities Move Higher to End the Week
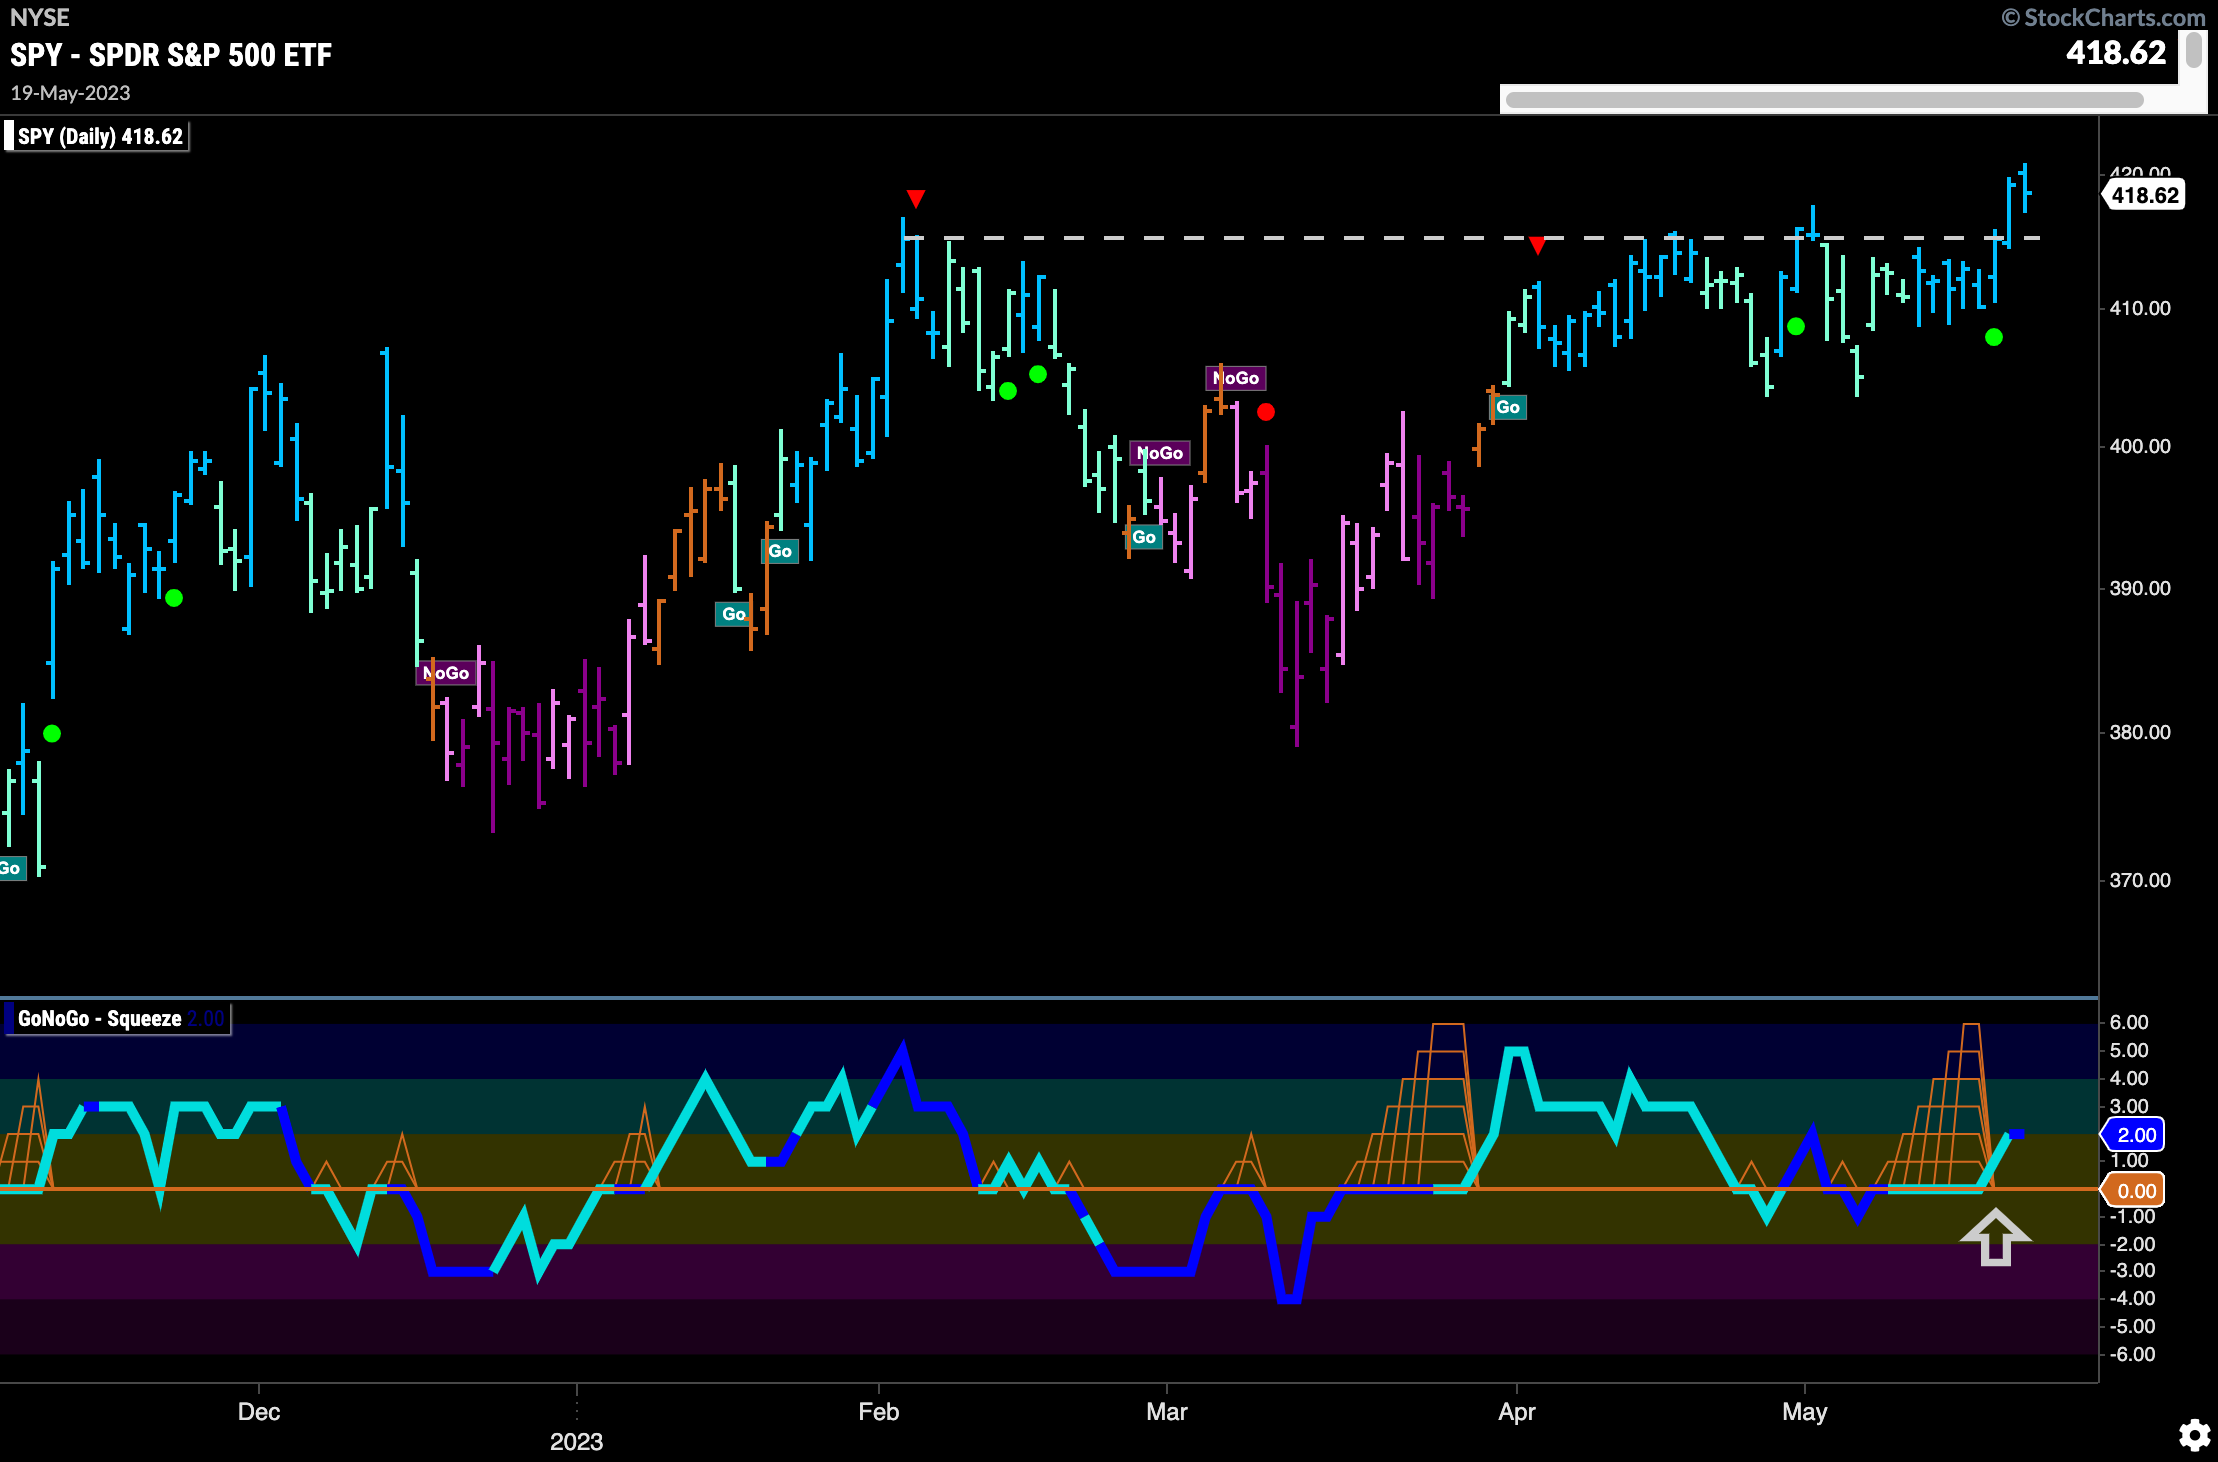
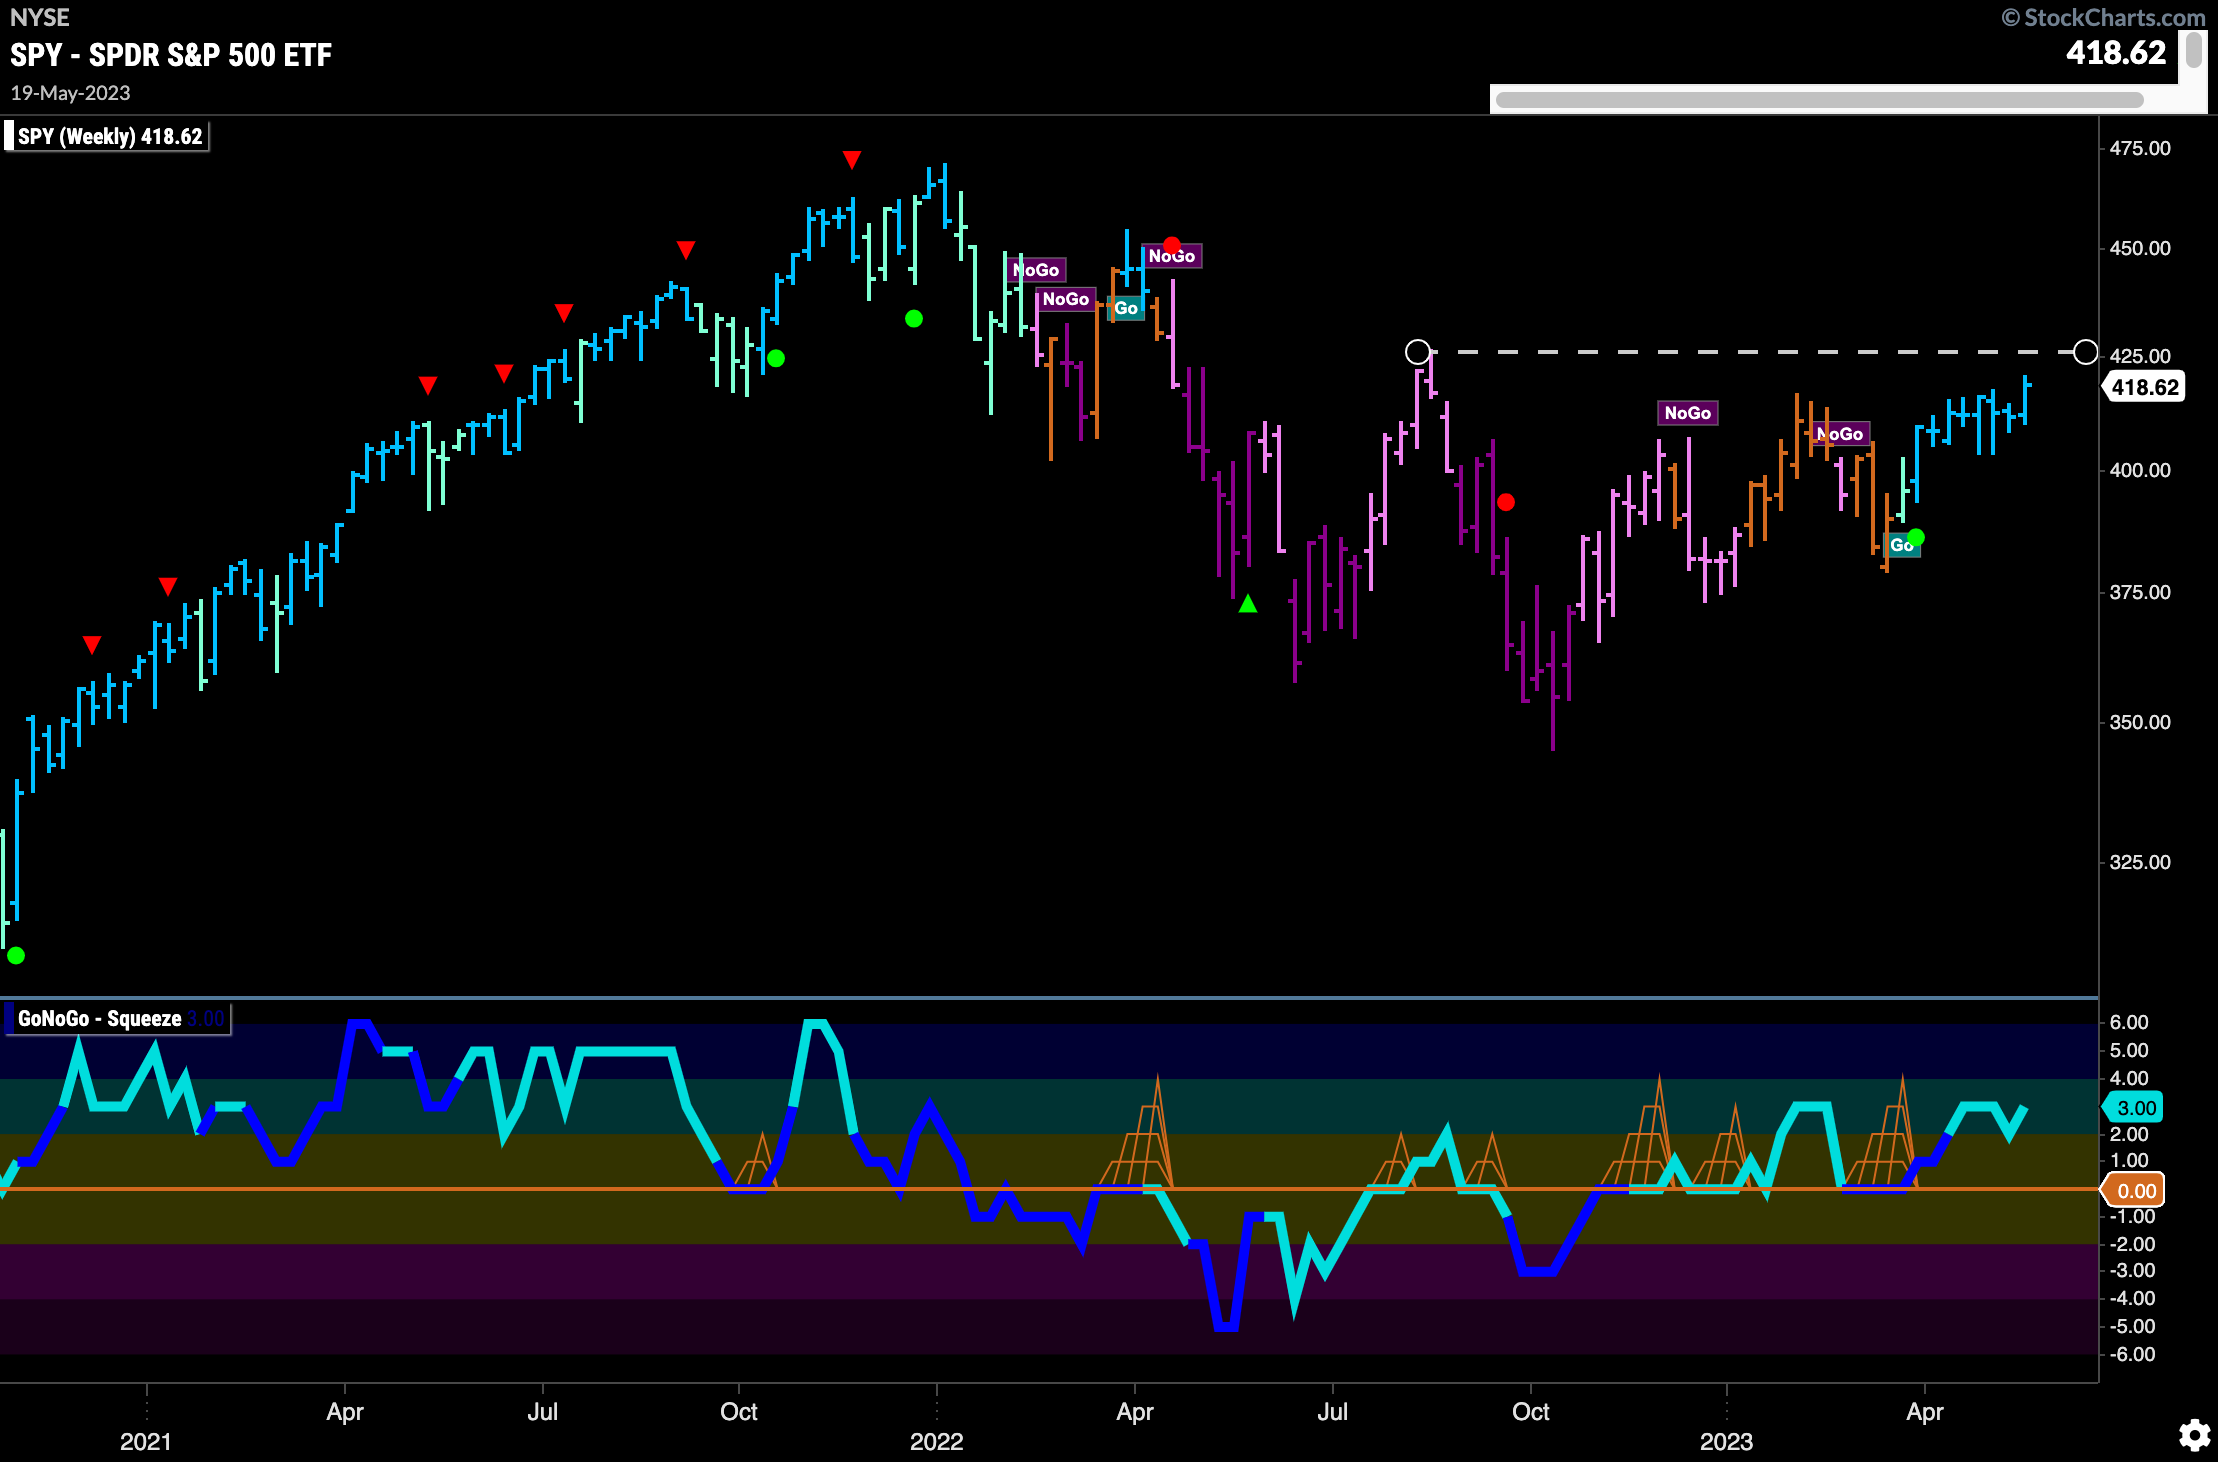
We’ve spoken about the resistance that we saw on the chart of $SPY for several weeks. After struggling with it for some time it appears that last week price was able to climb above it. With GoNoGo Oscillator breaking out of a Max GoNoGo Squeeze into positive territory we can saw that momentum is on the side of the “Go” trend as price moves to a new high.
The longer term weekly chart continues to forge ahead in its “Go” trend as well. This last week we saw another strong blue bar and GoNoGo Oscillator is in positive territory but not yet overbought. We are wary of the fact that there is some likely resistance ahead from the August ’22 highs and we will want to see price deal with that when the time comes.
Treasury Prices Break into “Go” Trend
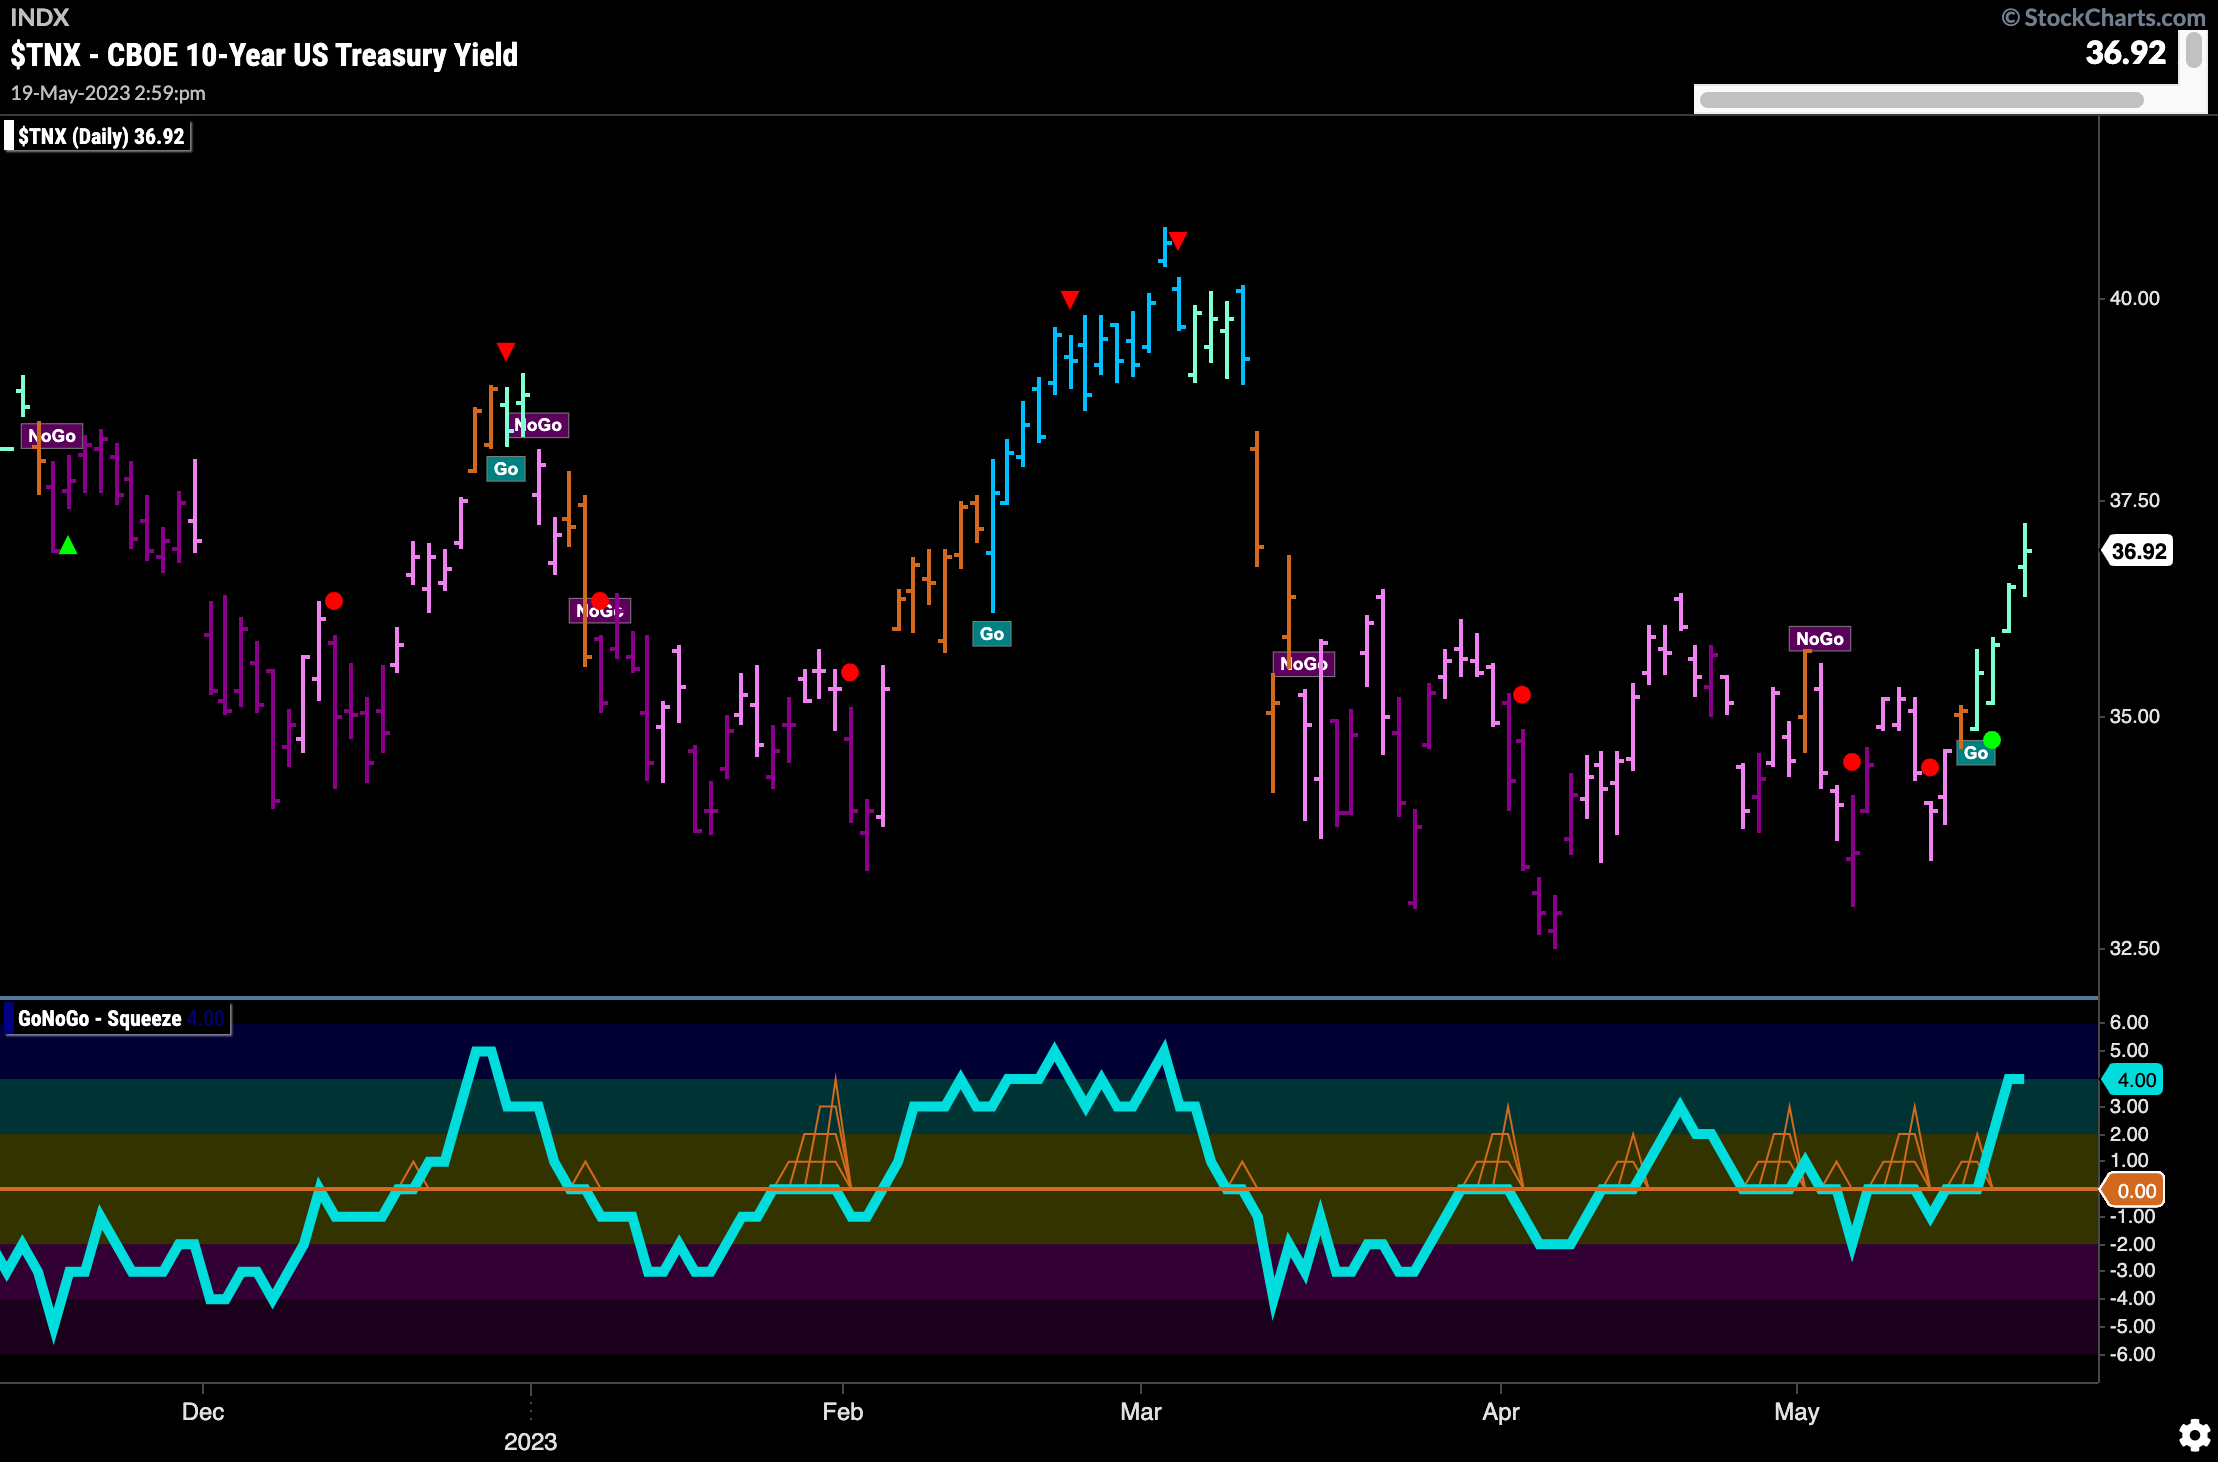
What a week this was for treasury rates. The beginning of the week saw GoNoGo Trend paint an amber “Go Fish” bar of uncertainty and this was quickly followed by a string of “Go” bars. We will be watching closely now as price has made an intermediate high but there is resistance ahead in the form of several prior highs. Its entirely possible that we see price oscillate in this range for some time.
Dollar’s “Go” Trend Strengthens
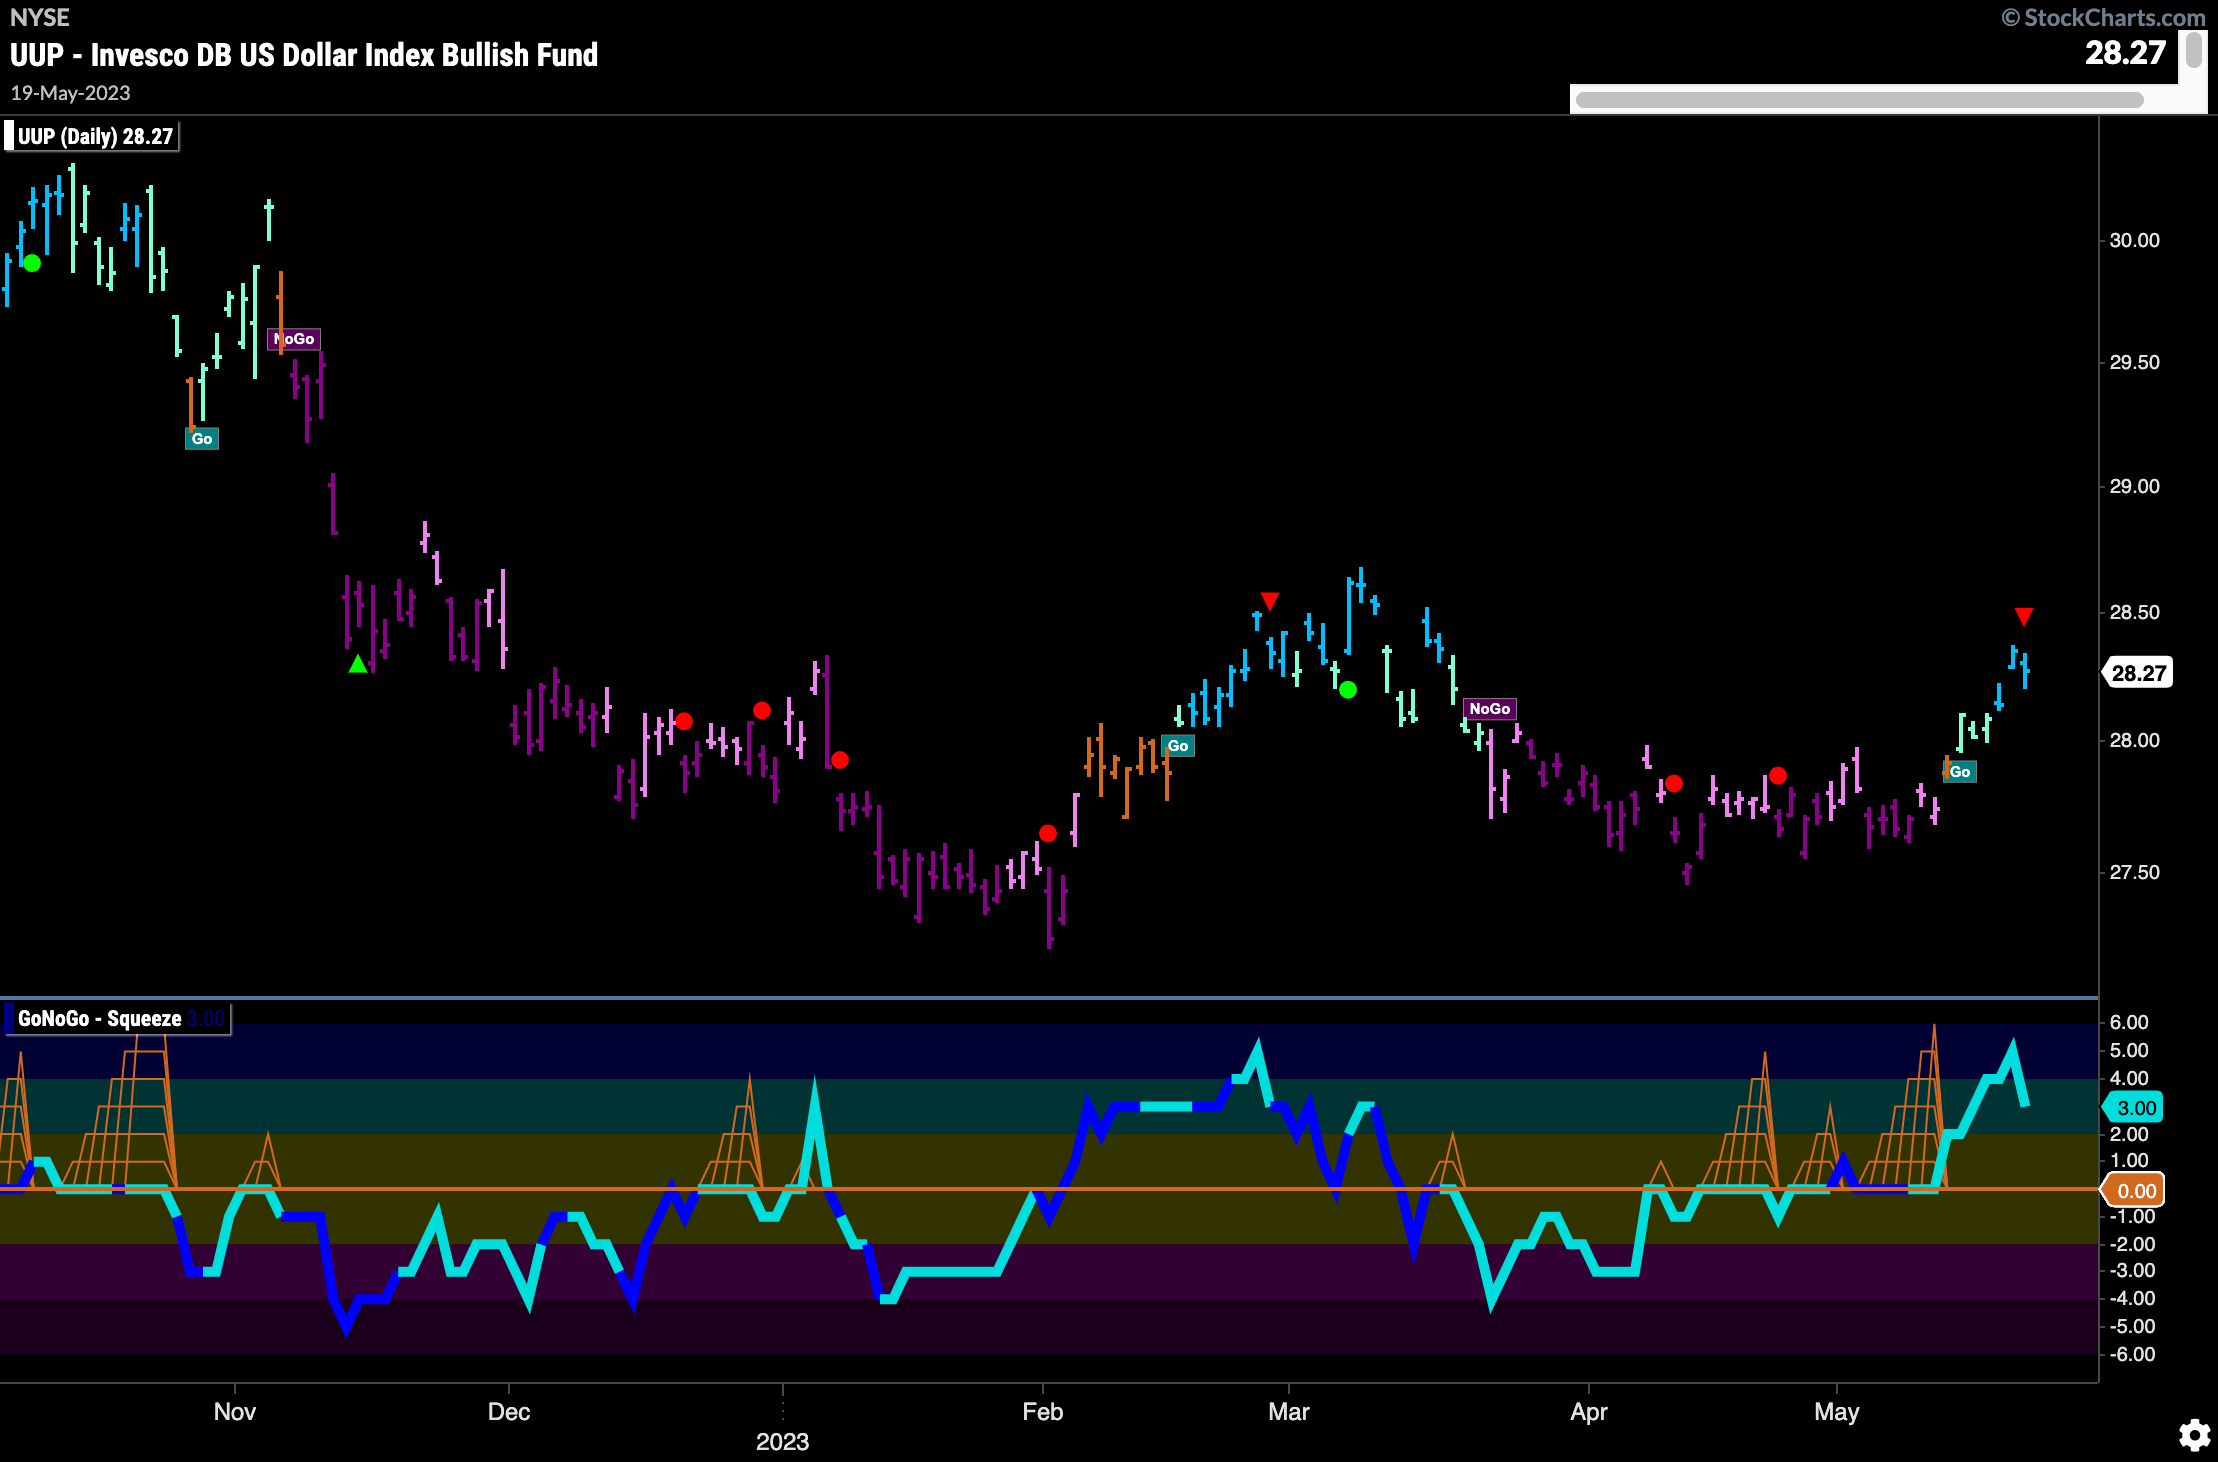
GoNoGo Trend moved into a “Go” trend as the week began and then we saw that trend strengthen until strong blue bars dominated the rest of the week. GoNoGo Oscillator is in positive territory but no longer overbought. There is resistance in the form of March’s highs ahead. We will watch to see if price can consolidate in this new “Go” trend and then make an attack on prior highs.
Oil Prices Remain in Middle of “NoGo” Channel
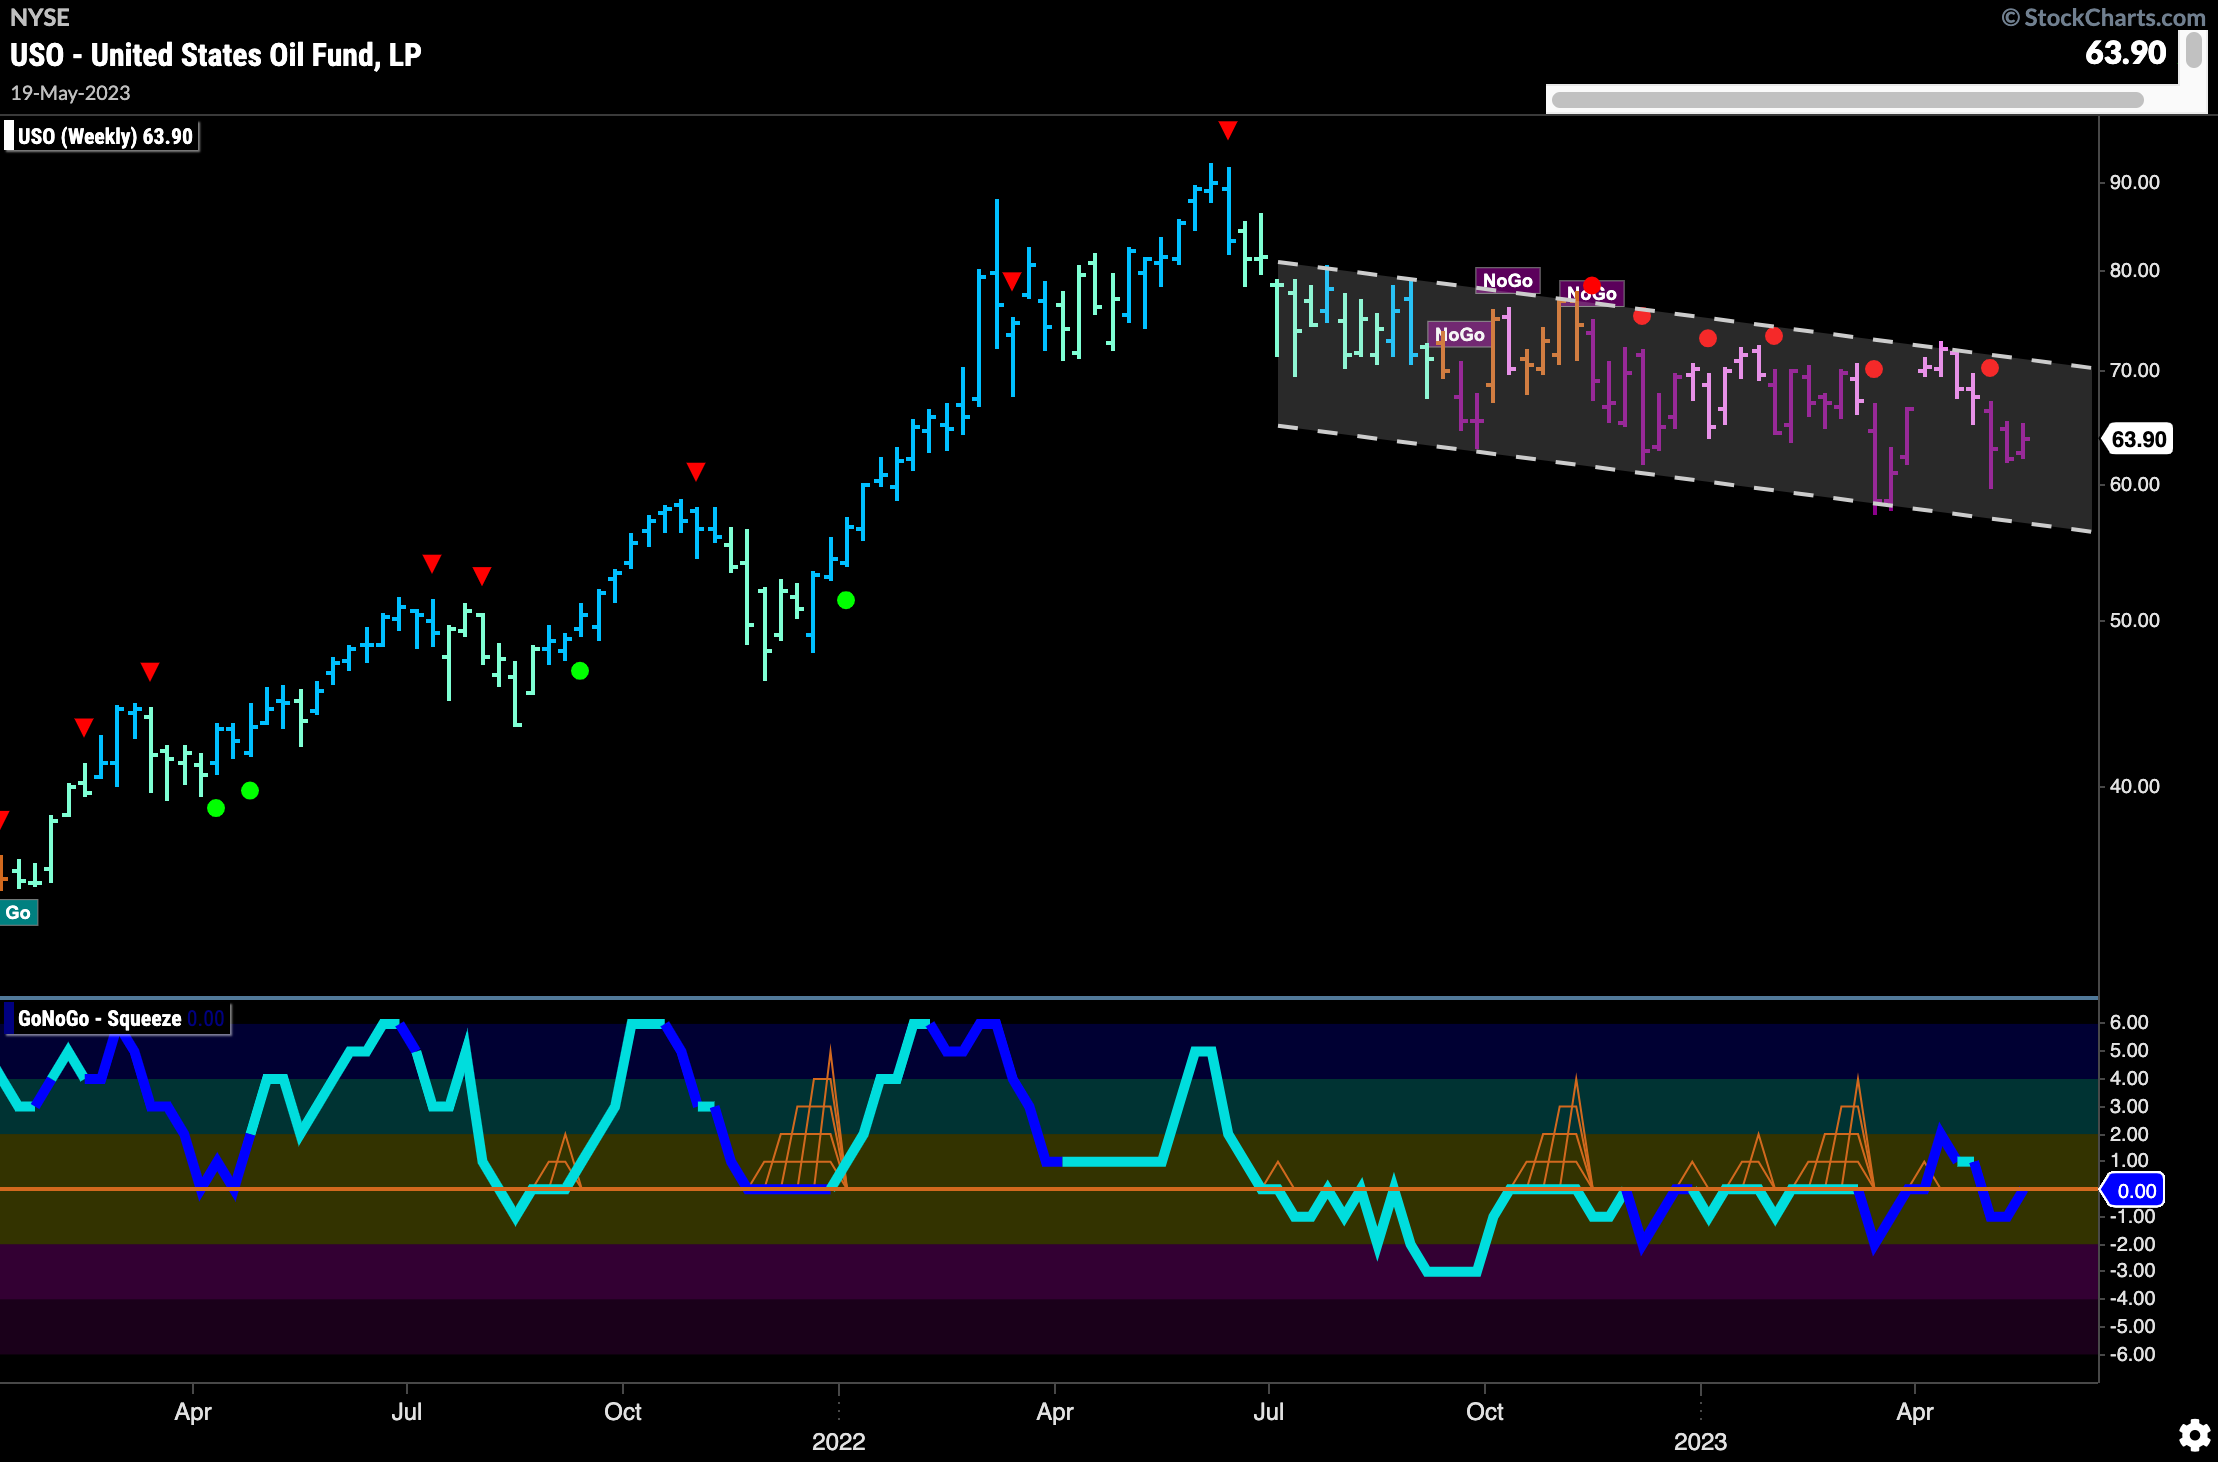
Not much to report this week on $USO as the weekly chart shows that price is doing nothing much but hang out in the middle of the downward sloping “NoGo” trend channel. GoNoGo Oscillator is fluctuating around the zero line and we will watch to see what happens here as it touches zero from below. Rejection at that level would likely see price move lower and test the lower bound of the trend channel.
Gold Breaks Down into “NoGo”
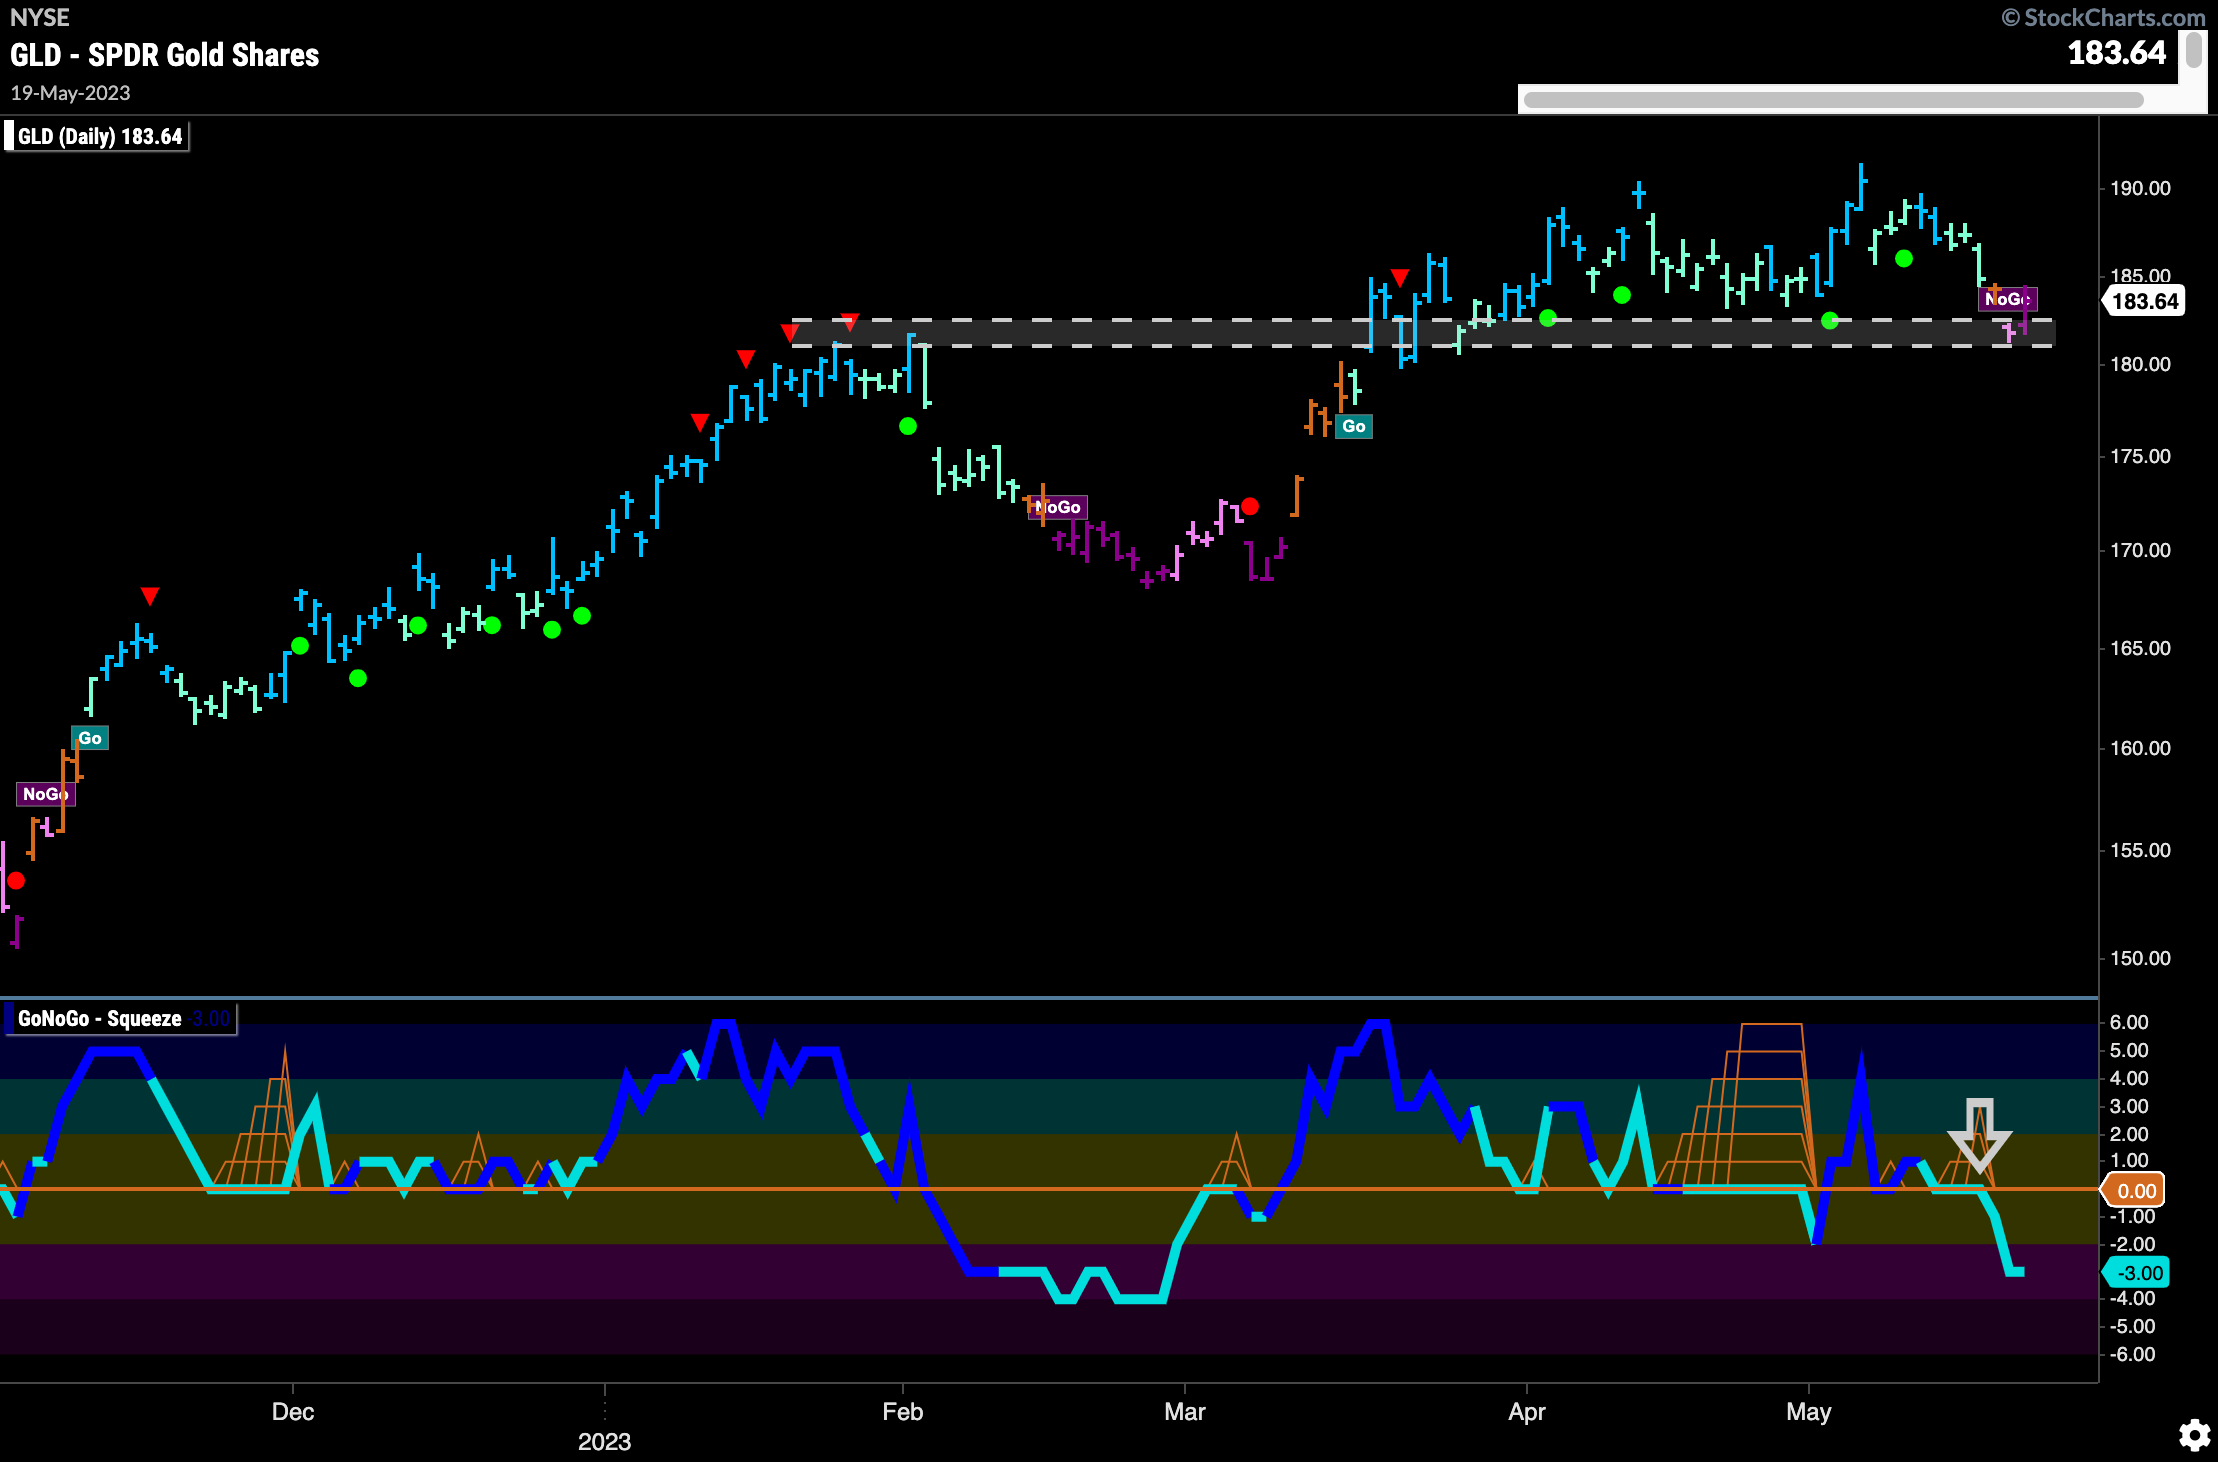
After failing at the highs, $GLD fell away and far enough for GoNoGo Trend to paint first an amber “Go Fish” bar and then “NoGo” bars to end the week. We see price is in an area that could well be support. However, GoNoGo Oscillator has recently and authoritatively broken through the zero line into negative territory. This tells us that momentum is resurgent in the direction of the new “NoGo” trend.
Sector RelMap
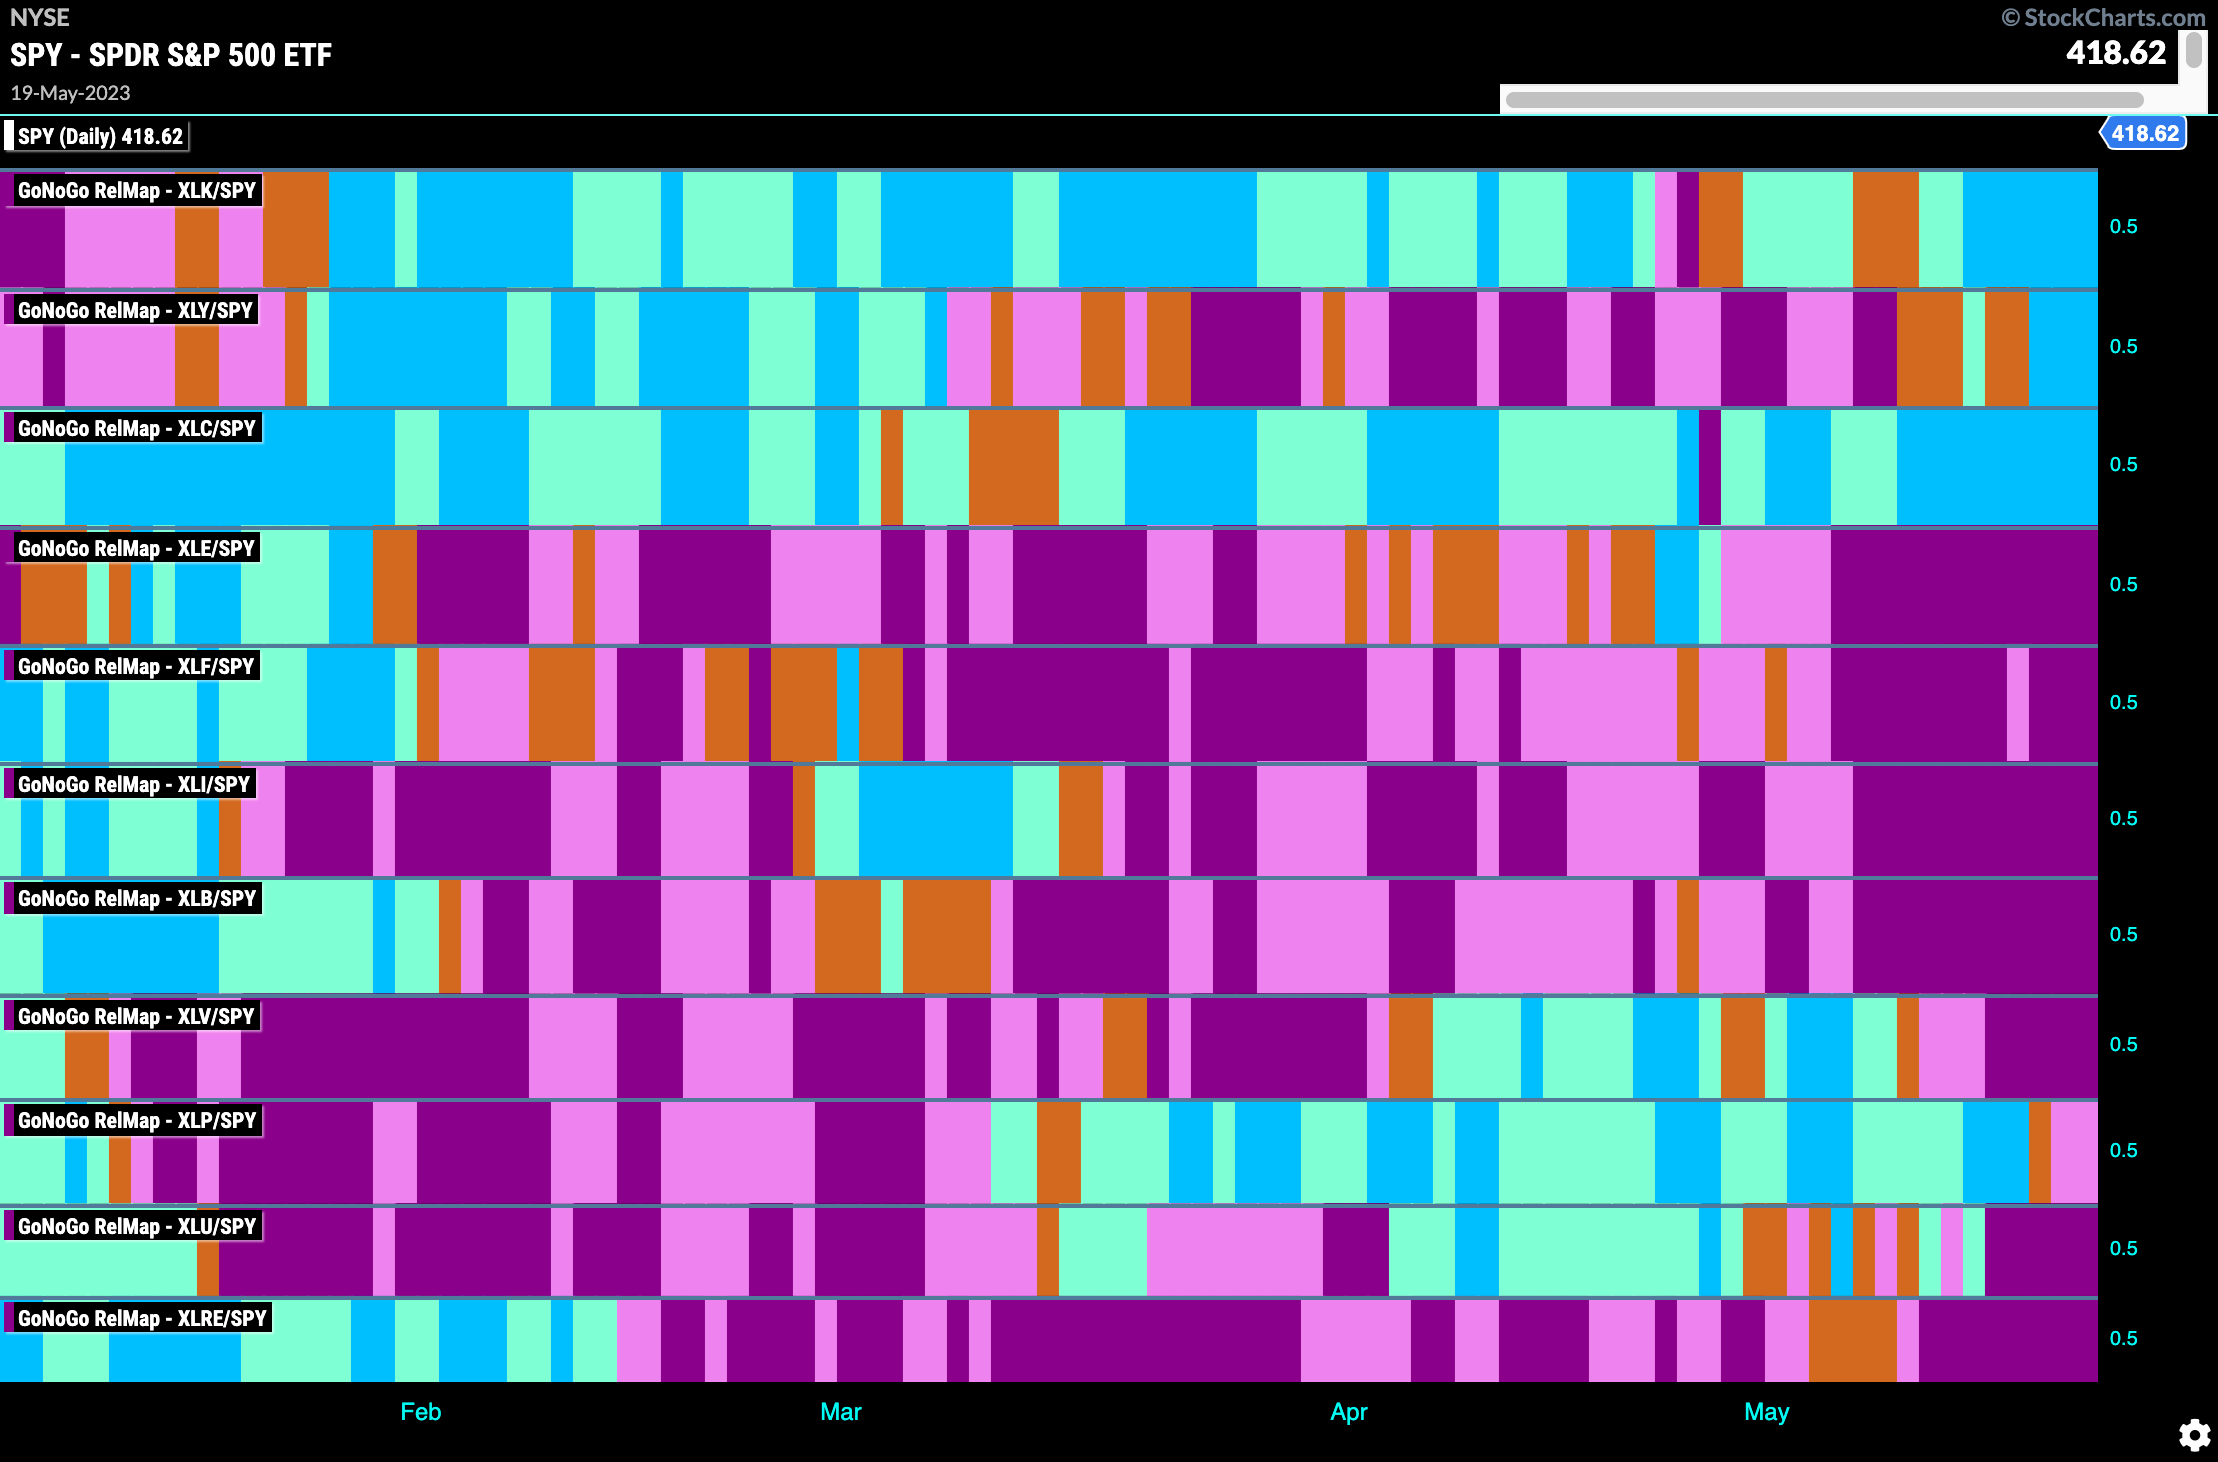
Below is the GoNoGo Sector RelMap. This GoNoGo RelMap applies the GoNoGo Trend to the relative strength ratios of the sectors to the base index. Looking at this map, we can quickly see where the relative outperformance is coming from as well as which sectors are lagging on a relative basis. 3 sectors are outperforming the base index this week. $XLK, $XLY, and $XLC are painting “Go” bars.
Homebuilders
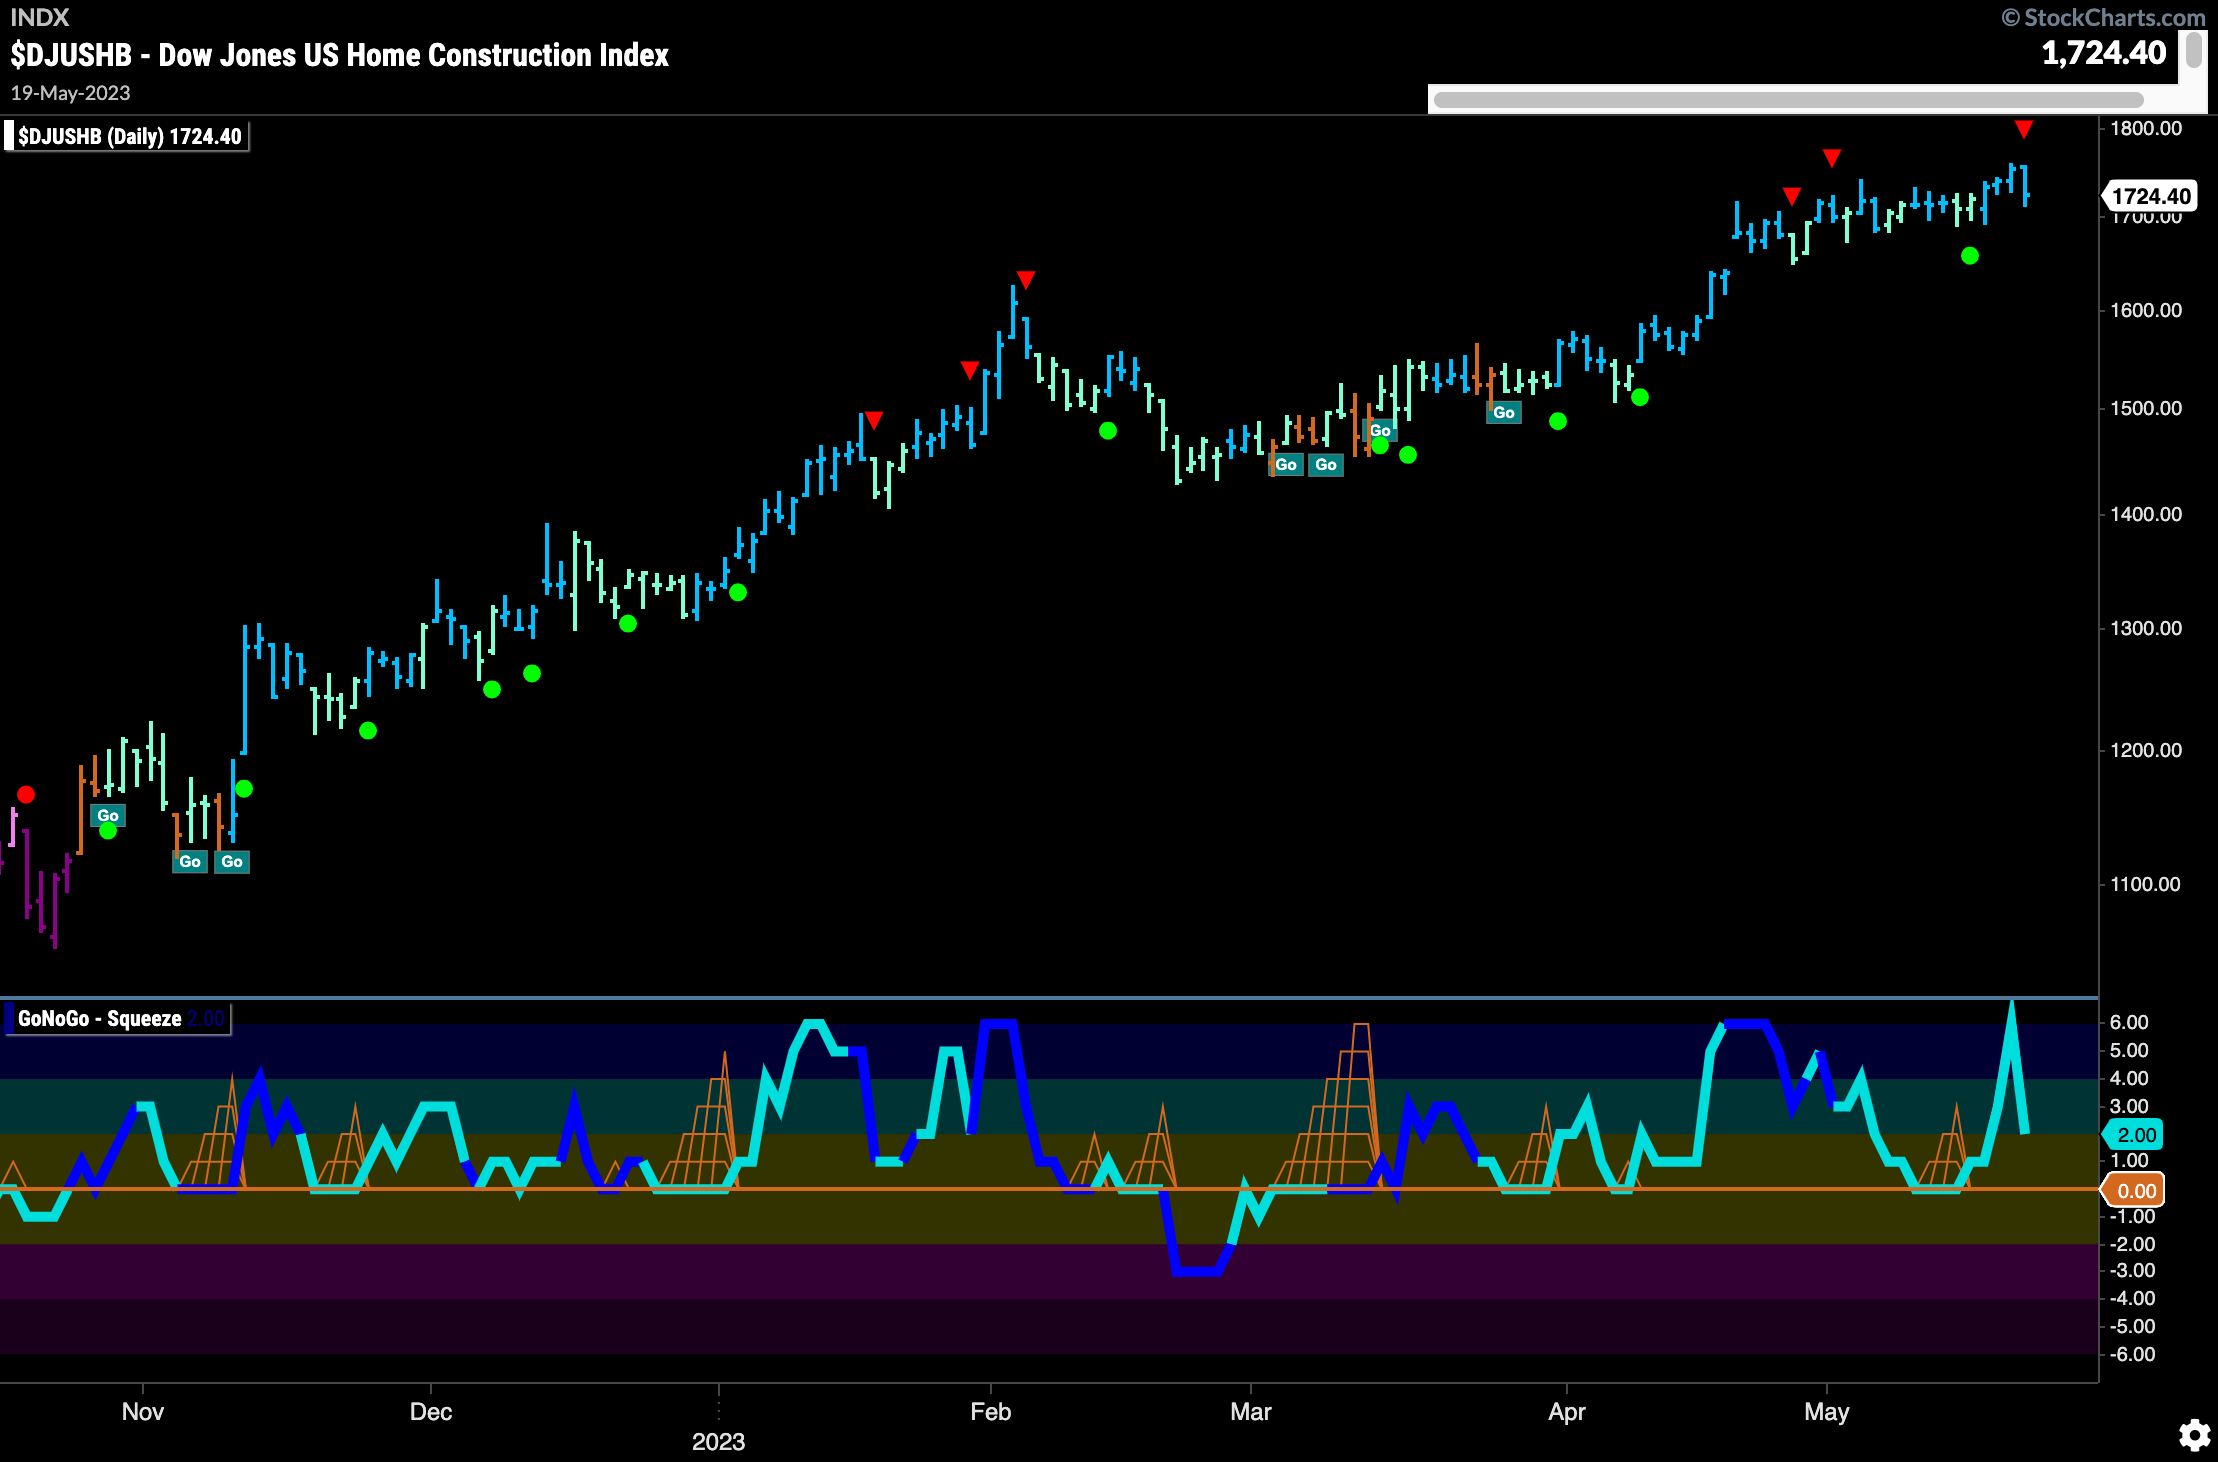
Looking at the RelMap above we saw that the discretionary sector was outperforming the wider index on a relative basis. Within that sector, the home construction sub group is outperforming the sector itself. The chart below shows the trend of $DJUSHB. A strong “Go” trend showing higher highs and higher lows since November of last year. With trend in place like this it can behoove investors to look for opportunities in this space.
$PHM in Incredible “Go” Trend
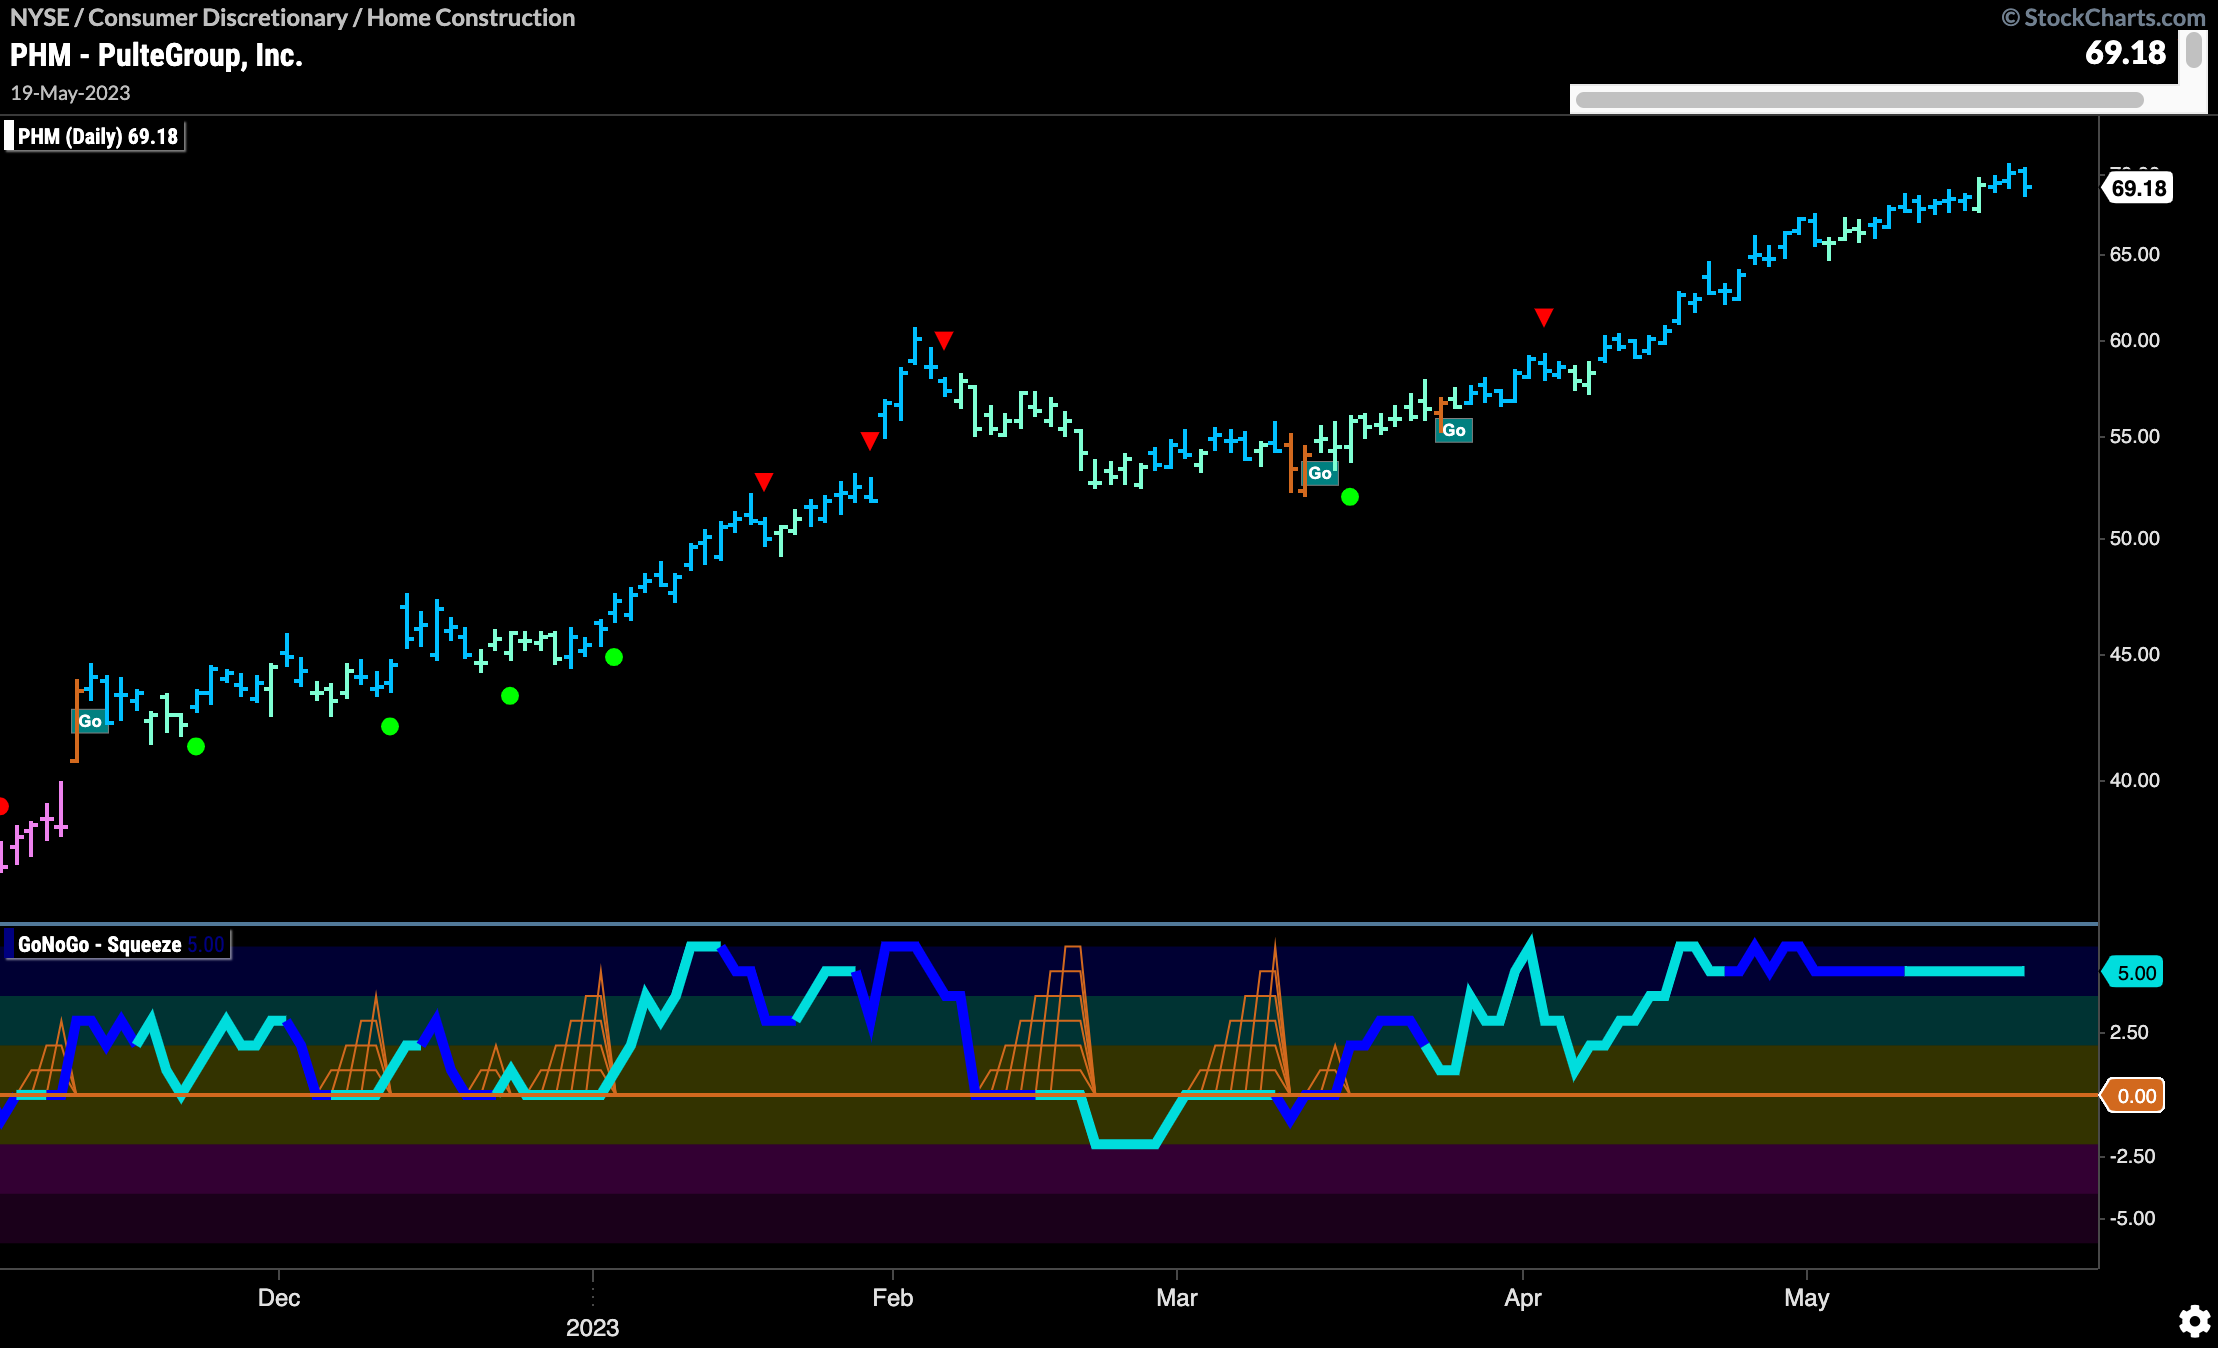
You don’t often see trends like this. We often say that trends don’t move in straight lines, but this is about as close as it gets. With GoNoGo Oscillator remaining overbought for some time you can see how strong market participation has been. We will watch to see if any pull back brings GoNoGo Oscillator down to test the zero line and we can look for it to find support at that level and indicate trend continuation.
$KBH Looks for Support at Zero
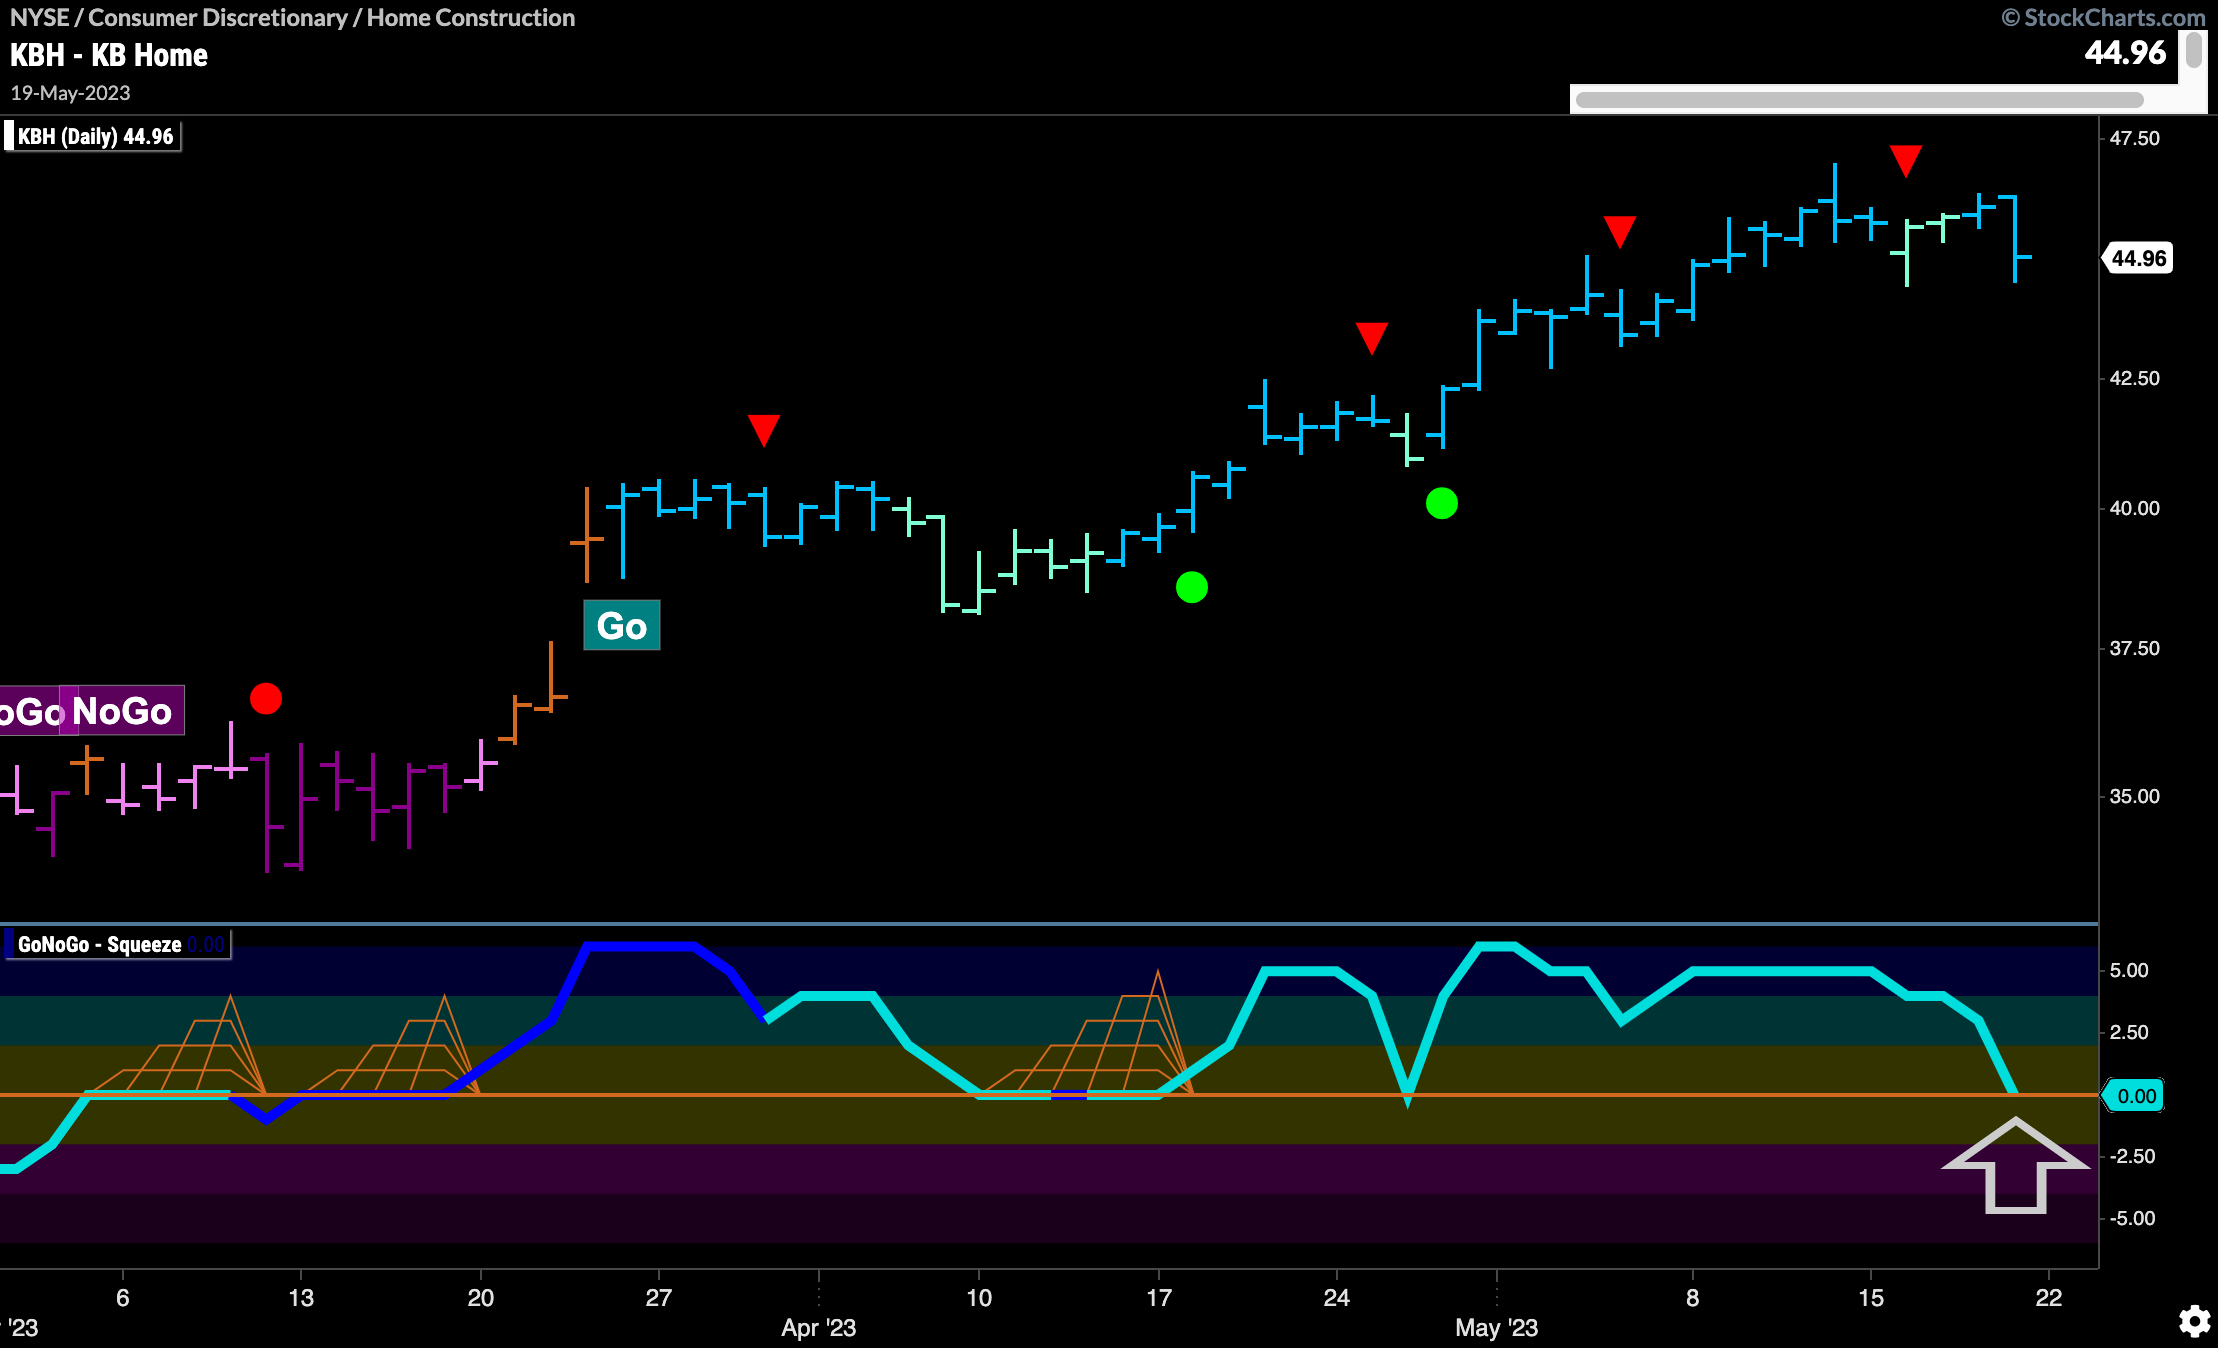
KB Home is in a “Go” trend as well but perhaps more likely to offer an entry opportunity in the near future. As price consolidates after a Go Countertrend Correction Icon (red arrow) we see that GoNoGo Oscillator has fallen to the zero line. If this trend is strong enough to continue higher we will likely see GoNoGo Oscillator find support at this level and that would indicate resurgent momentum in the direction of the “Go” trend. In this case, GoNoGo Charts would trigger a Go Trend Continuation Icon (green circle) under the price bar.
