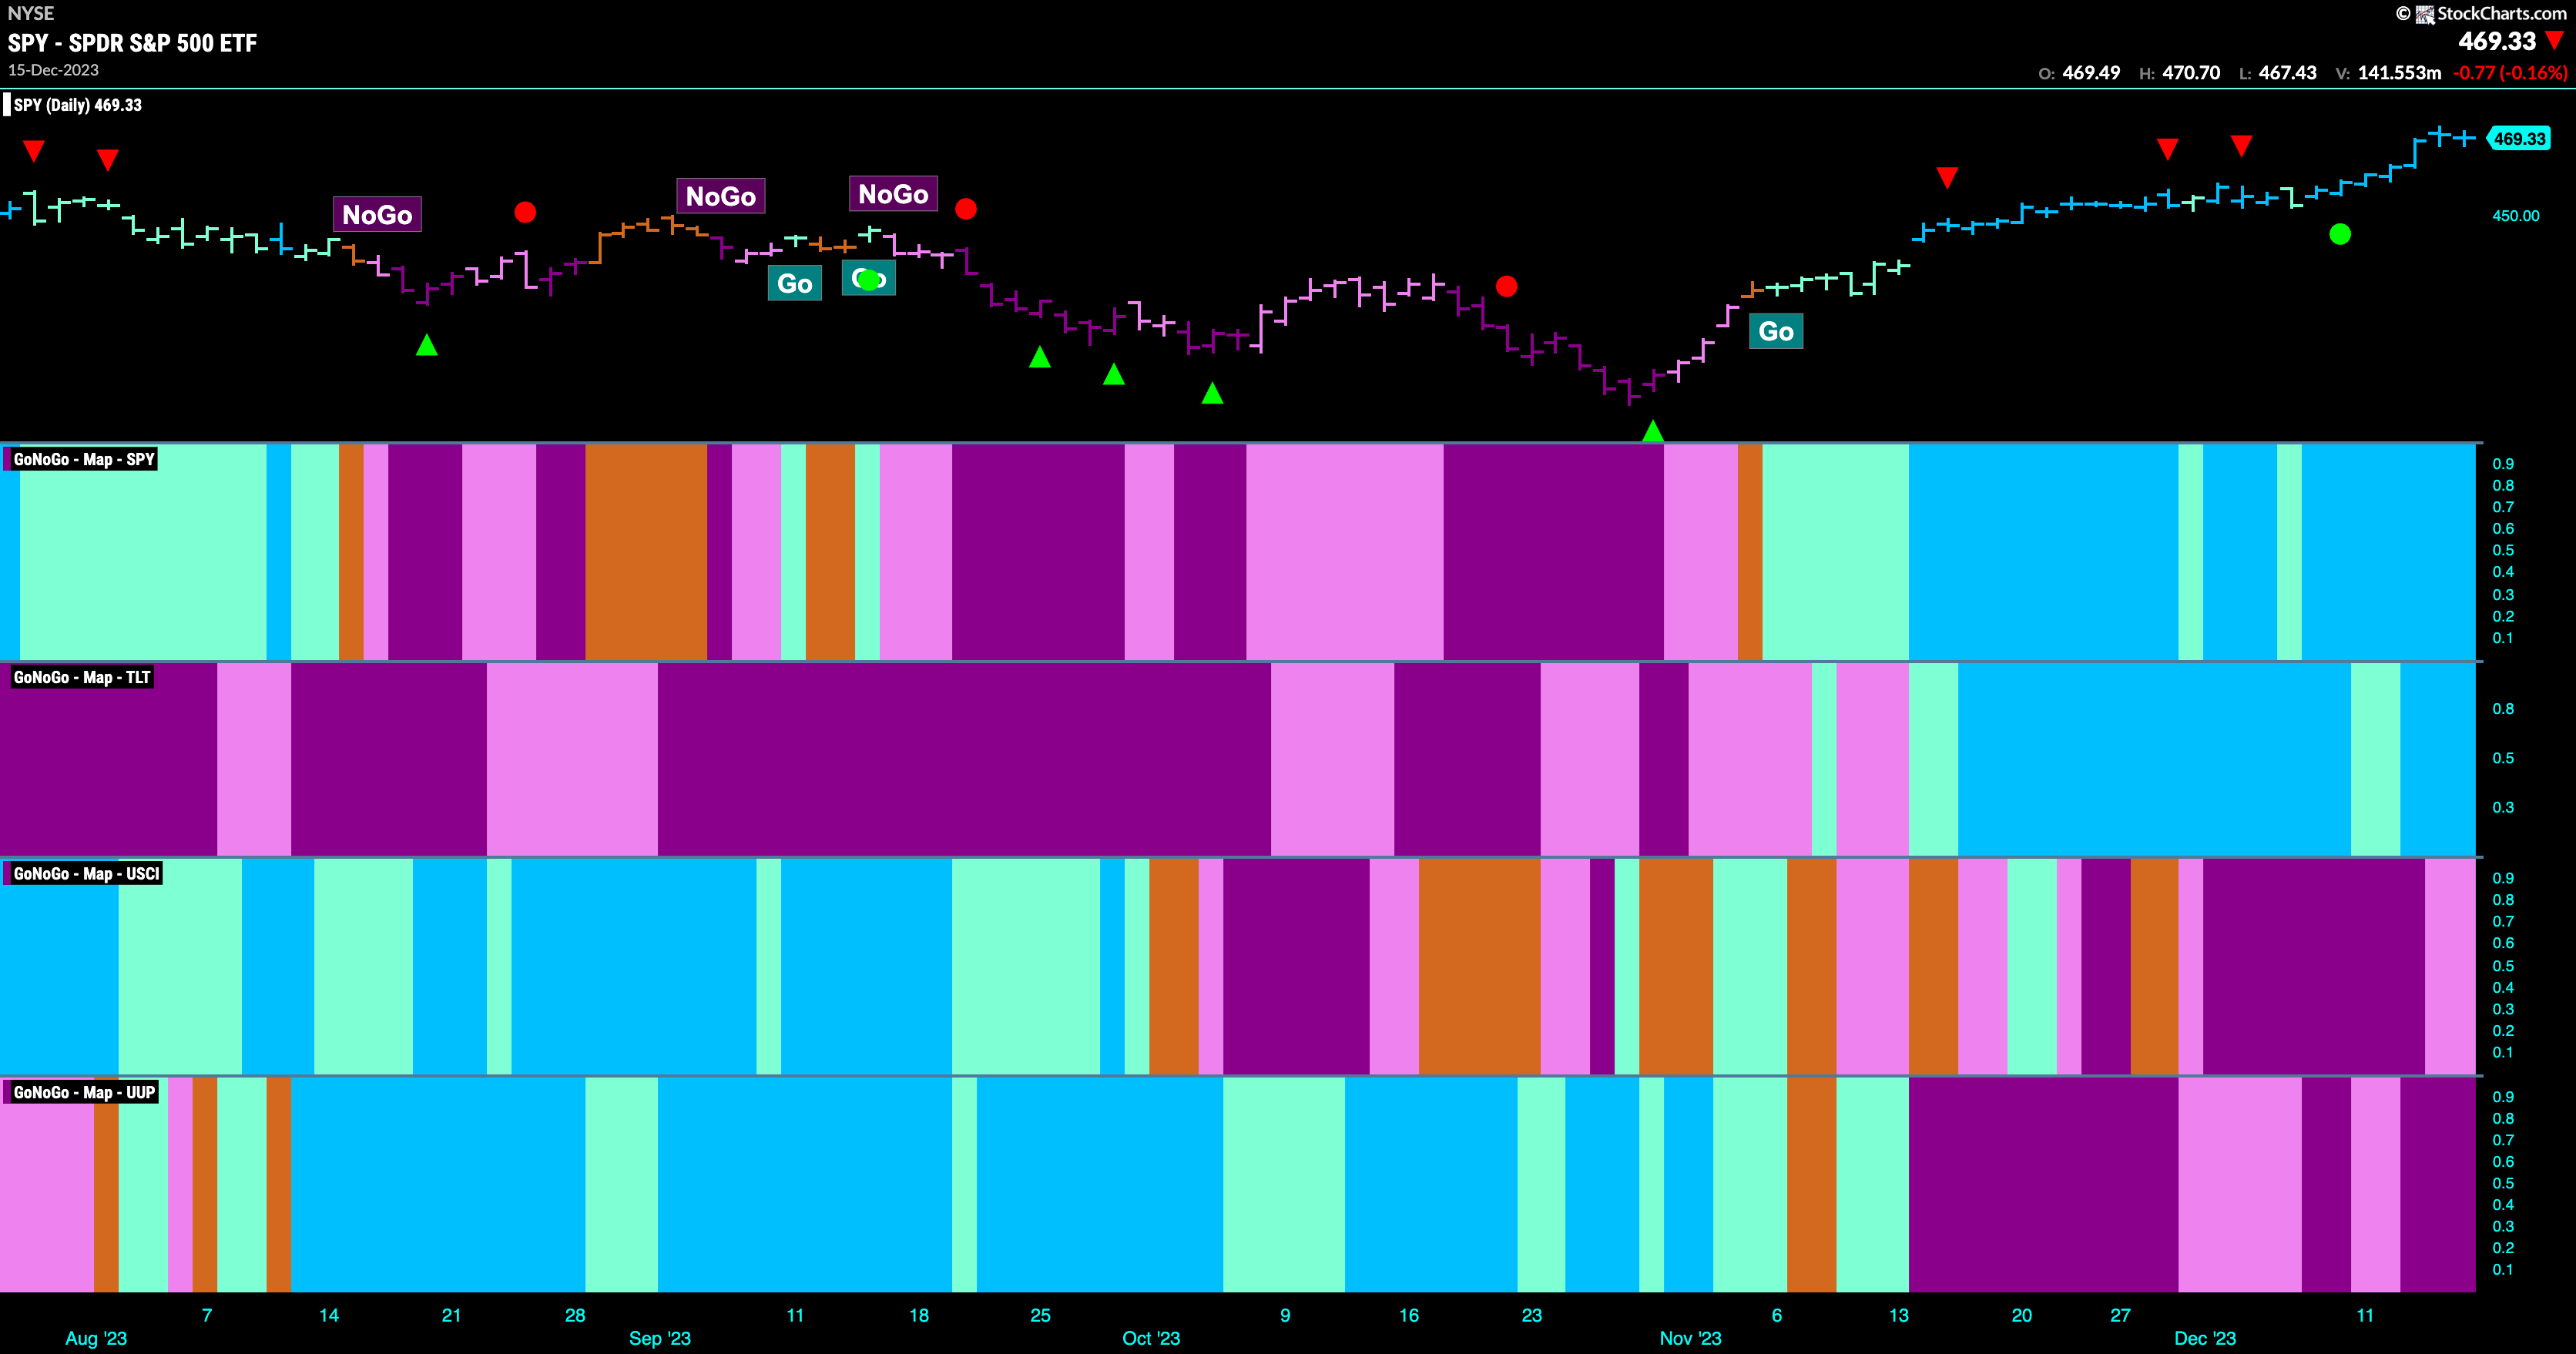
Good morning and welcome to this week’s Flight Path. Equity painted a string of uninterrupted strong blue “Go” bars this week as price climbed higher. Treasury bond prices also remained in a strong “Go” trend and bright blue bars returned in the second half of the week. Commodities saw the “NoGo” remain in place but did see weakness at the end of the week. The dollar saw the “NoGo” return to paint strong purple bars after a few weaker pink bars showed weakness in the “NoGo” trend early in the week.
Equity Jump to New Highs
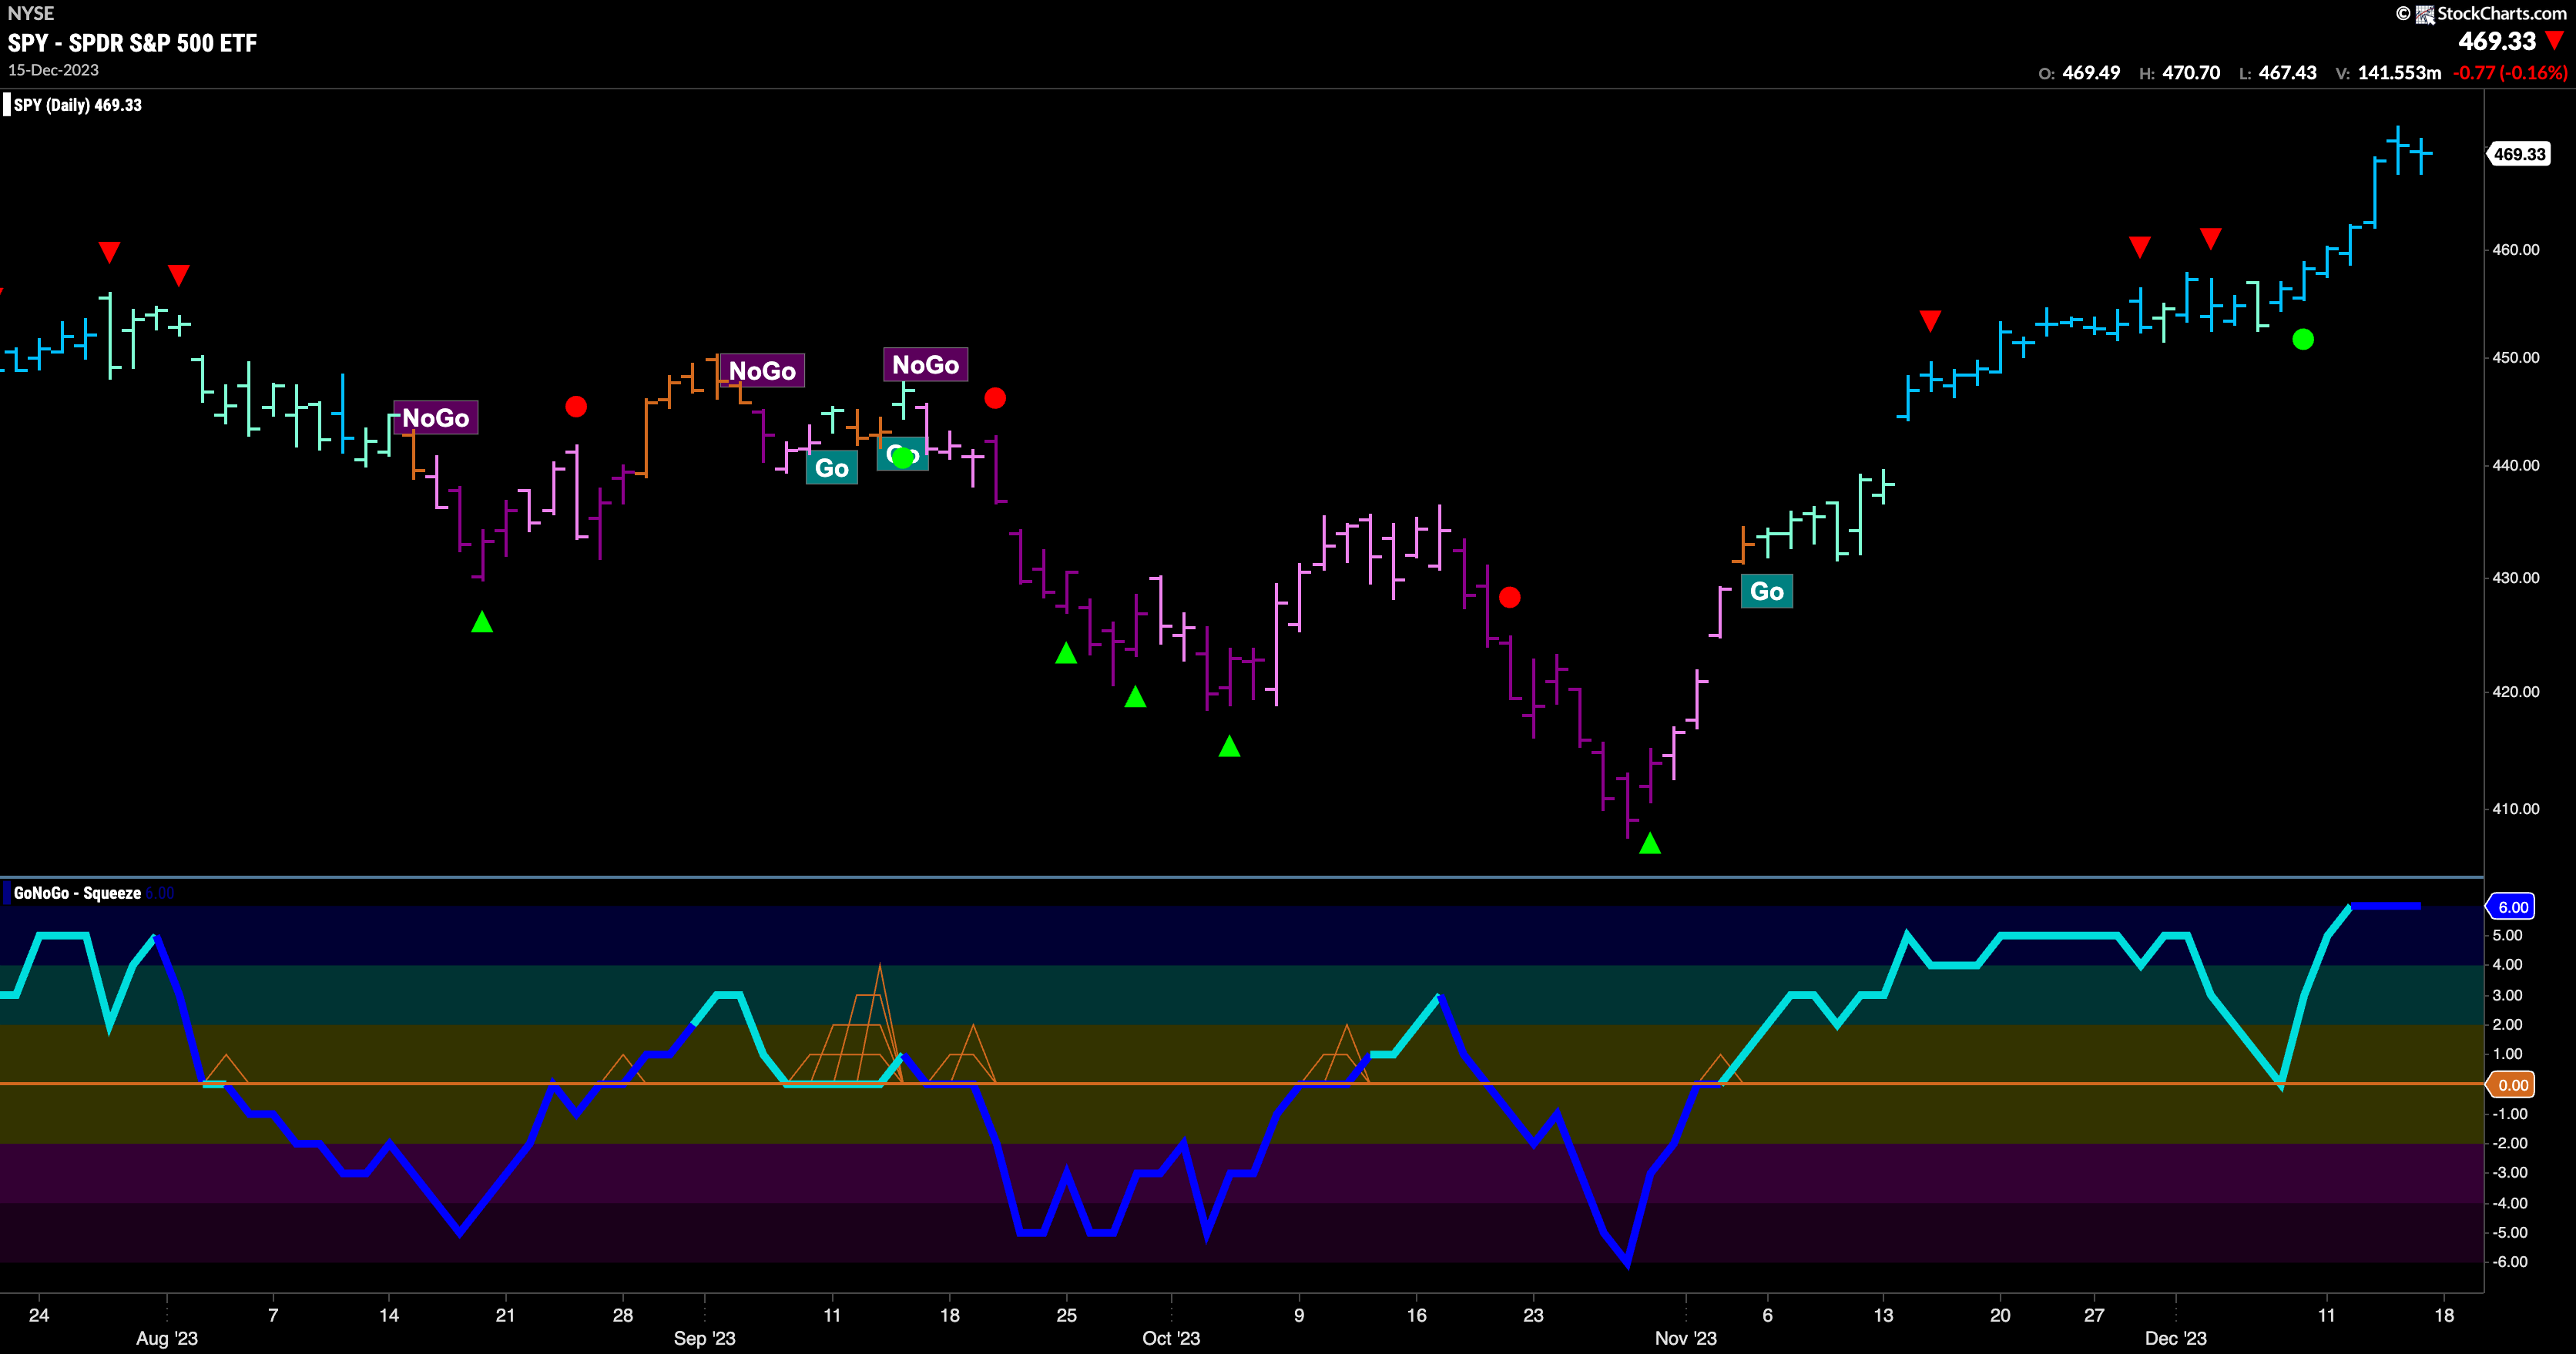
As mentioned above, U.S. equities enjoyed a strong week. New highs were hit as GoNoGo Trend painted strong blue “Go” bars. At the end of last week we saw a Go Trend Continuation Icon (green circle) which suggested price may push higher and it did. This icon is displayed when GoNoGo Oscillator finds support at the zero line. This tells us that momentum is resurgent in the direction of the underlying trend. In this case, with a “Go” trend in place it indicated that price may get the boost from positive momentum to go higher.
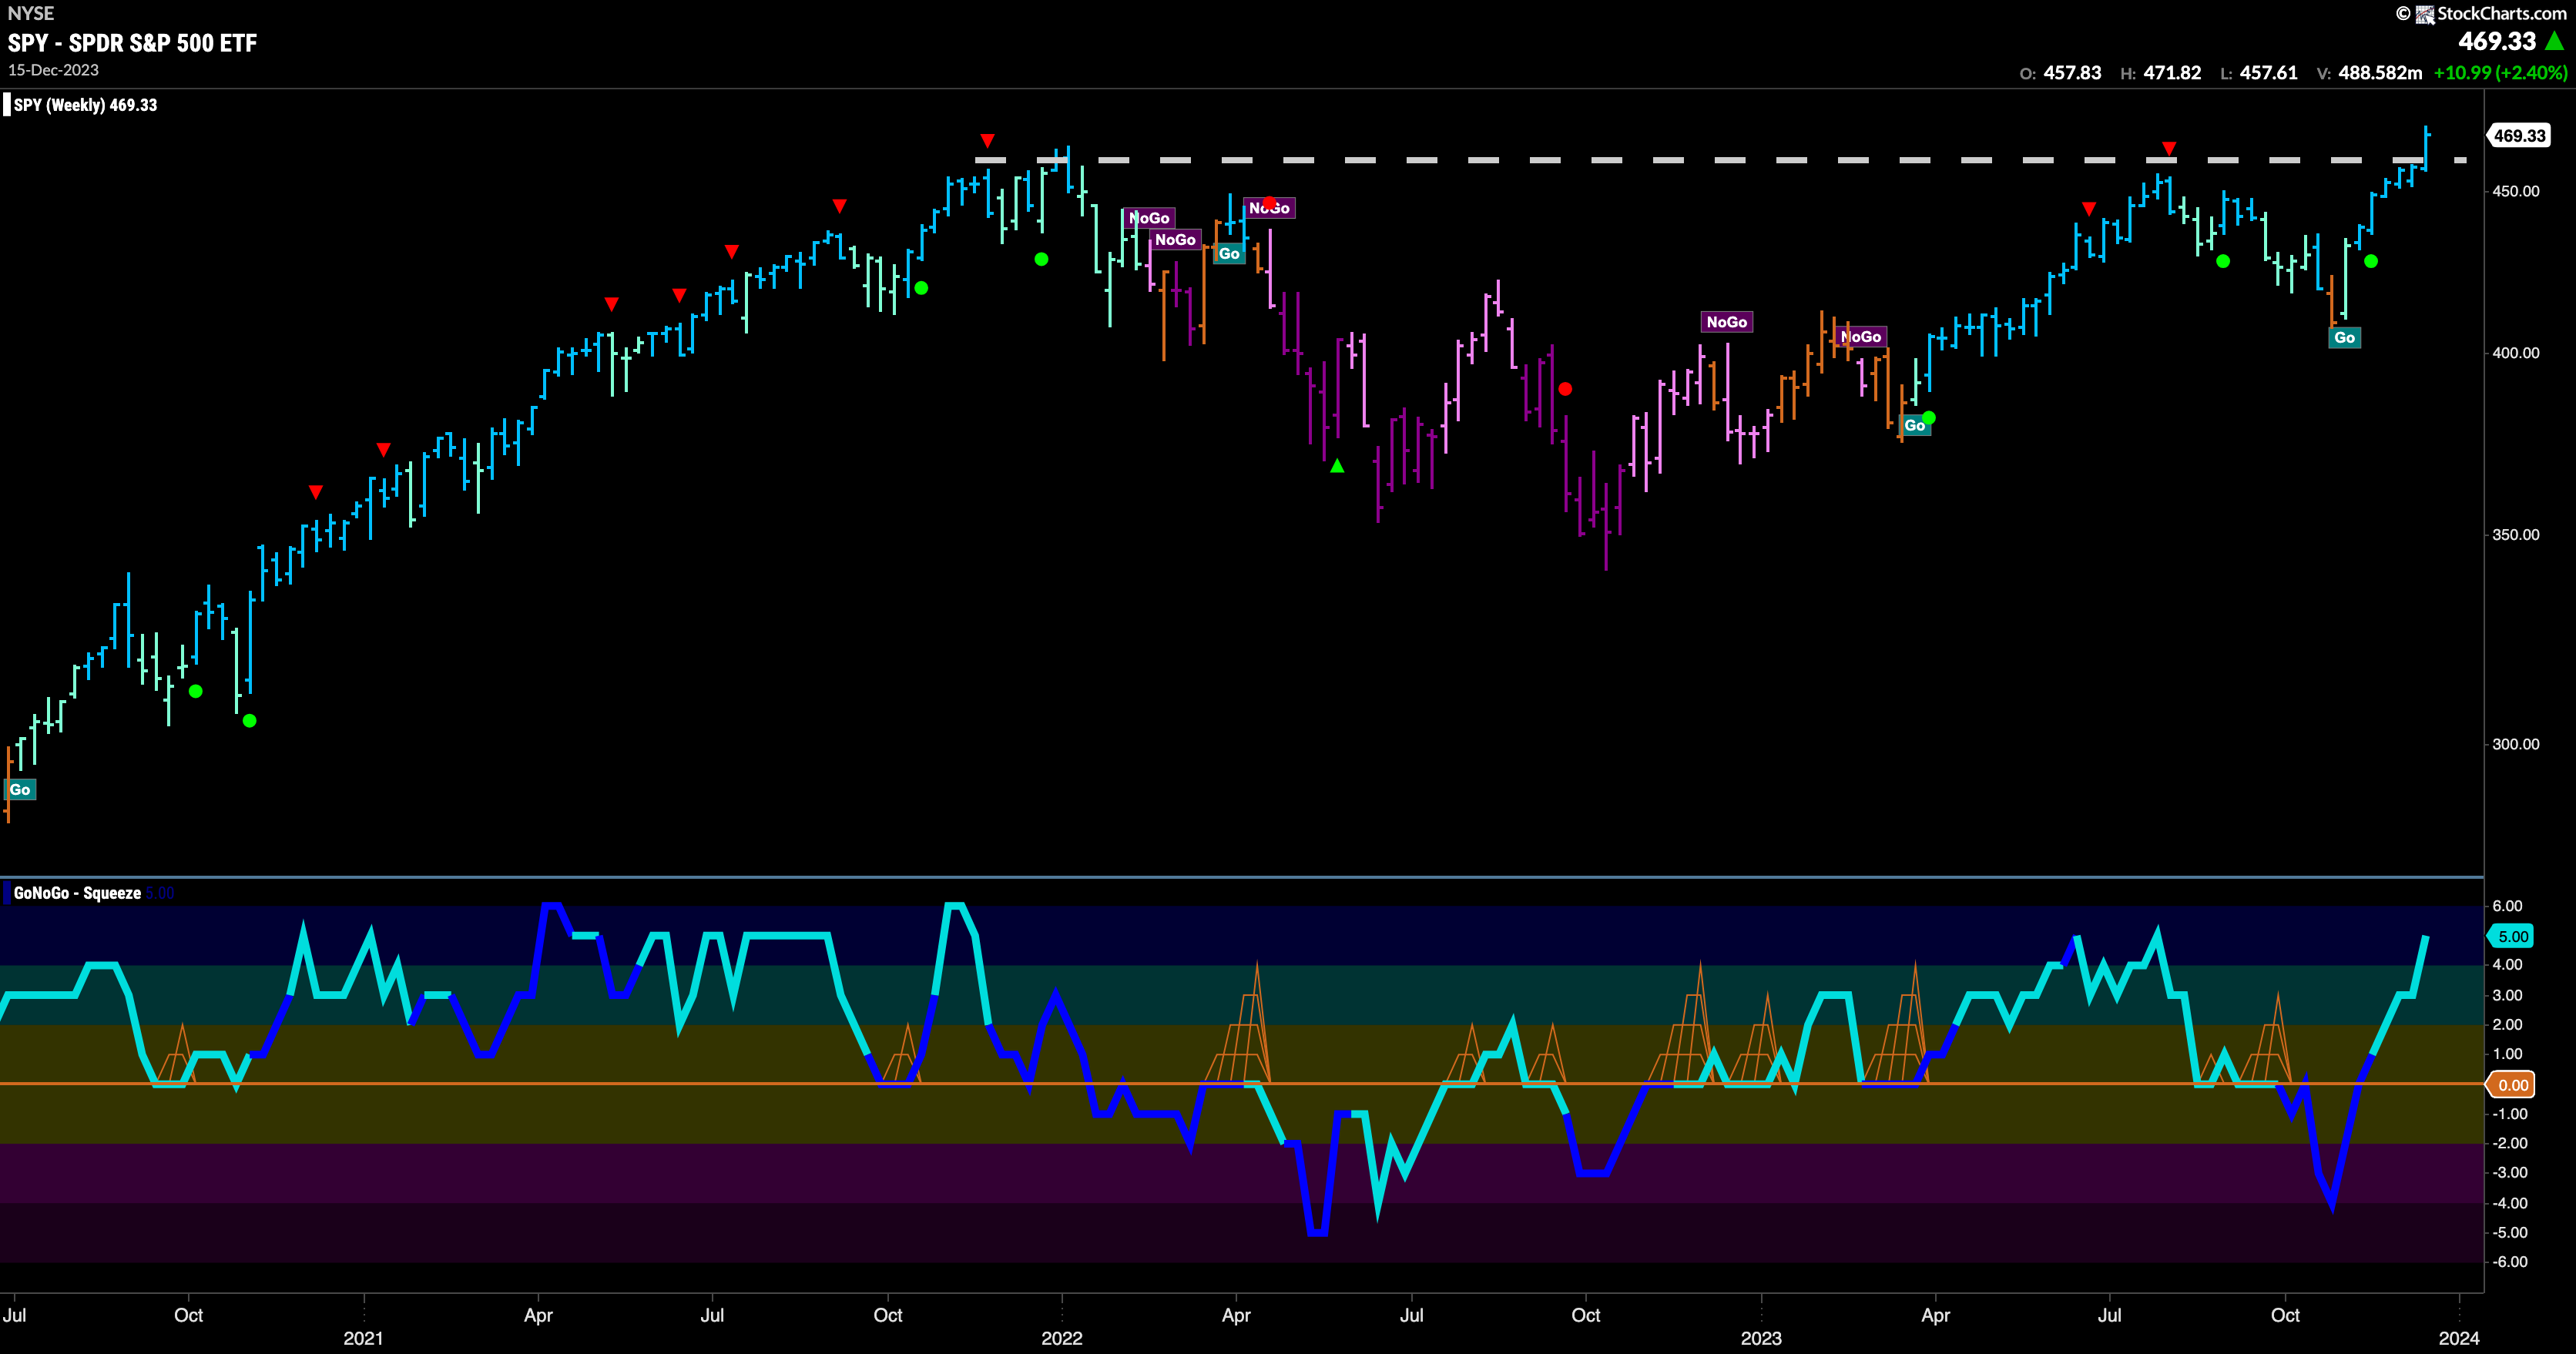
The weekly chart shows just how significant last weeks new high was. The weekly close took out all time highs from a year ago! We can see that after the deep correction we saw a few months ago price rallied sharply and there was no slowing down on its way to breaking above prior high resistance. Now that GoNoGo Oscillator is in overbought territory we will watch to see if price can continue to move higher or if there is any consolidation or pull back from these new highs.
Treasury Rates Sink Lower Still
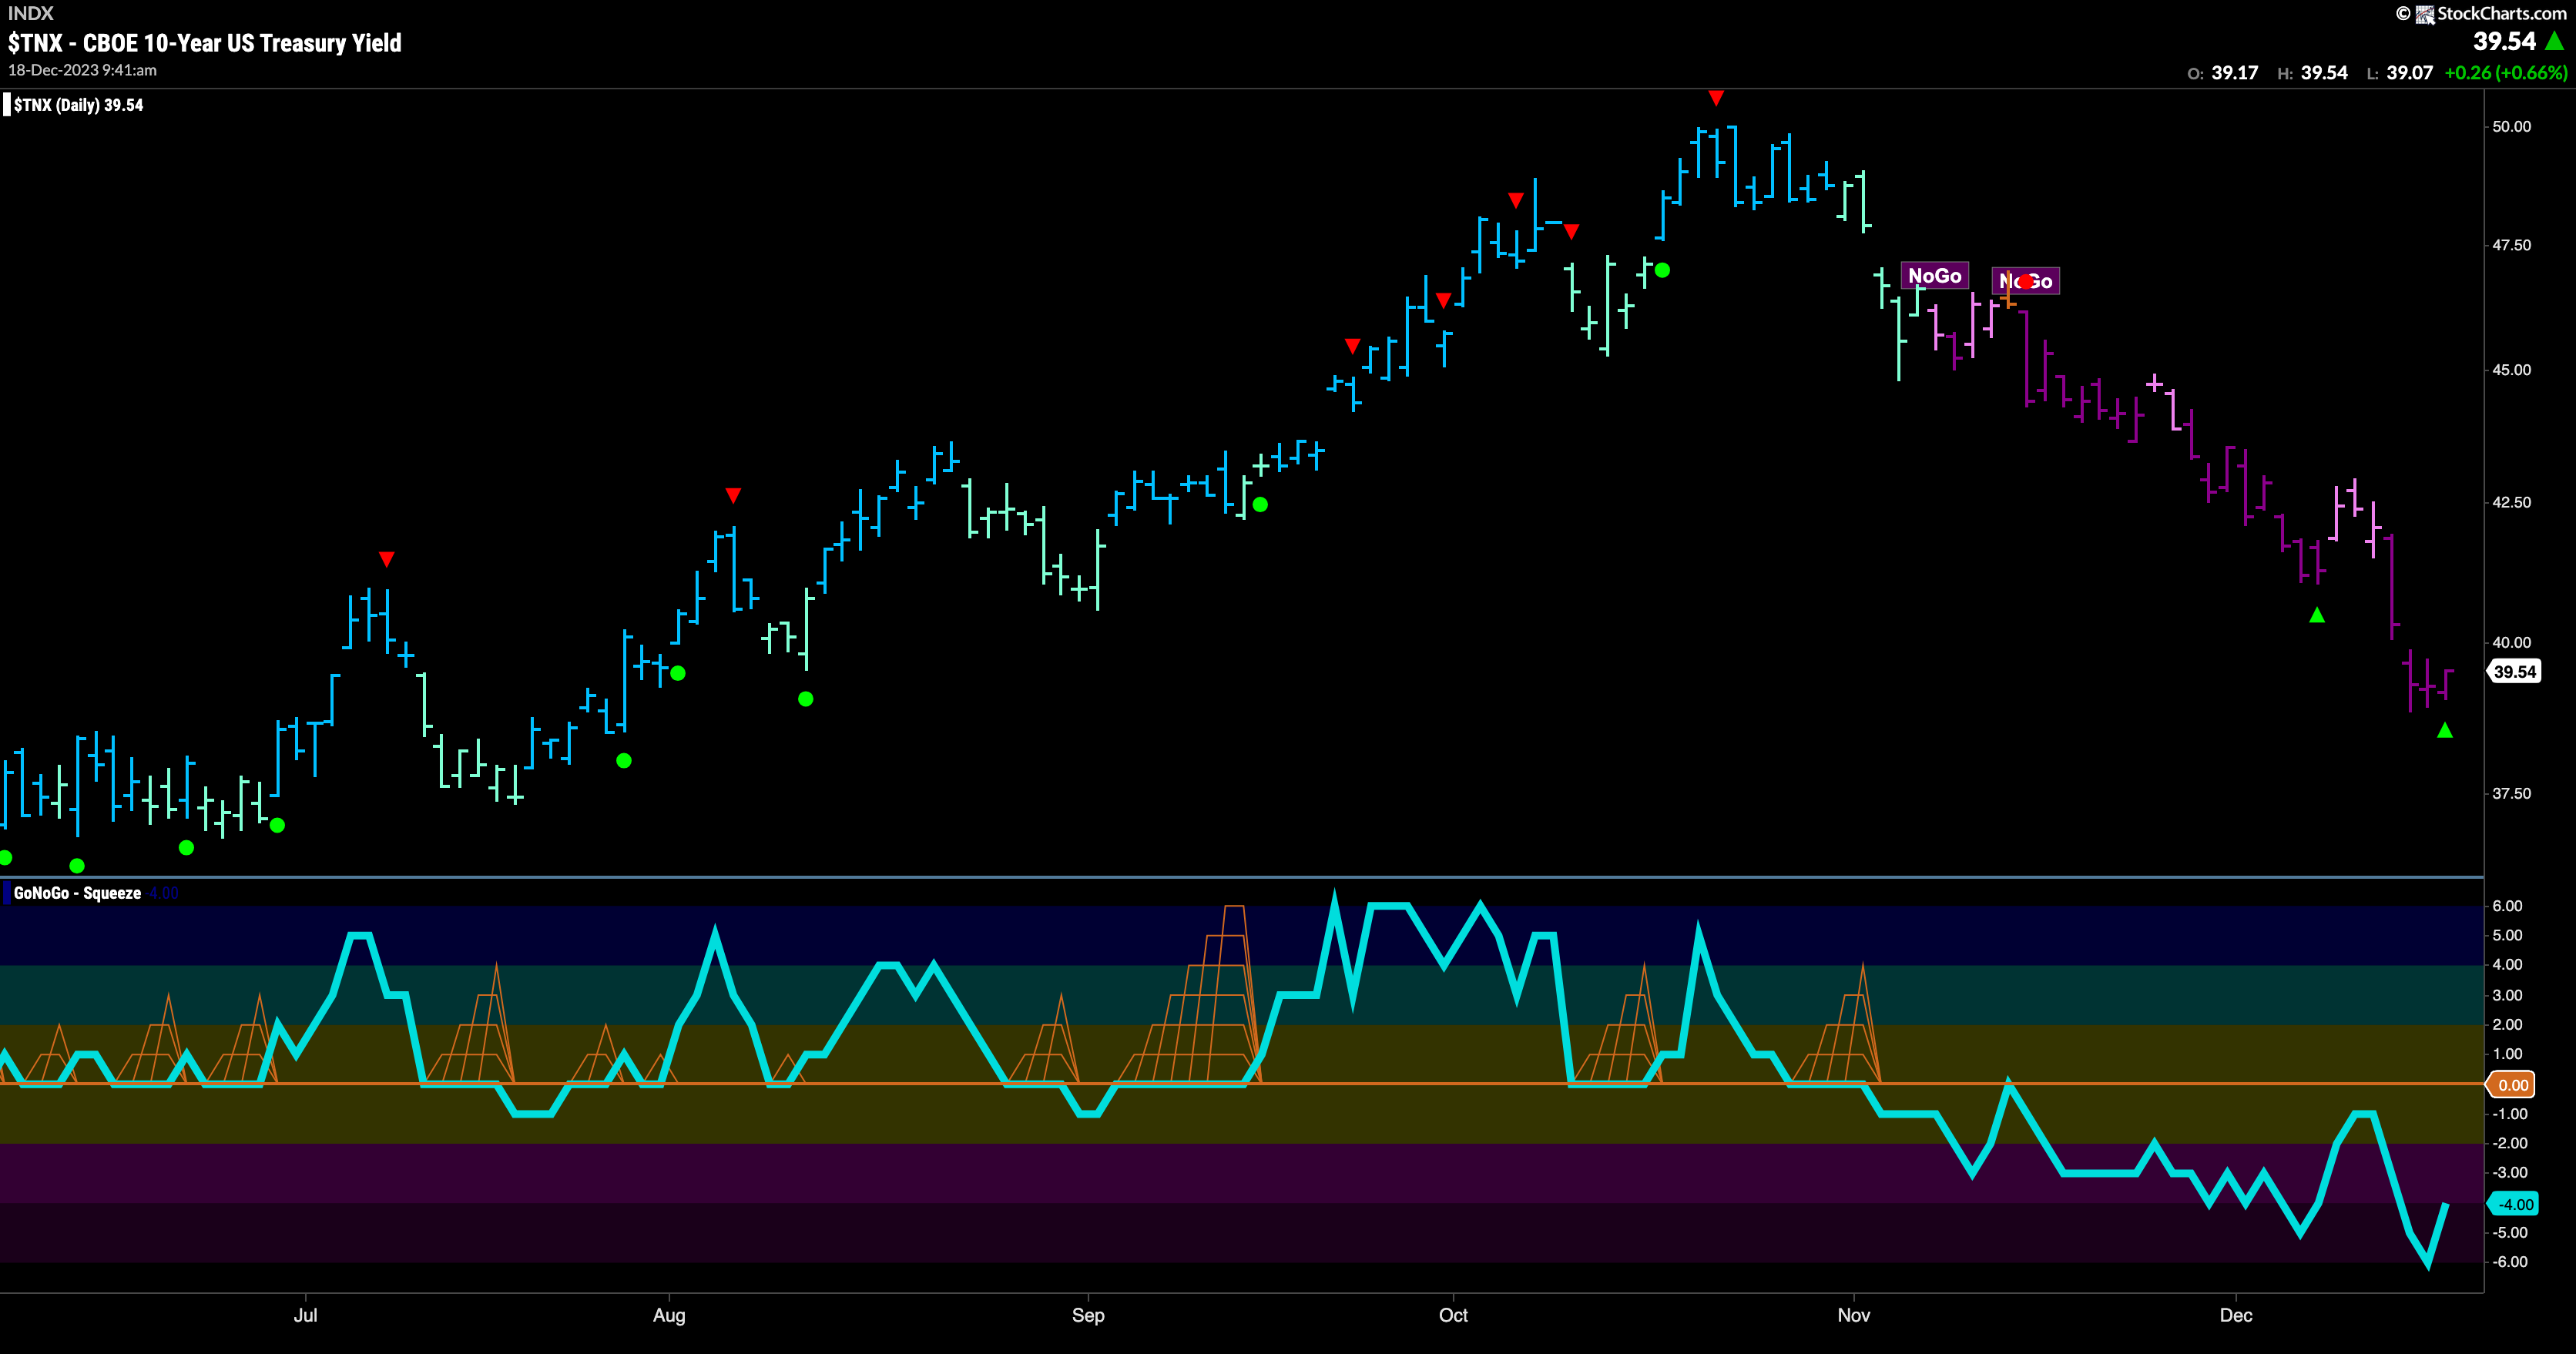
The “NoGo” trend continues in rates and again we saw a new lower low. Strong purple “NoGo” bars dominated the week and falling rates of course can provide a tailwind for equities. GoNoGo Oscillator got close to the zero line at the end of last week but quickly rolled over confirming for us that momentum well and truly sat on the side of the “NoGo” trend. Now, with momentum in negative territory but no longer oversold, we will watch to see if price finds some reason to pause here or if it falls further.
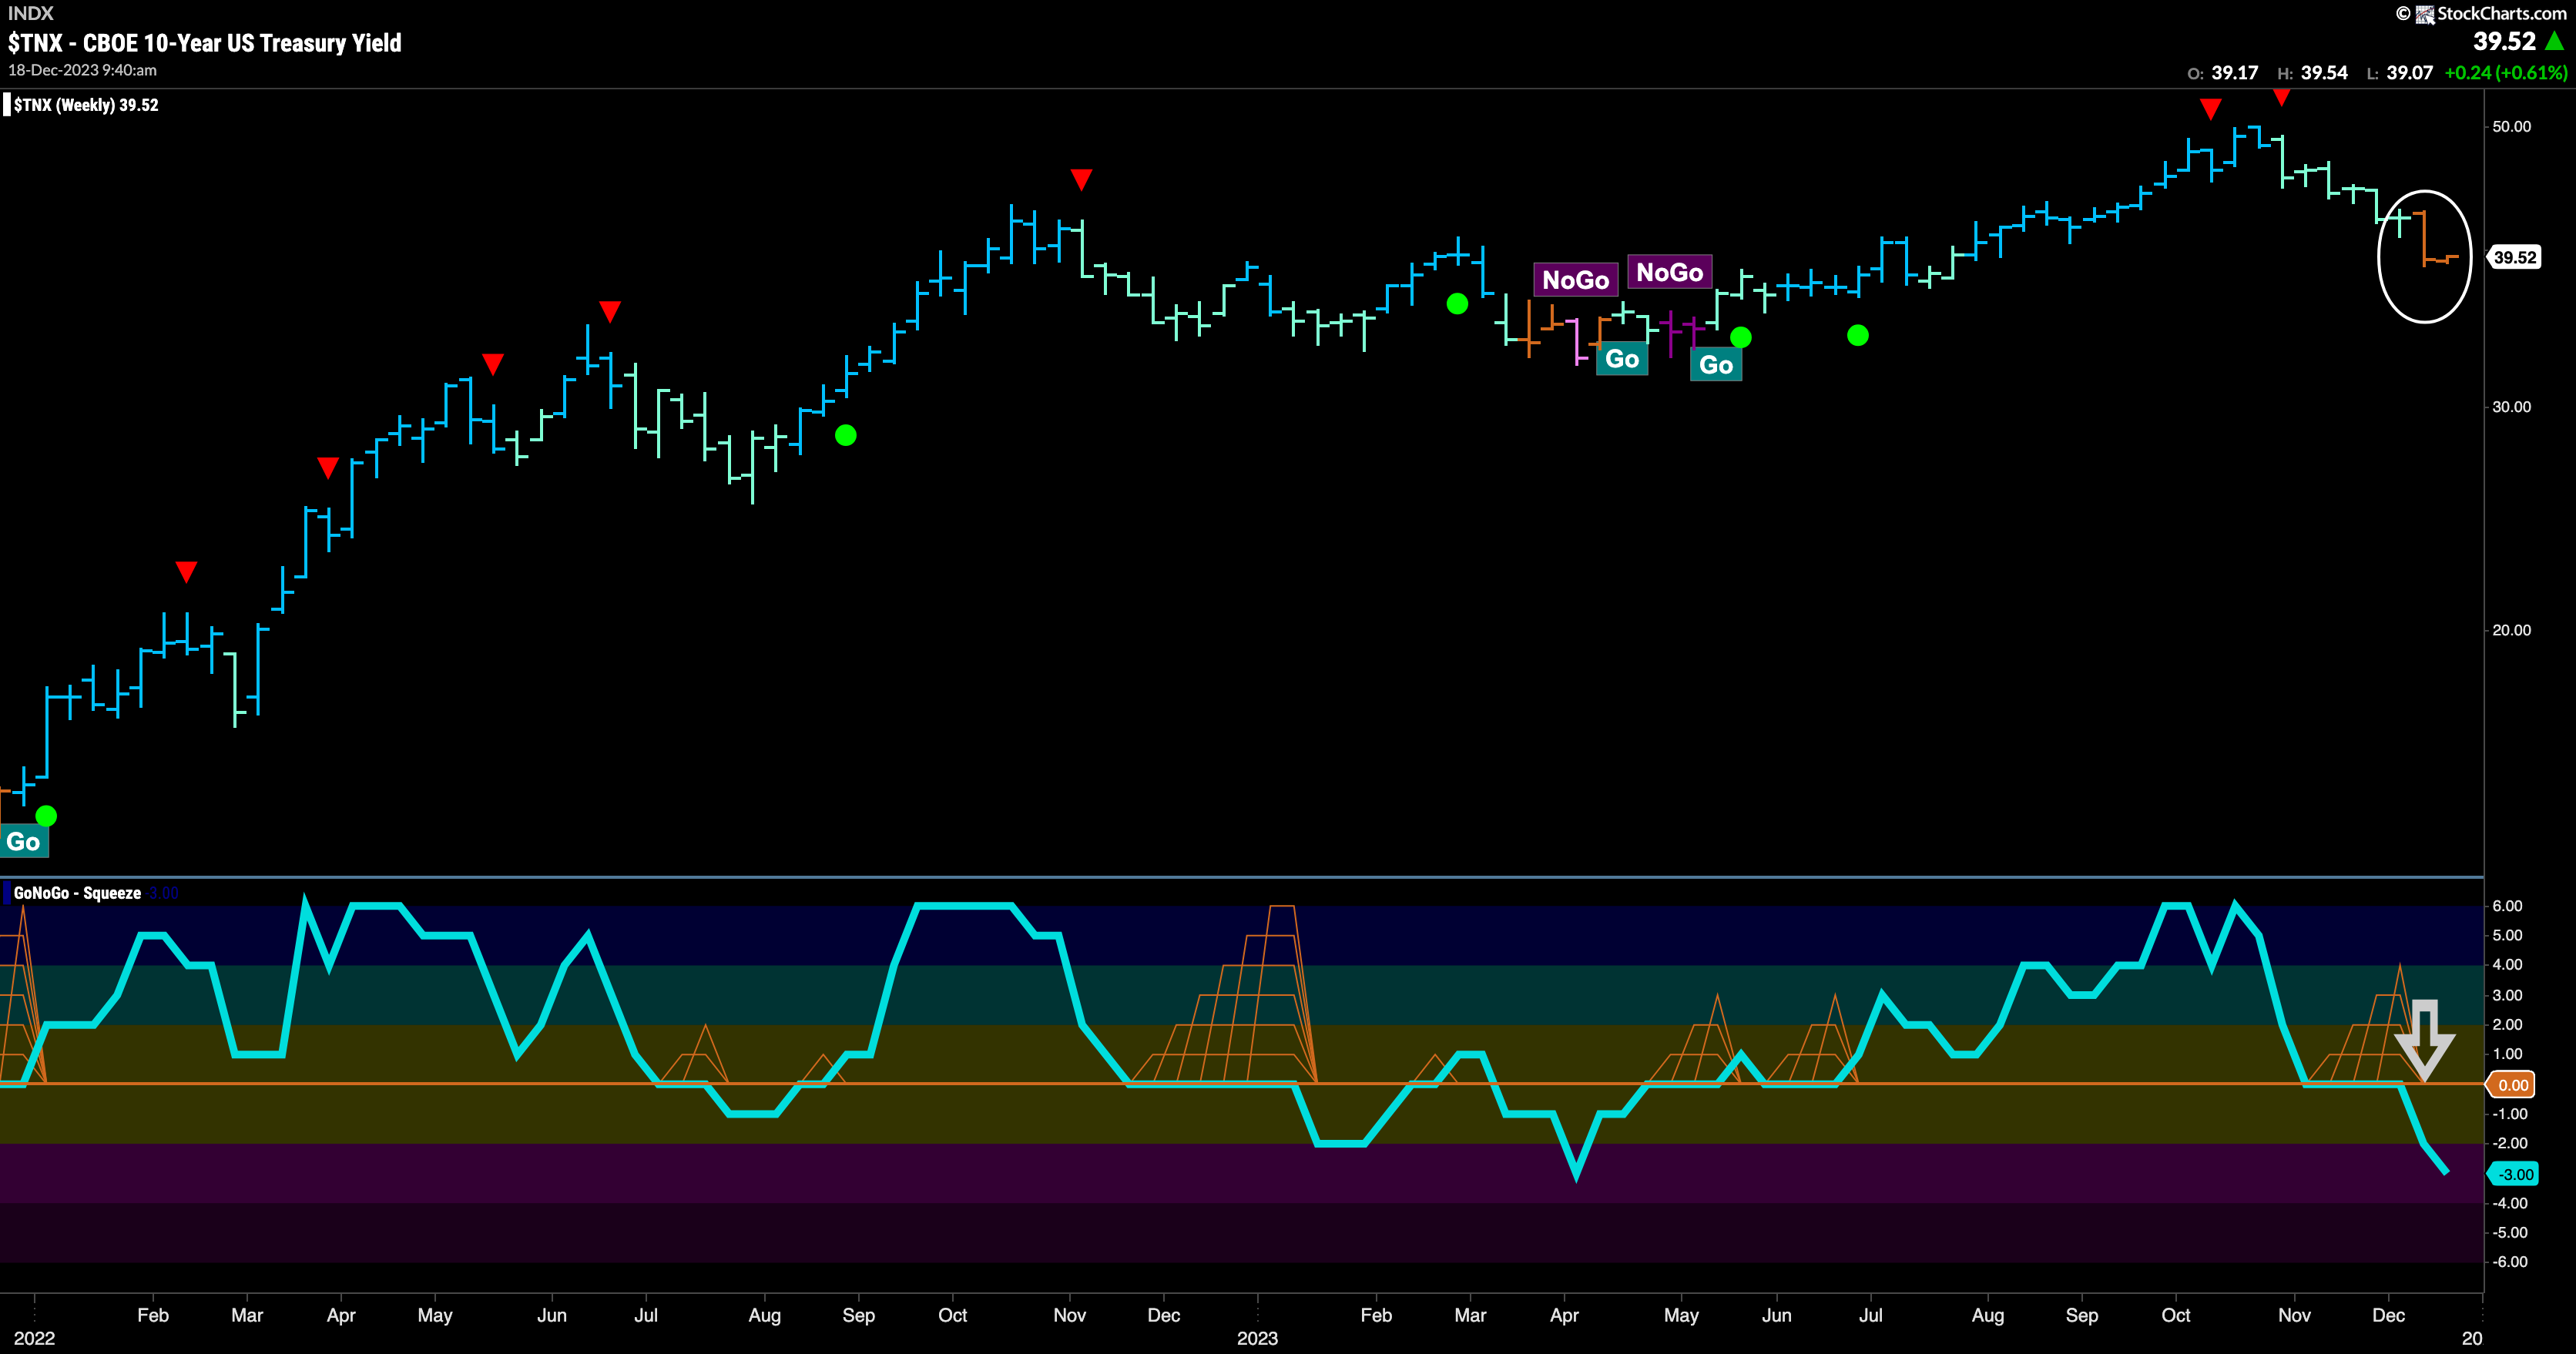
The larger timeframe chart shows a change in trend. No longer painting “Go” colors, GoNoGo Trend paints amber “Go Fish” bars. This tells us that even on the weekly chart the market is unsure of the health of the elevated prices in rates. GoNoGo Oscillator has crashed out of a small GoNoGo Squeeze into negative territory and so it seems price may have further to fall from here. We will watch to see if GoNoGo Trend identifies a new “NoGo” this week.
Uncertainty and New “NoGo” for Weekly Dollar Chart
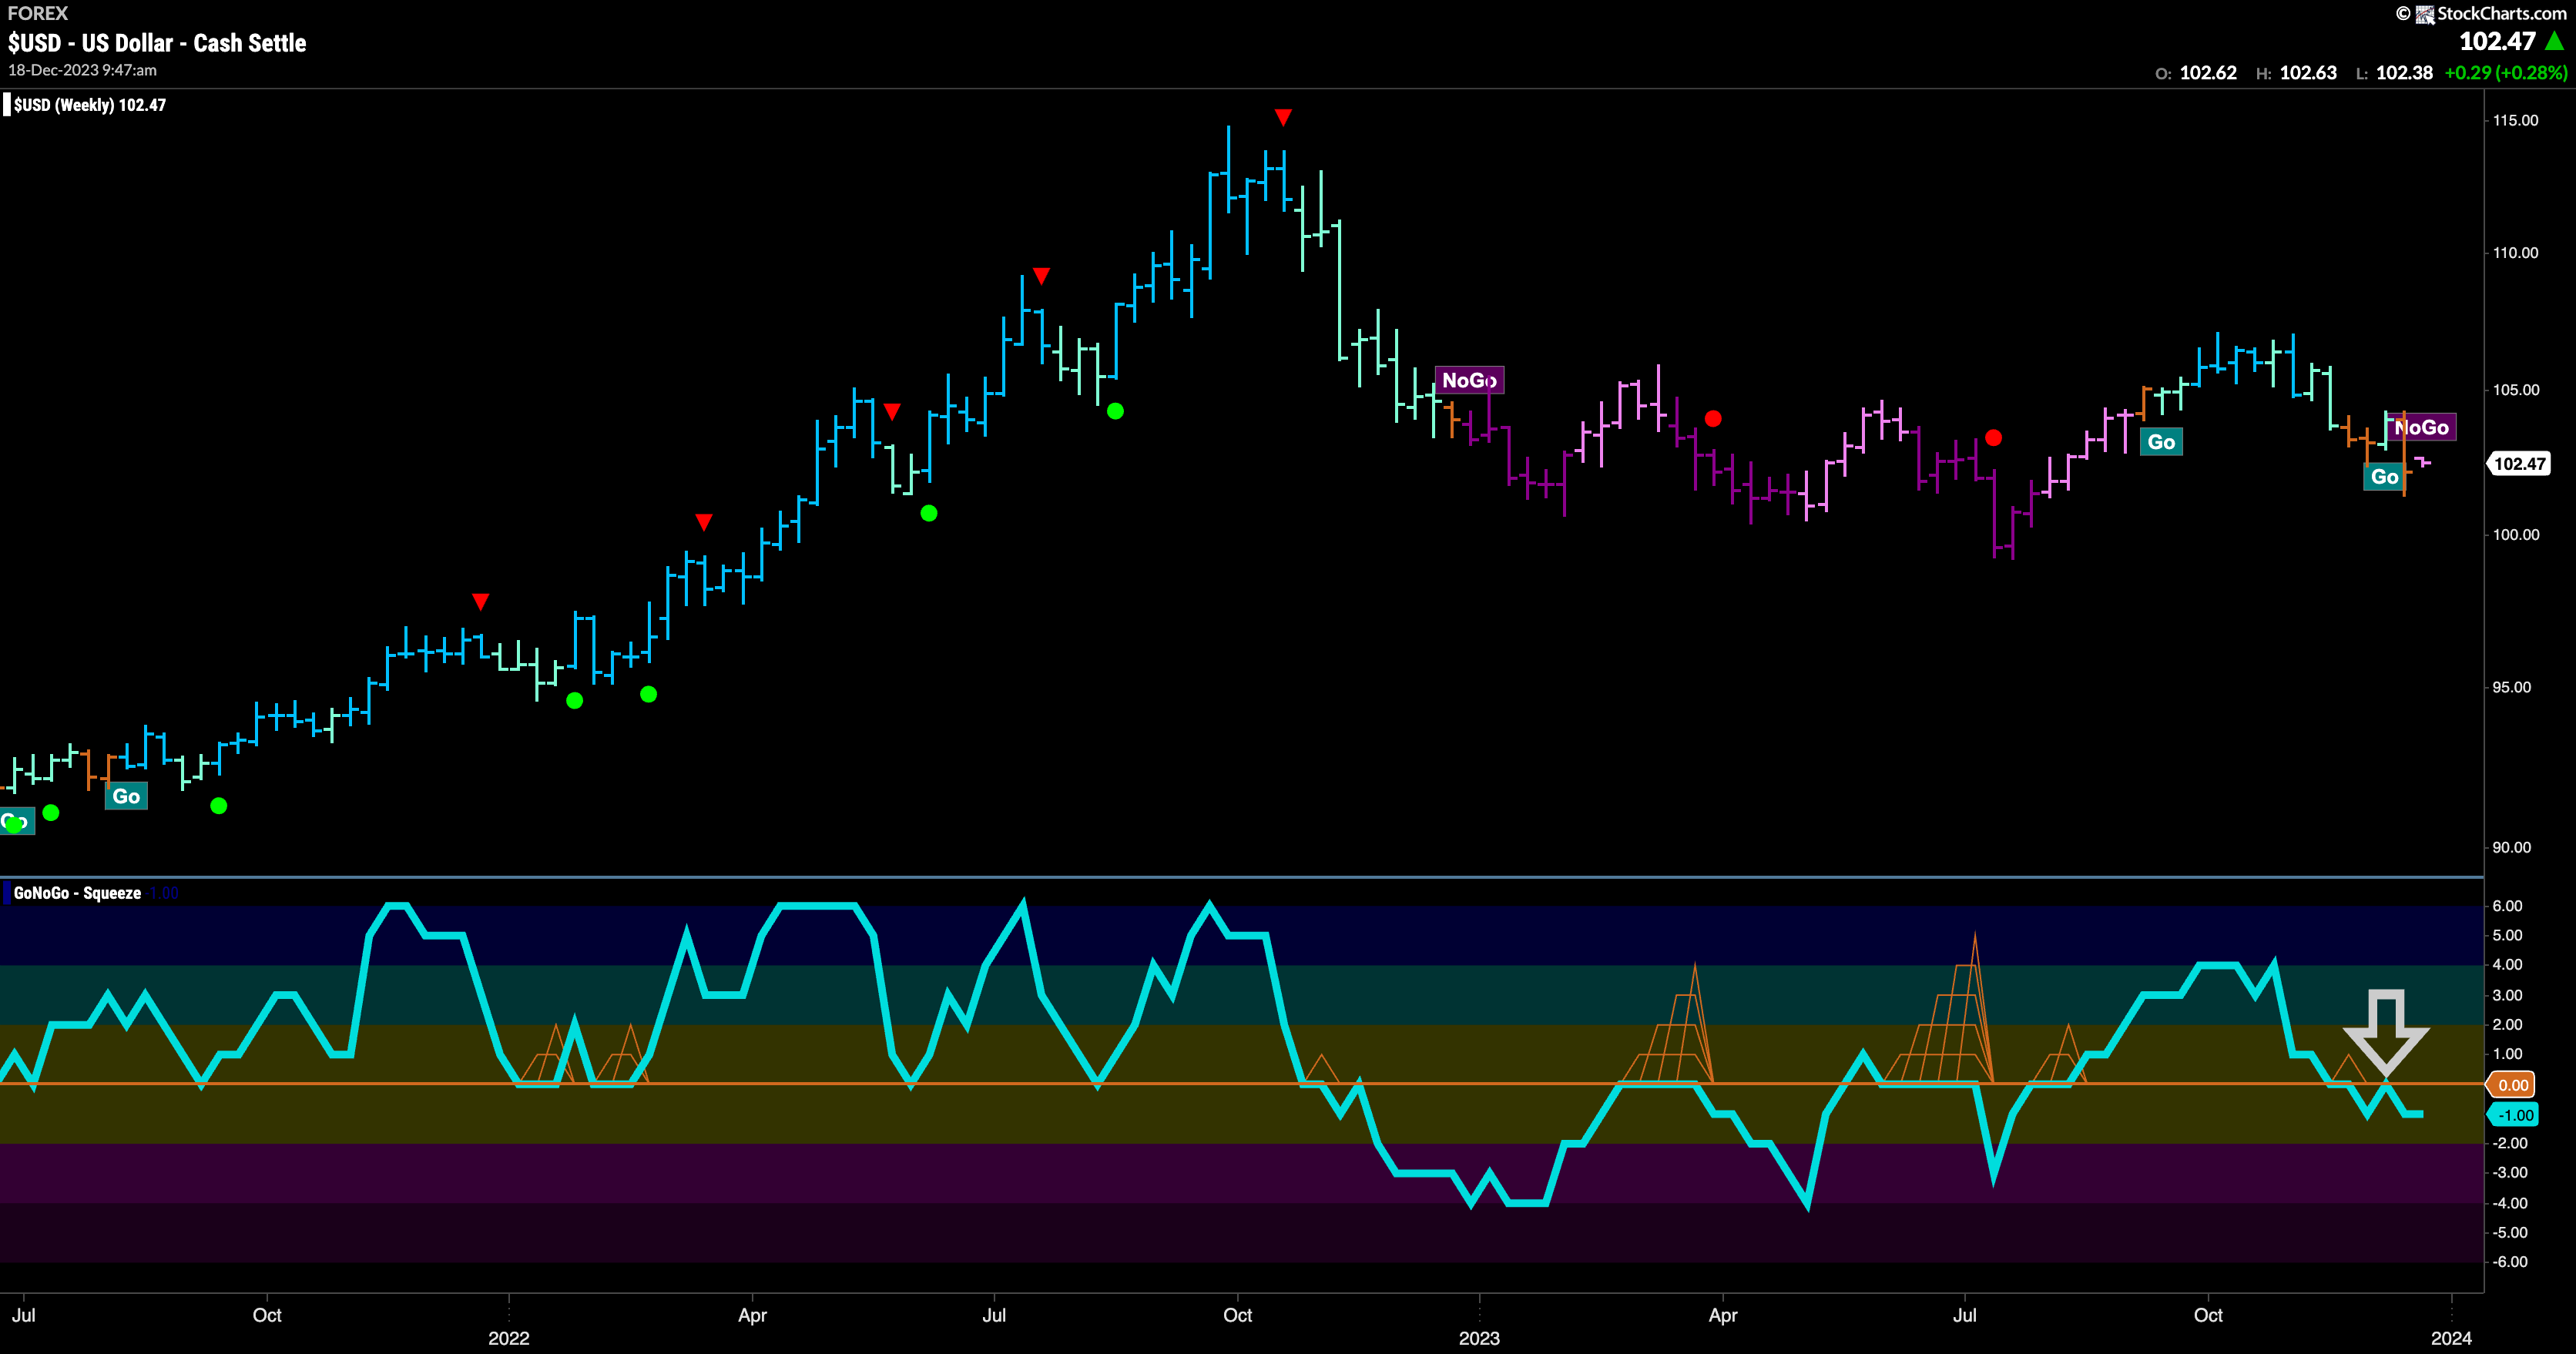
Using $USD as the ticker for the U.S. Dollar cash settle, we can see that price has rolled over and GoNoGo Trend has returned to a “NoGo” after a few bars of uncertainty represented by amber “Go Fish” bars. Turning our eye to the lower panel we can see that GoNoGo Oscillator fell below the zero line during this period of uncertainty and has quickly retested that level and found resistance there. Now, with a “NoGo” pink bar painting price and momentum in negative territory, we can say that price and momentum are in line.
The daily chart below shows how quickly price rolled over after having rallied for a few weeks. GoNoGo Oscillator spent a week at the zero line allowing a GoNoGo Squeeze to build but it was decisively broken into negative territory as price reversed lower. This week saw a new lower low in price and GoNoGo Oscillator is now firmly entrenched in negative territory.

Oil Rallies off Latest Lows
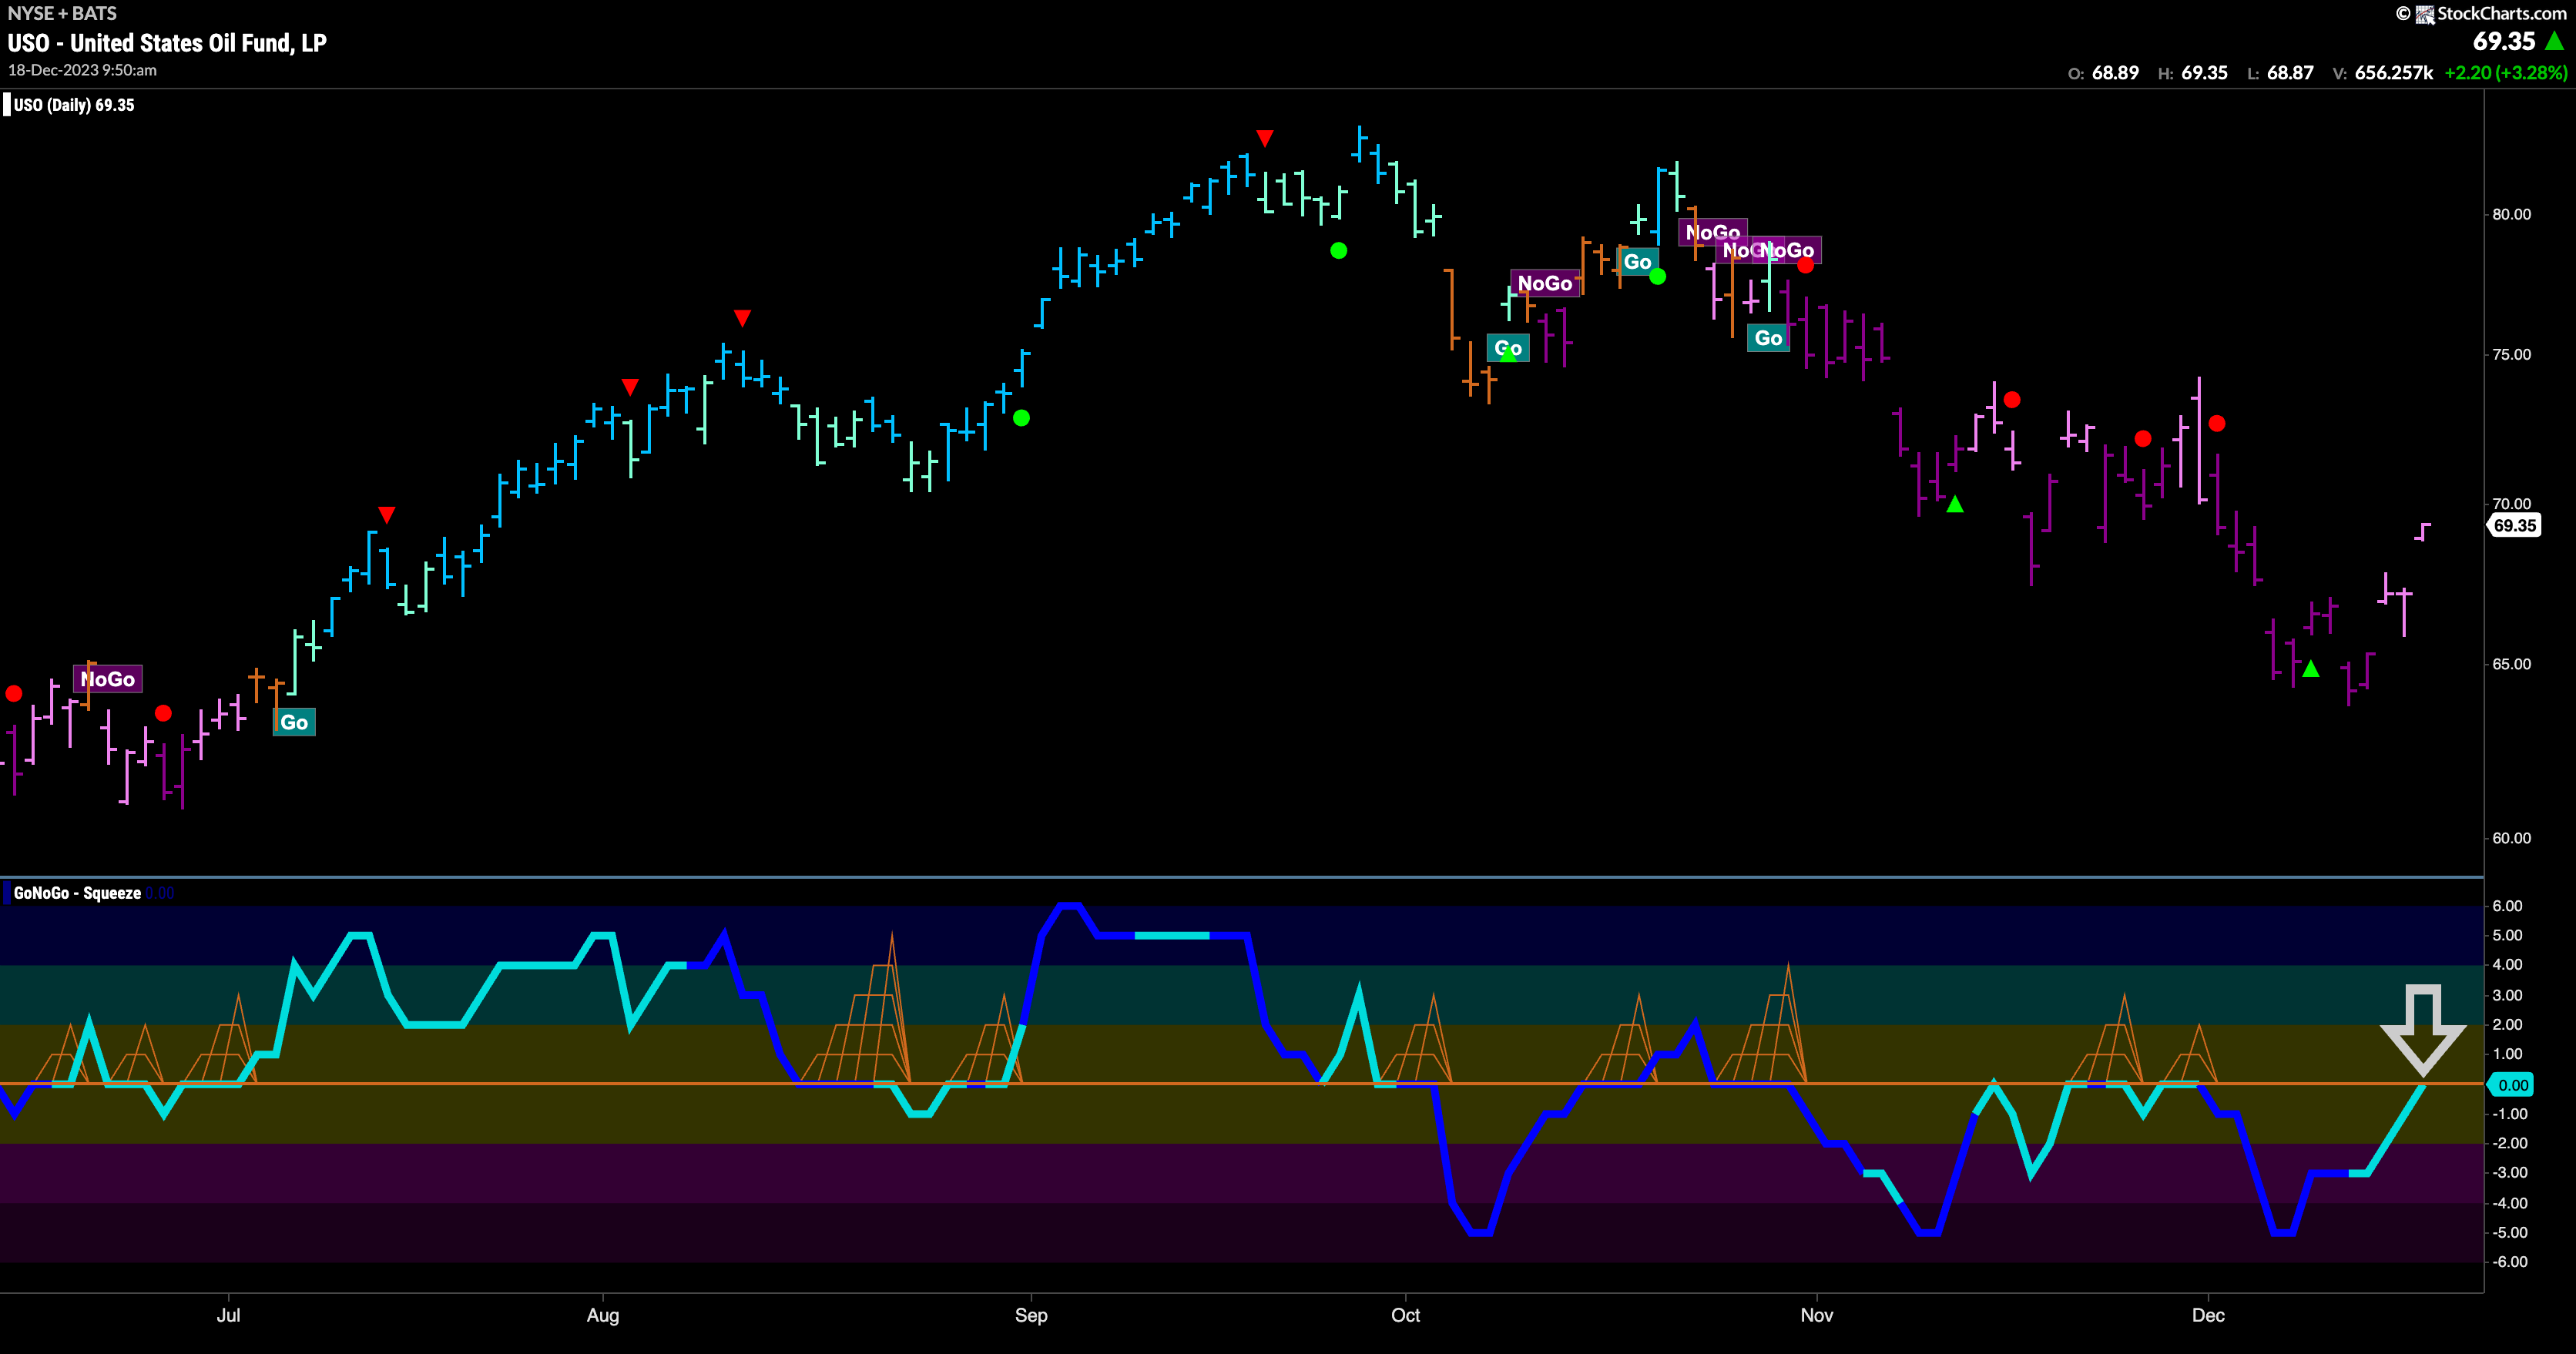
After hitting a new low price rallied last week. GoNoGo Trend reflected that by painting weaker pink “NoGo” bars over the second half of the week. While the weight of the evidence still tells us that the trend is a “NoGo”, we will turn our eye to the oscillator panel where GoNoGo Oscillator is testing the zero line from below. If this “NoGo” trend is to continue we will watch to see if it gets rejected here. If the oscillator gets turned away by the zero line then we will look for trend continuation and price to struggle again. If the oscillator can move into positive territory then this would signal potential for further rally and perhaps a move to a new trend.
Gold Sees Renewed Strength
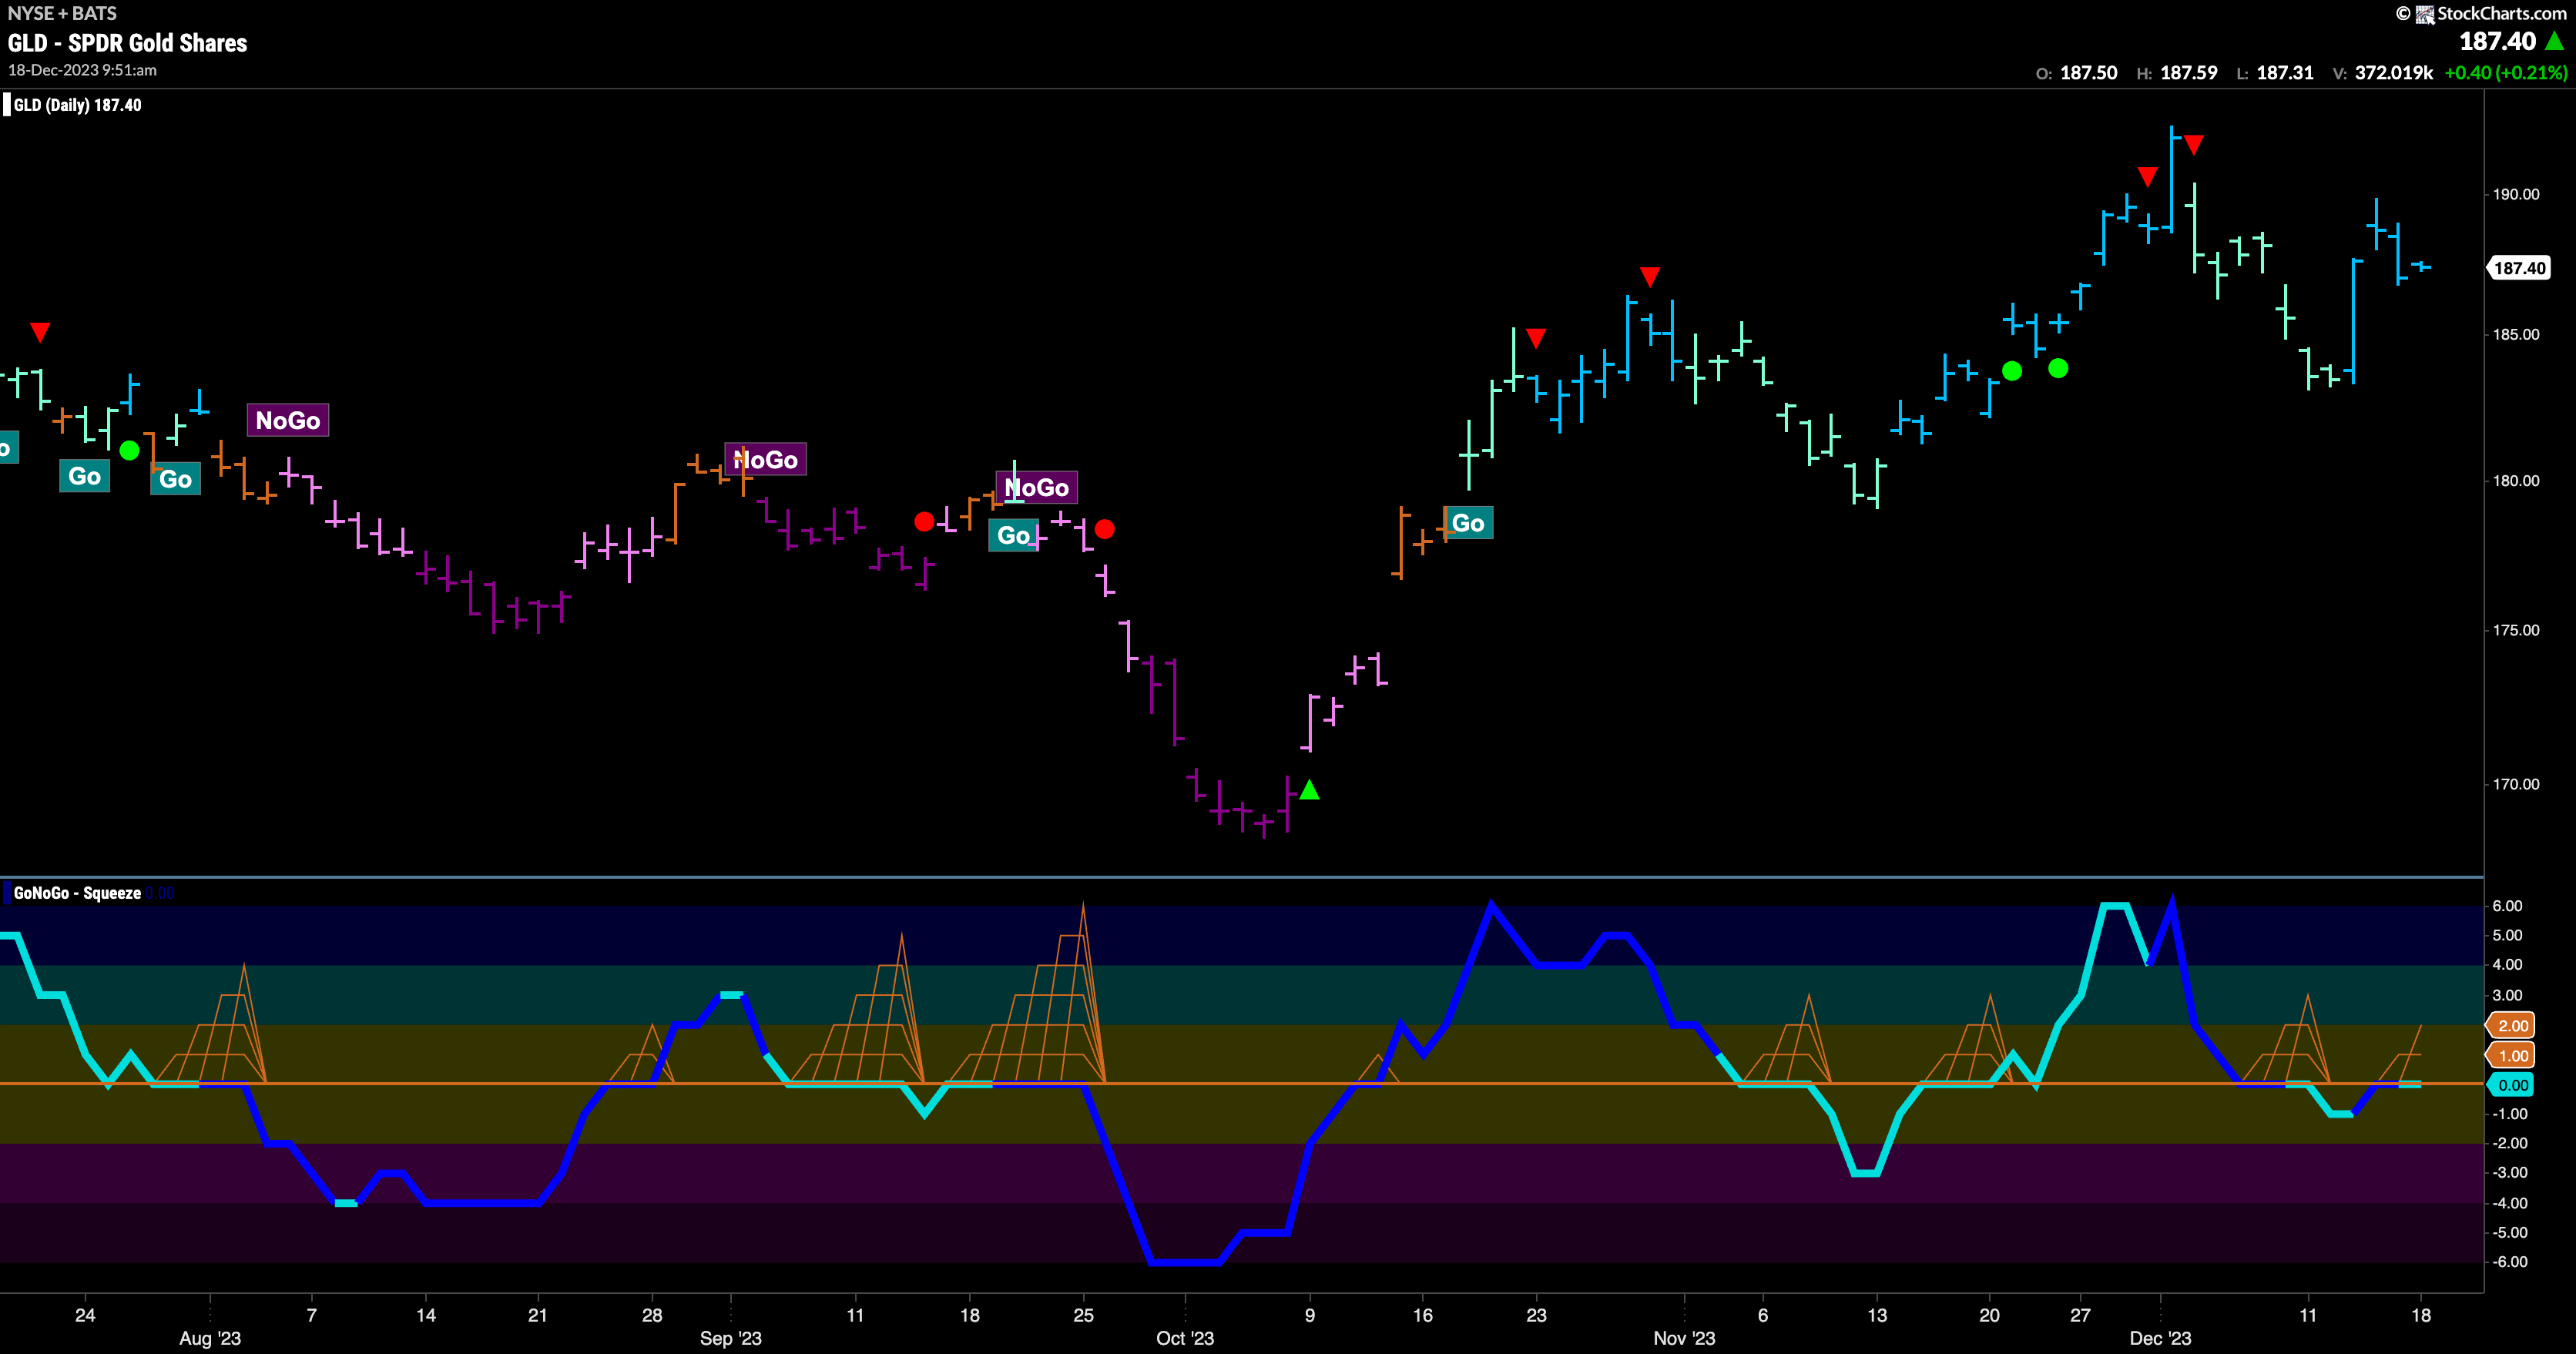
GoNoGo Trend painted mostly strong blue “Go” bars this week as price seems to have set a higher low. We do not have a higher high yet and that will be important if we are to see the trend continue. Importantly, GoNoGo Oscillator was able to regain the zero line where we will watch closely to see if it can move back into positive territory. Positive momentum would help as price attempts to set a new higher high.
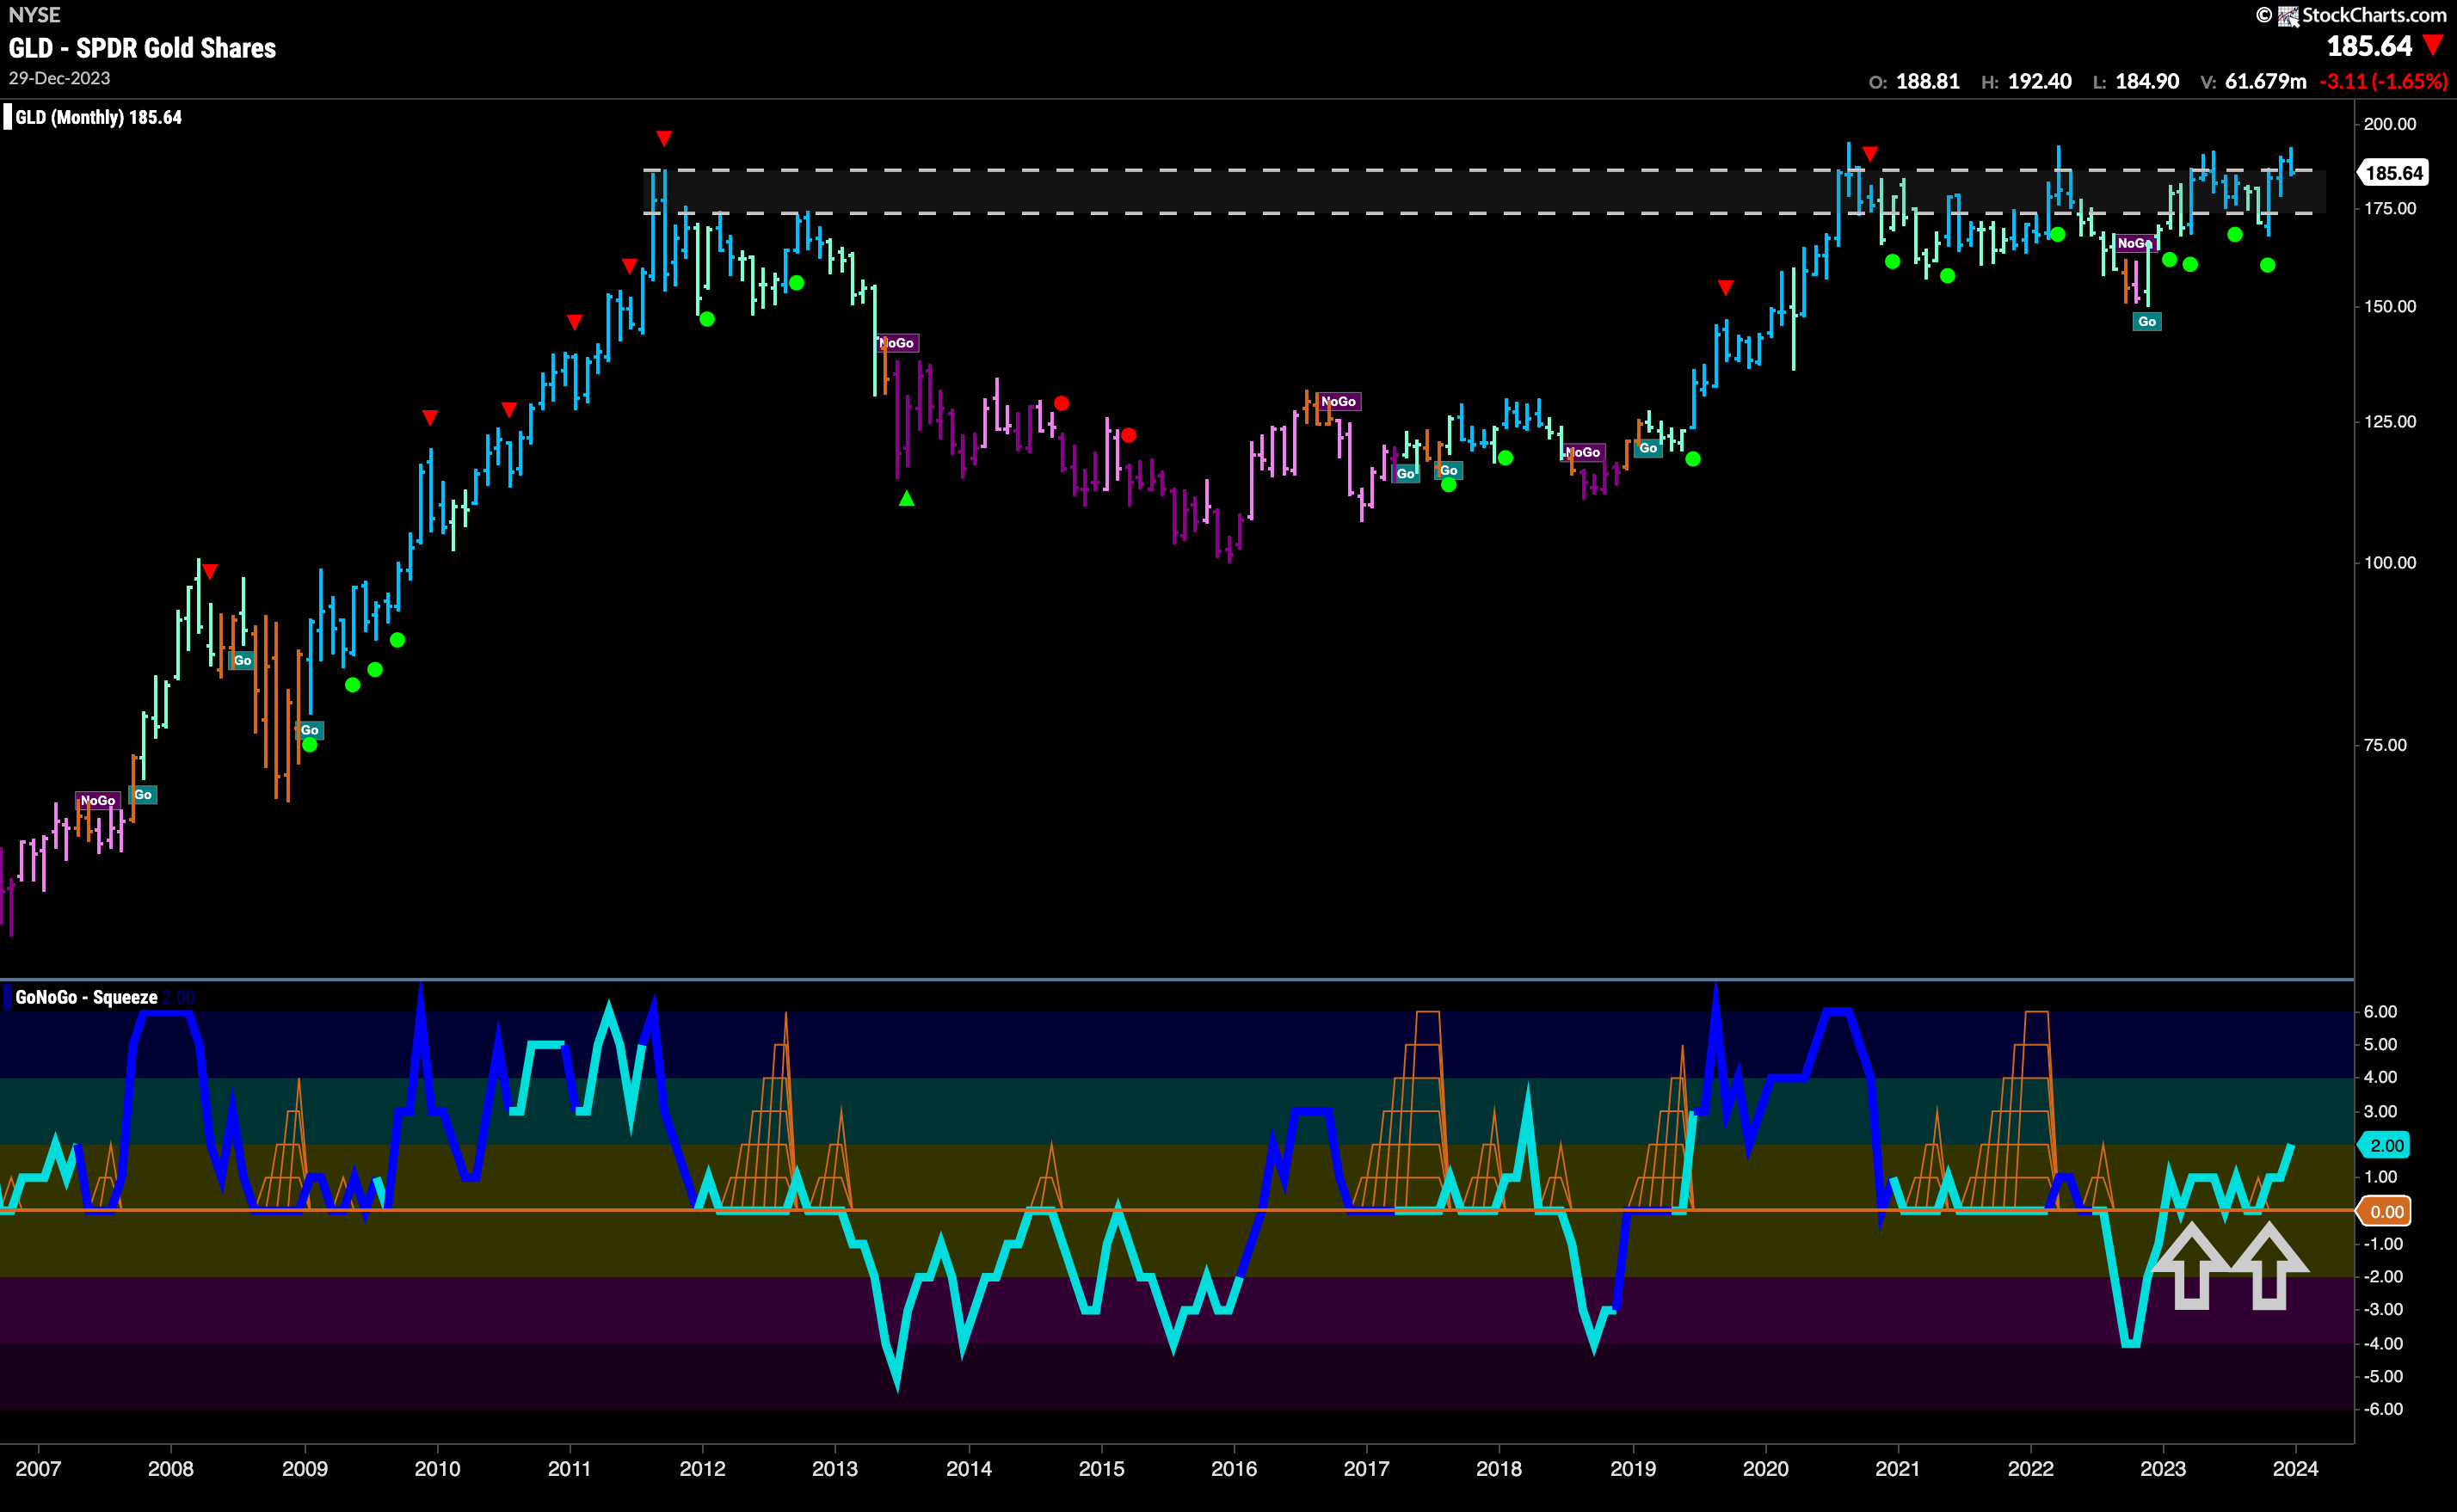
Zooming out to a monthly chart, we can see still how important these levels are. Without a significant increase in price we are stuck in a holding pattern as price struggles with all time highs. Investors are still looking for a monthly close that is a new higher high.
Sector RelMap
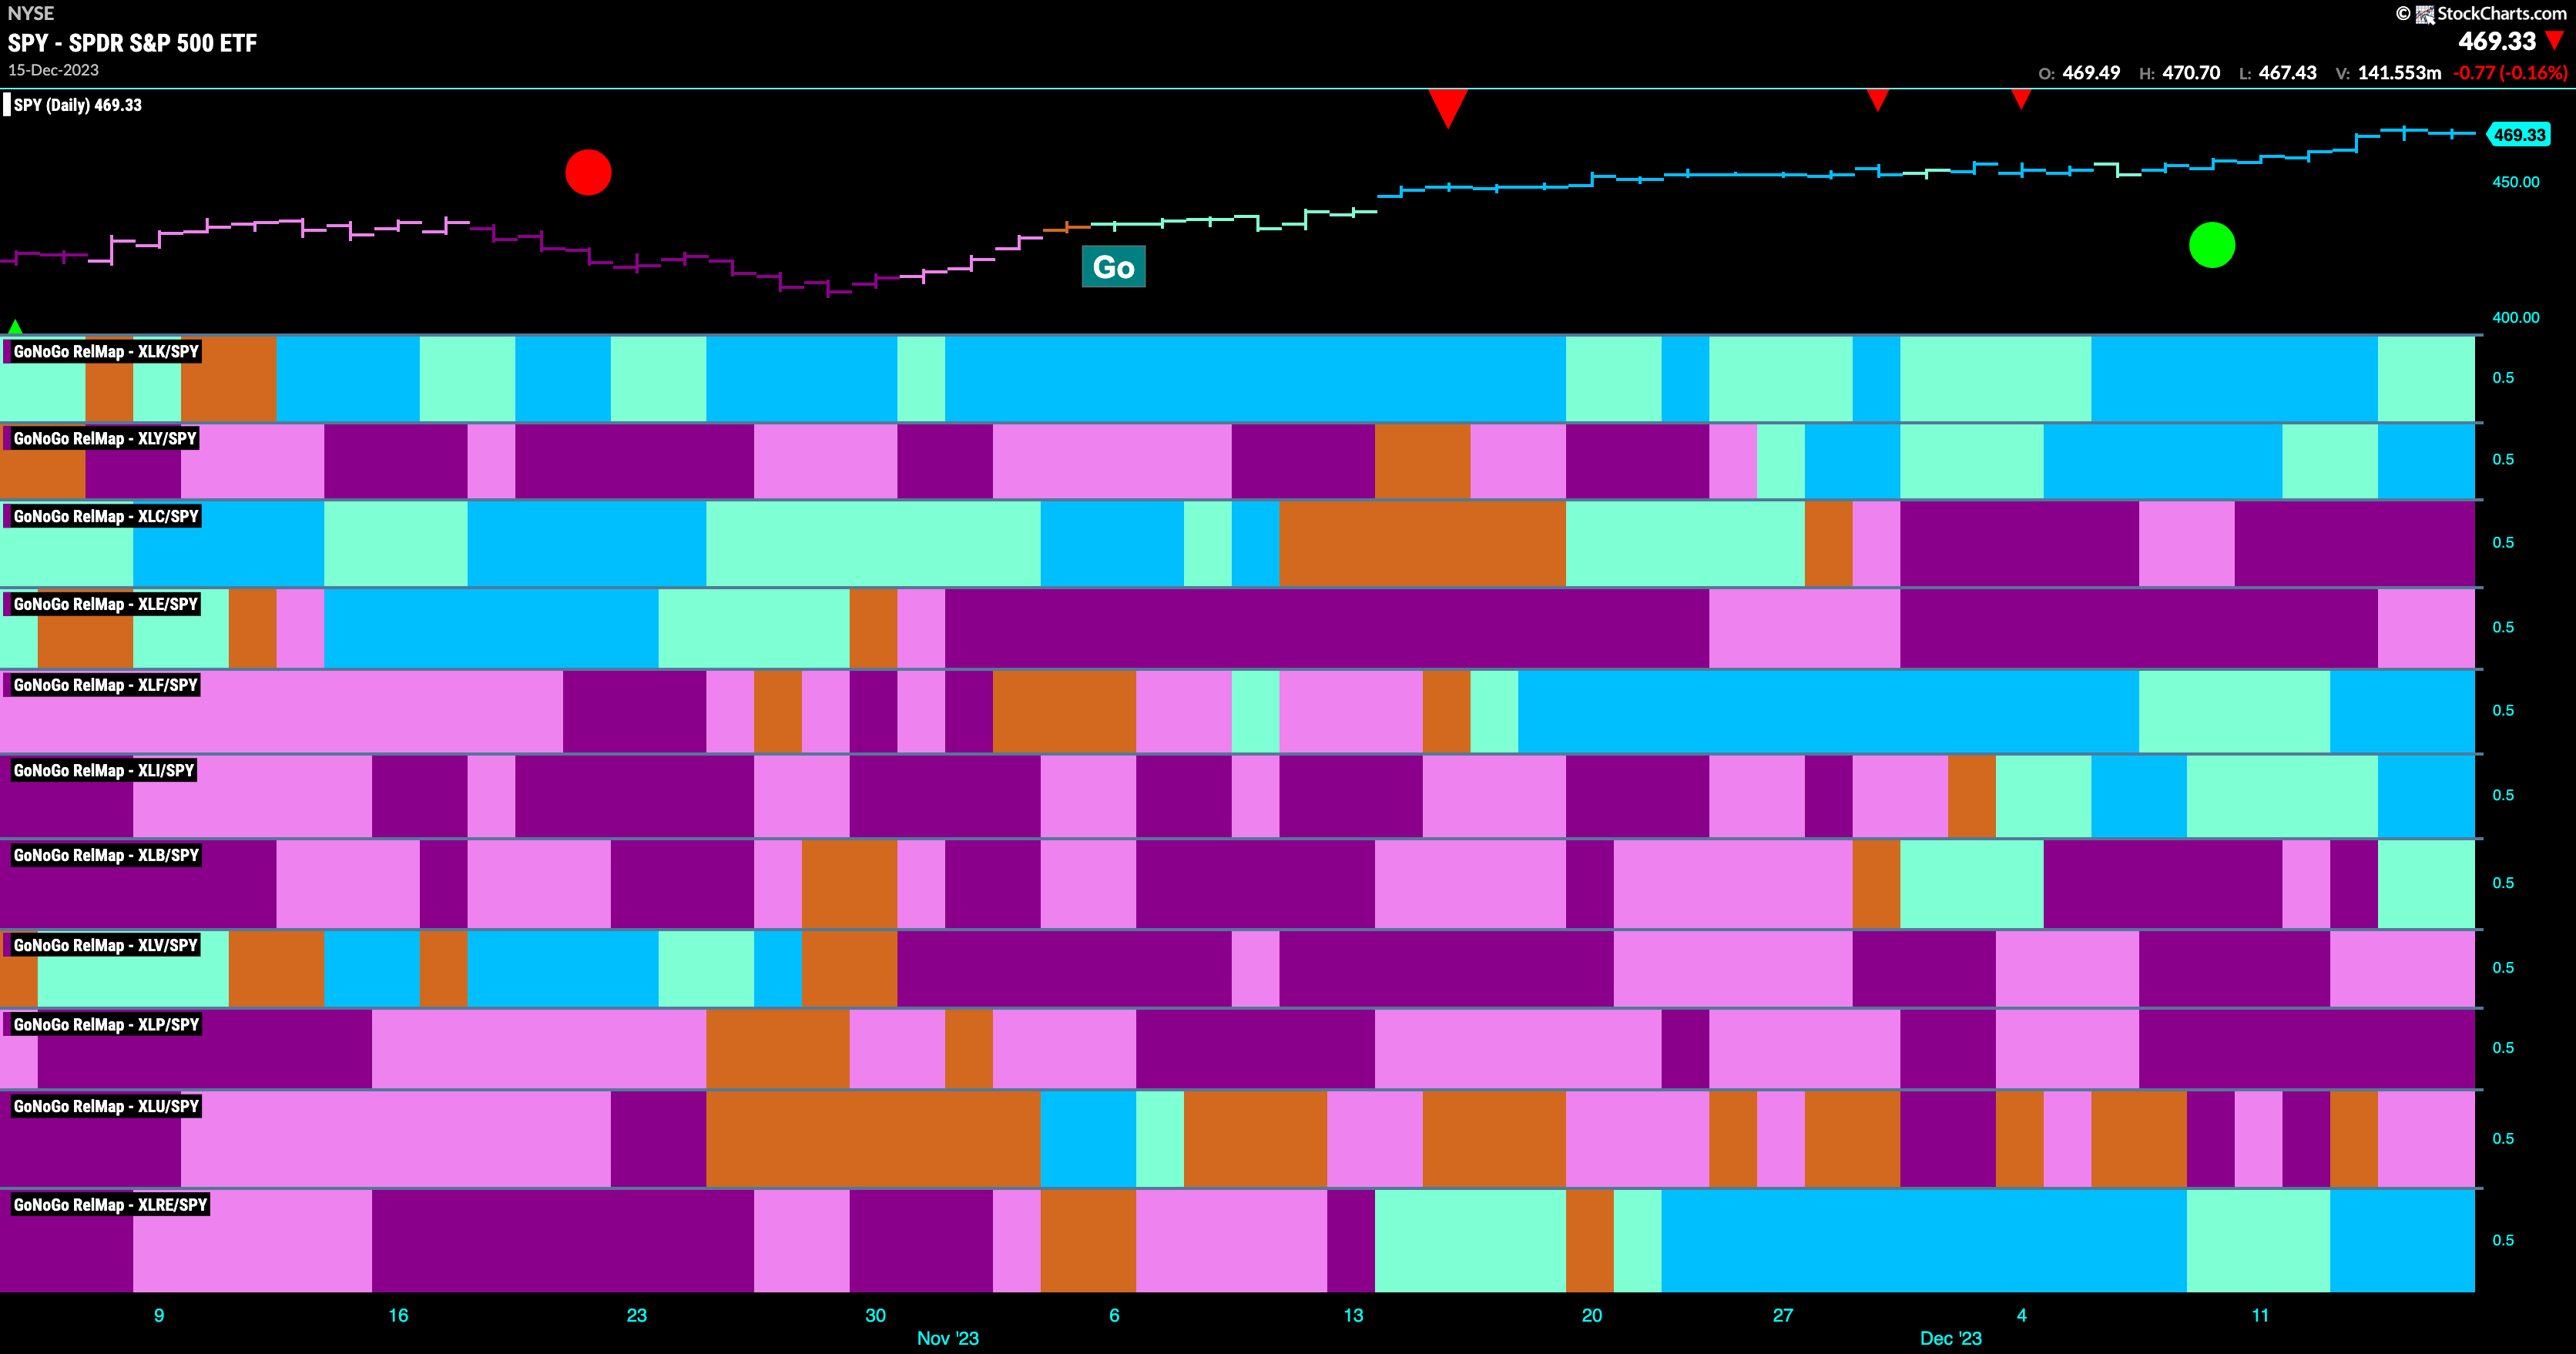
Below is the GoNoGo Sector RelMap. This GoNoGo RelMap applies the GoNoGo Trend to the relative strength ratios of the sectors to the base index. Looking at this map, we can quickly see where the relative outperformance is coming from as well as which sectors are lagging on a relative basis. 6 sectors are outperforming the base index this week. $XLK, $XLY $XLF, $XLI, $XLB, and $XLRE, are painting “Go” bars.
Materials Sub-Group RelMap
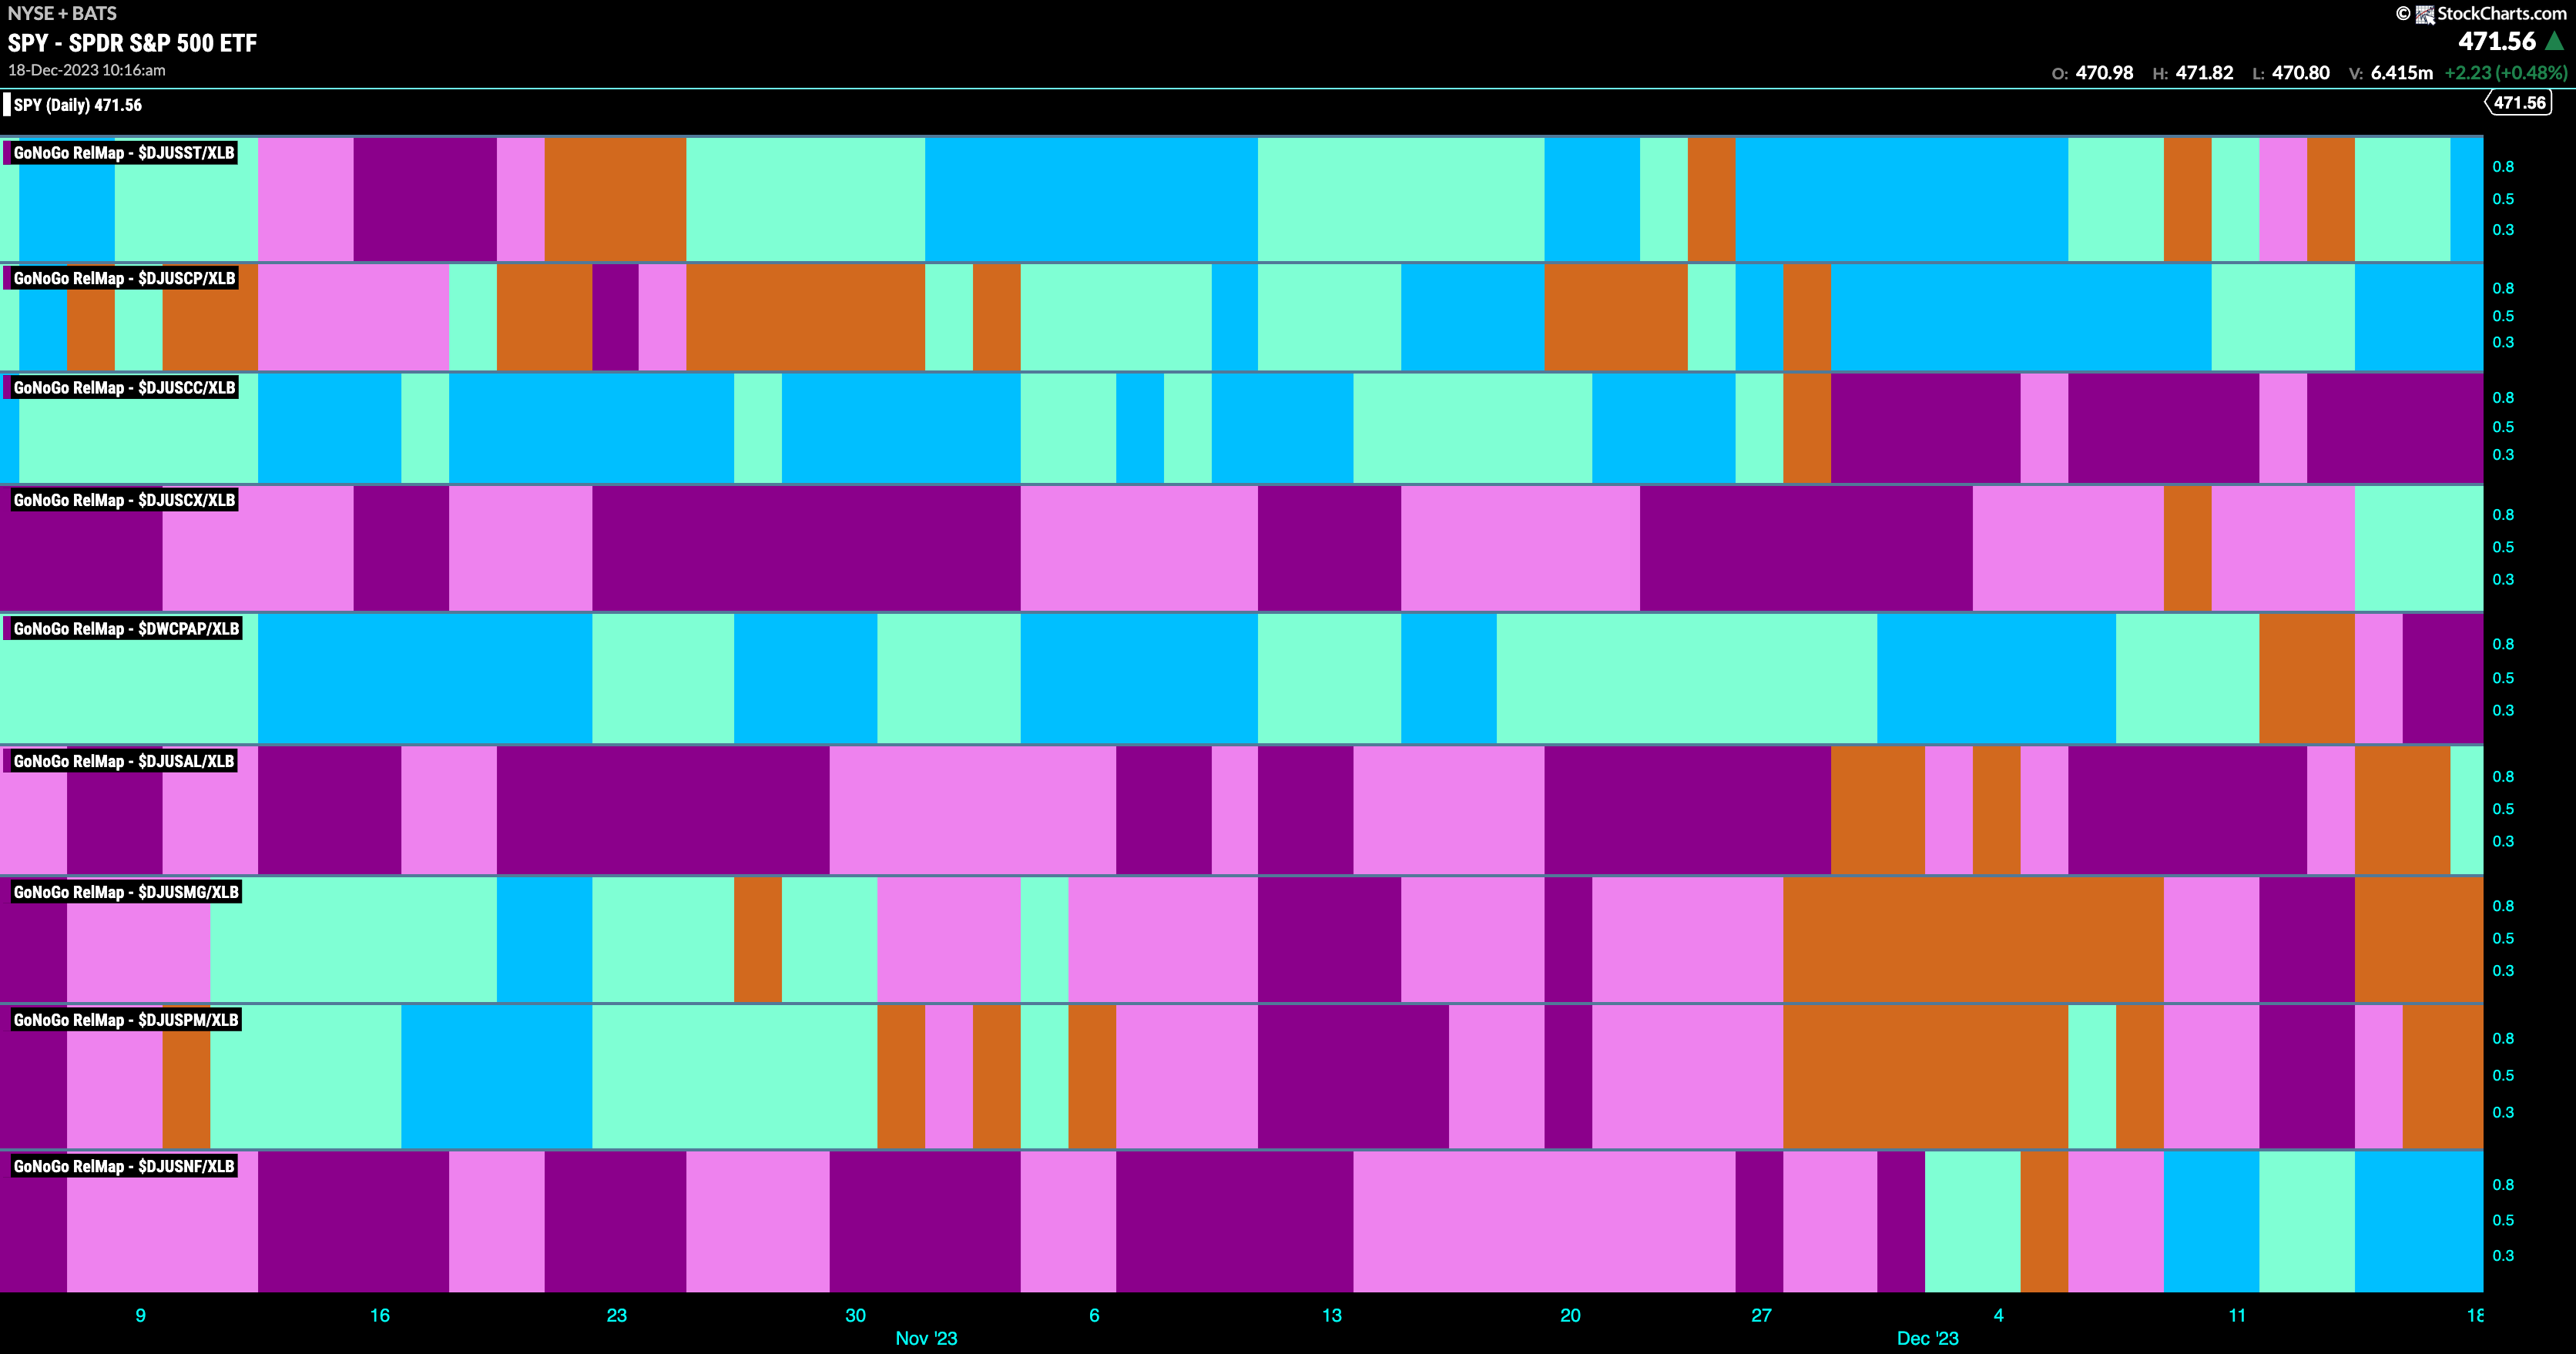
The GoNoGo Sector RelMap above shows that the materials sector is the latest to join the outperformance party. Below is the GoNoGo RelMap showing the sub groups of the materials sector relative to the sector. We can see that there are several sub groups that are in relative “Go” trends. In the second panel, we can see that $DJUSCP (containers and packaging) is painting strong blue “Go” bars relative to the sector.
$AMBP Trend Continuation in “Go” Trend
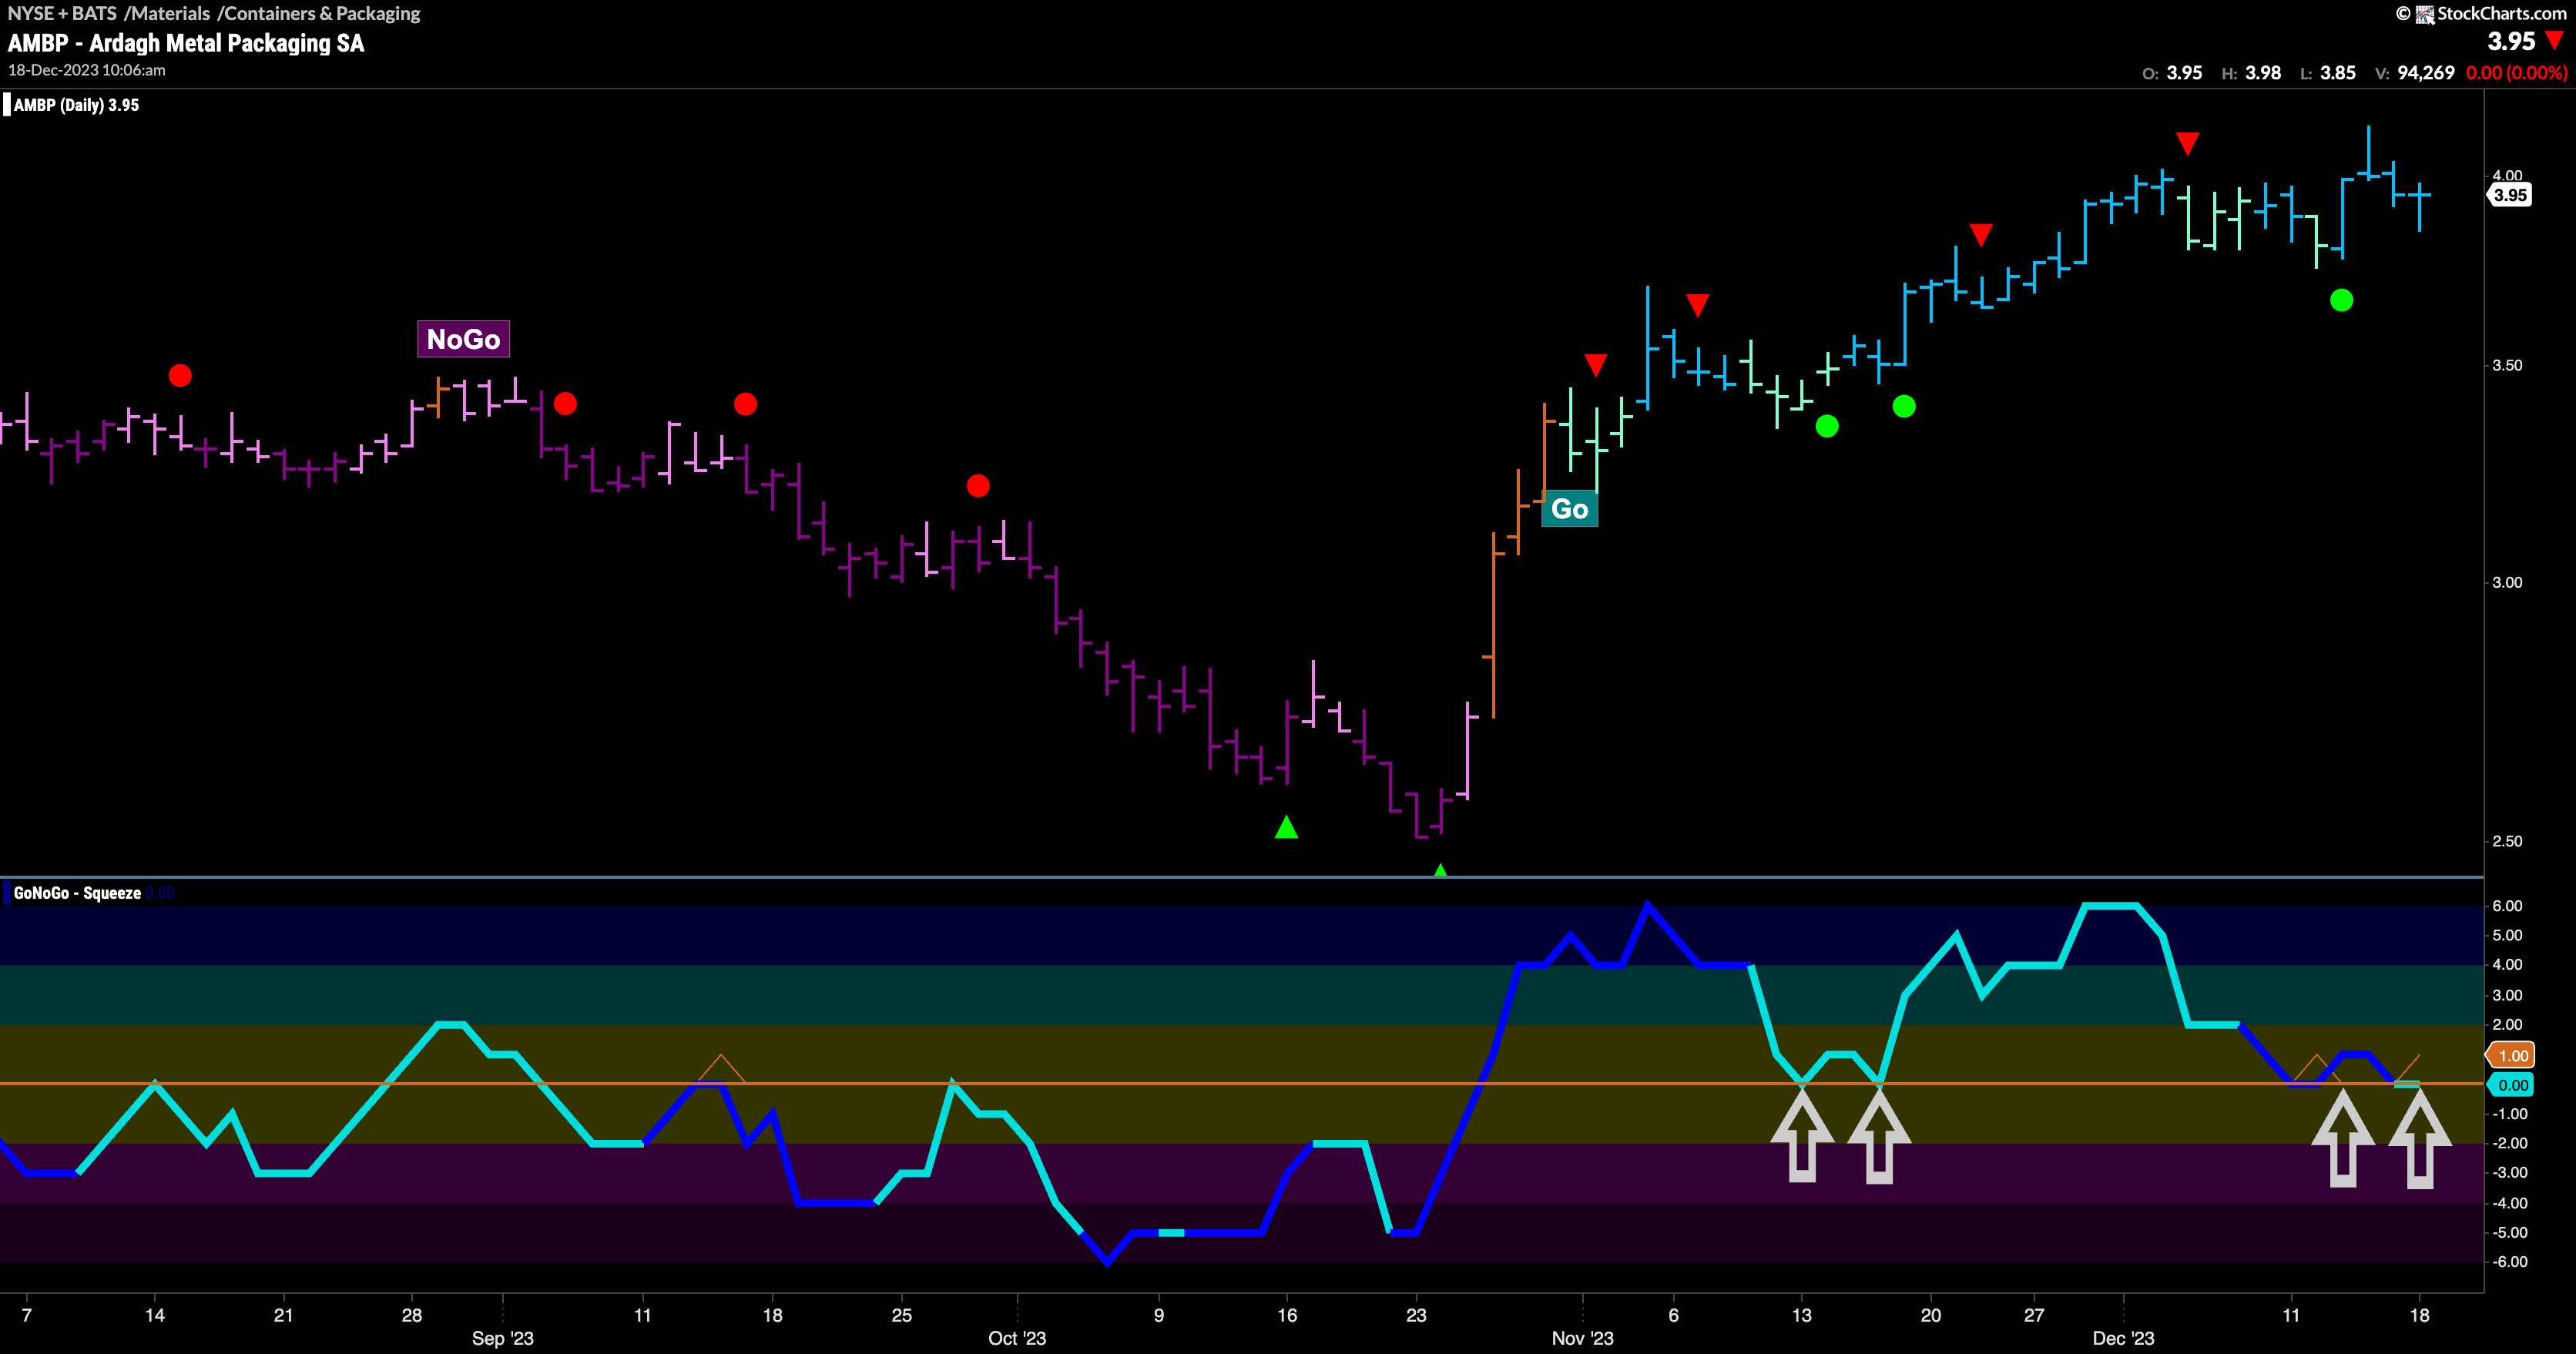
$AMBP is in a “Go” trend and we see that the indicator is painting strong blue bars. However, after finding support at the zero line once, we see that GoNoGo Oscillator is right back at that level retesting it from above. If the oscillator finds support here again, it is likely that price will make an attempt at new highs as we would be able to say that momentum is resurgent in the direction of the “Go” trend. We will watch to see if indeed this happens and look for another Go Trend Continuation Icon (green circle).
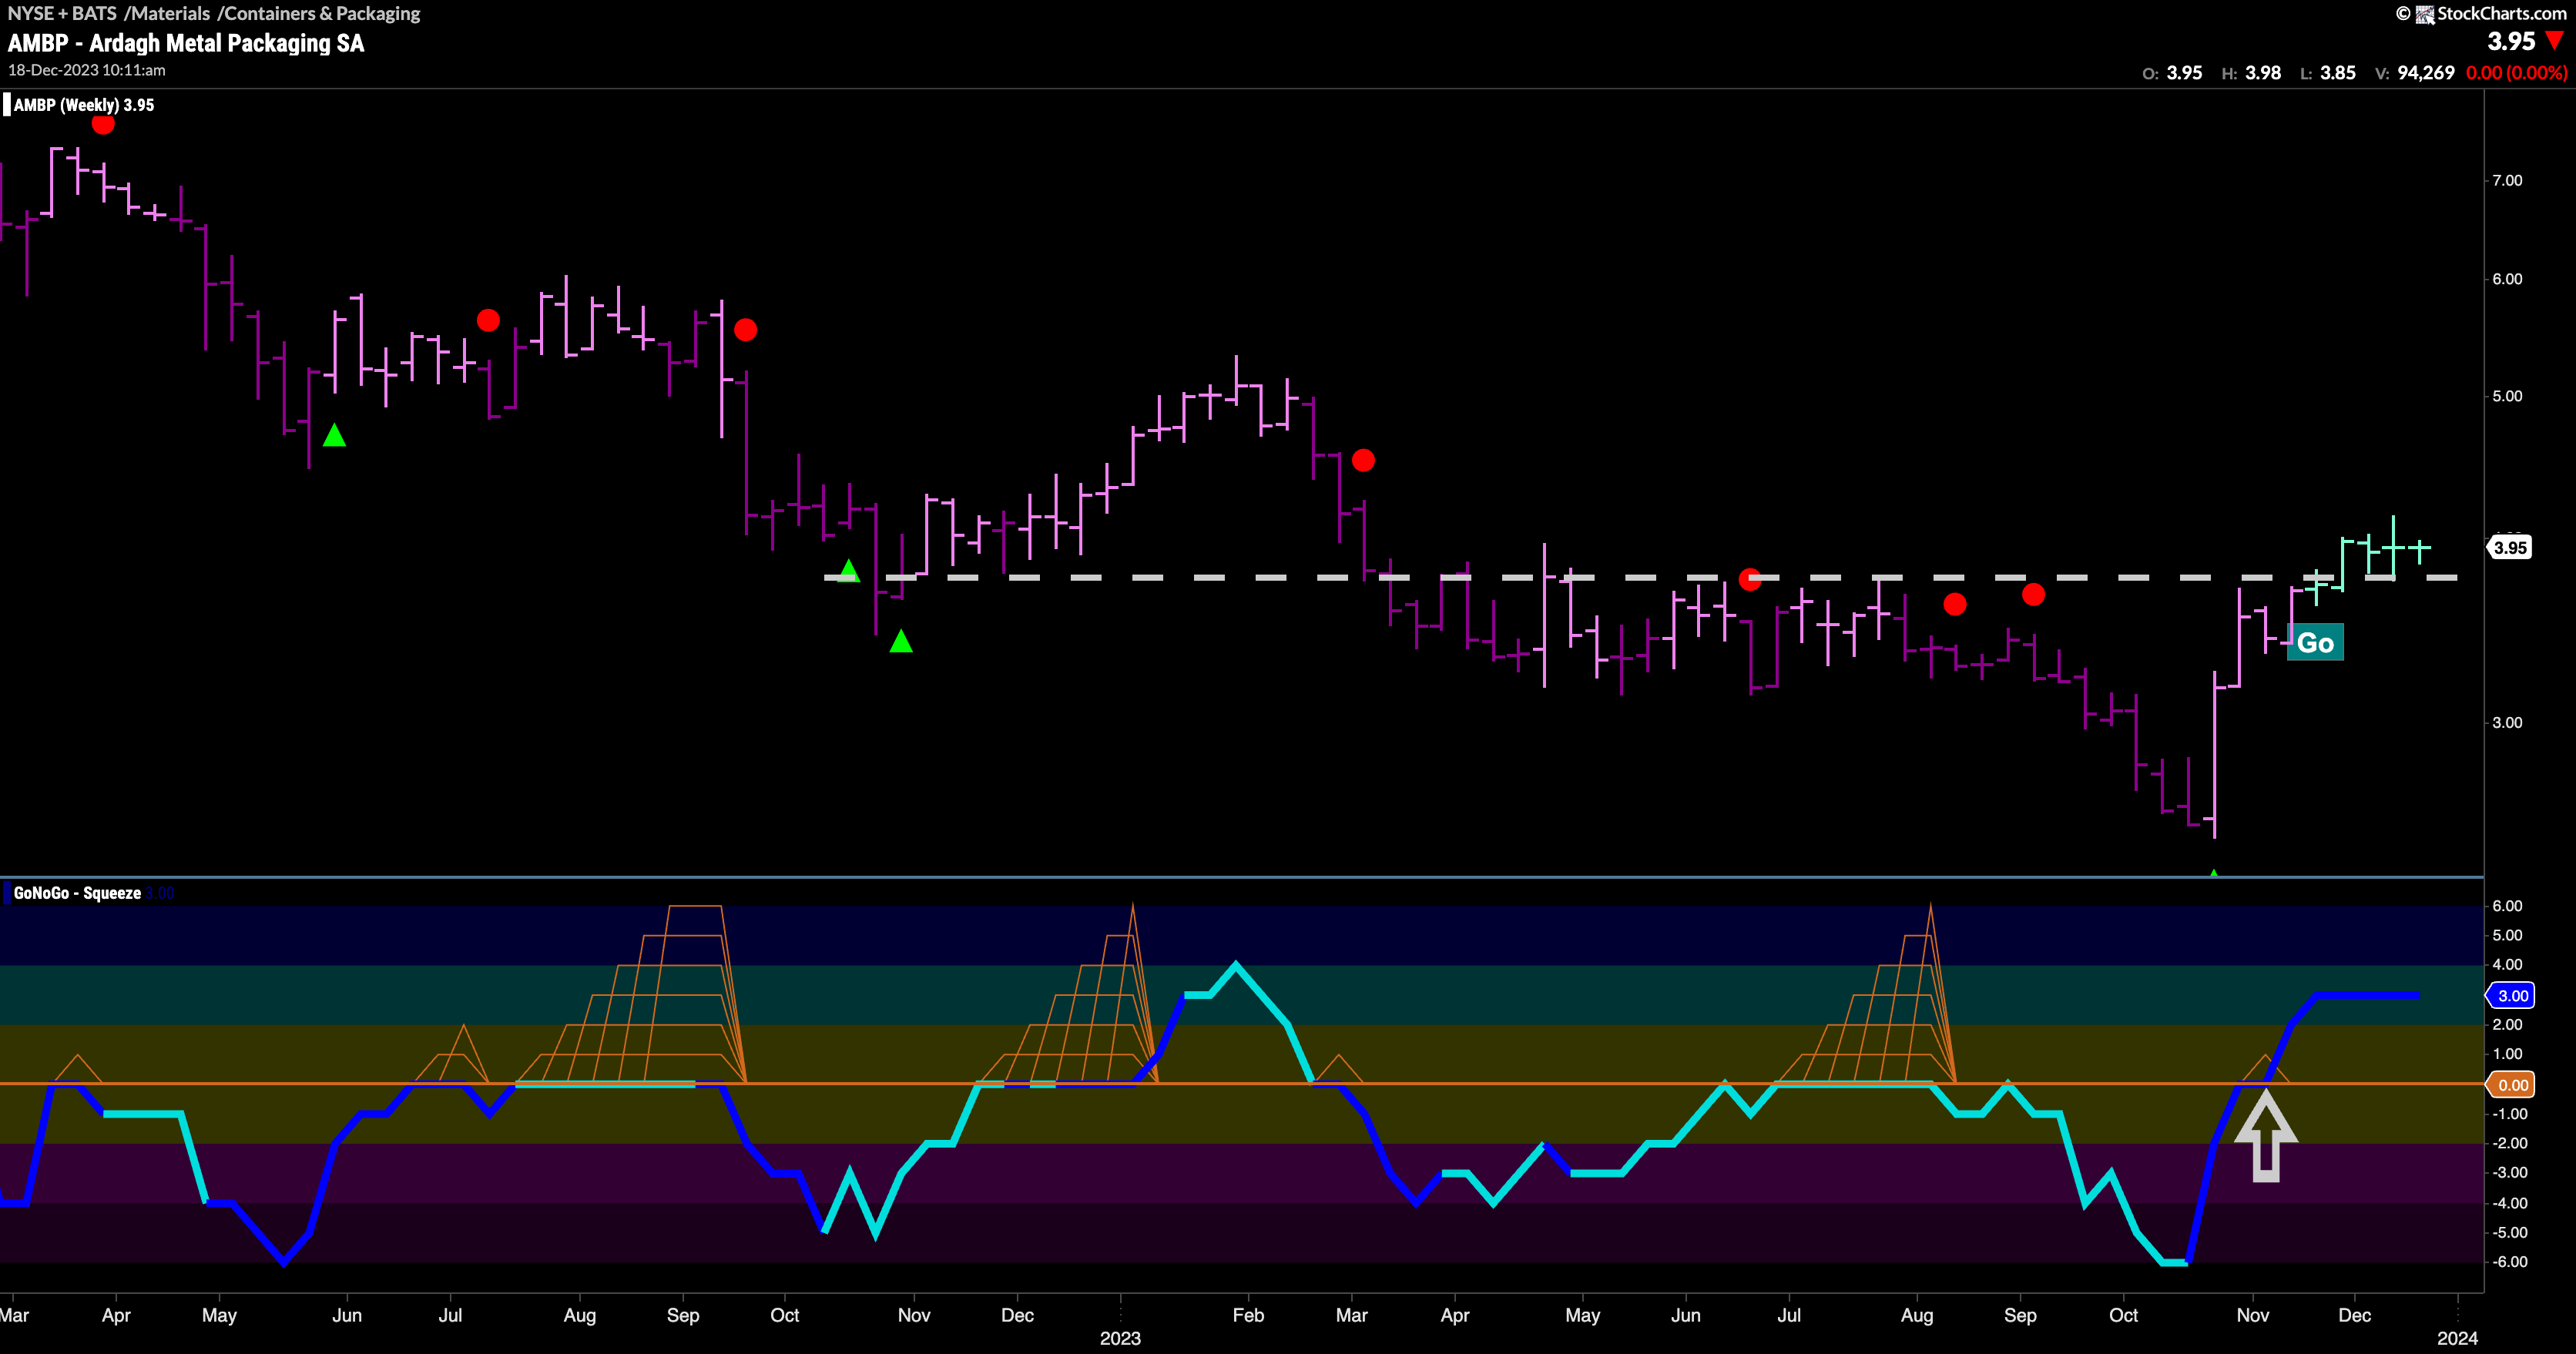
The weekly chart shows that this might be early days for a “Go” trend. We can see that we have painted several “Go” bars since GoNoGo Oscillator broke above the zero line on heavy volume. We can also see that this rally has put price at and above horizontal levels that have acted both as support and resistance over the time frame of this chart. This level should therefore provide support going forward. Wew ill watch to see if price can continue to go higher from here.
