
Good morning and welcome to this week’s Flight Path. Let’s take a look at the below GoNoGo Asset Map for this week. The top panel shows that the trend in U.S. equities has reversed to a “Go” to end this week. It has been quite a rally over the last two weeks. Treasury bond prices remain in a strong “NoGo” again this week painting purple bars. Commodities and the dollar remain in “Go” trends this week amid the threat of rising rates and inflation. Bitcoin even joins the risk on party to end the week as we see 4 of the 5 major asset classes in “Go” trends. Investors are taking chances, even amidst continued volatility surrounding tensions in Ukraine and rising rates/inflation worries.

S&P Identifies new “Go” trend
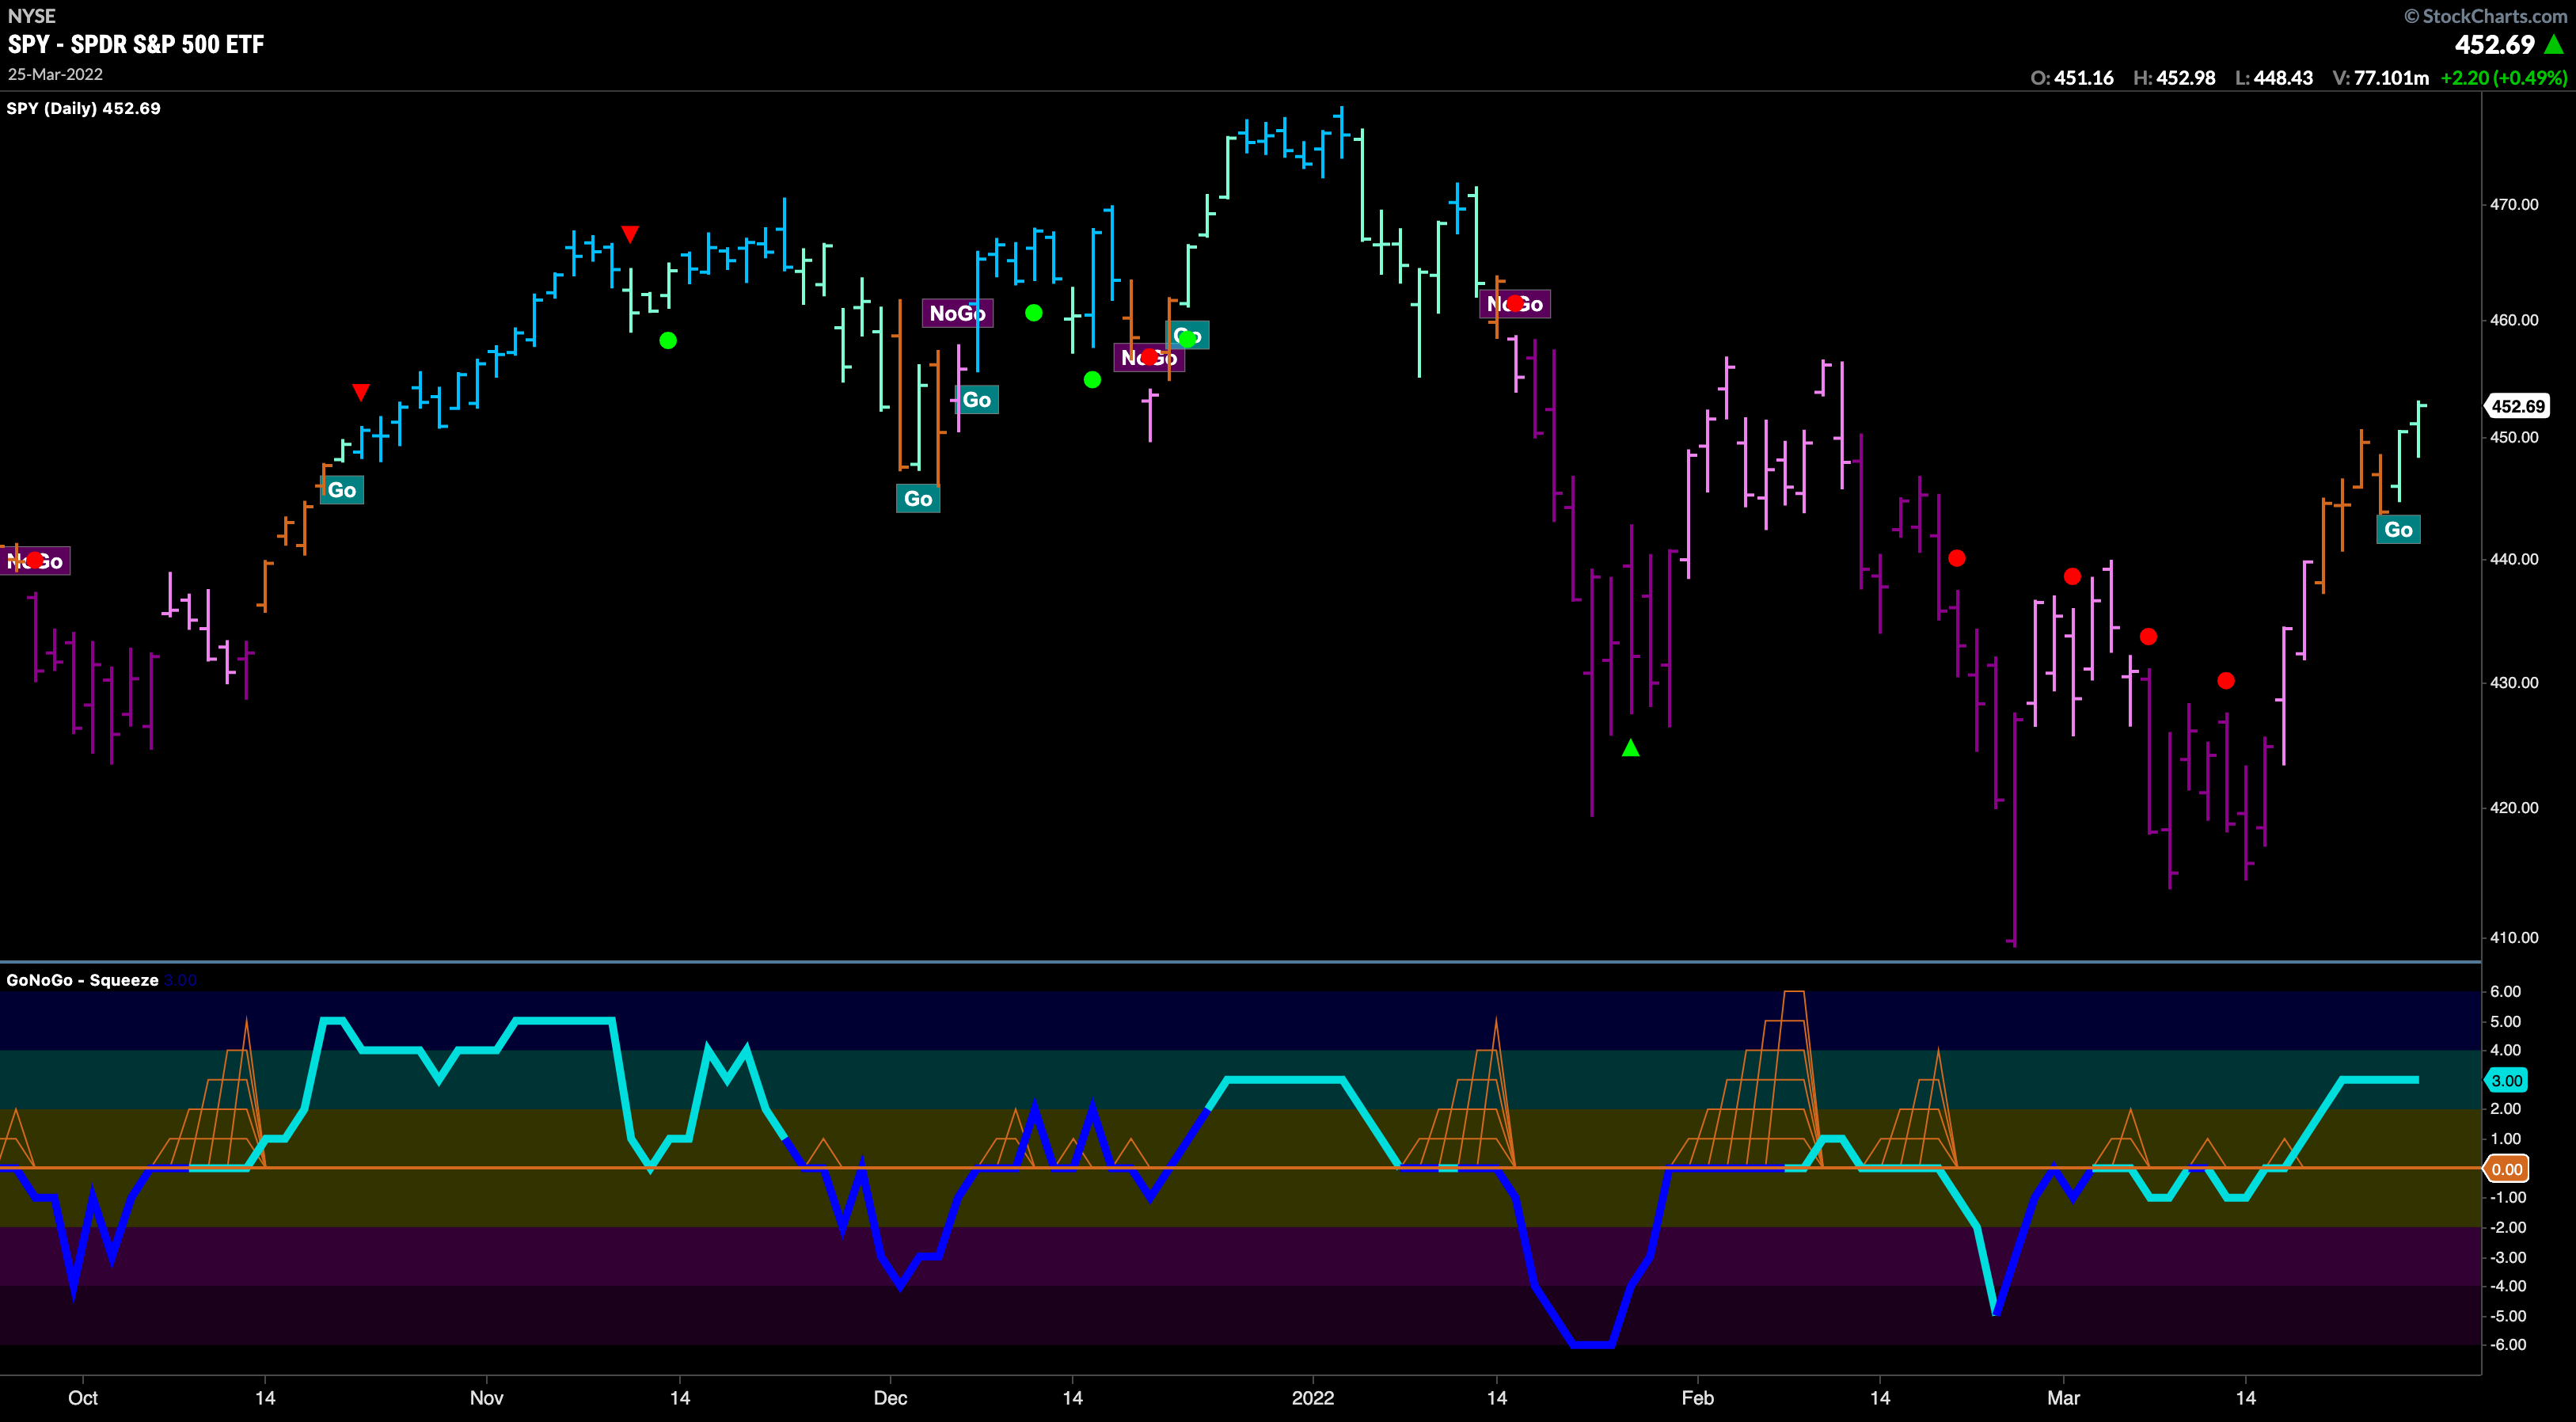
Below is the chart of the $SPY with GoNoGo Trend and GoNoGo Oscillator and Squeeze applied. GoNoGo Trend is painting aqua “Go” bars for the first time since last year as enough bullish trend conditions are being met to allow the indicator to move from “Go Fish” amber bars to aqua. GoNoGo Oscillator is above zero and not yet overbought and volume is light. We still see potential resistance around $455 from the polarity of highs and lows but U.S. equities showing strength.

Sector Strength
Below is a GoNoGo Sector RelMap. The chart applies the GoNoGo Trend to the relative ratio of each sector ETF to the base ETF, the $SPY. There are five sectors that are showing relative “Go” trends this week. They should surprise no one at this point. Energy, industrials, materials, healthcare and utilities are the out performers. These sectors are likely to continue to fare well as inflation and rising rates move prices of goods higher. Looking at the “NoGo” trends in the growth oriented sectors, we see that the trends are weakening on a relative basis. XLK and XLC are painting paler pink “NoGo” bars. The growth sectors rallied strongly last week.

Did You Buy the Dip in Oil?
Energy continues to lead, and the biggest drive has been oil. Below is the GoNoGo Chart of $USO with GoNoGo Trend, Oscillator and Squeeze applied. As we saw prices fall sharply from the high at the beginning of March, we advocated watching the zero line to see if that would hold as support. After building a GoNoGo Squeeze as the oscillator remained at that level for several bars, we saw Go Trend Continuation icons appear as the oscillator did indeed find support.

Marathon Oil Still Running its Race
With the trend in oil still in place, and oil typically being a portfolio diversifier that can help hedge against inflation, let’s look at the chart below of Marathon Oil. $MRO’s daily prices show that the “Go” trend is not just in place but thriving as a new higher high is made. GoNoGo Trend is painting strong blue “Go” bars and GoNoGo Oscillator is in positive territory having seen the zero line hold once again as support. A higher high sees price pushing above $26 giving investors significant gains since the “Go” was identified at around $16.50 on December 29th, 2021.

Precious Metals are the $SLV-er lining?
It isn’t just oil that can serve as a hedge against inflation. Commodities in general, precious metals, agricultural goods, as well as oil & gas can serve well as portfolio diversifiers. We have talked about gold in several research notes this year, and below is a GoNoGo Chart of silver. Daily prices of $SLV show that the “Go” trend is in place and we saw price find support just under $23. GoNoGo Oscillator has fallen to the zero line as price consolidated after the Go Countertrend Correction red arrow that we saw near the recent high. With GoNoGo Oscillator staying at zero, reflecting a lack of directional momentum, we see the GoNoGo Squeeze build to a max. We will watch here, and can expect prices to rally to test recent highs if the oscillator can break out of the Squeeze into positive territory.

Rio Testing Resistance at Prior Highs
The world’s second largest metals and mining corporation, $RIO has cropped up in our research before as we saw the “Go” trend develop in December of ’21. Recently, a fresh “Go” signal after a couple of amber “Go Fish” bars provided a good buy the dip moment and we have since seen a couple of Go Trend Continuation green circles as GoNoGo Oscillator found support at zero. Now, we see price testing this prior high. GoNoGo oscillator is not yet overbought and if price can consolidate above these levels then we could see it move still higher.

Is Technology Back?
Flying in the face of the Fed’s comments about the need to tighten the economy faster, growth sectors such as technology continued to rally last week. The GoNoGo Chart below shows $XLK on daily prices. A “Go” trend was identified with an aqua bar on Friday’s trading. GoNoGo Oscillator had previously rallied into positive territory after displaying bullish divergence from price (price making a lower low not confirmed by the oscillator which made a higher low). We will look to see if prices can consolidate at these levels and by doing so set a higher low as they move higher than prior swing highs.

Amazon Set to Amaze?
Given the surprising(?) strength in growth sectors let’s take a look at the GoNoGo Chart of $AMZN. Having broken out of a downward sloping trend line as we saw GoNoGo Trend move to amber “Go Fish” bars before enough bullish trend conditions were met causing the “Go” trend to be identified first with aqua “Go” bars that have now strengthened to bright blue. GoNoGo Oscillator is in positive territory but not yet overbought and so we’ll look for price to consolidate before potentially moving higher.

Bye Bye Bitcoin?
As investors take more risk, even in the face of global geopolitical uncertainty and the threat of inflation, Bitcoin seems to have hopped on board with prices moving above resistance at $46,000. What looks like a break out of an ascending triangle to the upside could spell good news of higher prices ahead for the cryptocurrency. A string of uninterrupted strong blue “Go” bars has seen GoNoGo Oscillator rally to overbought levels as price looks to make a new intermediate term high. Is this the start of the next big run in the digital asset?


