Good morning and welcome to this week’s Flight Path. Let’s take a look at the GoNoGo Asset map below. The “Go” trend continues in U.S. domestic equities this week as we see continued strong blue bars as price edges higher. Treasury bond prices break into a “Go” trend this week and end on a strong blue “Go” bar. The dollar continues to struggle as we see strong purple “NoGo” bars to end the week. 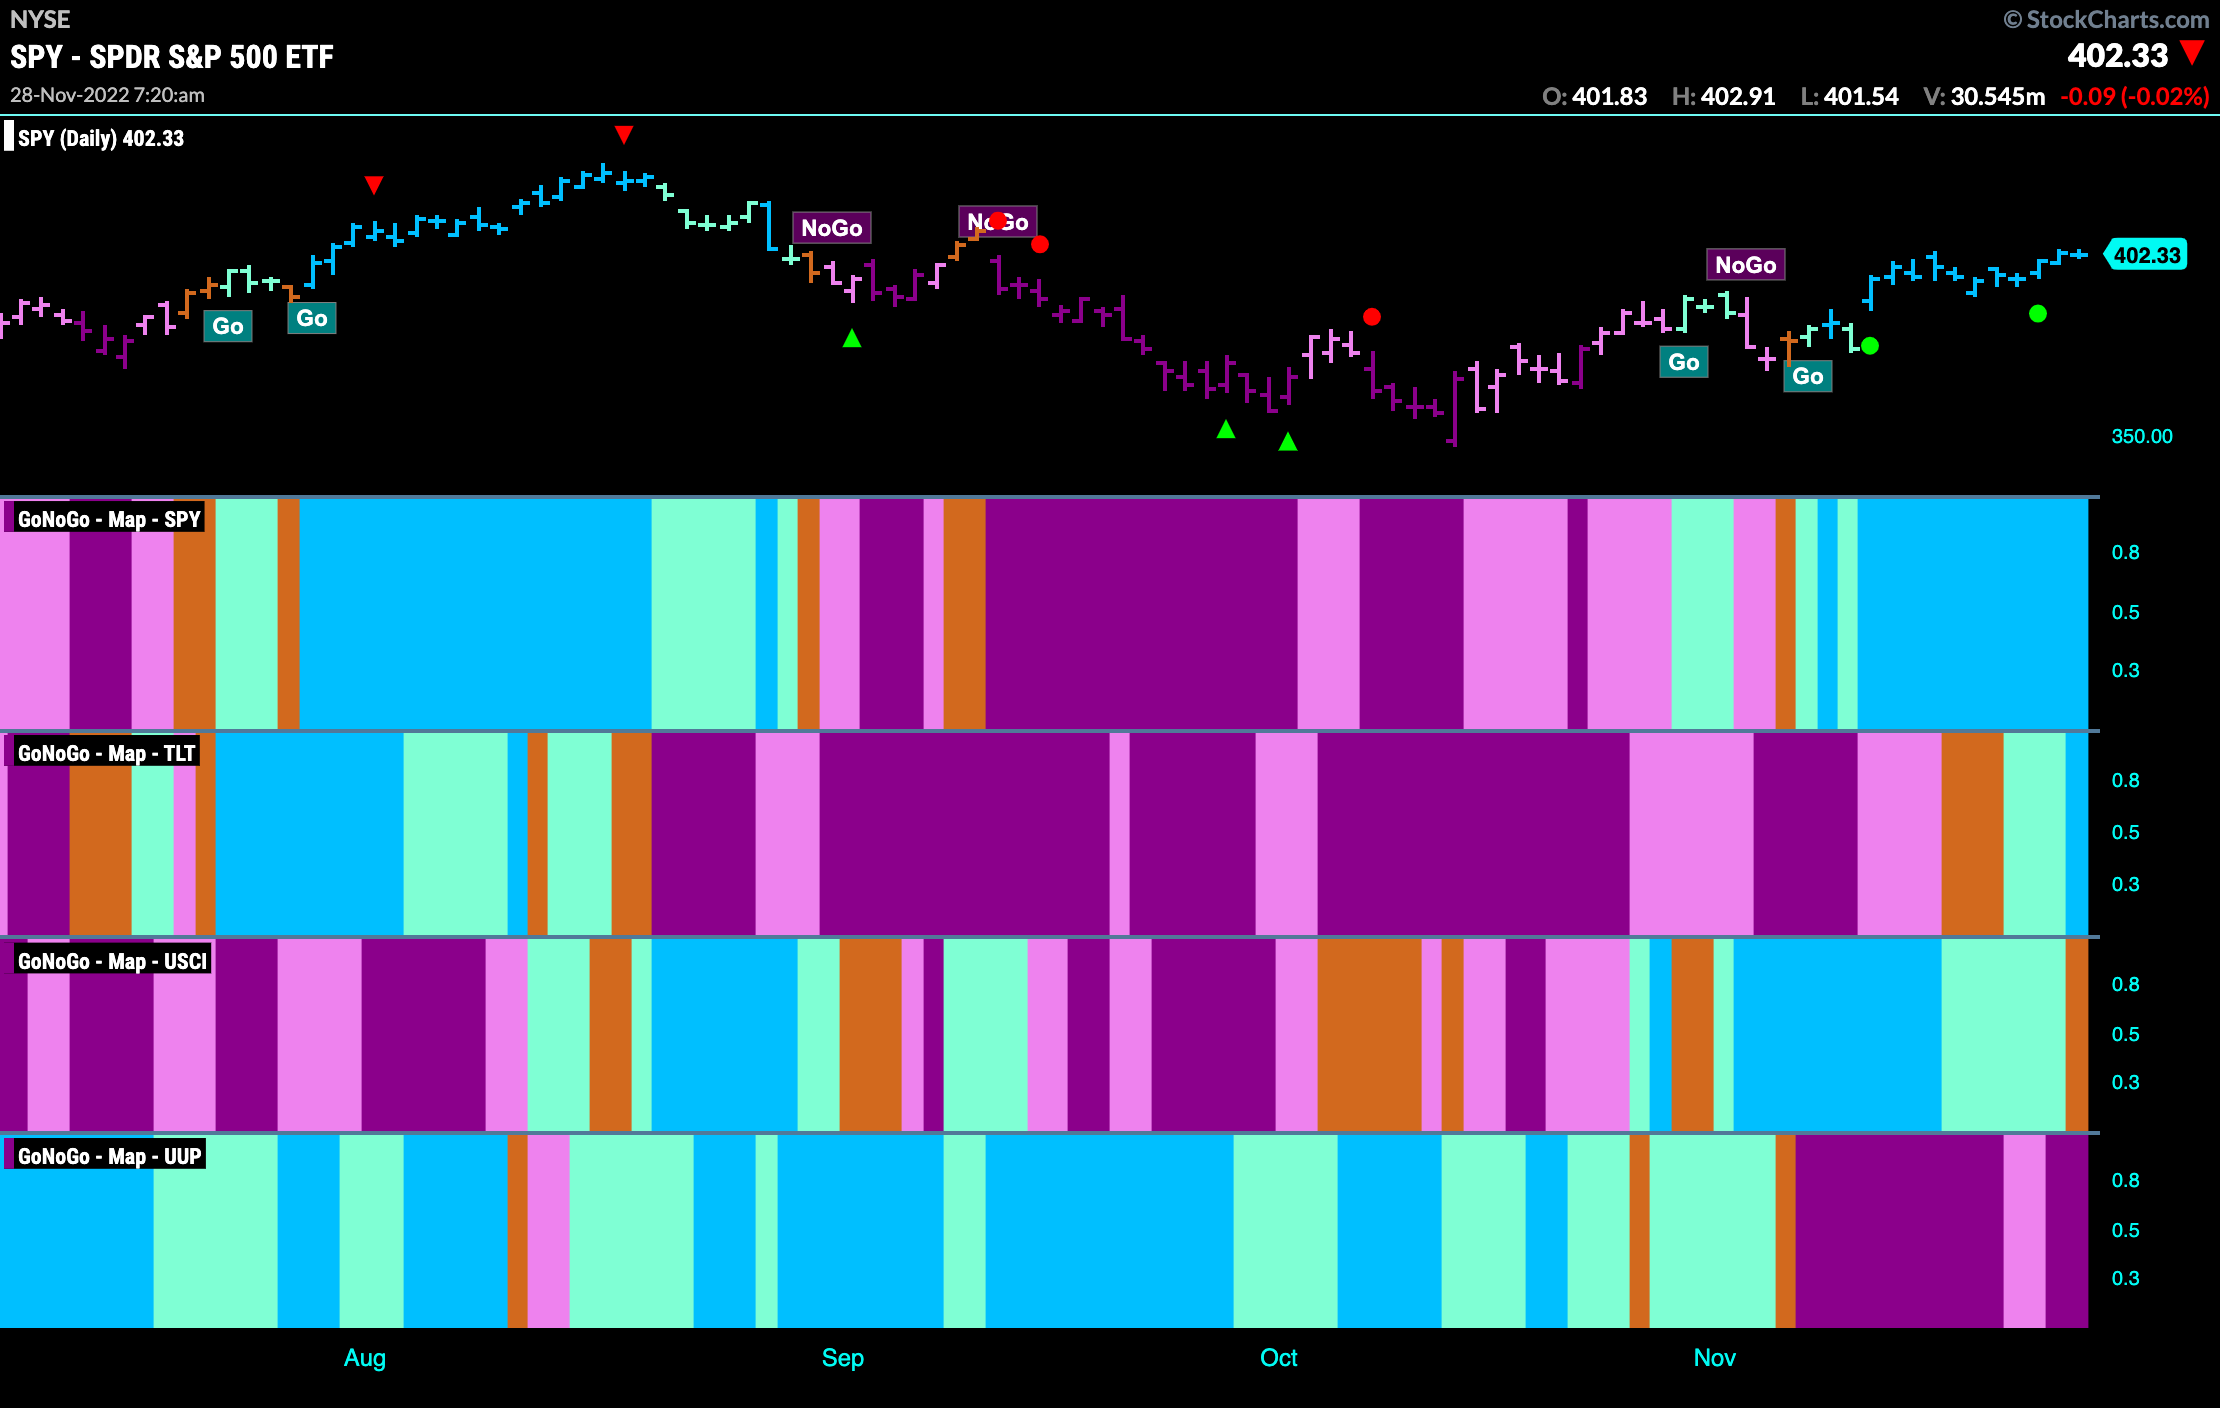
S&P 500 Edges Higher
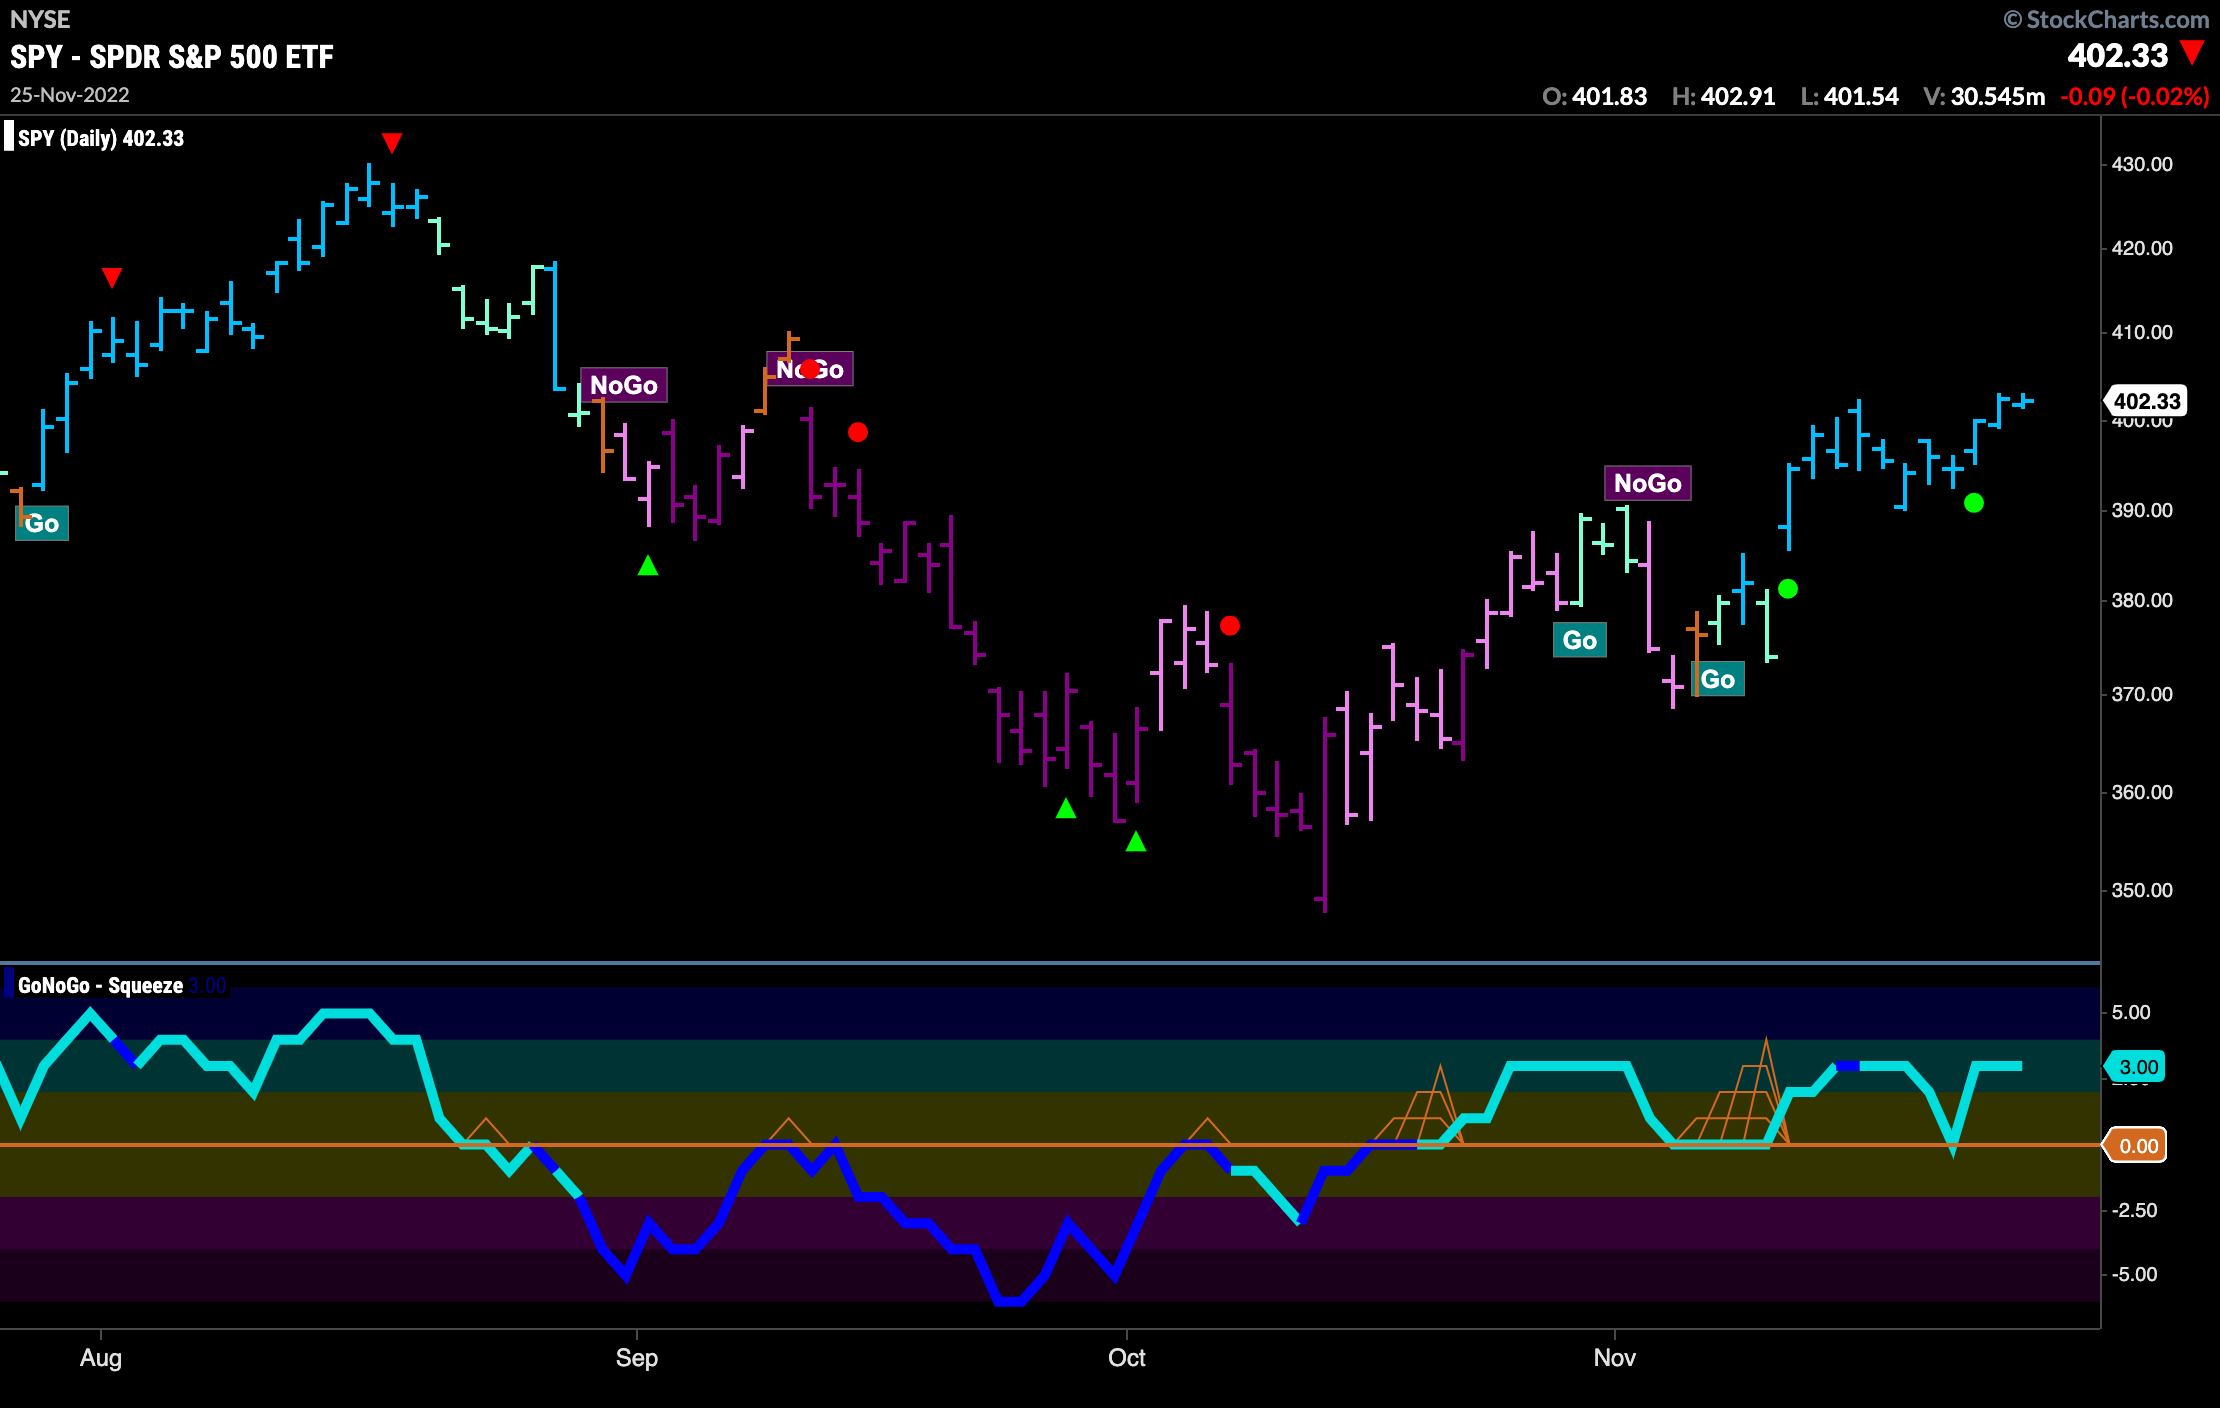
The “Go” trend shows some robustness this week as we saw GoNoGo Trend paint continuous strong blue bars. GoNoGo Oscillator fell to the zero line as price cooled a week ago but immediately found support and bounced back into positive territory. This caused a Go Trend Continuation Icon (green circle) to appear under the price bar indicating that momentum was resurgent in the direction of the “Go” trend. Price moved higher to end the week.
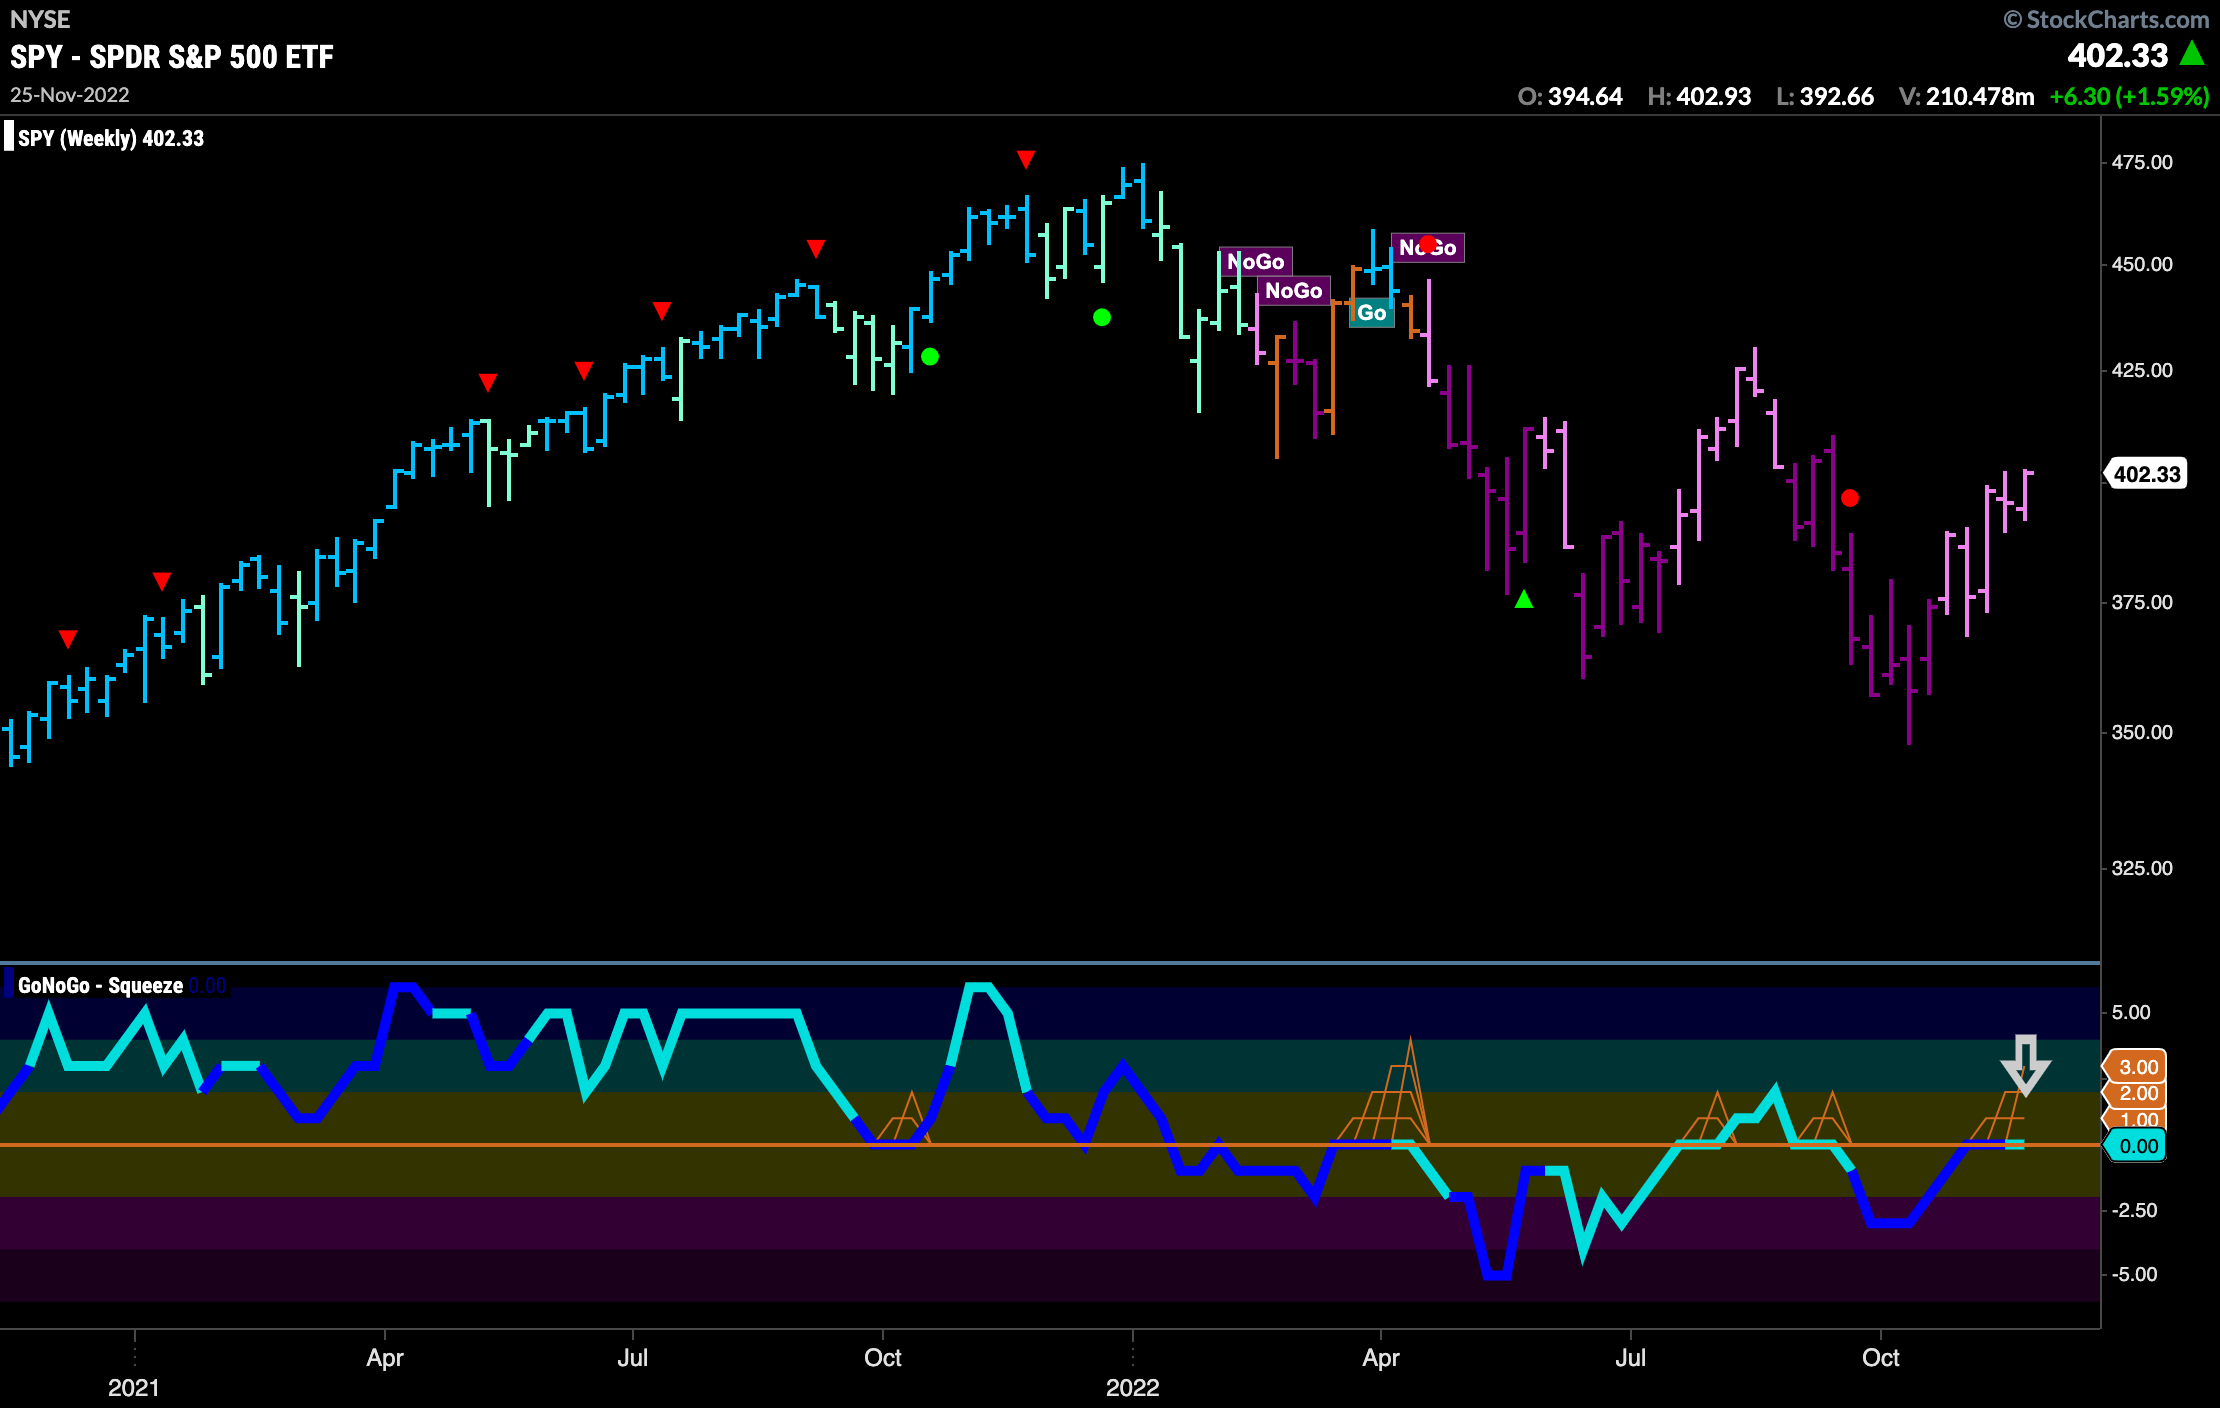
If we look at the weekly chart we are still at a critical inflection point. GoNoGo Trend shows that price continues to paint weaker pink “NoGo” bars as price rallies off the October low. GoNoGo Oscillator remains stuck at the zero line where a GoNoGo Squeeze is starting to build. We will watch to see in which direction the Squeeze is broken. This will be important to either confirm trend continuation or suggest a potential reversal.
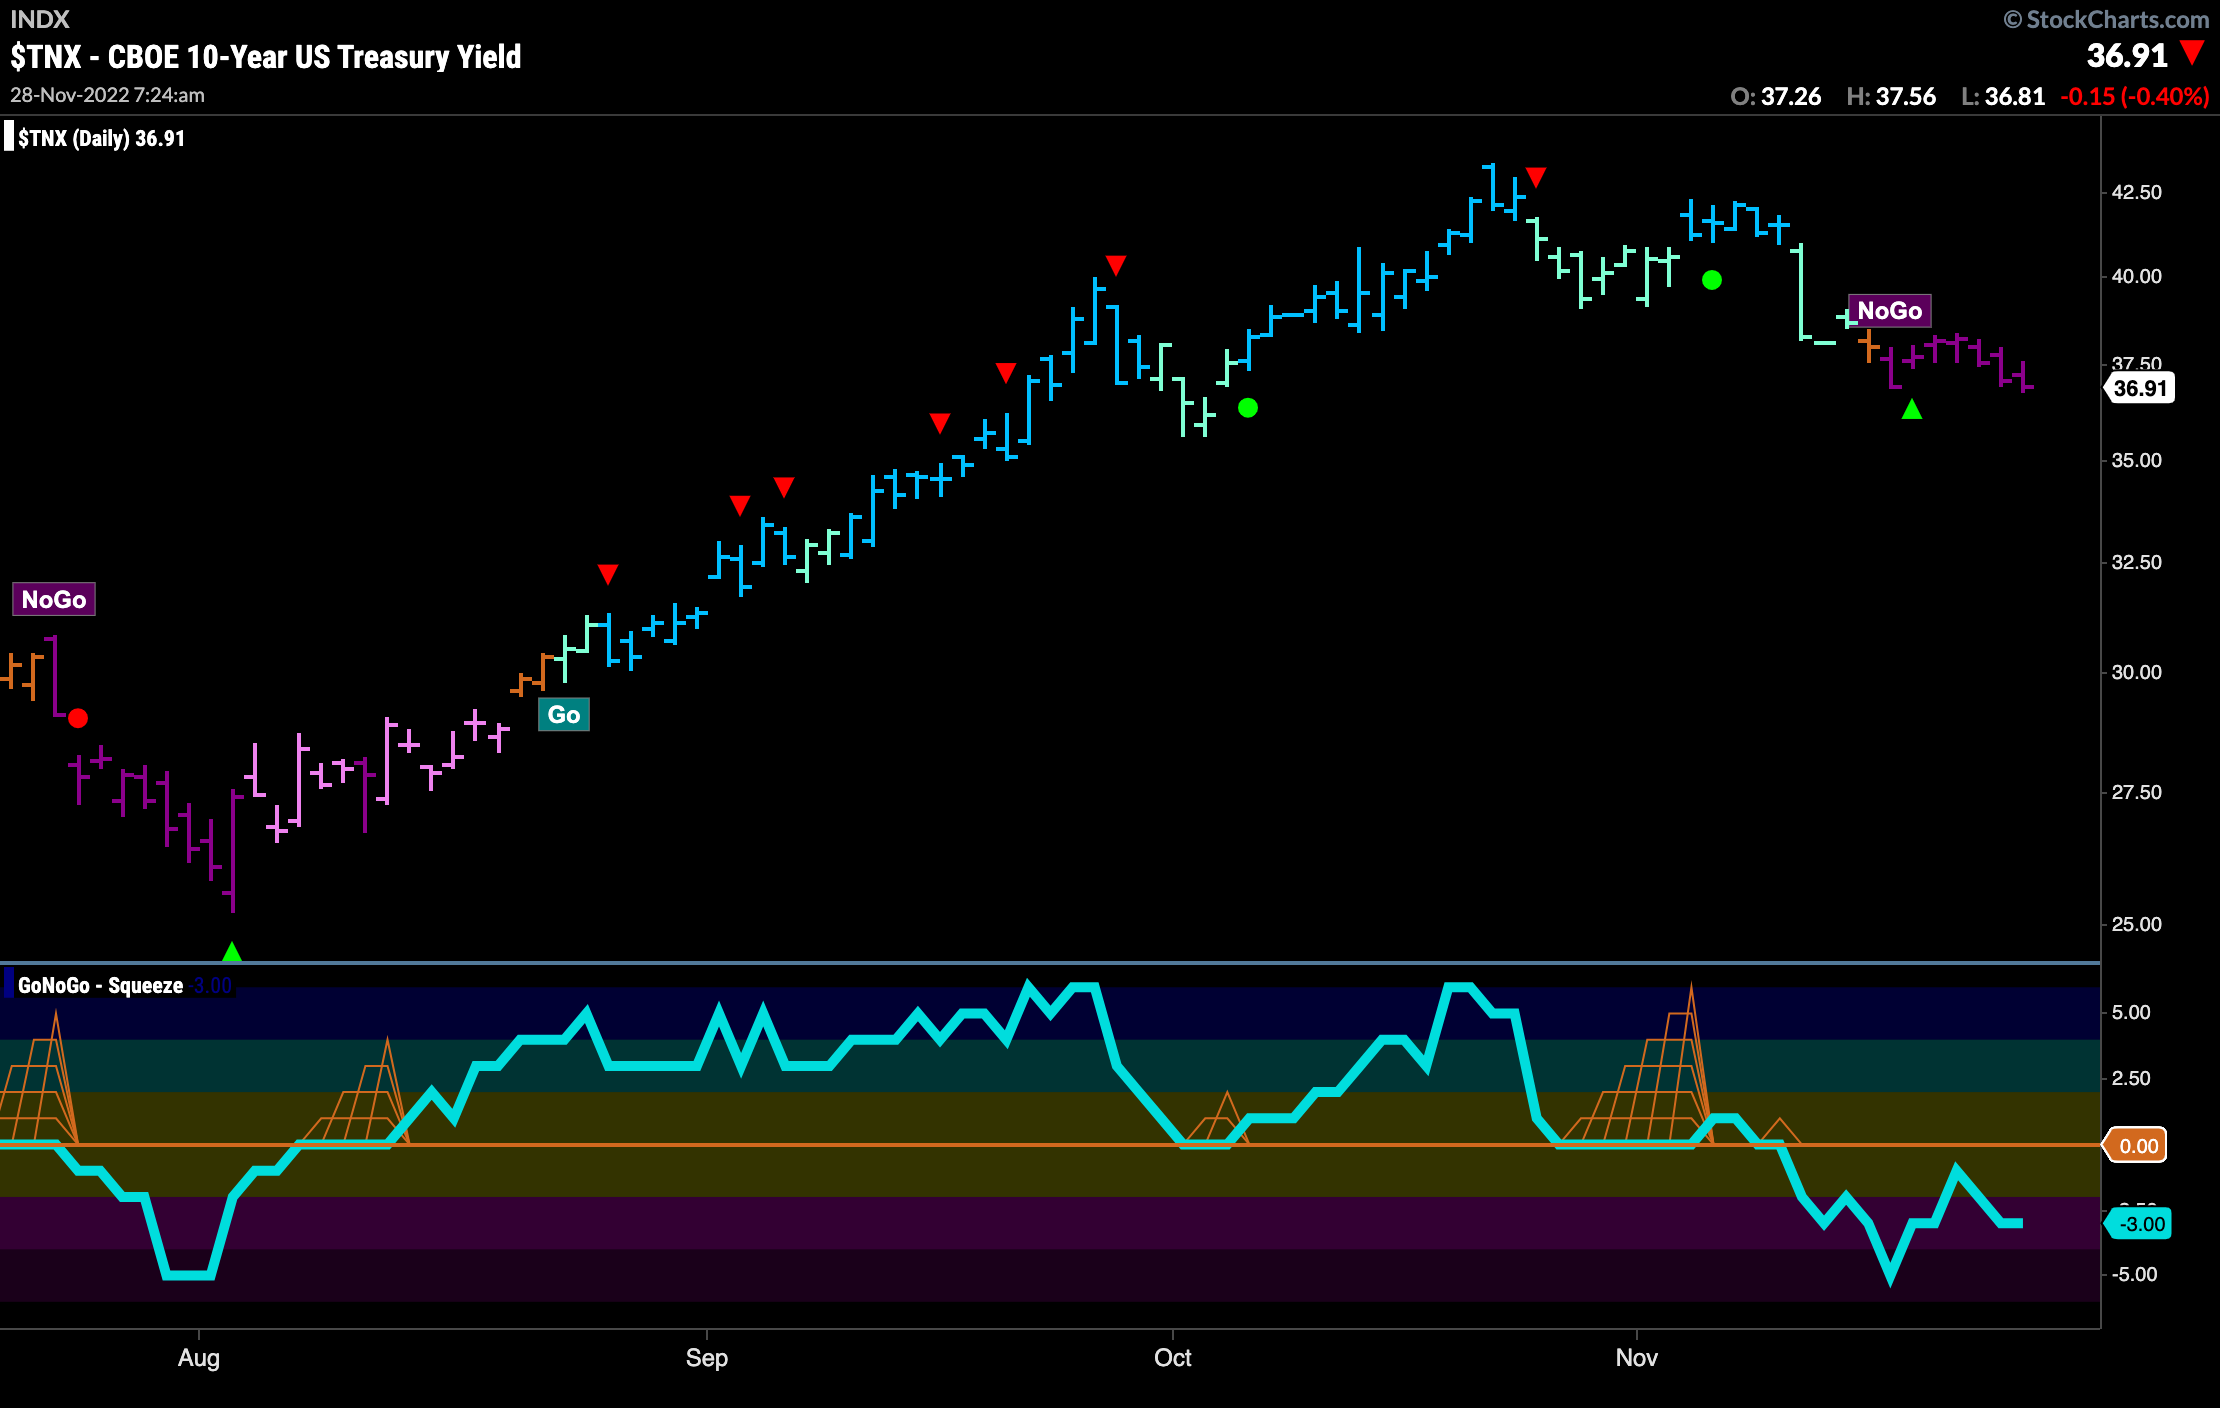
Treasury Rates Remain in “NoGo”
The “NoGo” in rates continues. This has been providing some relief to equities over the last couple of weeks and the “NoGo” persists this week. After flagging a “NoGo” we have seen GoNoGo Trend paint a string of strong purple “NoGo” bars. GoNoGo Oscillator remains below the zero line suggesting that momentum is negative and on the side of the “NoGo” trend. We haven’t yet seen oversold readings yet on the oscillator.
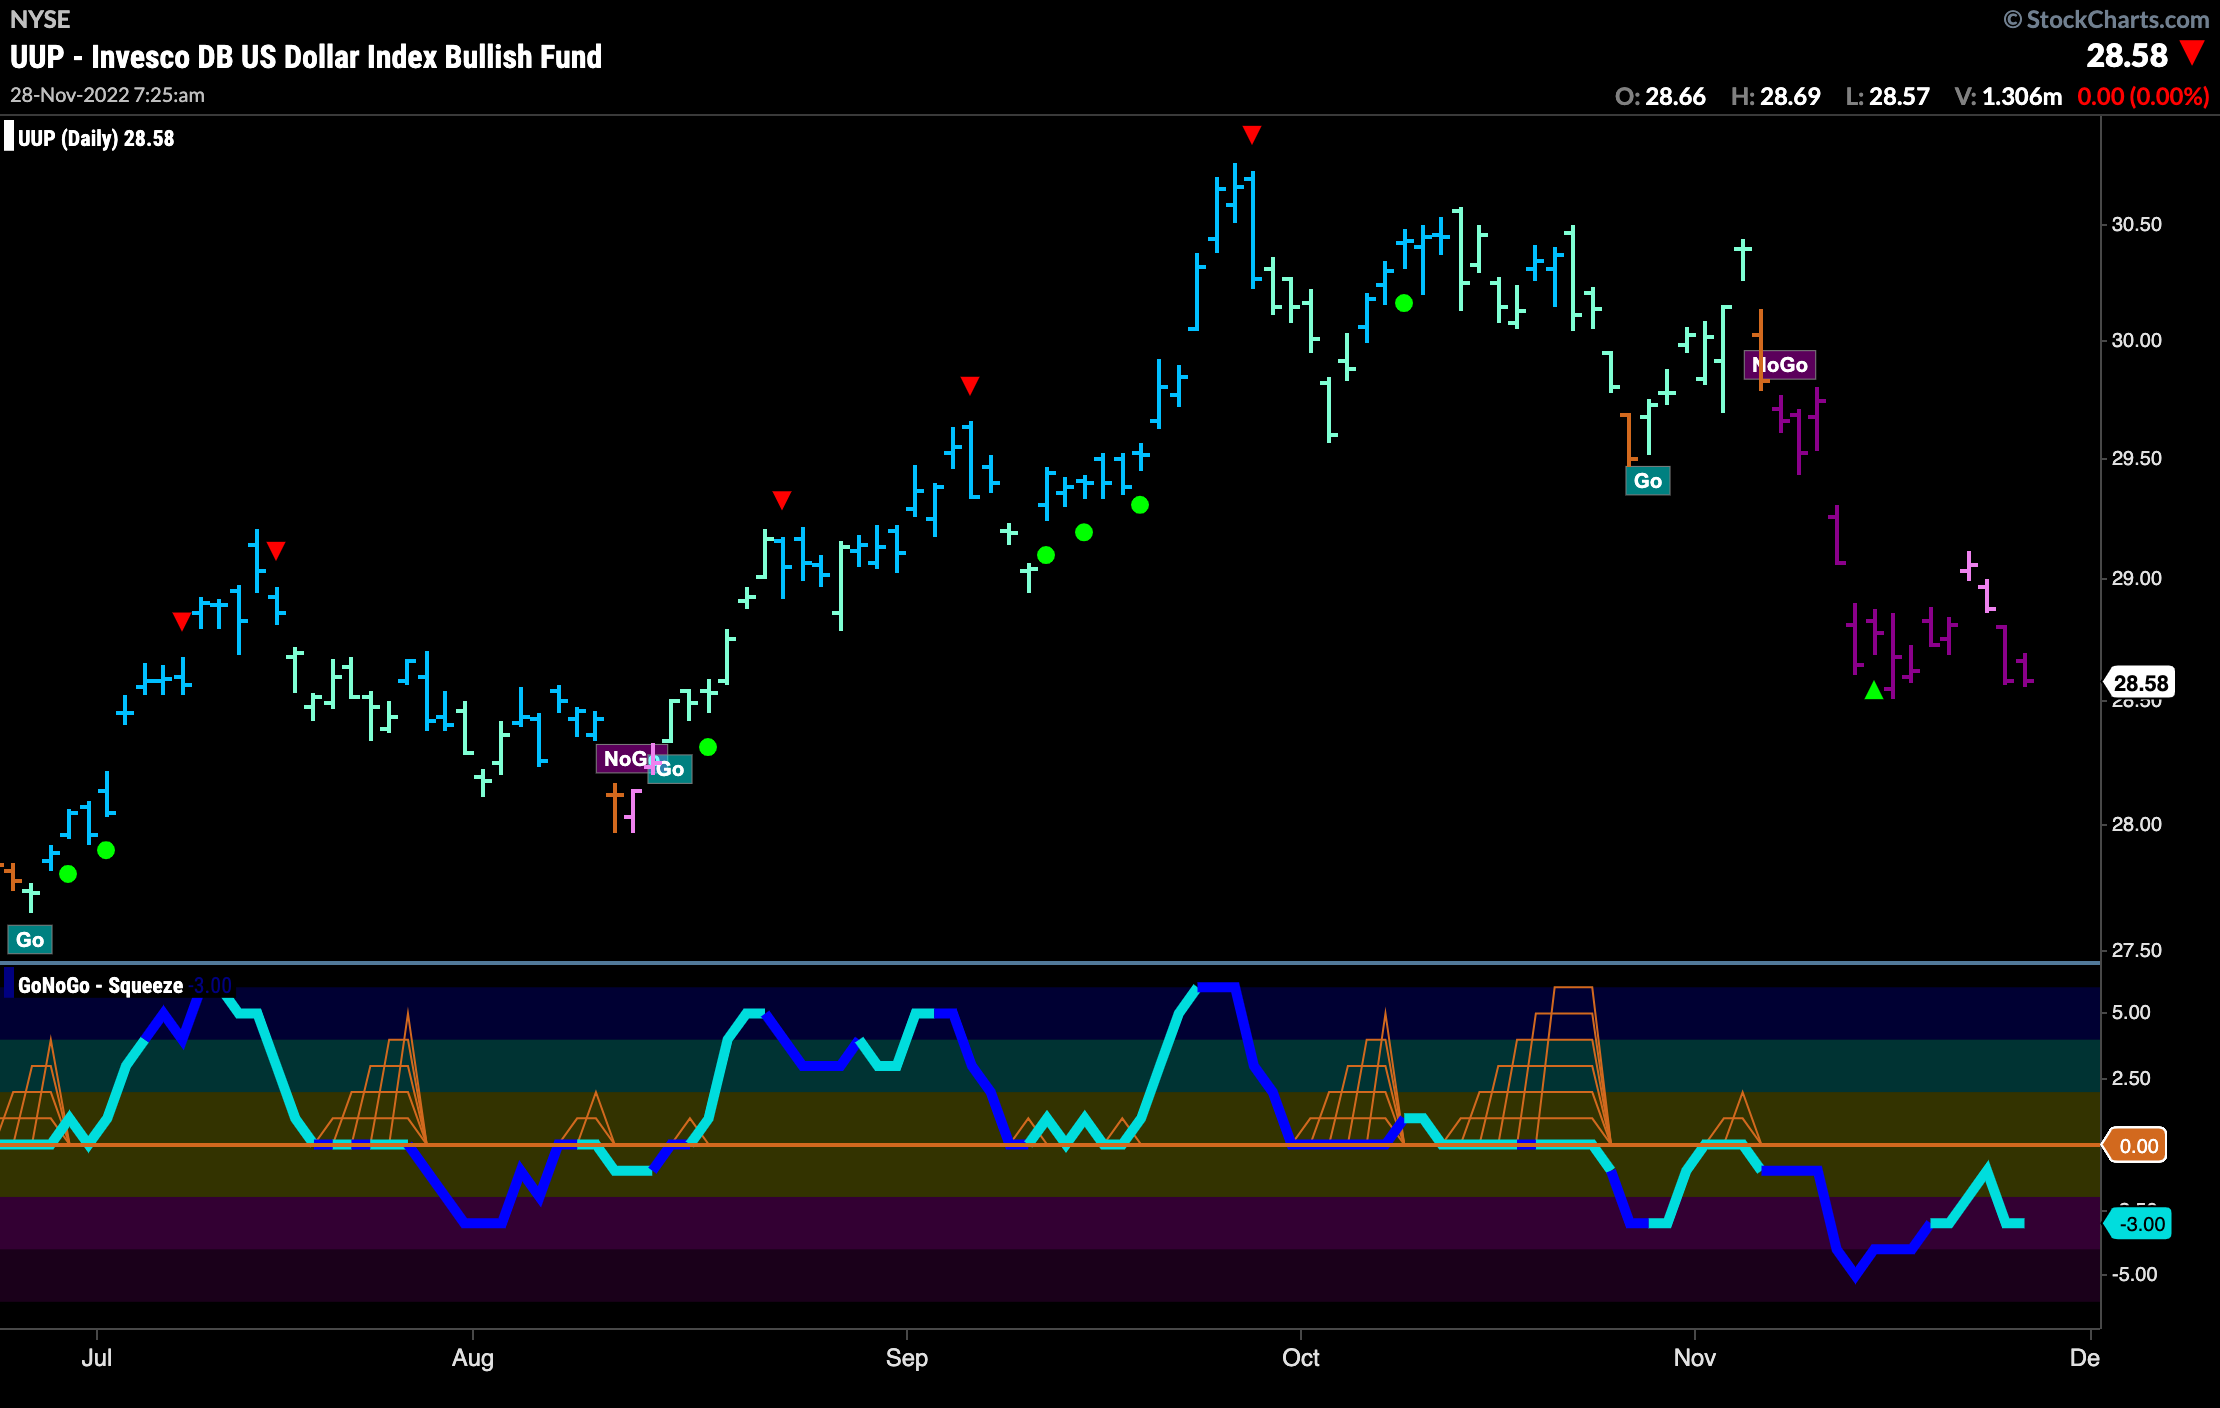
The Dollar “NoGo” sees Strength Return
After the “NoGo” weakened at the beginning of the week we saw a return of strong purple bars as the trend strengthened again. Now, price is testing recent lows. GoNoGo Oscillator after approaching zero rolled over again and is now at -3, not yet oversold.
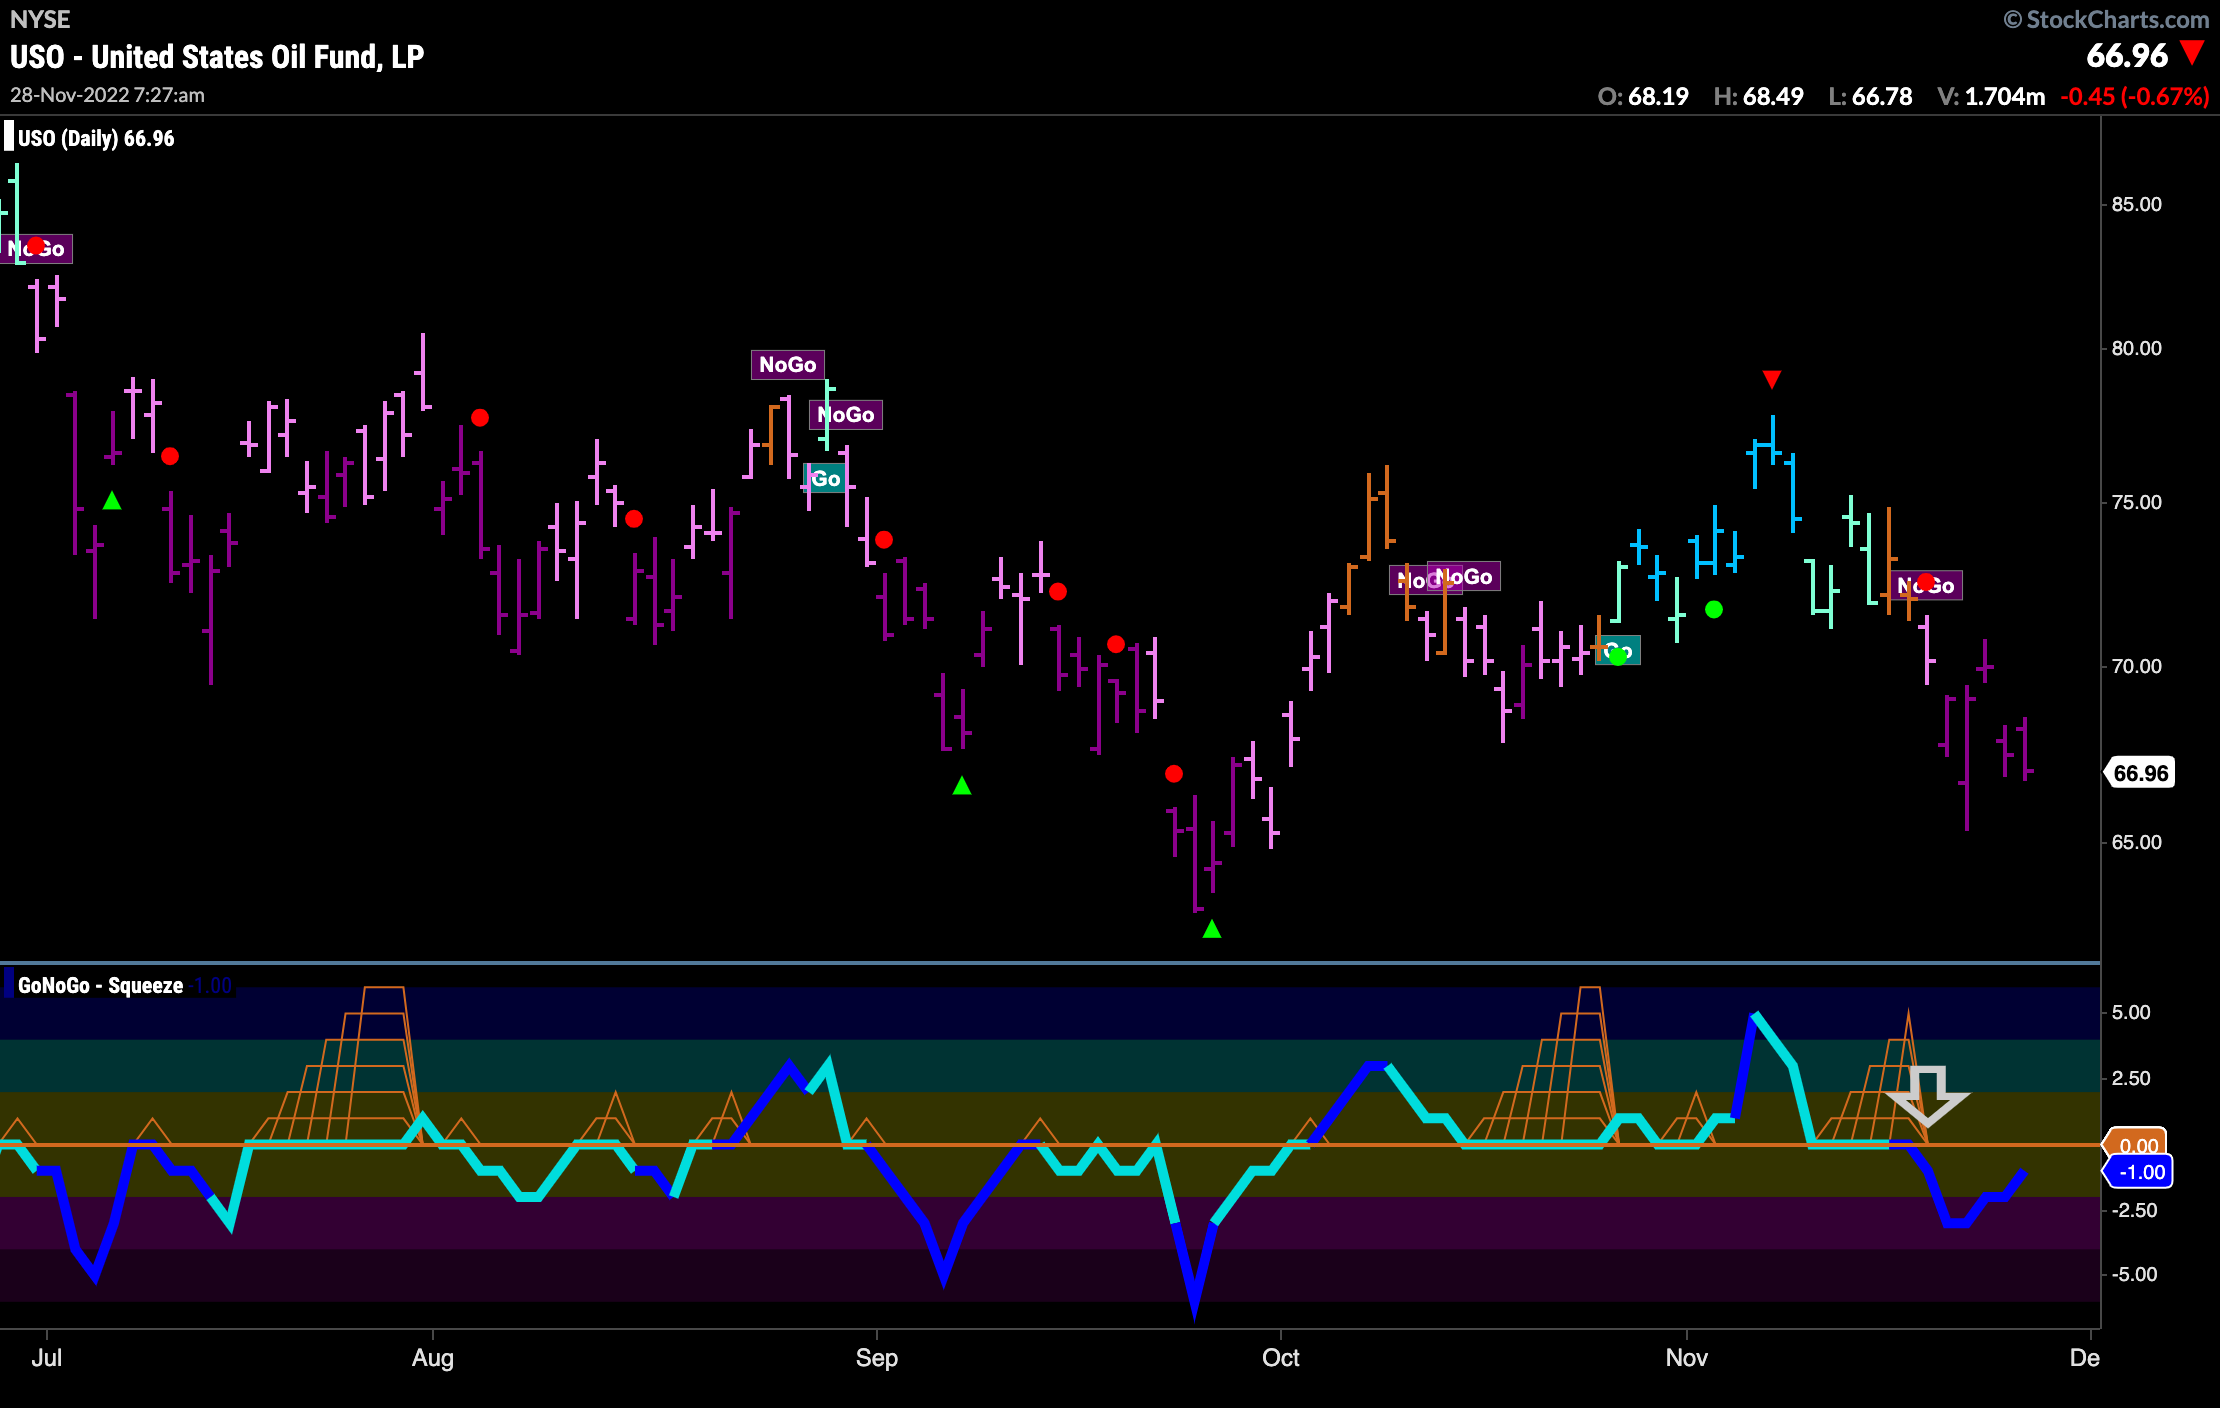
“NoGo” Strengthens in Oil This Week
This week we saw the “NoGo” remain strong, painting purple bars. GoNoGo Oscillator crashed through the zero line out of a GoNoGo Squeeze just over a week ago and on heavy volume. We will see if this surging momentum will encourage price to make an attack on prior lows from the end of September.
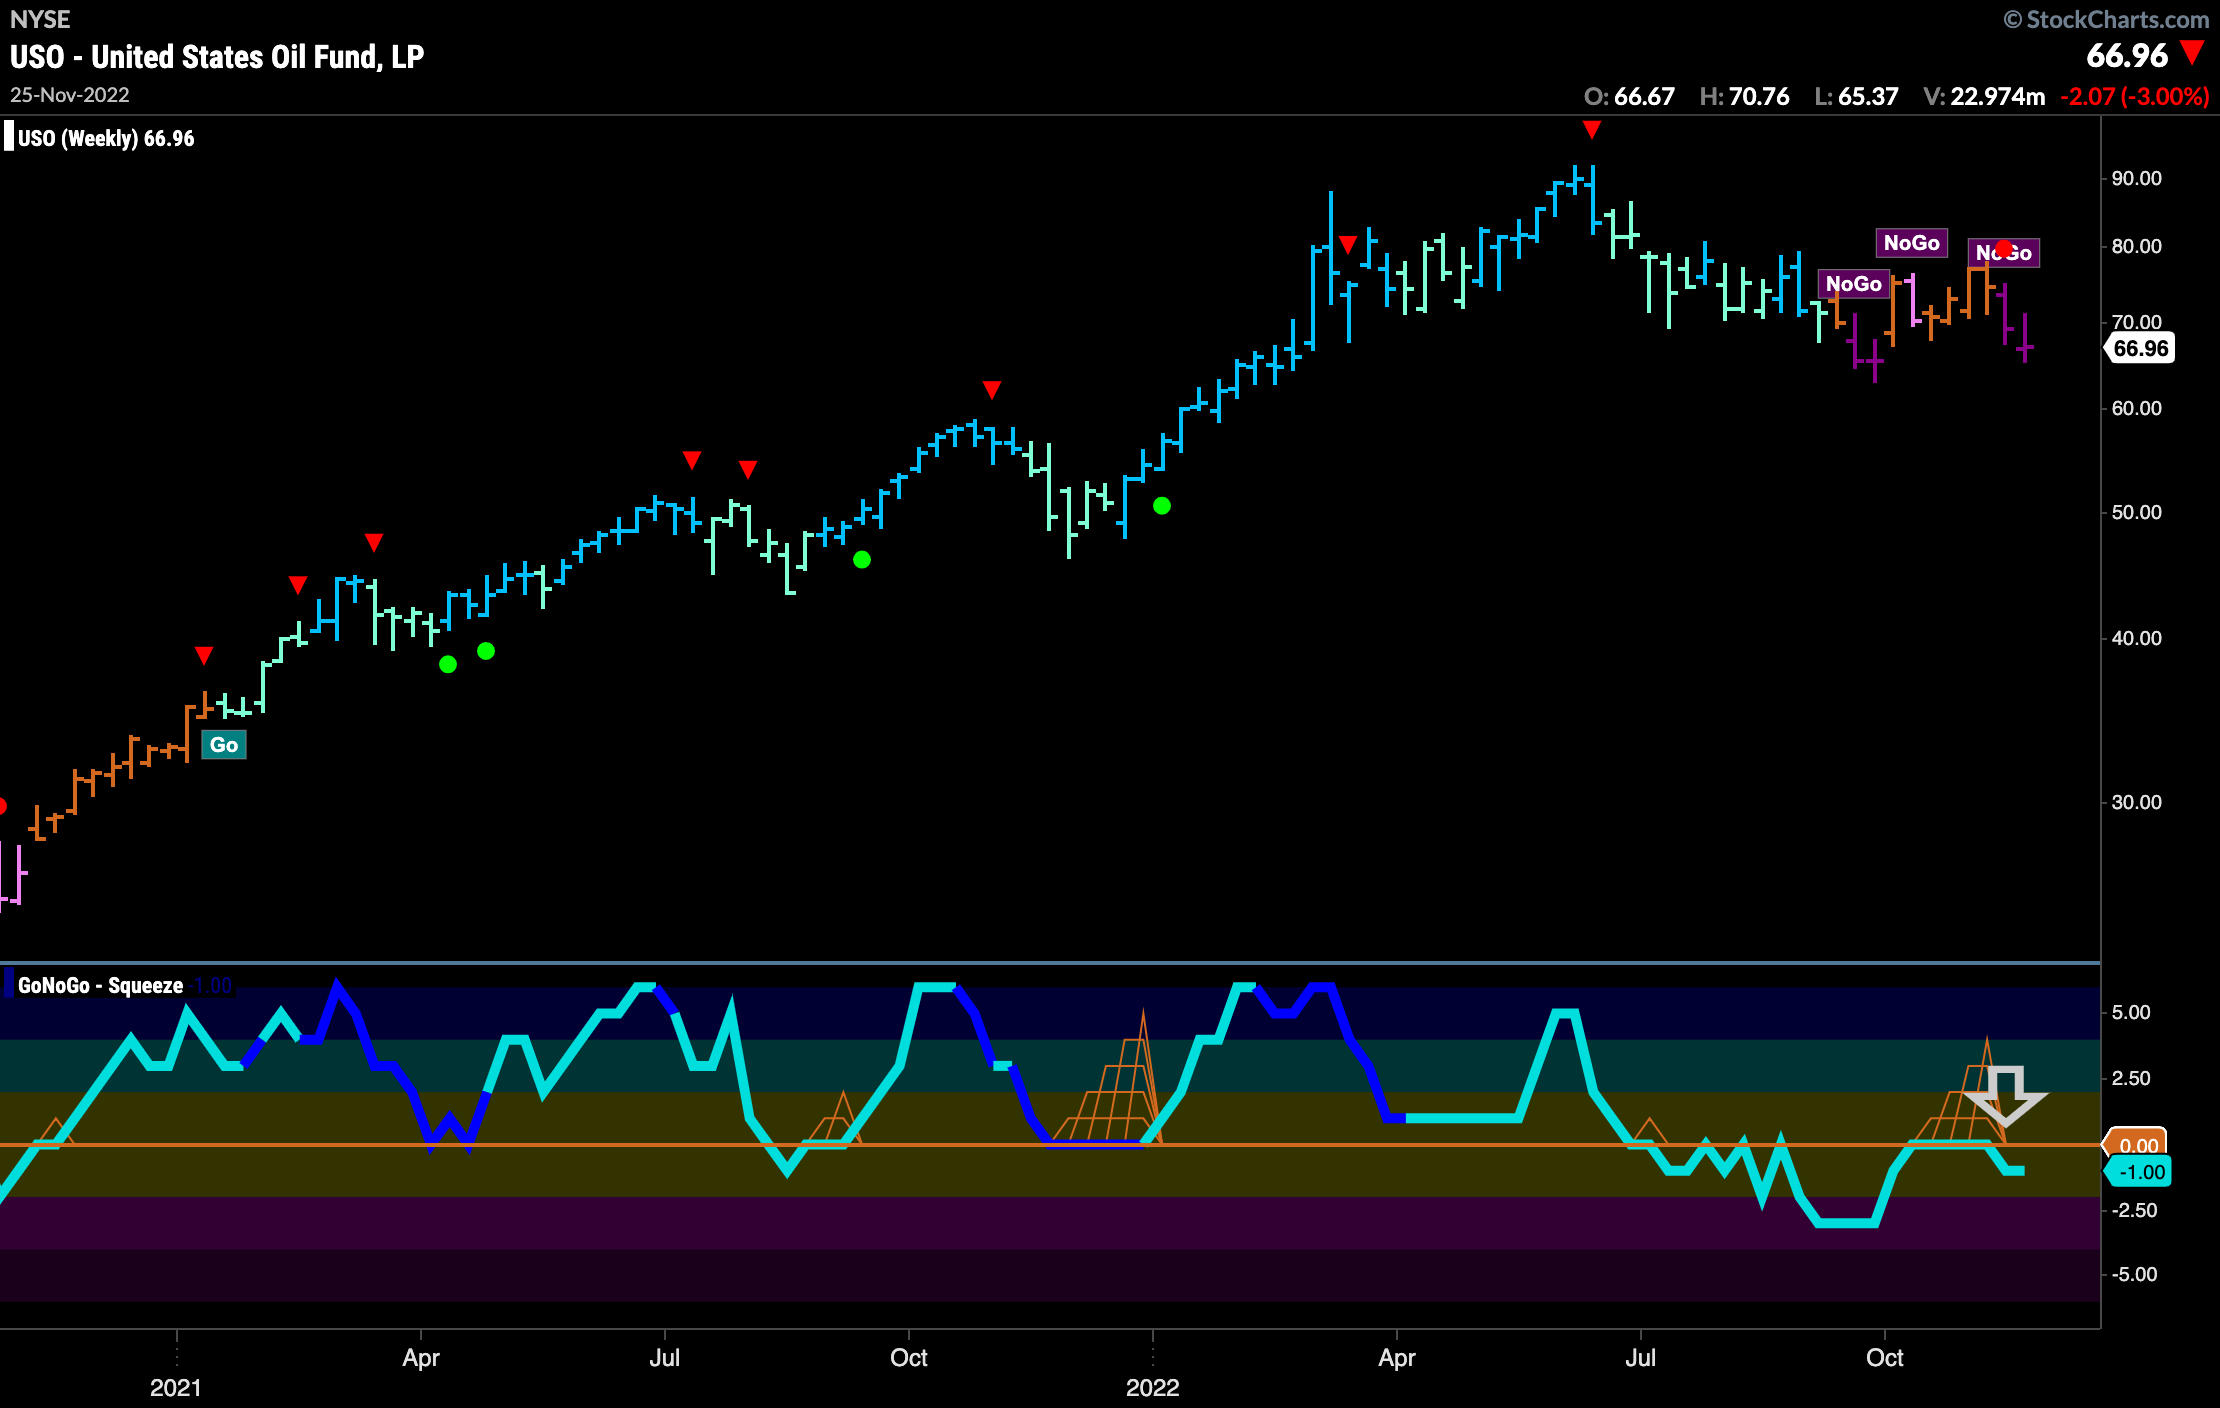
The larger timeframe suggests that the “NoGo” will prevail. Painting a second straight purple “NoGo” bar GoNoGo Trend shows the trend is firmly in place. GoNoGo Oscillator was riding the zero line and we saw a GoNoGo Squeeze build but this was quickly broken to the downside. Now we see GoNoGo Oscillator moving back into negative territory confirming the “NoGo” trend seen in price above.
Sector RelMap
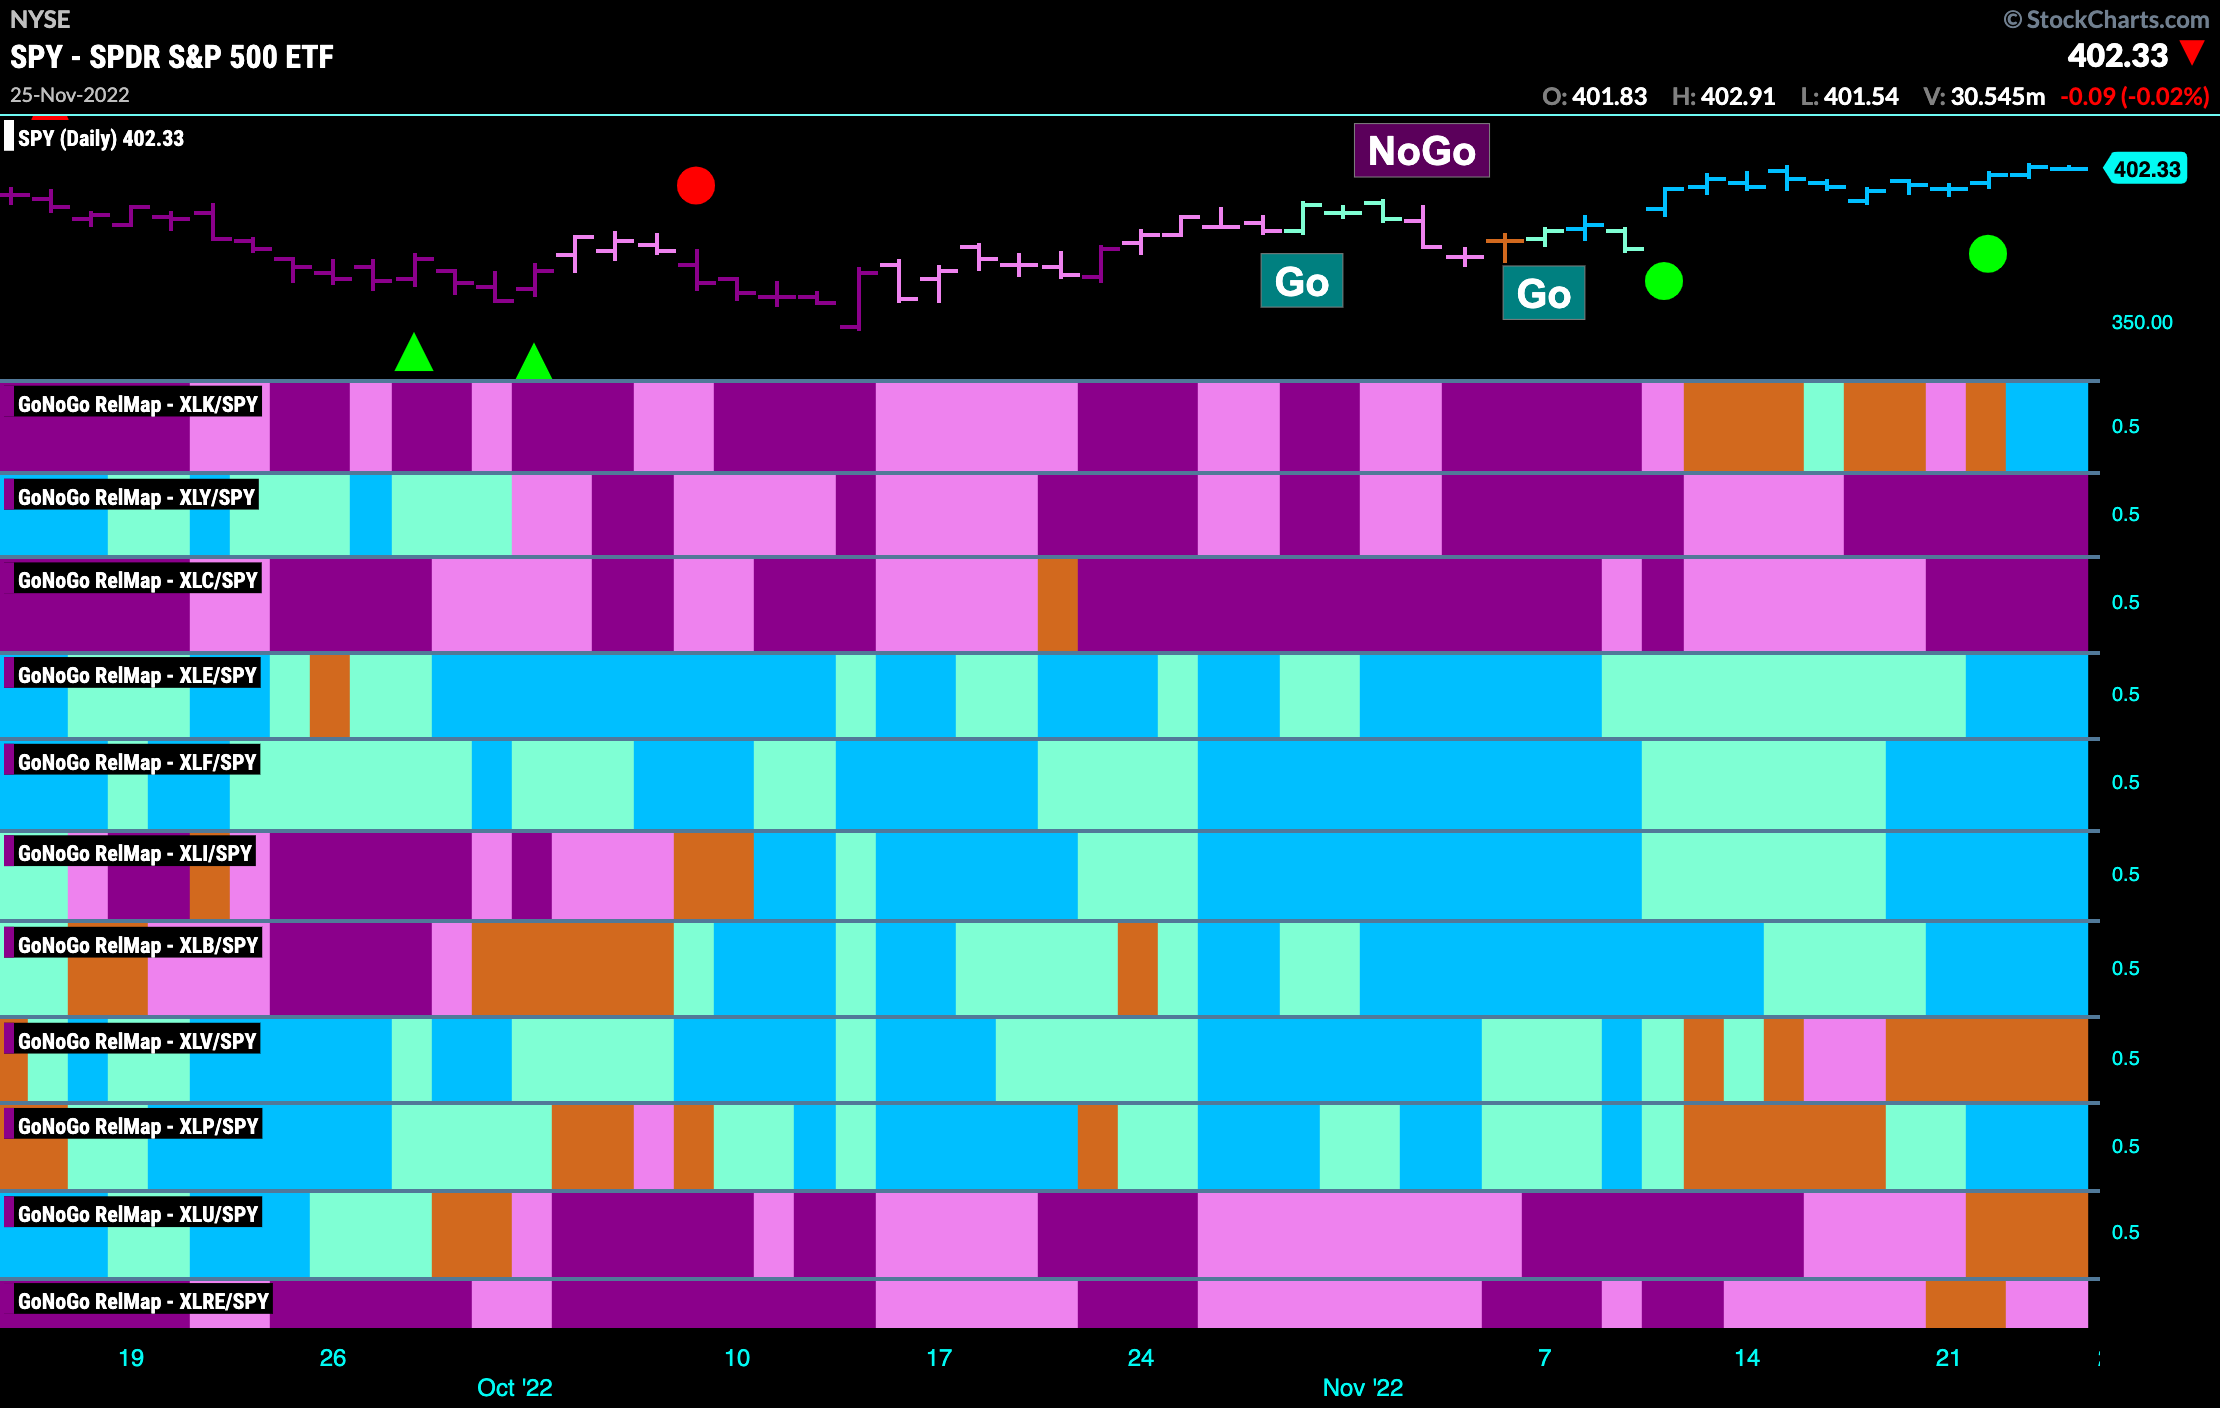
Below is the GoNoGo Sector RelMap. This GoNoGo RelMap applies the GoNoGo Trend to the relative strength ratios of the sectors to the base index. Looking at this map, we can quickly see where the relative outperformance is coming from as well as which sectors are lagging on a relative basis. While the relative out-performers remain mostly the same, there is a newcomer this week as $XLK paints strong blue bars. This will encourage the bulls who like to see some growth stocks push stock markets higher.
$XLK Finds Momentum Support
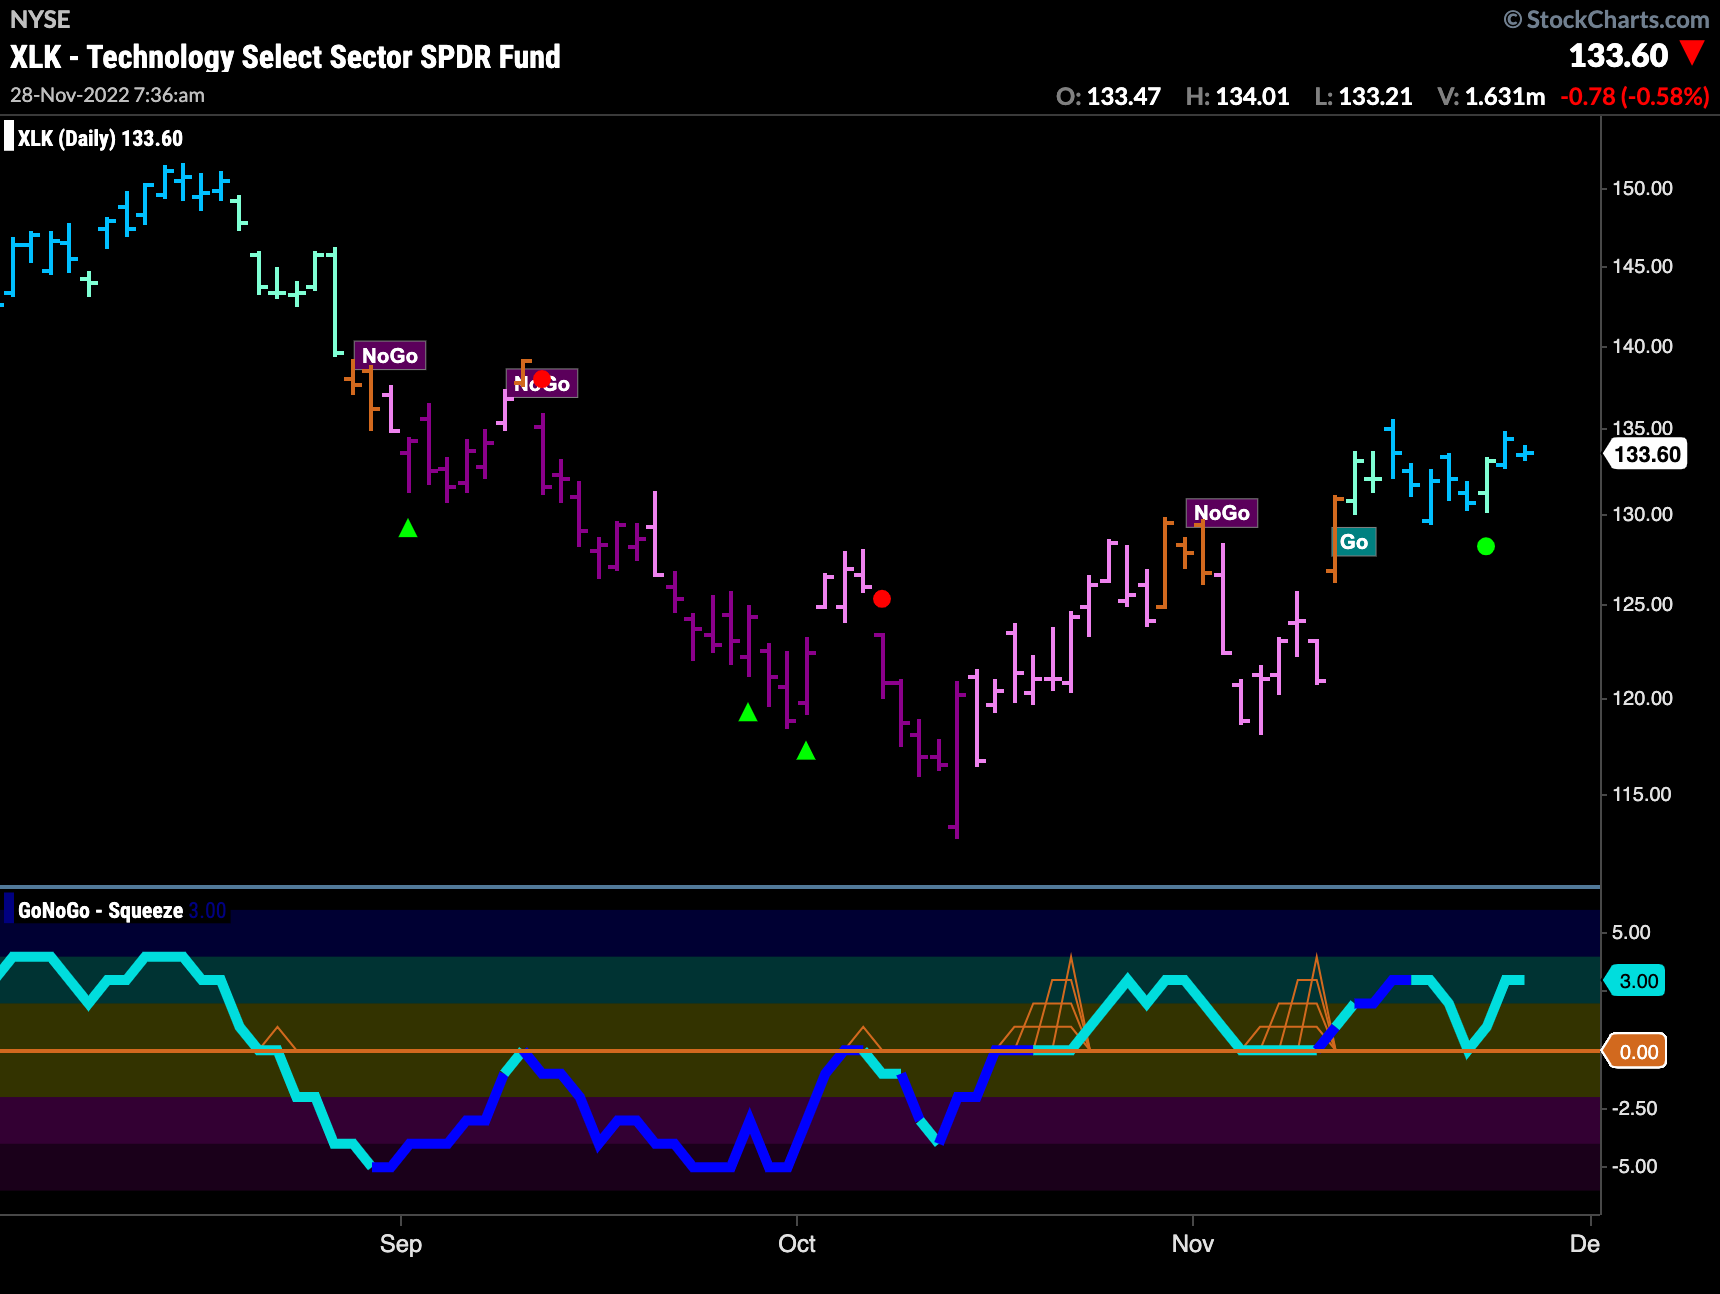
GoNoGo Trend shows that there is a “Go” trend in place for technology stocks. After flagging a “Go” trend a few weeks ago we saw price consolidate mostly sideways and Wednesday of last week saw a weaker aqua bar. However, the end of the week saw a return to strength on blue bars. At the same time, GoNoGo Oscillator found immediate support at the zero line telling us that momentum is once again in the direction of the “Go” trend. We will look for price to make a new high this week.
$ADBE Well Positioned to Fill Gap
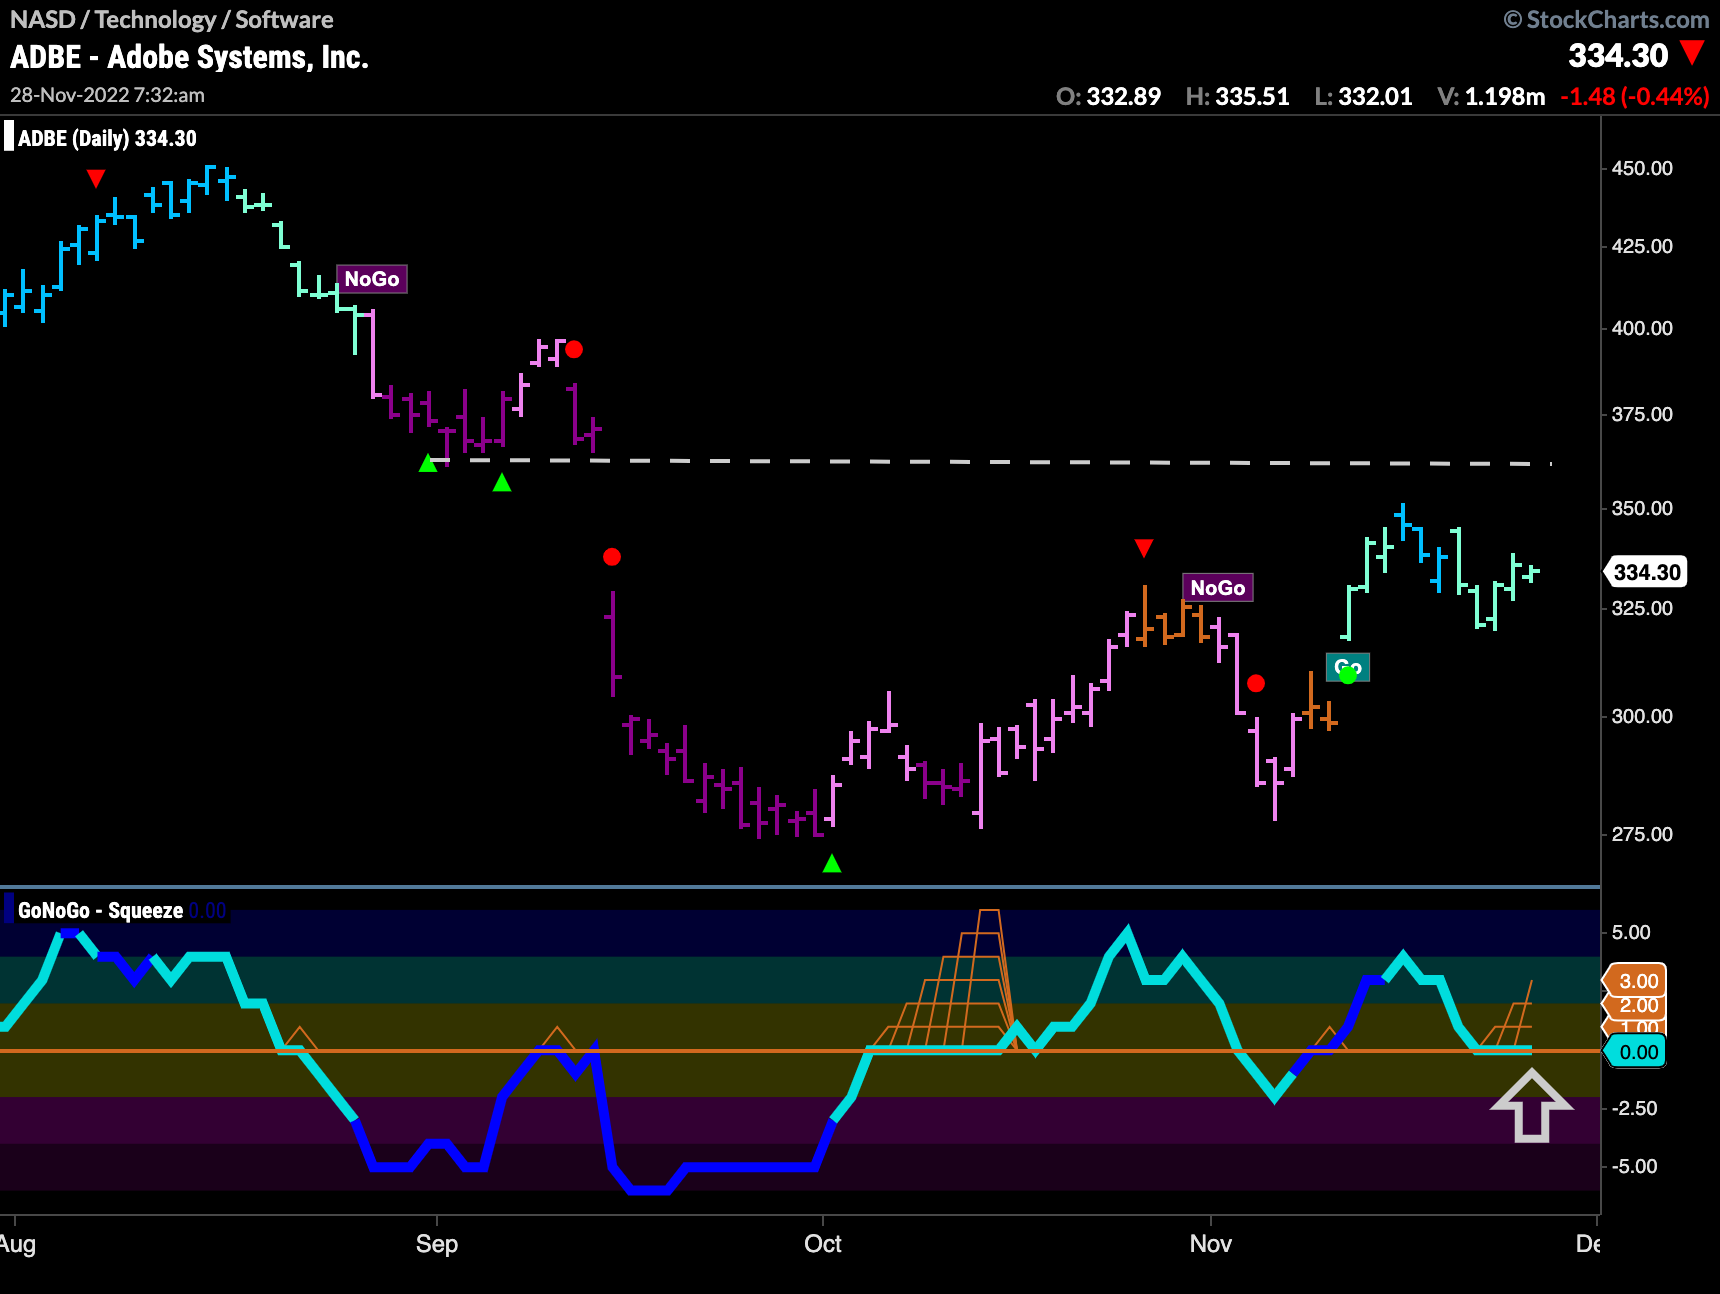
With the pure and relative “Go” trends in the technology sector enticing many investors, let’s look at the chart below of $ADBE. We can see that the “Go” trend is in place, however, it has weakened to aqua bars as price consolidates from recent highs. This has caused GoNoGo Oscillator to fall to test the zero line from above. We will look to see if it can break free from the building GoNoGo Squeeze and return to positive territory. If it does, this would suggest that price has the push it needs to set a new high and fill the gap from September.
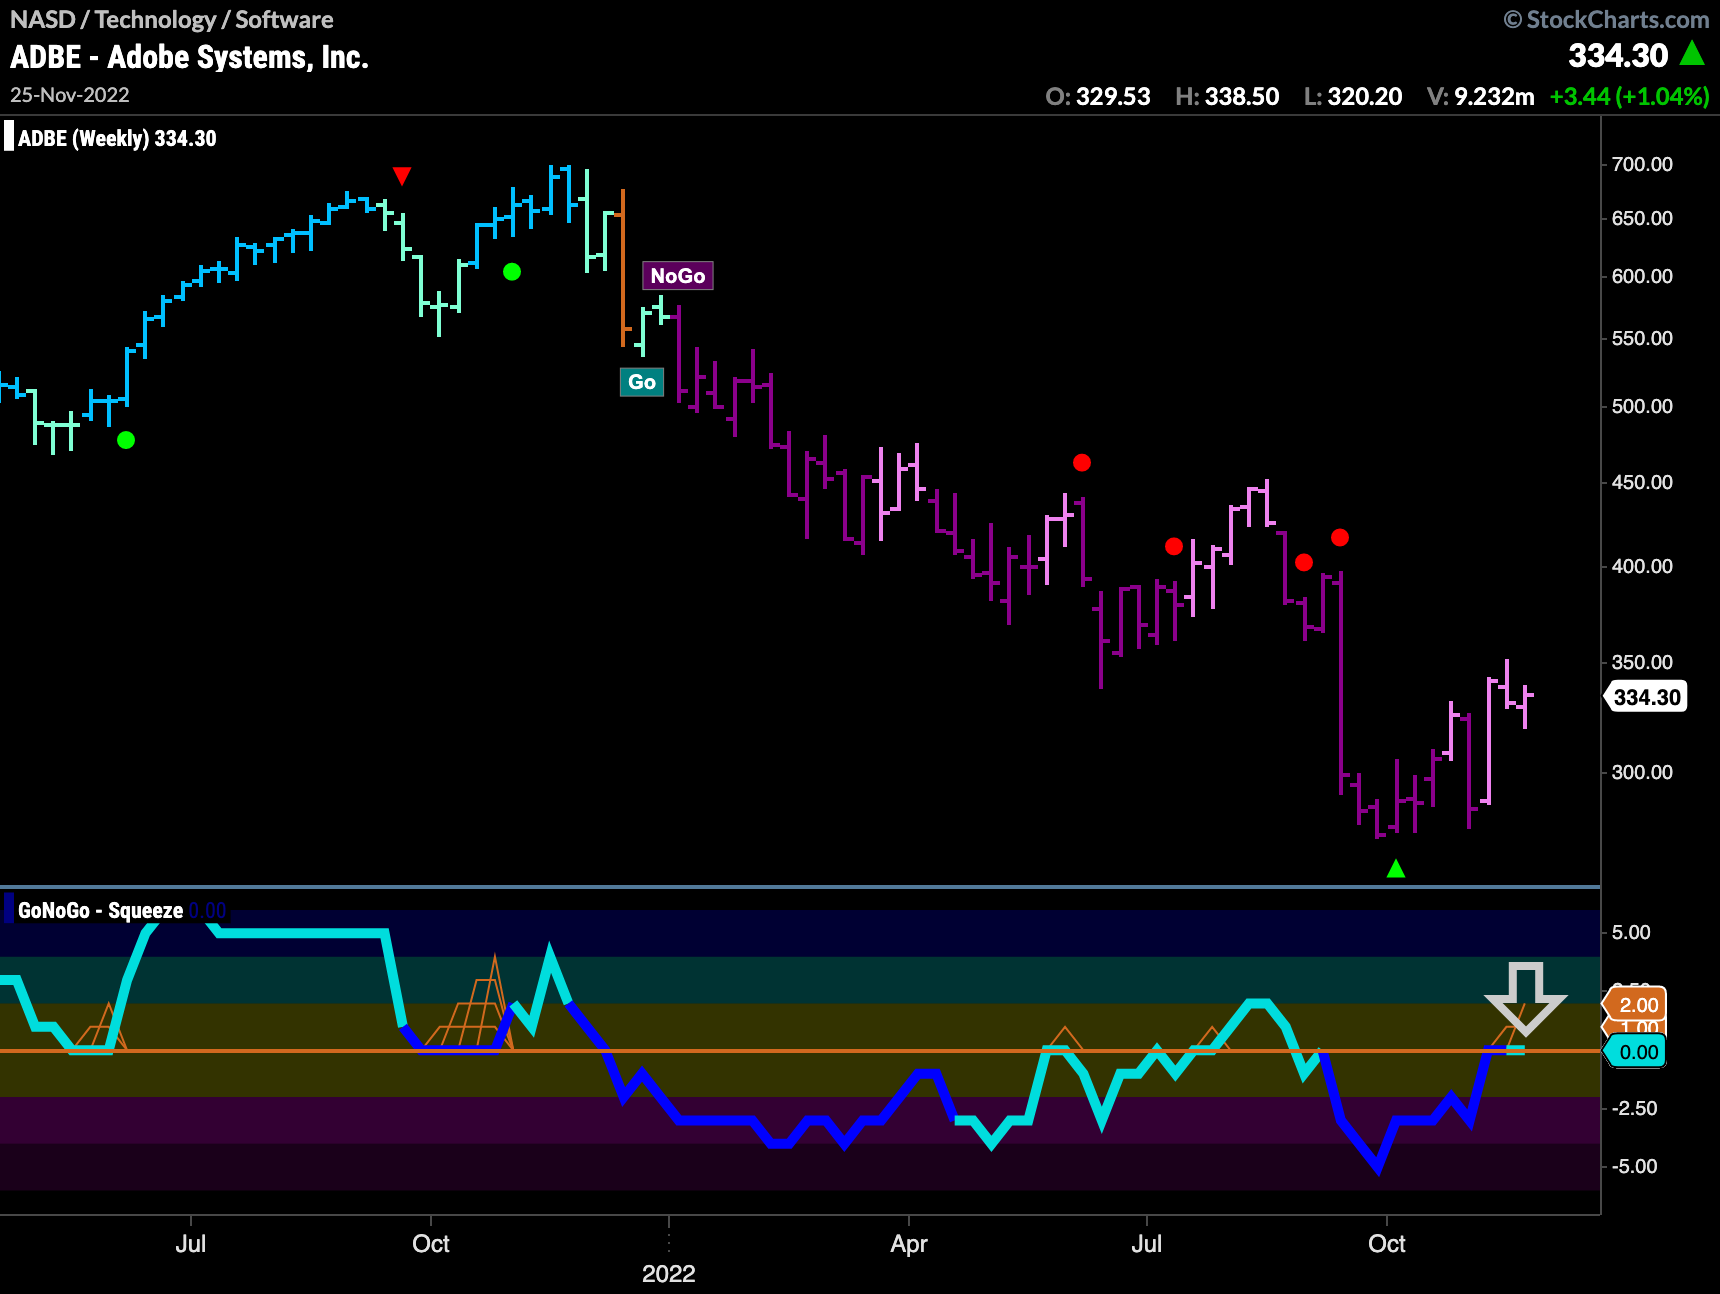
For the above bullish scenario to play out, it would be nice to see confirmation from the larger time frame chart. We can see on the weekly chart below that GoNoGo Trend is painting weaker pink “NoGo” bars as GoNoGo Oscillator tests the zero line from below. If GoNoGo Oscillator can break above the zero line that would be an encouraging sign that the “NoGo” is in trouble.
