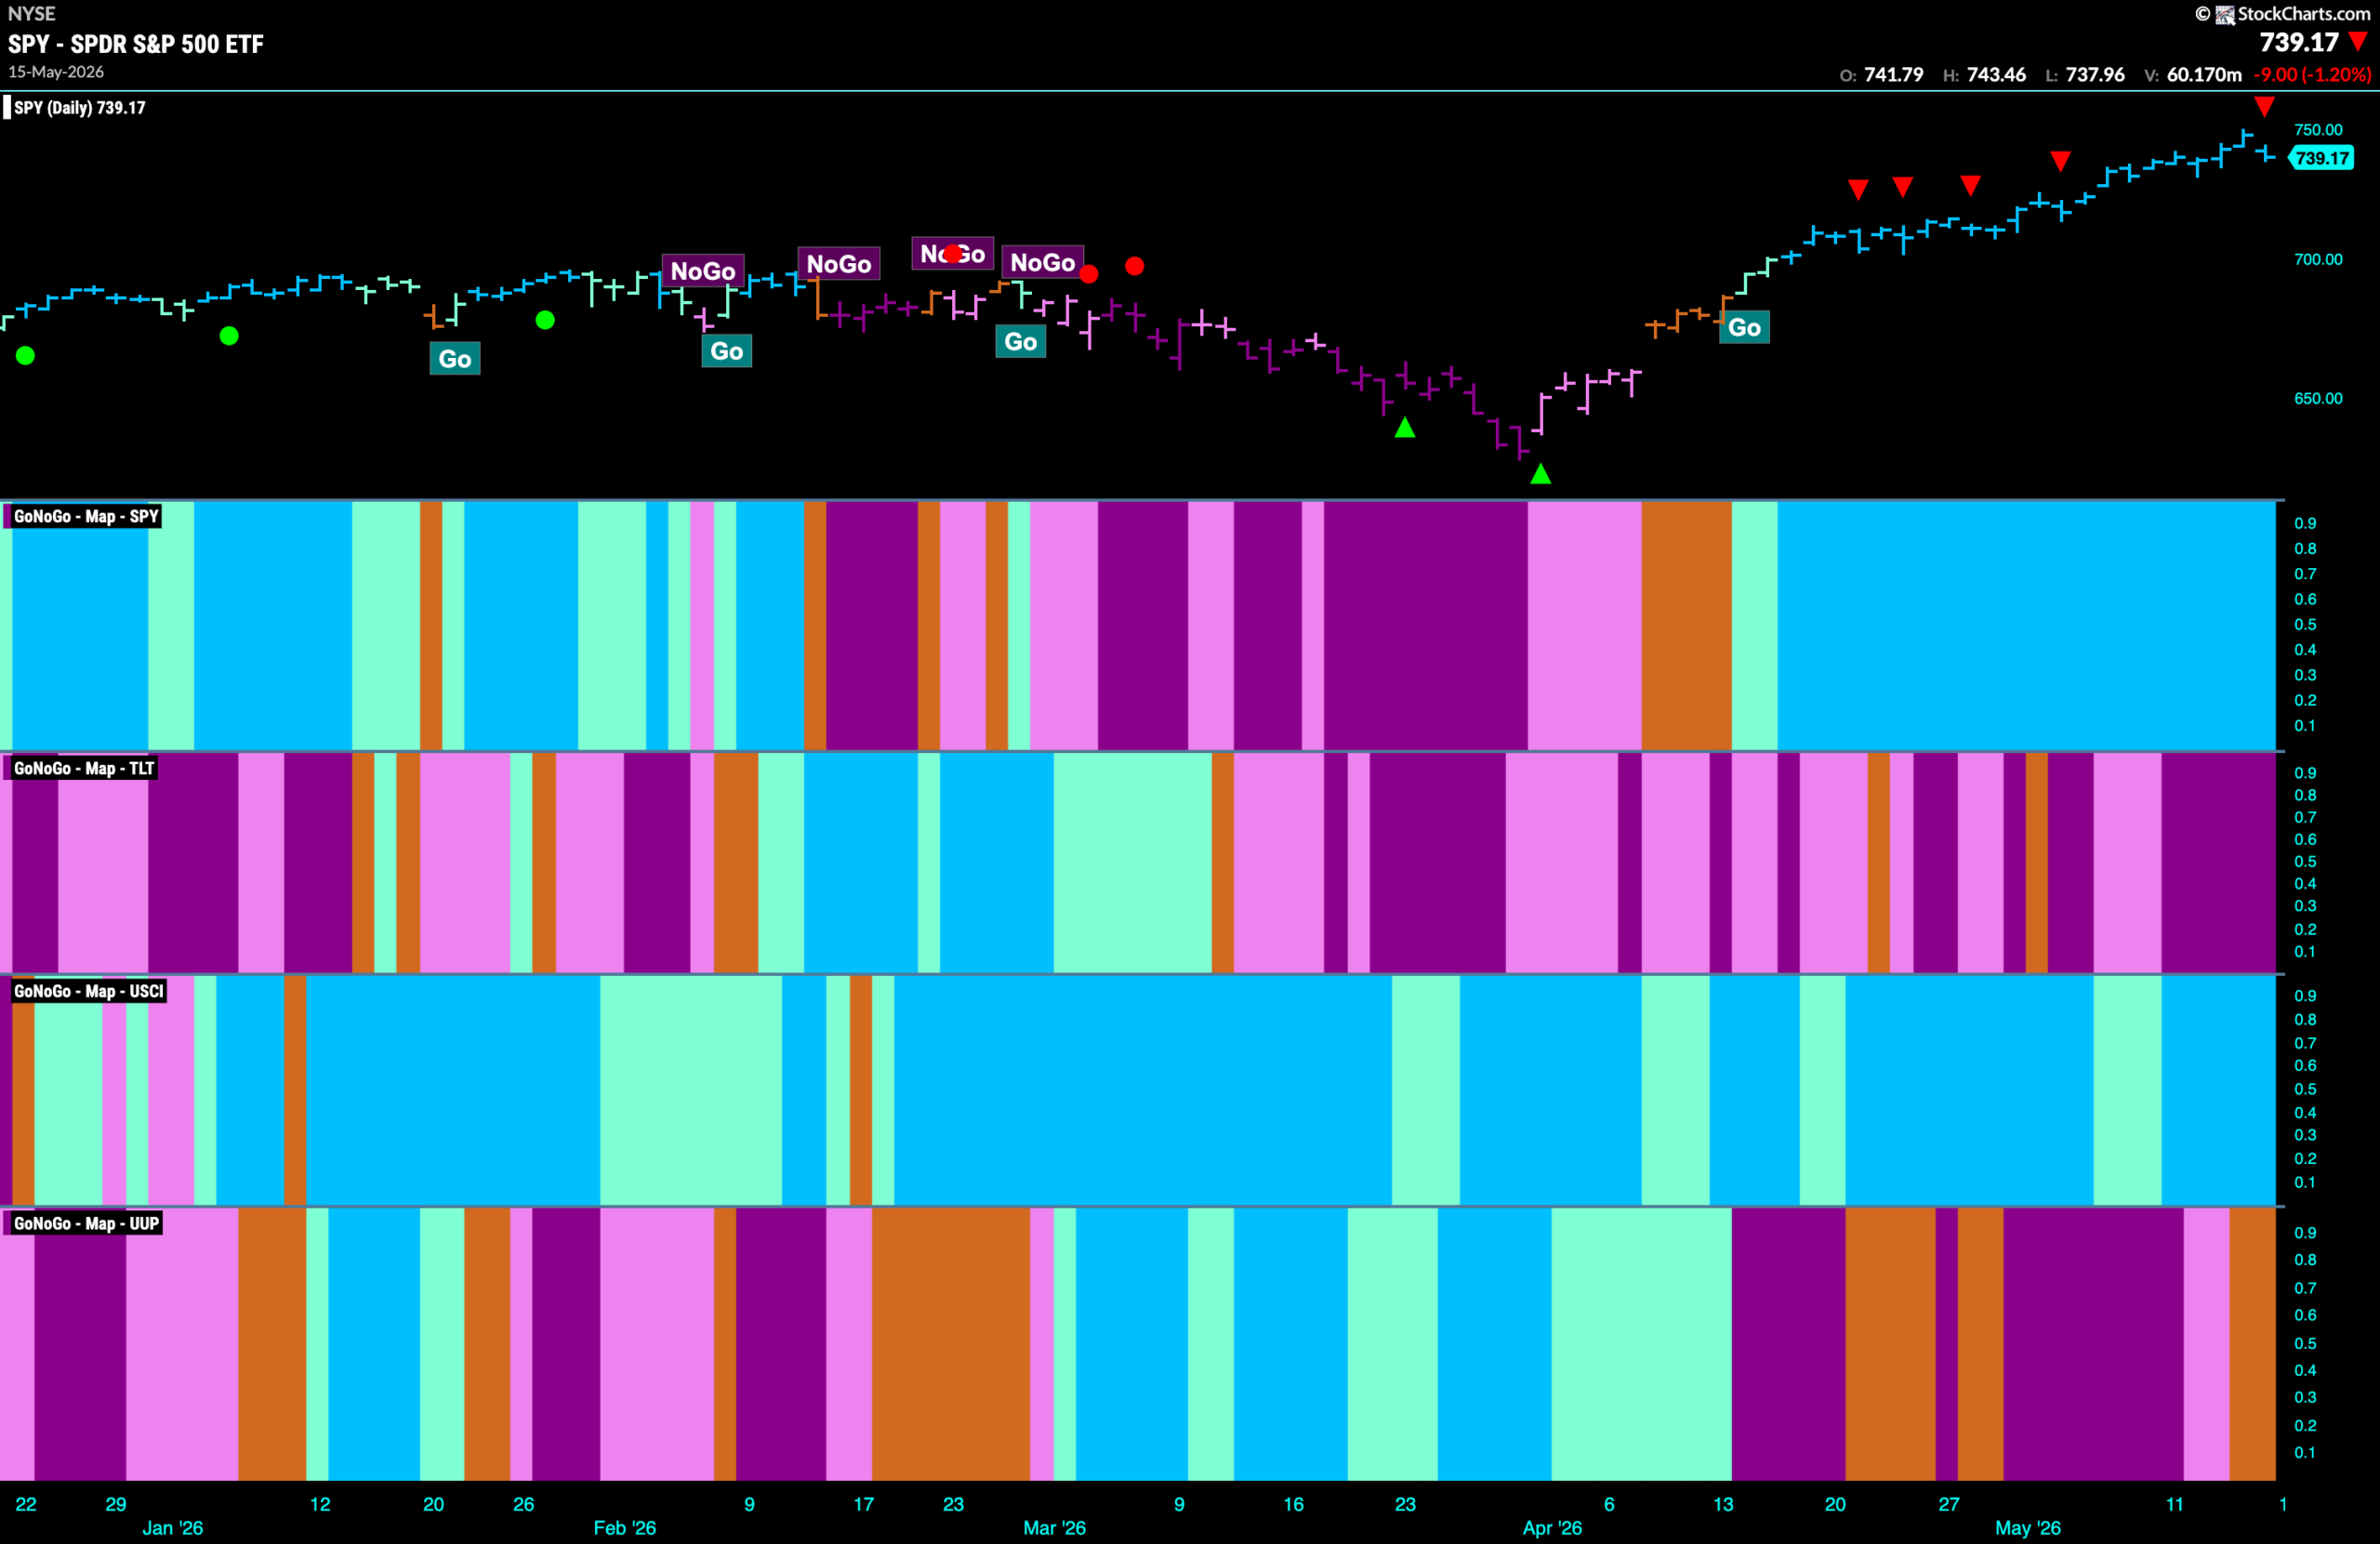
Good morning and welcome to this week’s Flight Path. The equity trend has been incredibly strong for another week as we see the indicator paint a string of bright blue “Go” bars as price hits another high. Treasury bond prices remain in a “NoGo” trend and we see strong purple bars for the entire week. U.S. commodities are still in a “Go” trend and we see strong blue bars this past week. The dollar has climbed out of a “NoGo” trend and we see market uncertainty with amber “Go Fish” bars.
$SPY Sets New Higher High Last Week
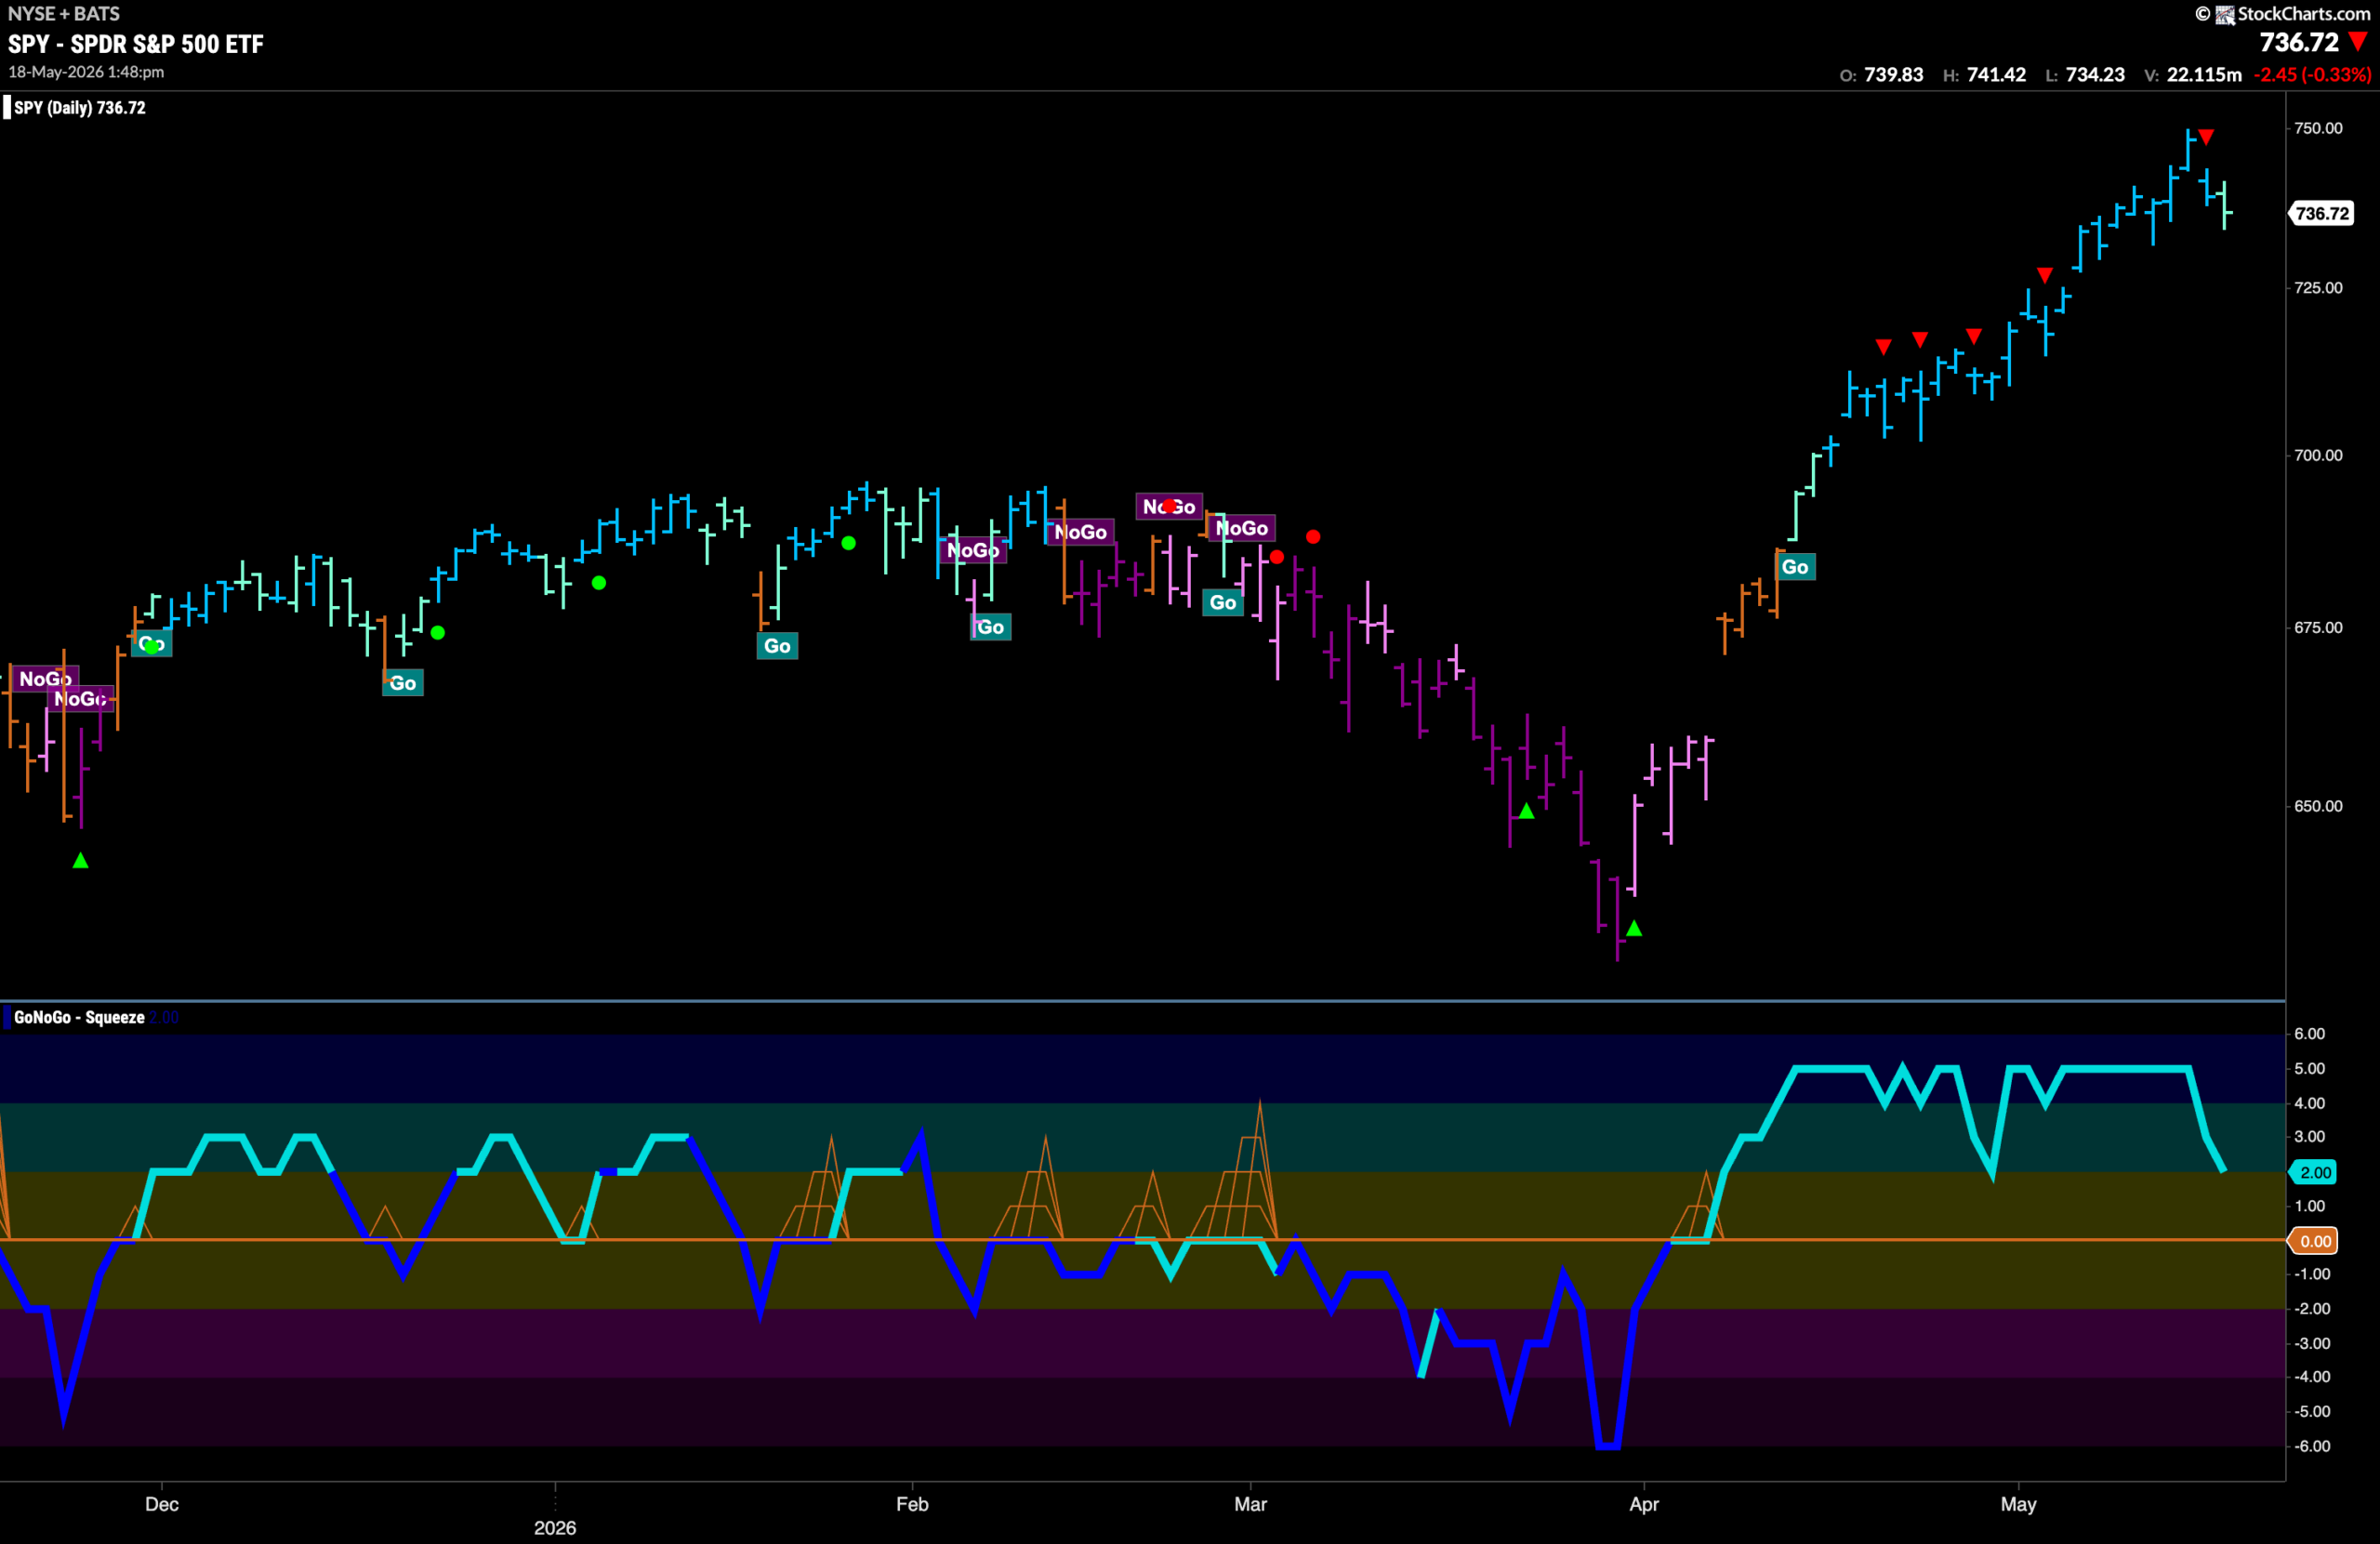
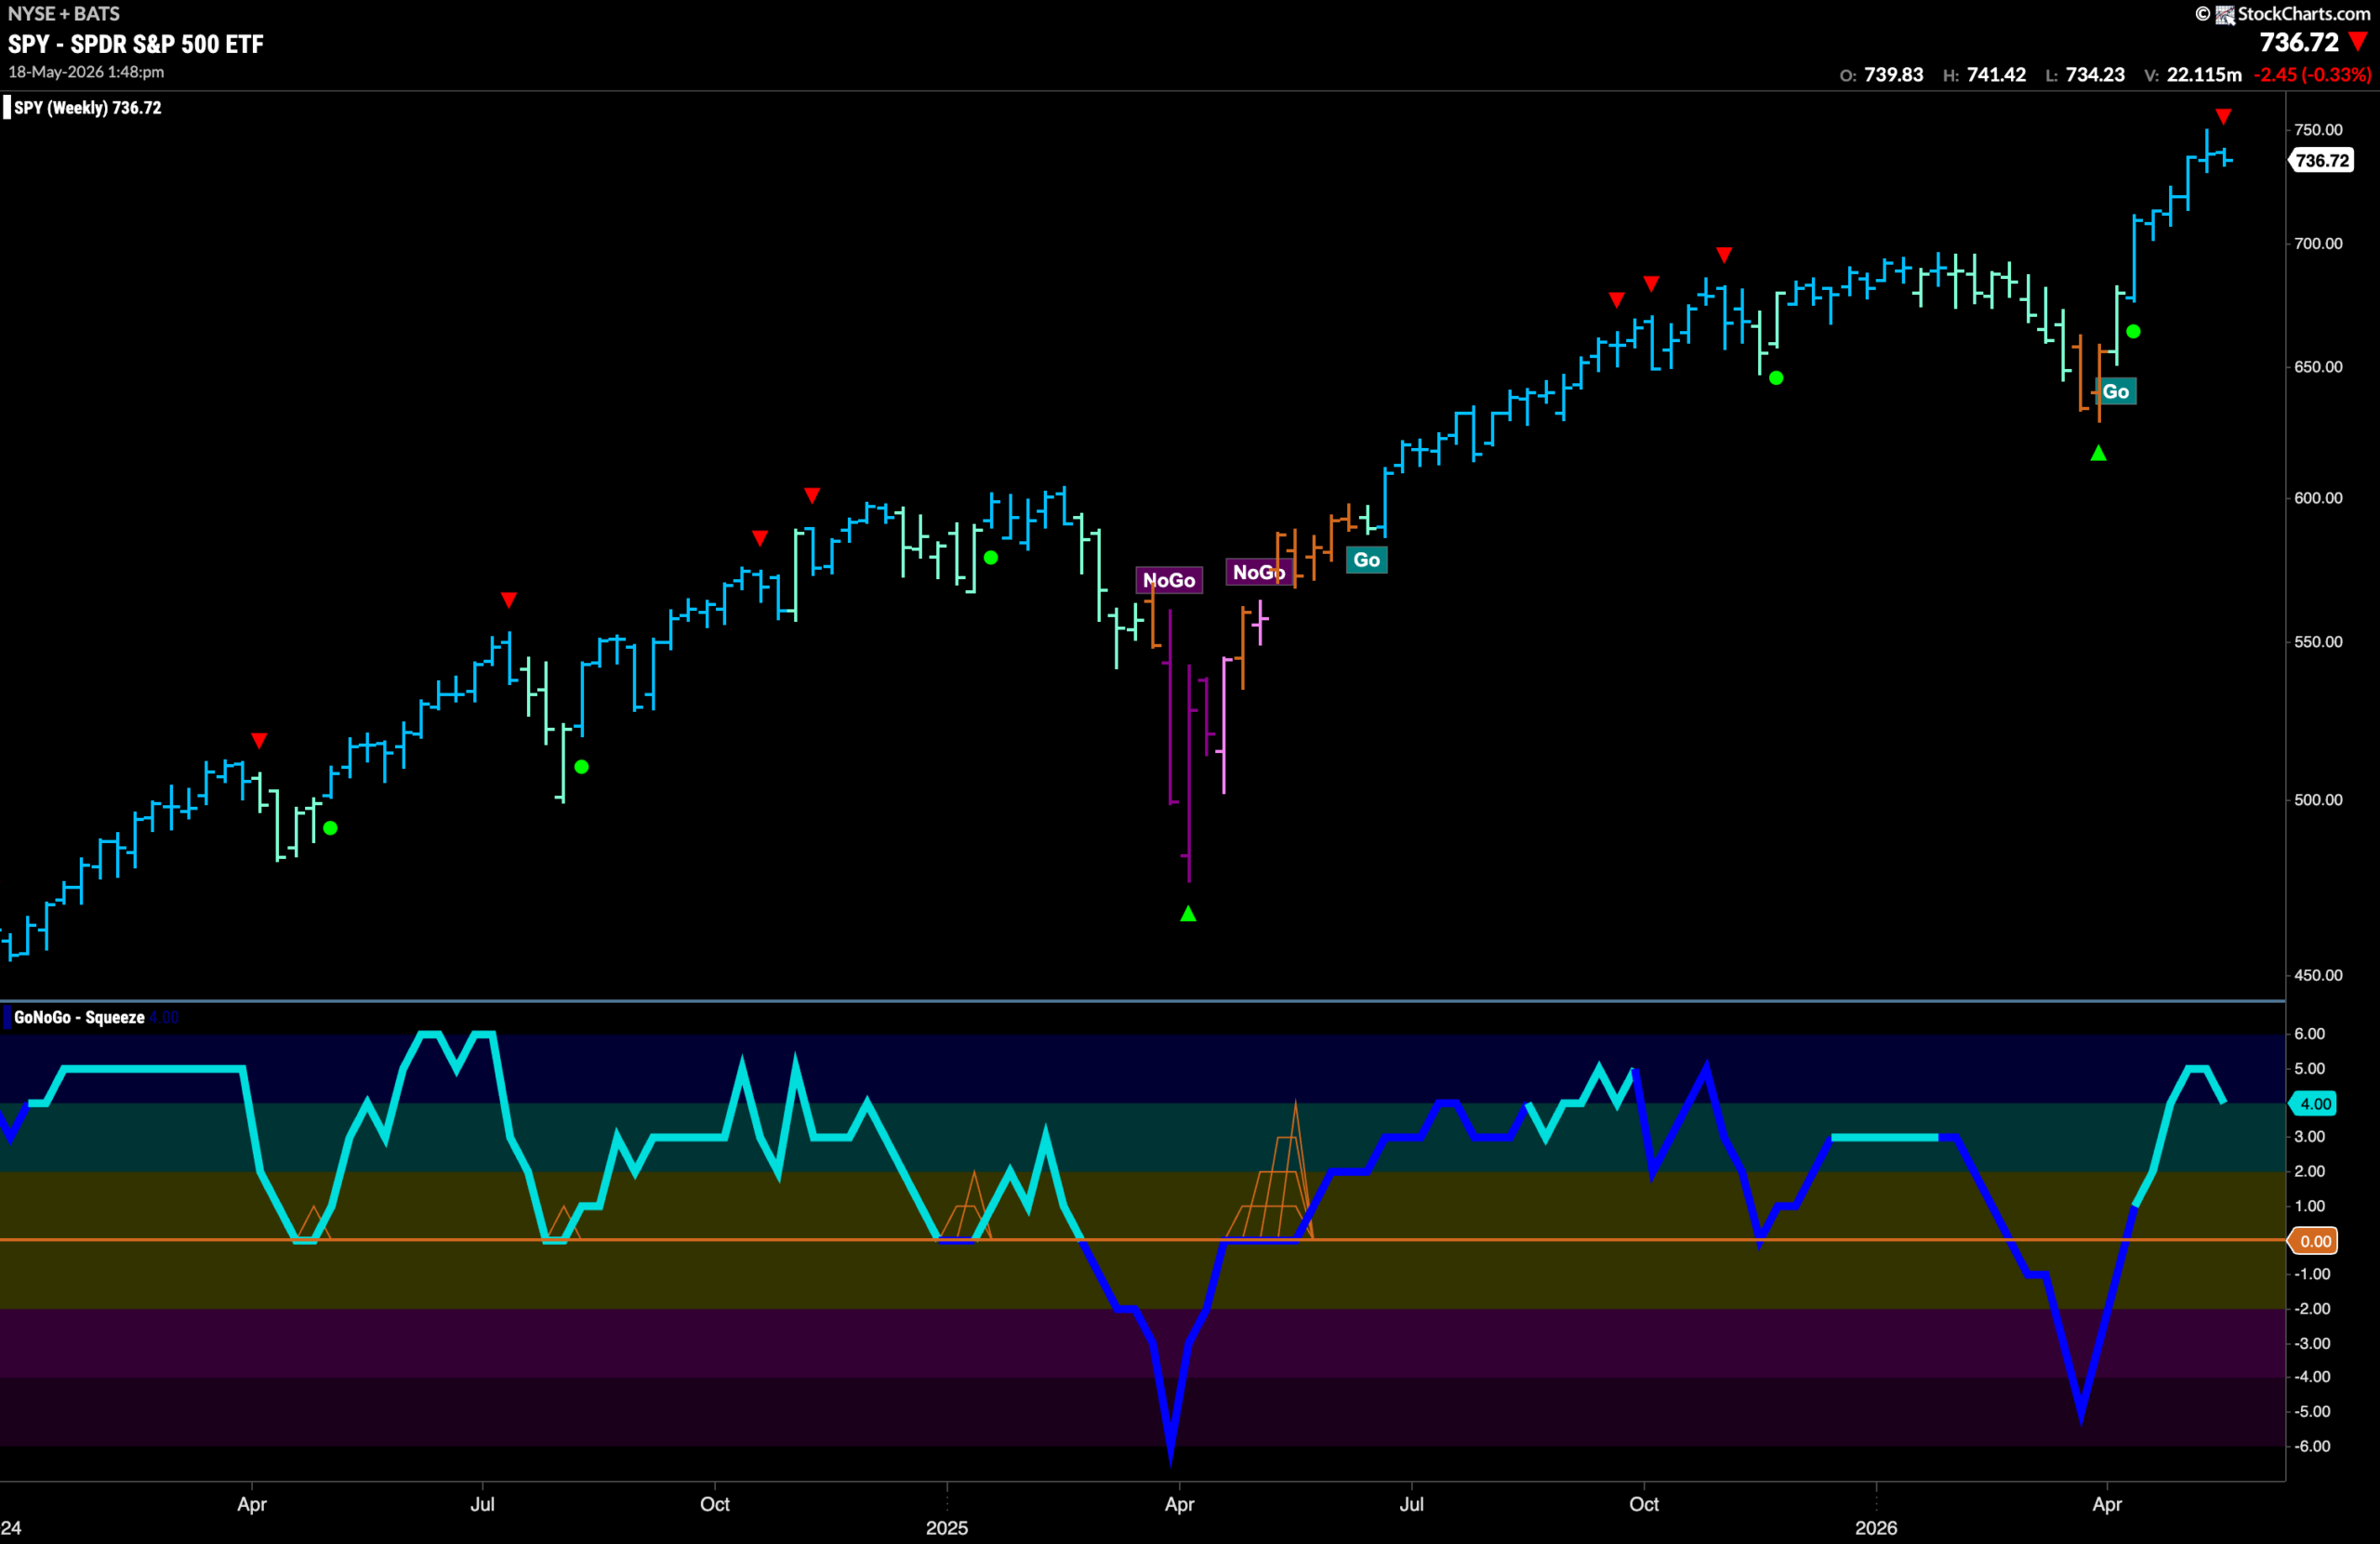
The GoNoGo chart below shows that the “Go” trend has remained for U.S. equities with the indicator painting “Go” bars and price hitting another higher high. After the high, we do see a Go Countertrend Correction Icon (red arrow) indicating that price may struggle to go higher in the short term due to waning momentum. If we look at the lower panel we can see that GoNoGo Oscillator has fallen out of overbought territory and is fast approaching the zero line where we will watch to see if it finds support.
The weekly chart shows that the GoNoGo Trend indicator paints another strong blue weekly “Go” bar as price continues its climb. On the larger time frame chart we also see a Go Countertrend Correction Icon (red arrow) as momentum cools. We can see in the lower panel that the oscillator is falling out of overbought territory and is now at a value of 4.
Treasury Rates See the “Go” Trend Thrive
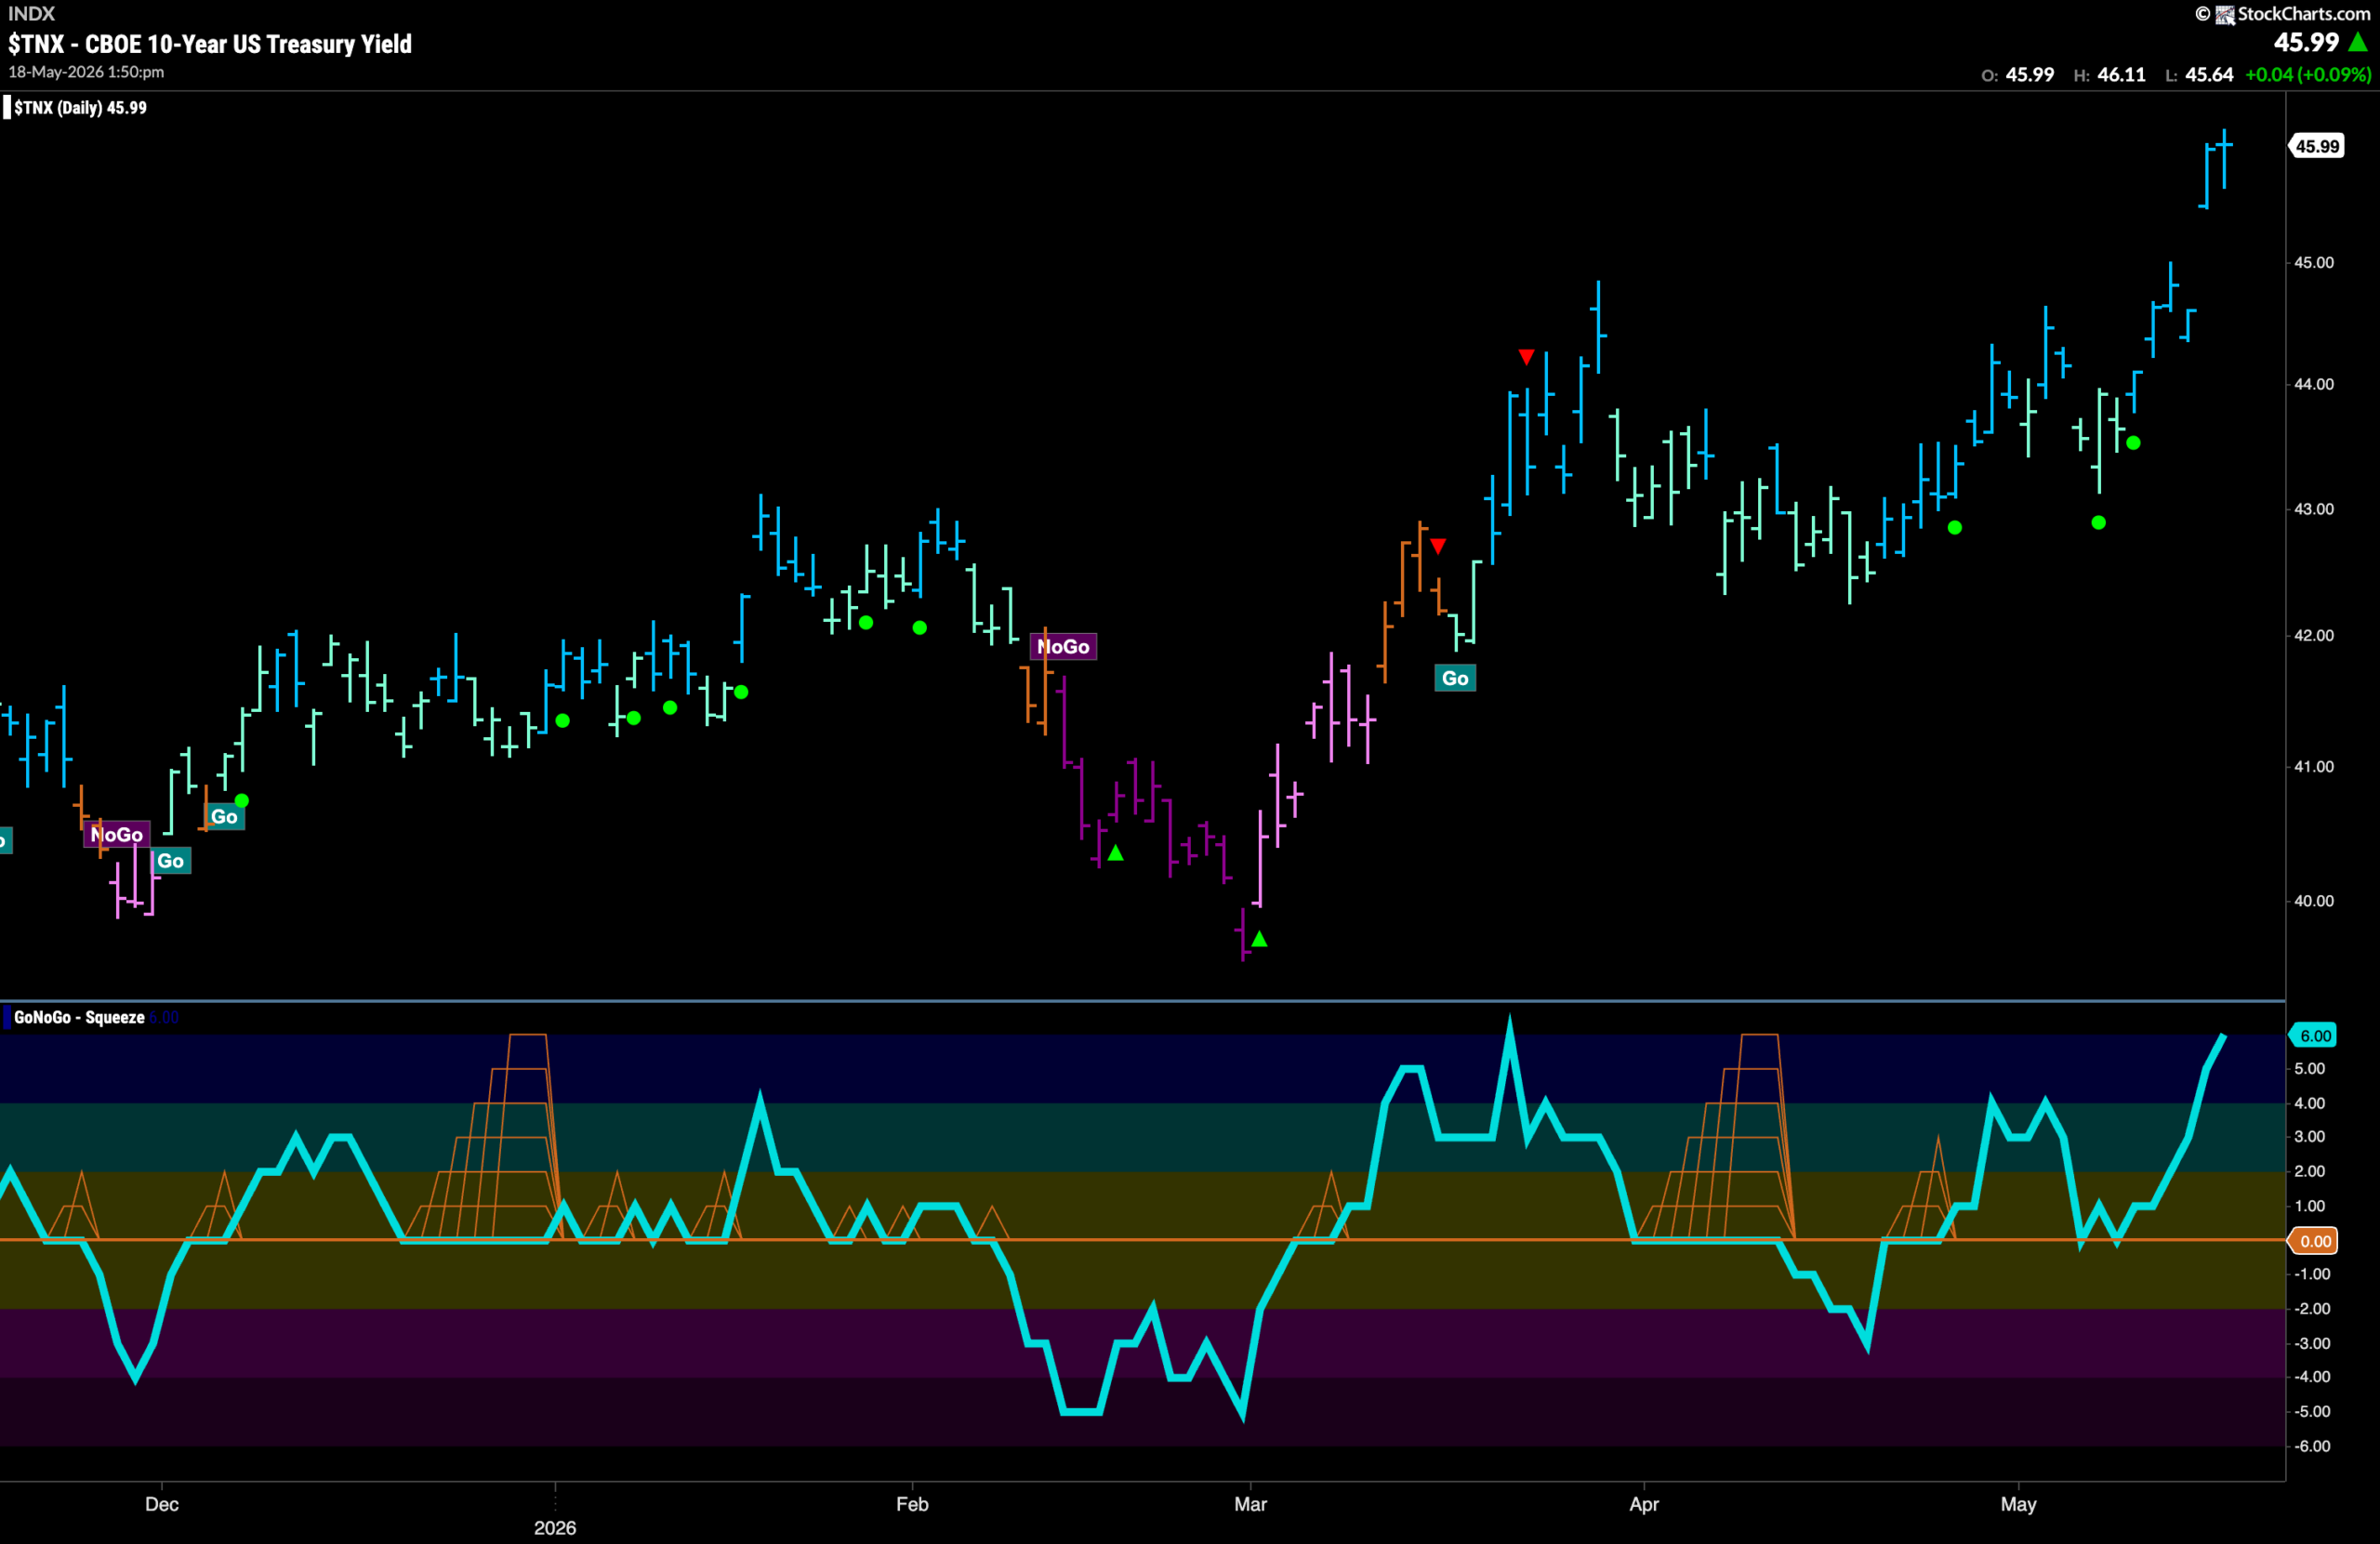
GoNoGo Trend shows that the “Go” trend hit new highs this week after rates gapped higher. This gap has taken out the resistance from March highs and we can expect support at the gap going forward if needed. GoNoGo Oscillator has raced into overbought territory and so we will watch to see if this market enthusiasm helps rates consolidate at these levels.
Dollar ($UUP) Re-Enters “Go” Trend
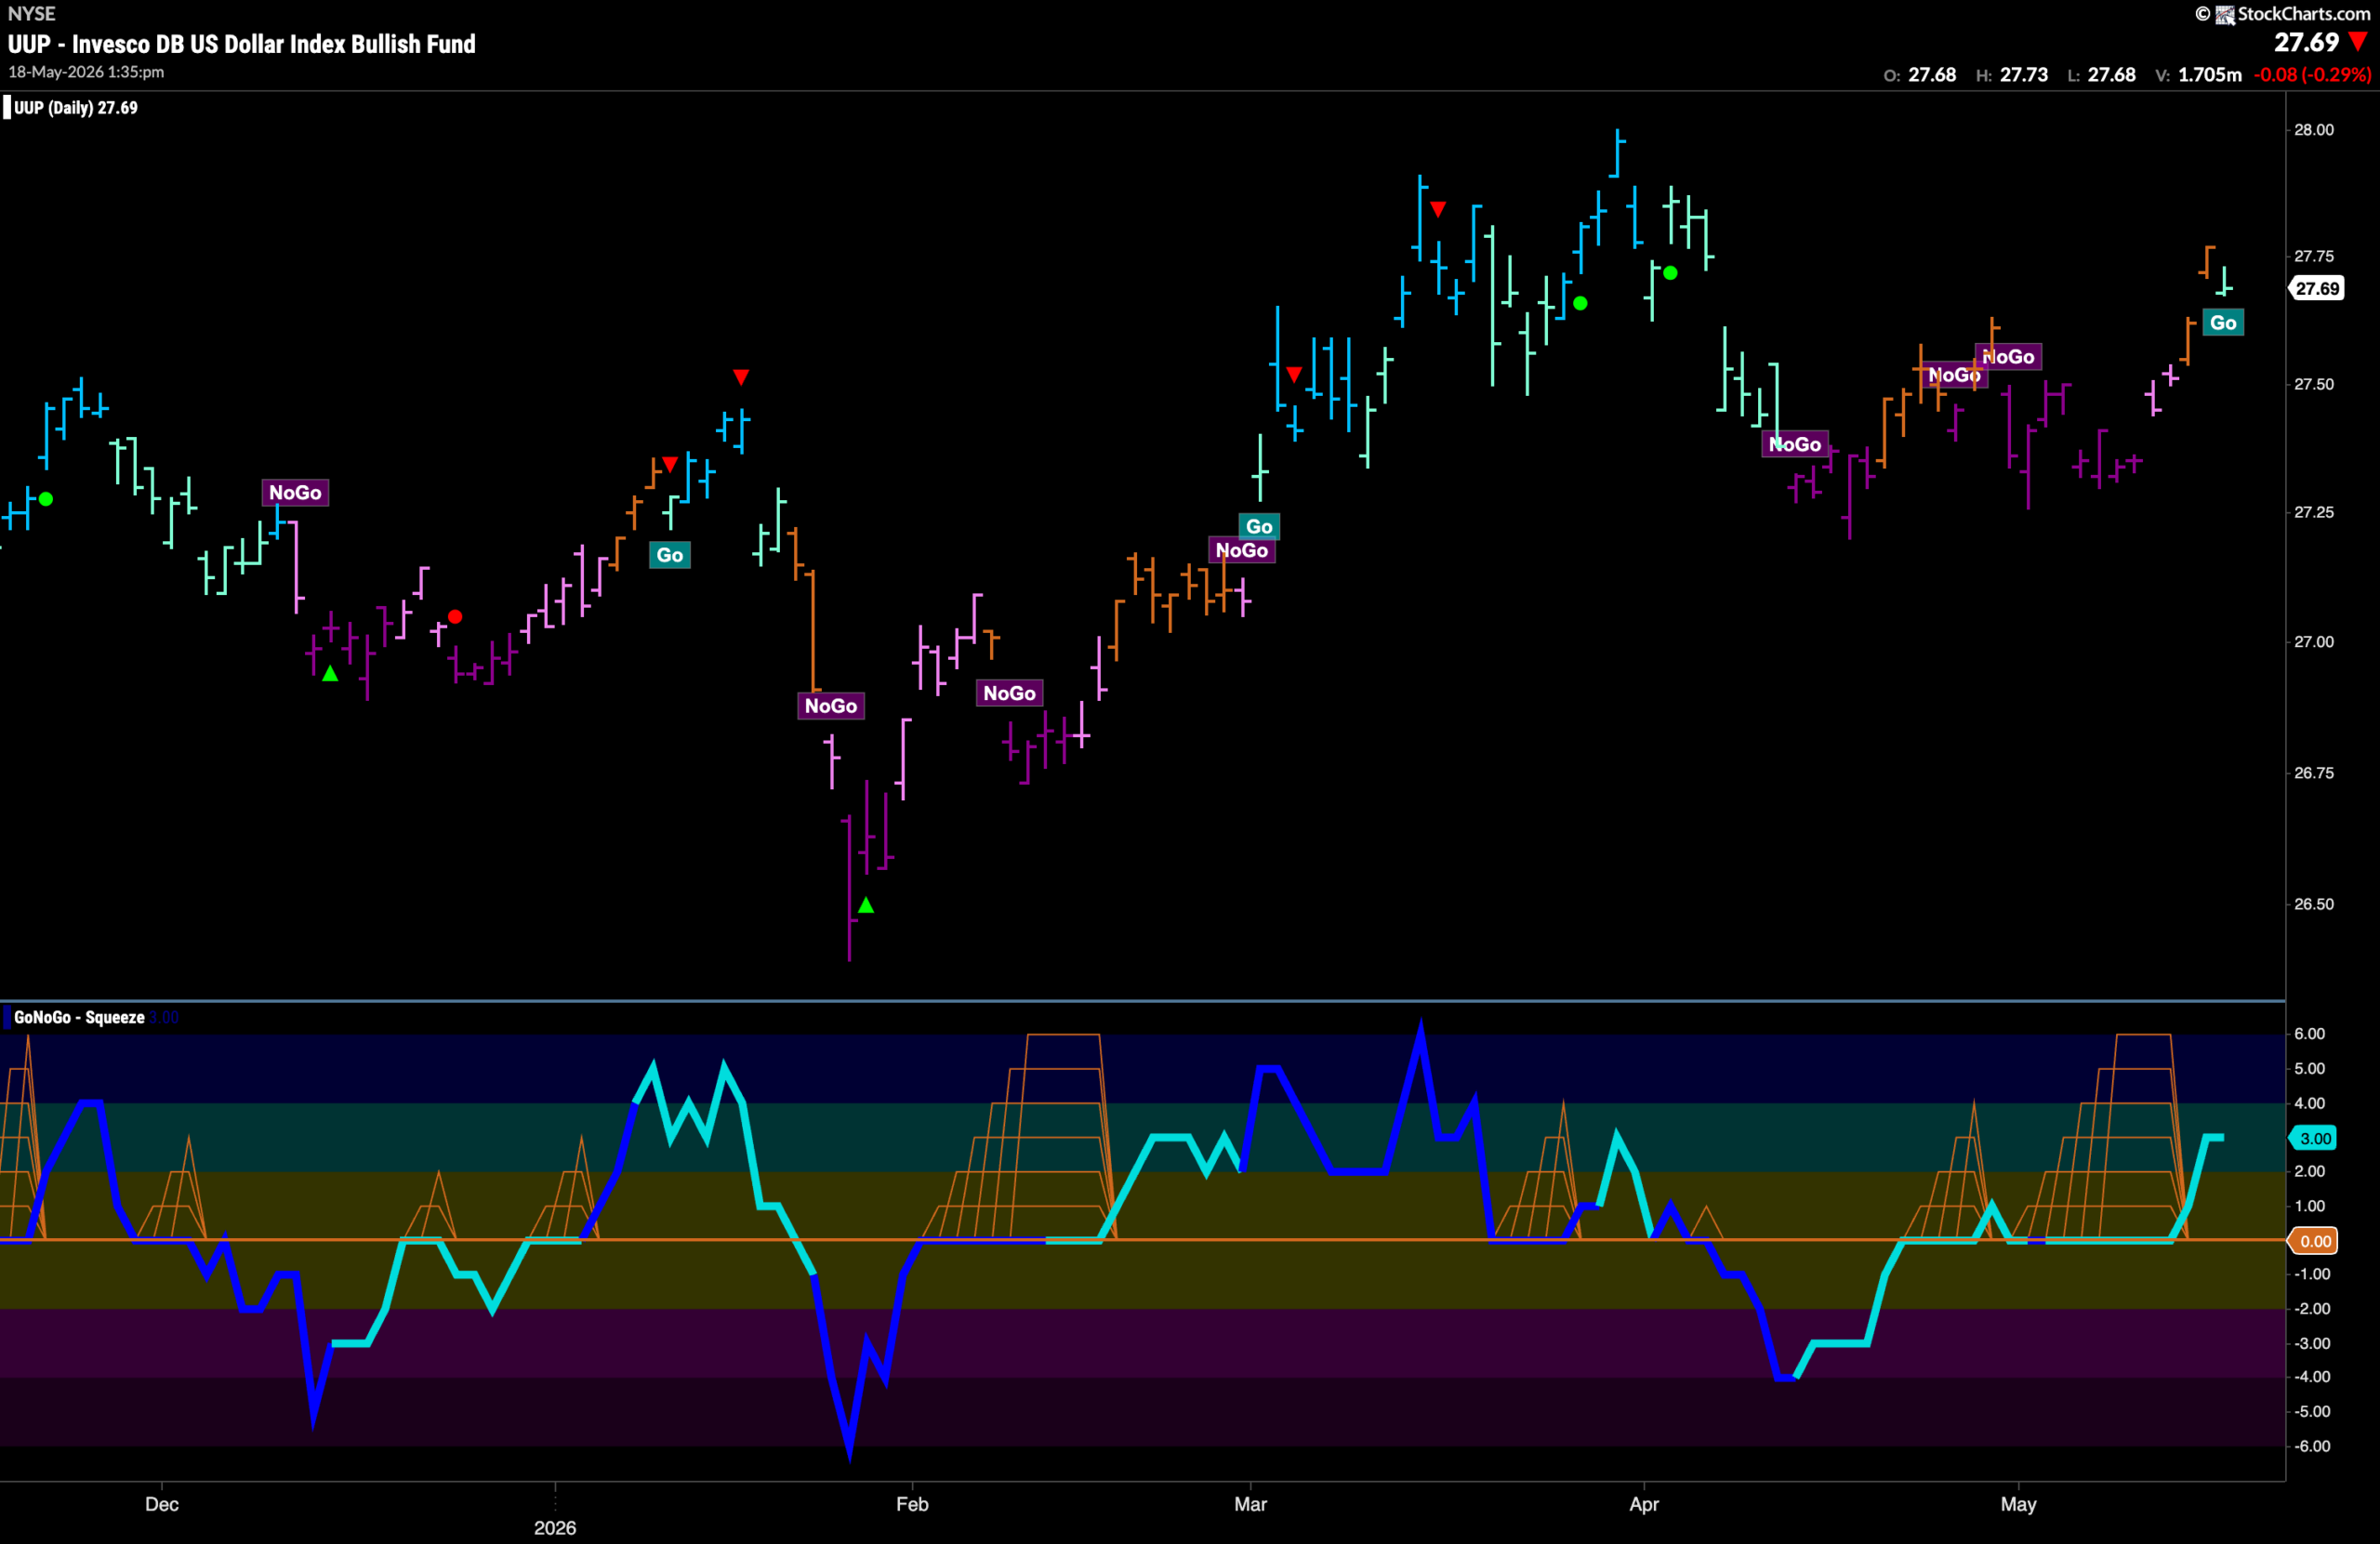
The chart below shows that the trend in the dollar has changed after a couple of amber “Go Fish” bars of uncertainty the indicator paints a fresh aqua “Go” bar. This comes as GoNoGo Oscillator breaks out of an extended Max GoNoGo Squeeze into positive territory. We will watch to see if this momentum surge will give the green back a push higher in the coming days and weeks.
Oil ($USO) Paints Strong “Go” Bars at Highs
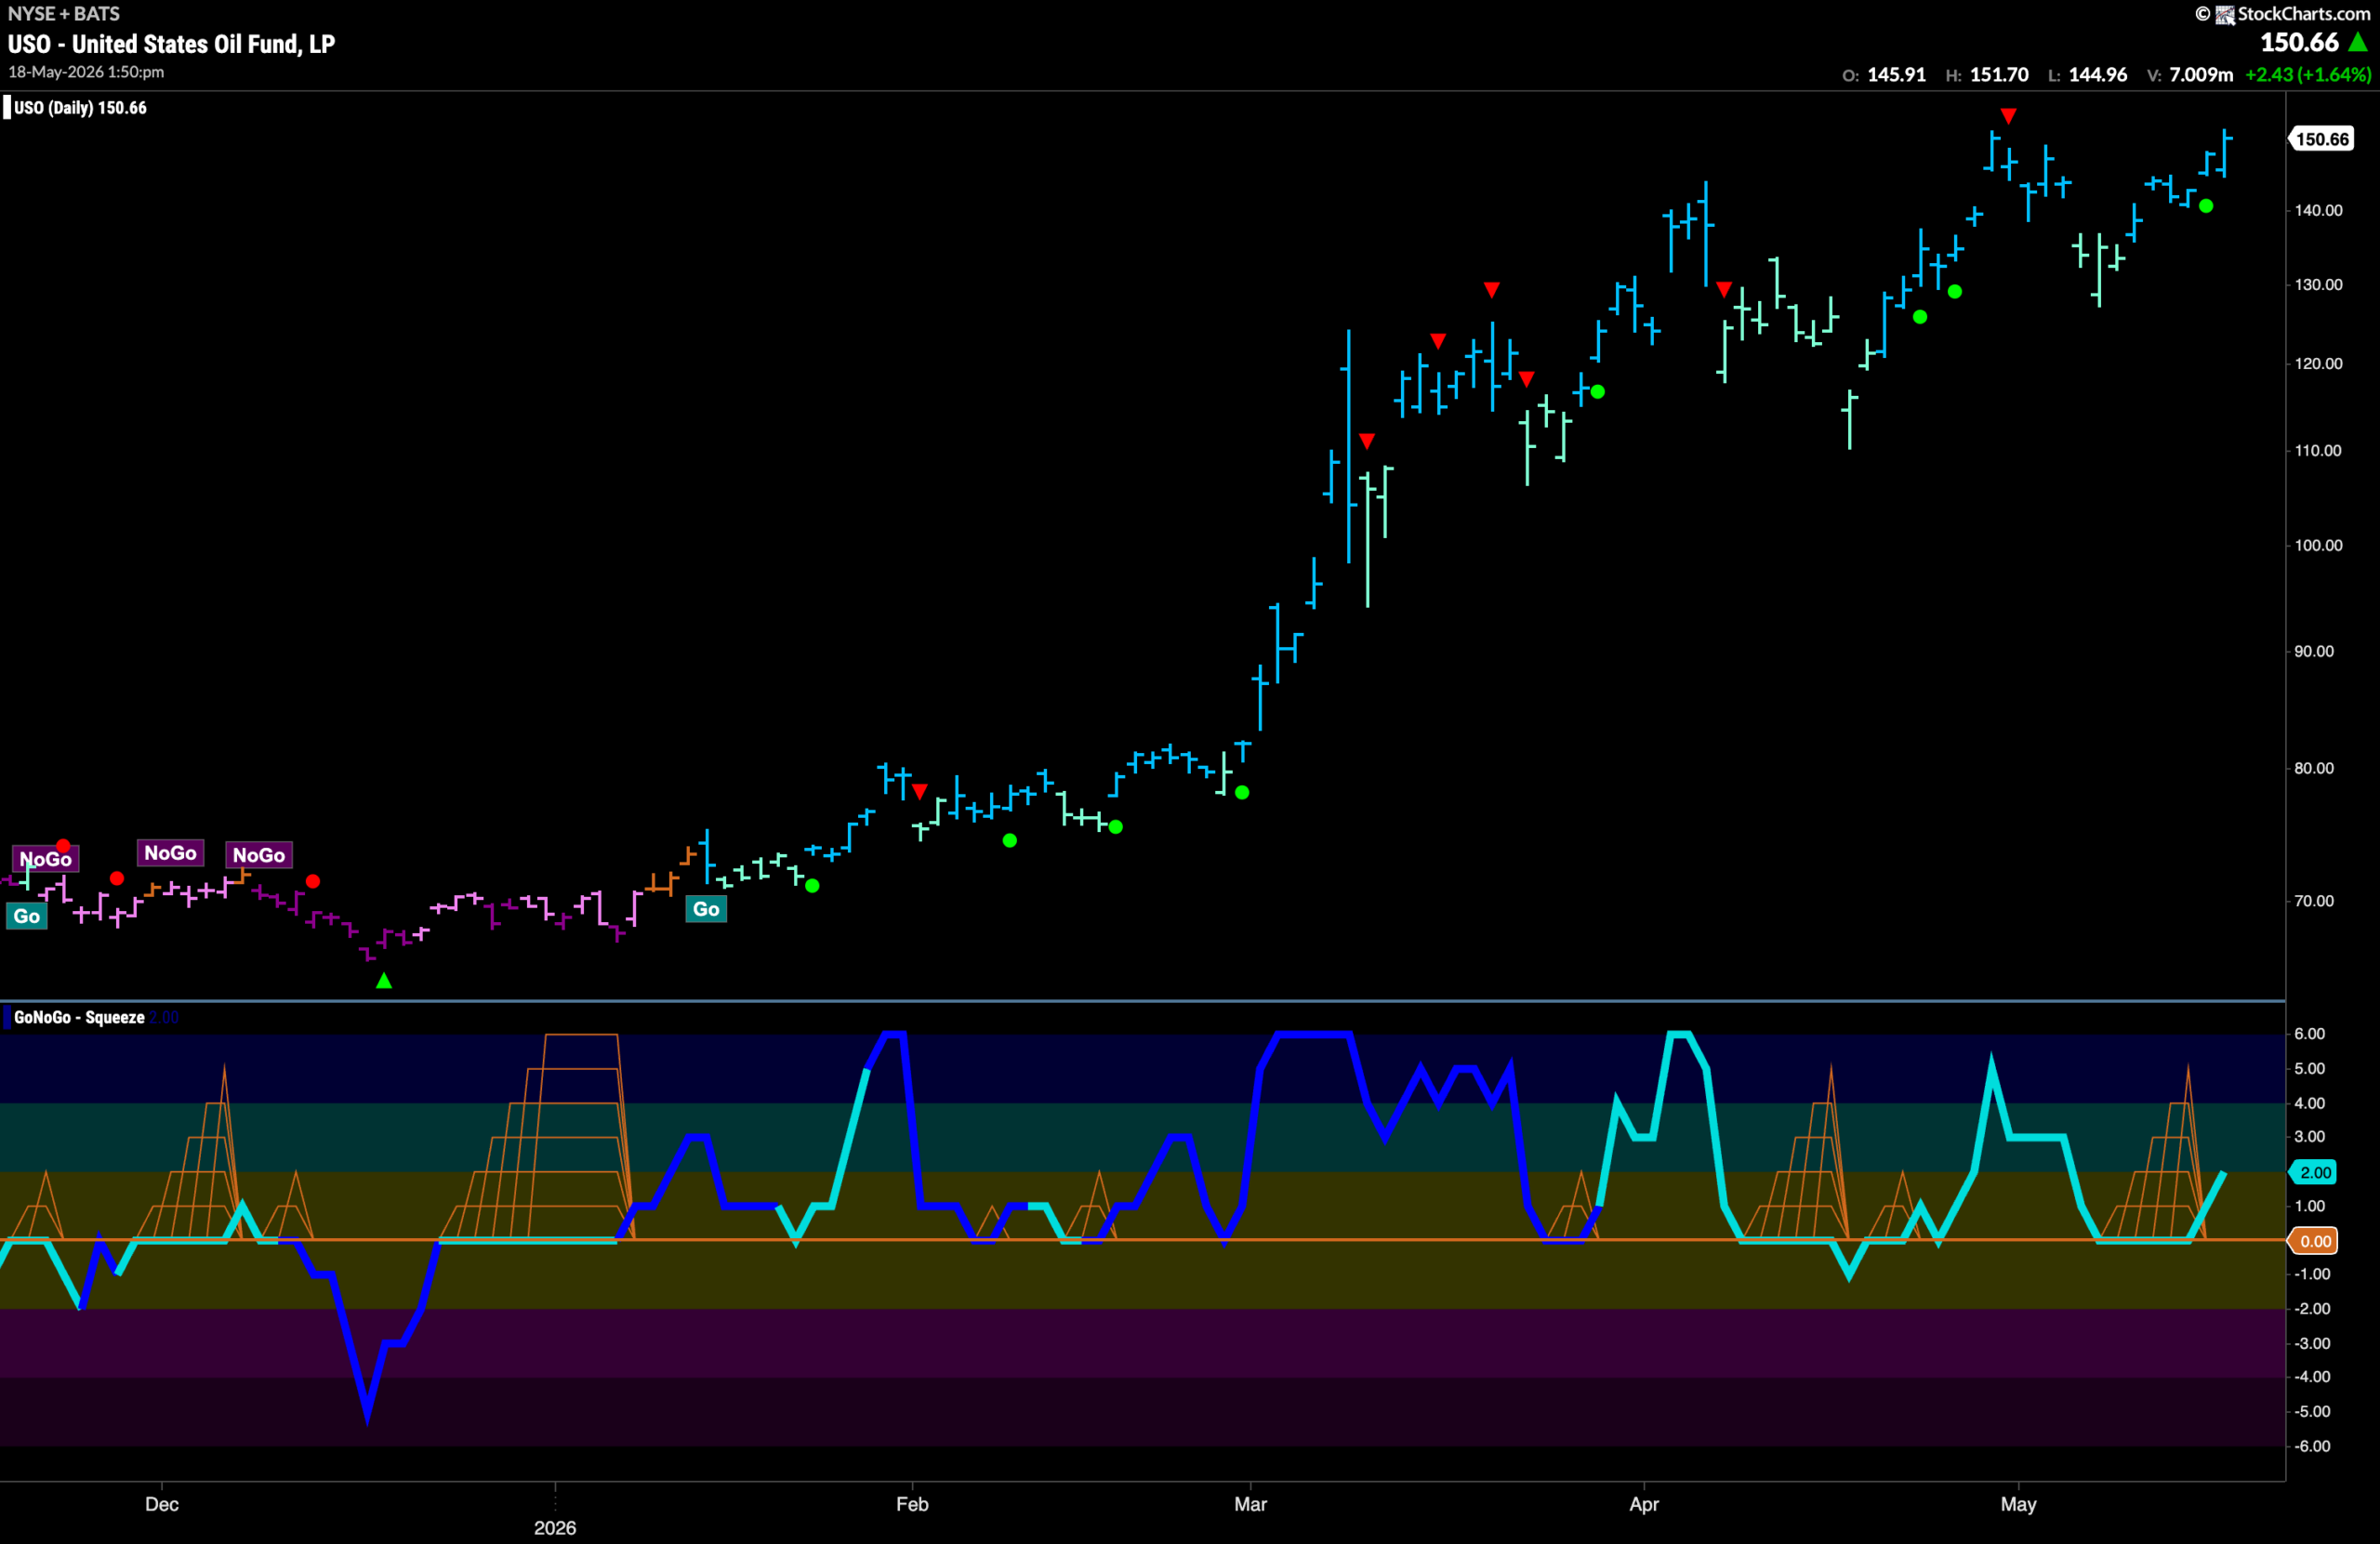
GoNoGo Trend shows that the “Go” trend remains in place for oil and we saw strong “Go” bars all week as price rallied back to prior highs. With GoNoGo Oscillator finding support at the zero line and breaking out of a small GoNoGo Squeeze we will watch to see if this resurgent momentum in the direction of the “Go” trend will help propel price to higher highs.
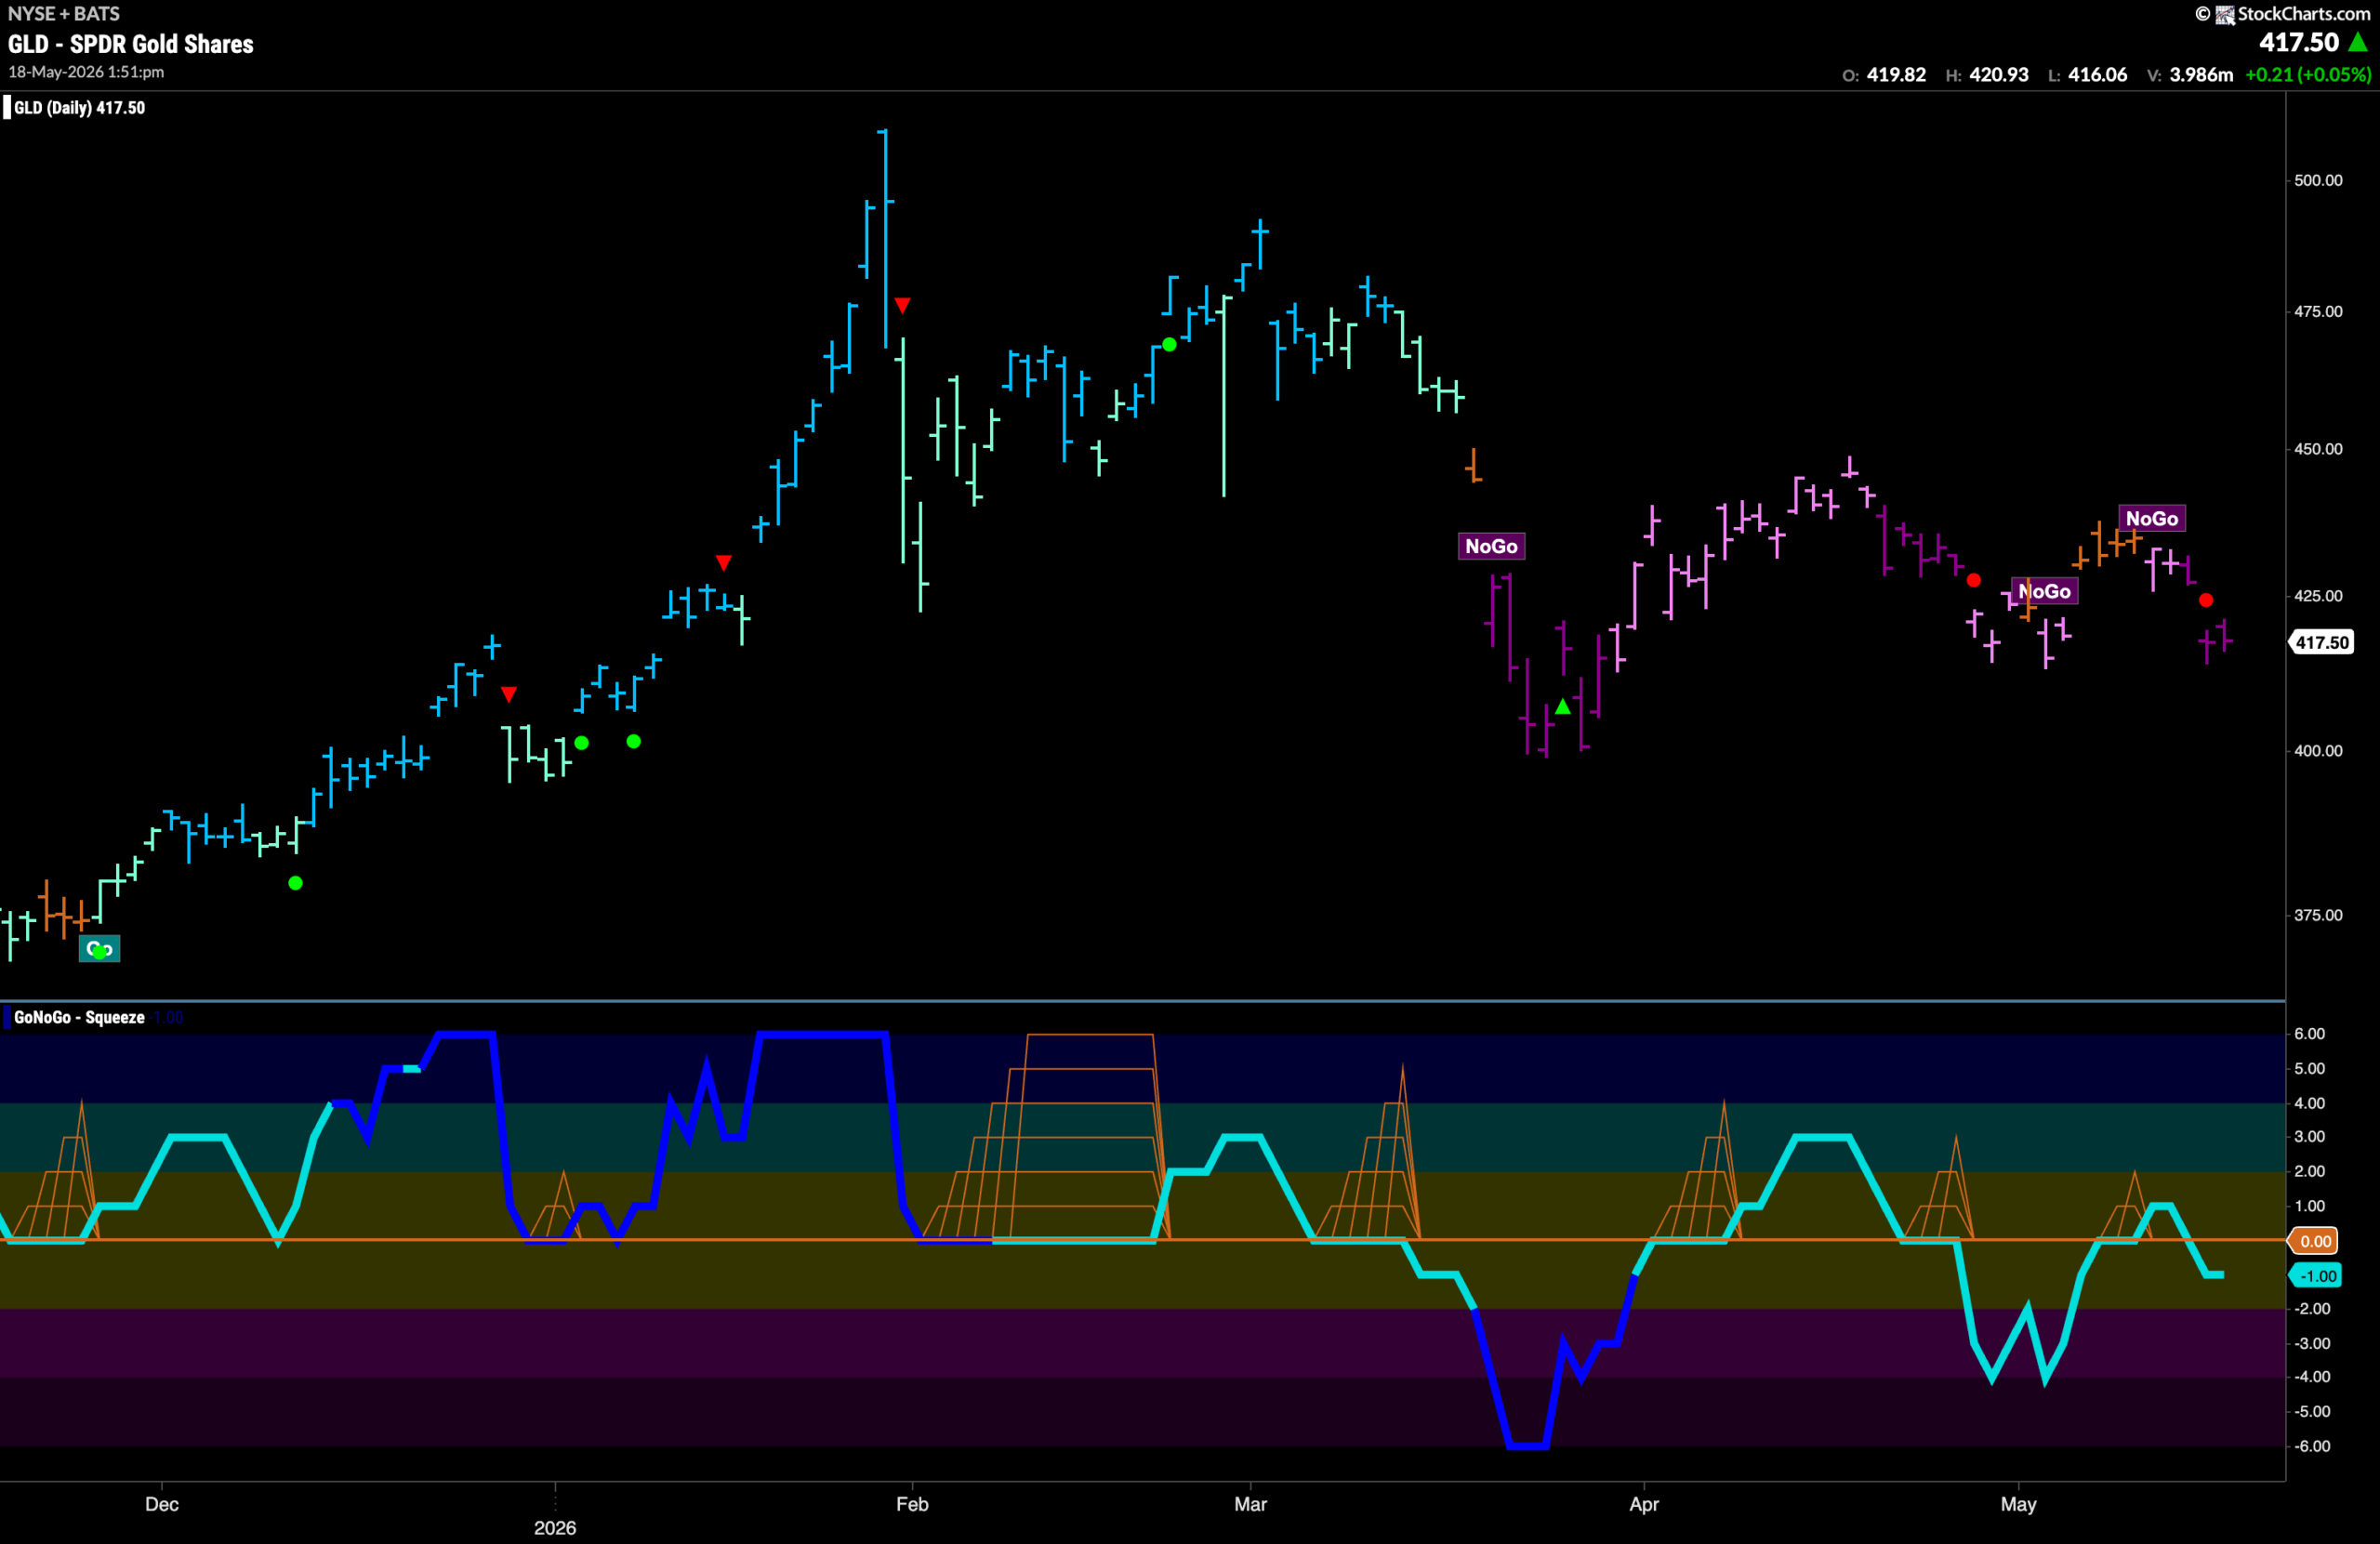
Gold ($GLD) Falls Back into “NoGo”
The market made up its mind for the direction of Gold prices last week. After a string of amber “Go Fish” bars we saw price setting a lower high and GoNoGo Trend fall back into “NoGo” colors. With GoNoGo Oscillator also falling back into negative territory, we see a NoGo Trend Continuation Icon (red circle) telling us that momentum is resurgent in the direction of the “NoGo”. We will watch to see if this pushes price to new lows this week.
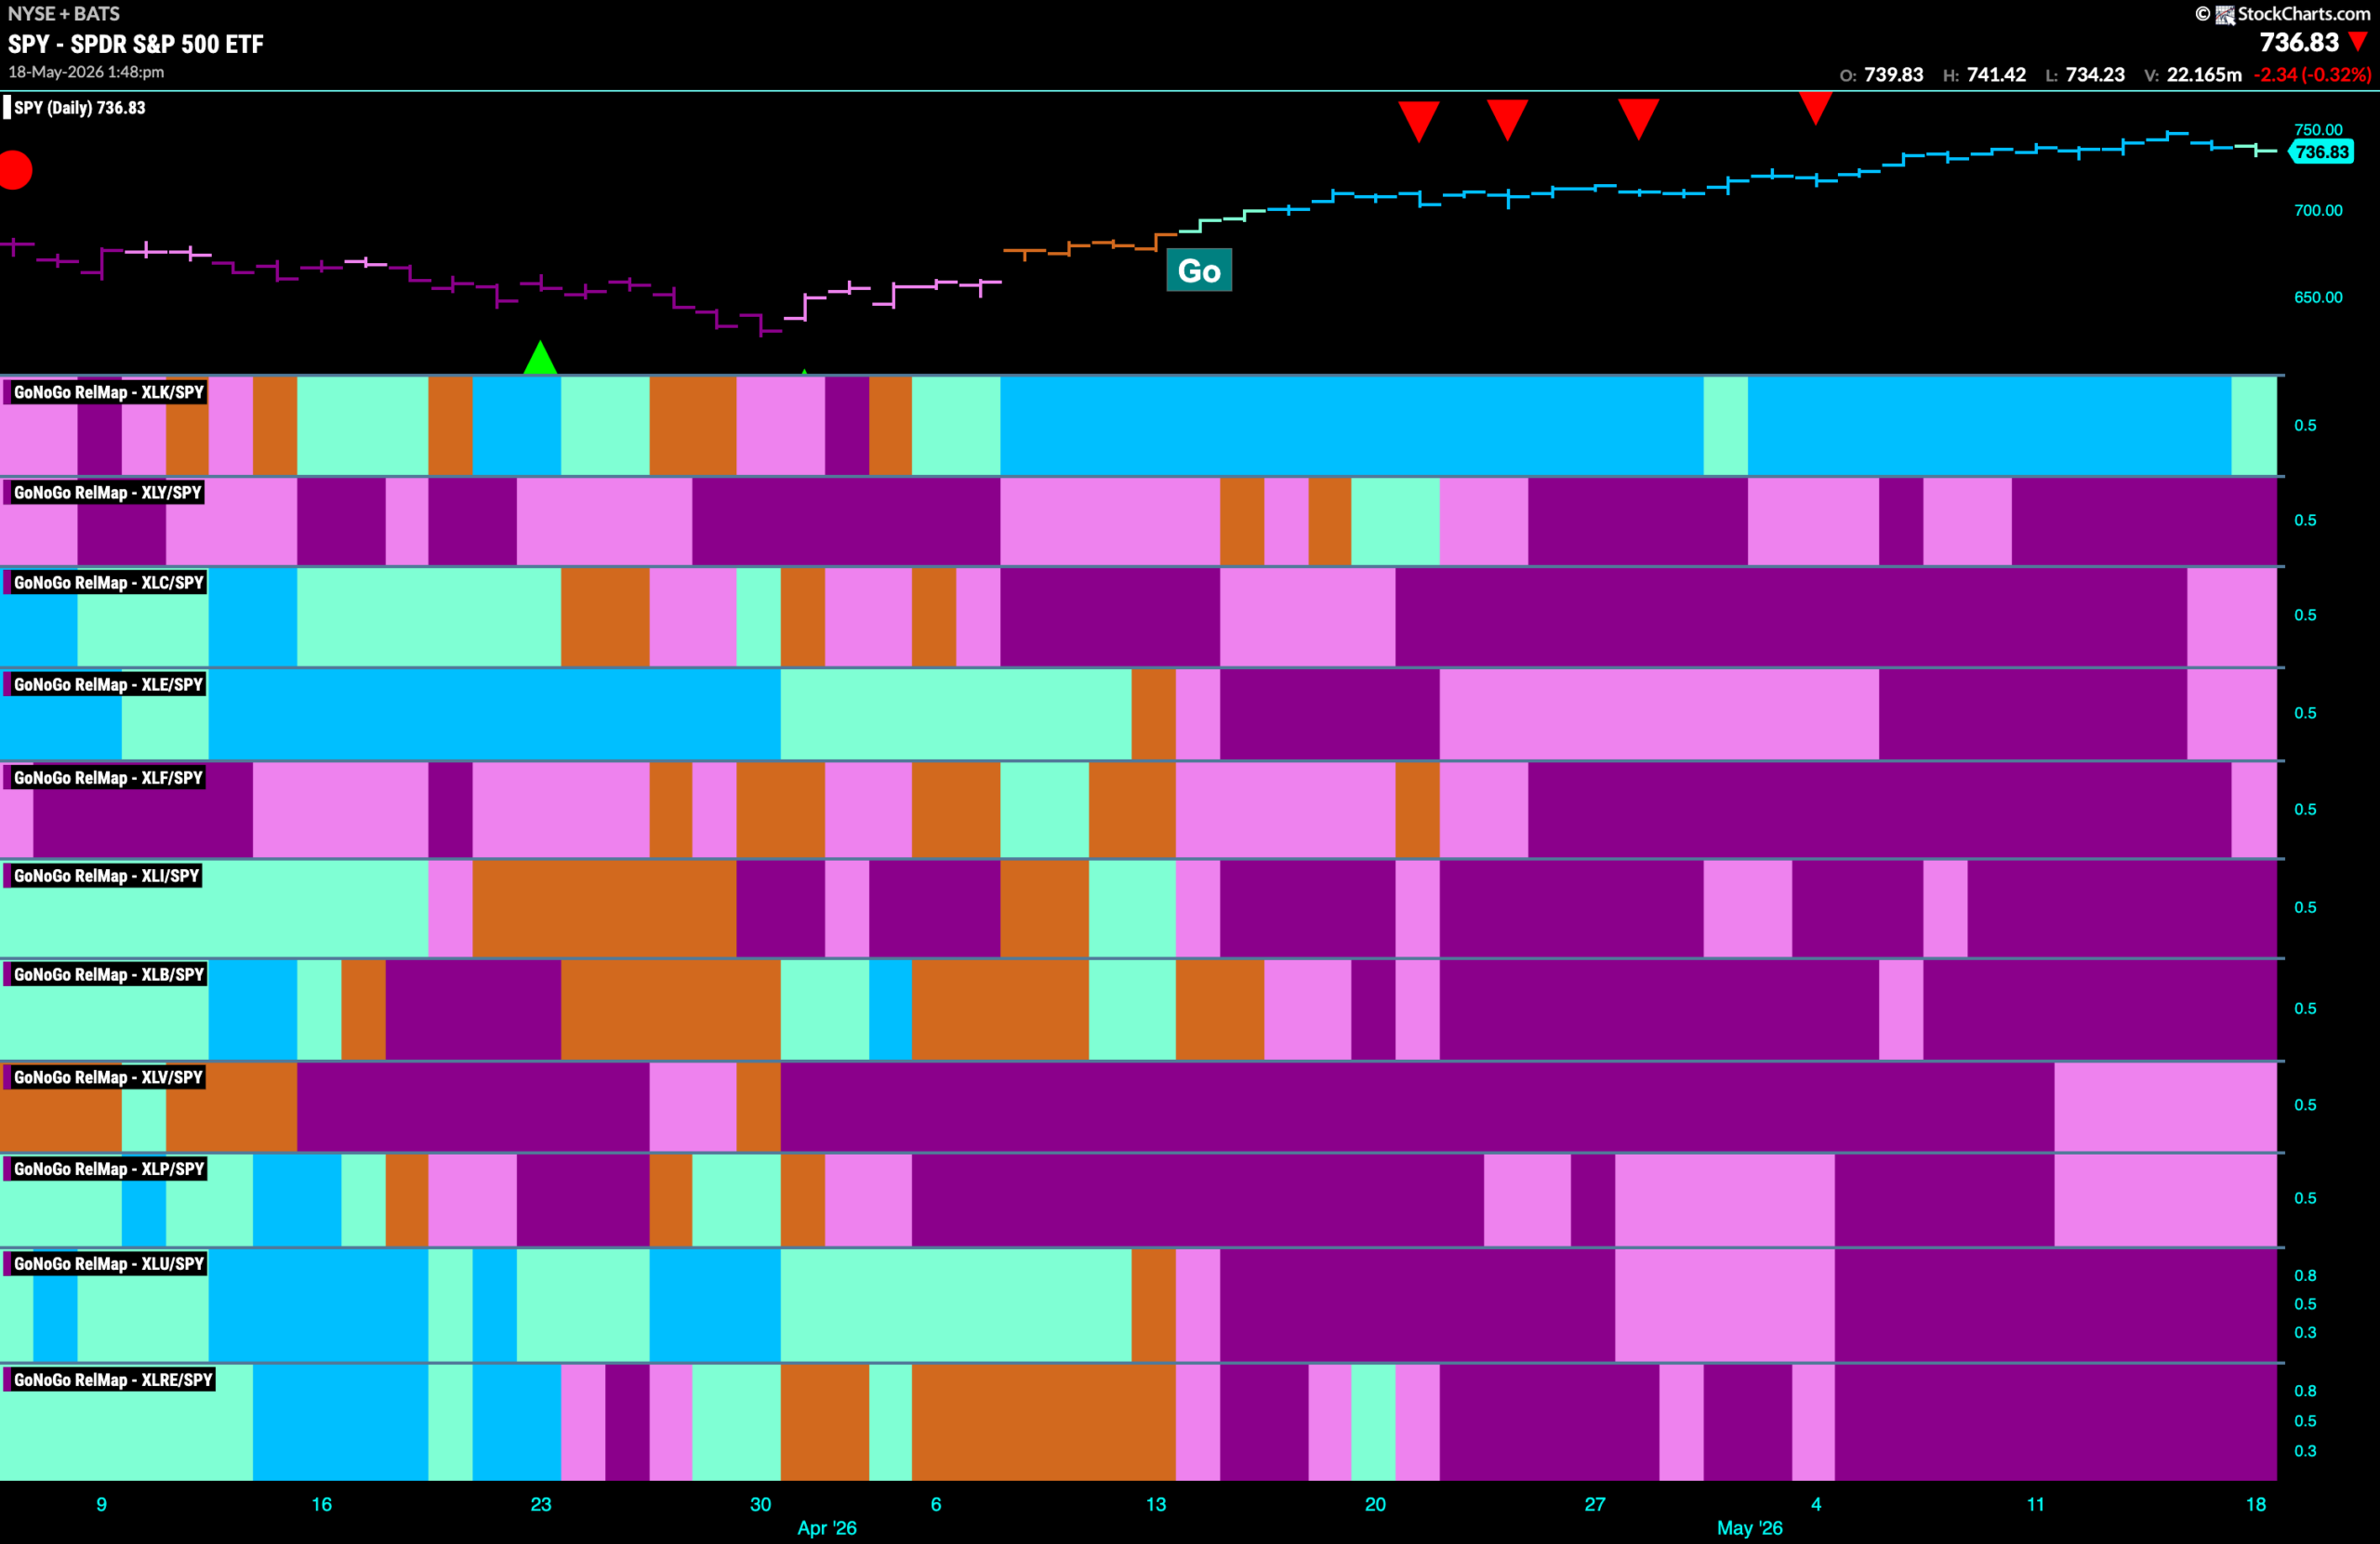
Sector RelMap
Below is the GoNoGo Sector RelMap. This GoNoGo RelMap applies the GoNoGo Trend to the relative strength ratios of the sectors to the base index. With this view we can get a sense of the relative out performance and relative underperformance of the sectors. 1 sector is in a relative “Go” trend. $XLK, is painting relative “Go” bars.
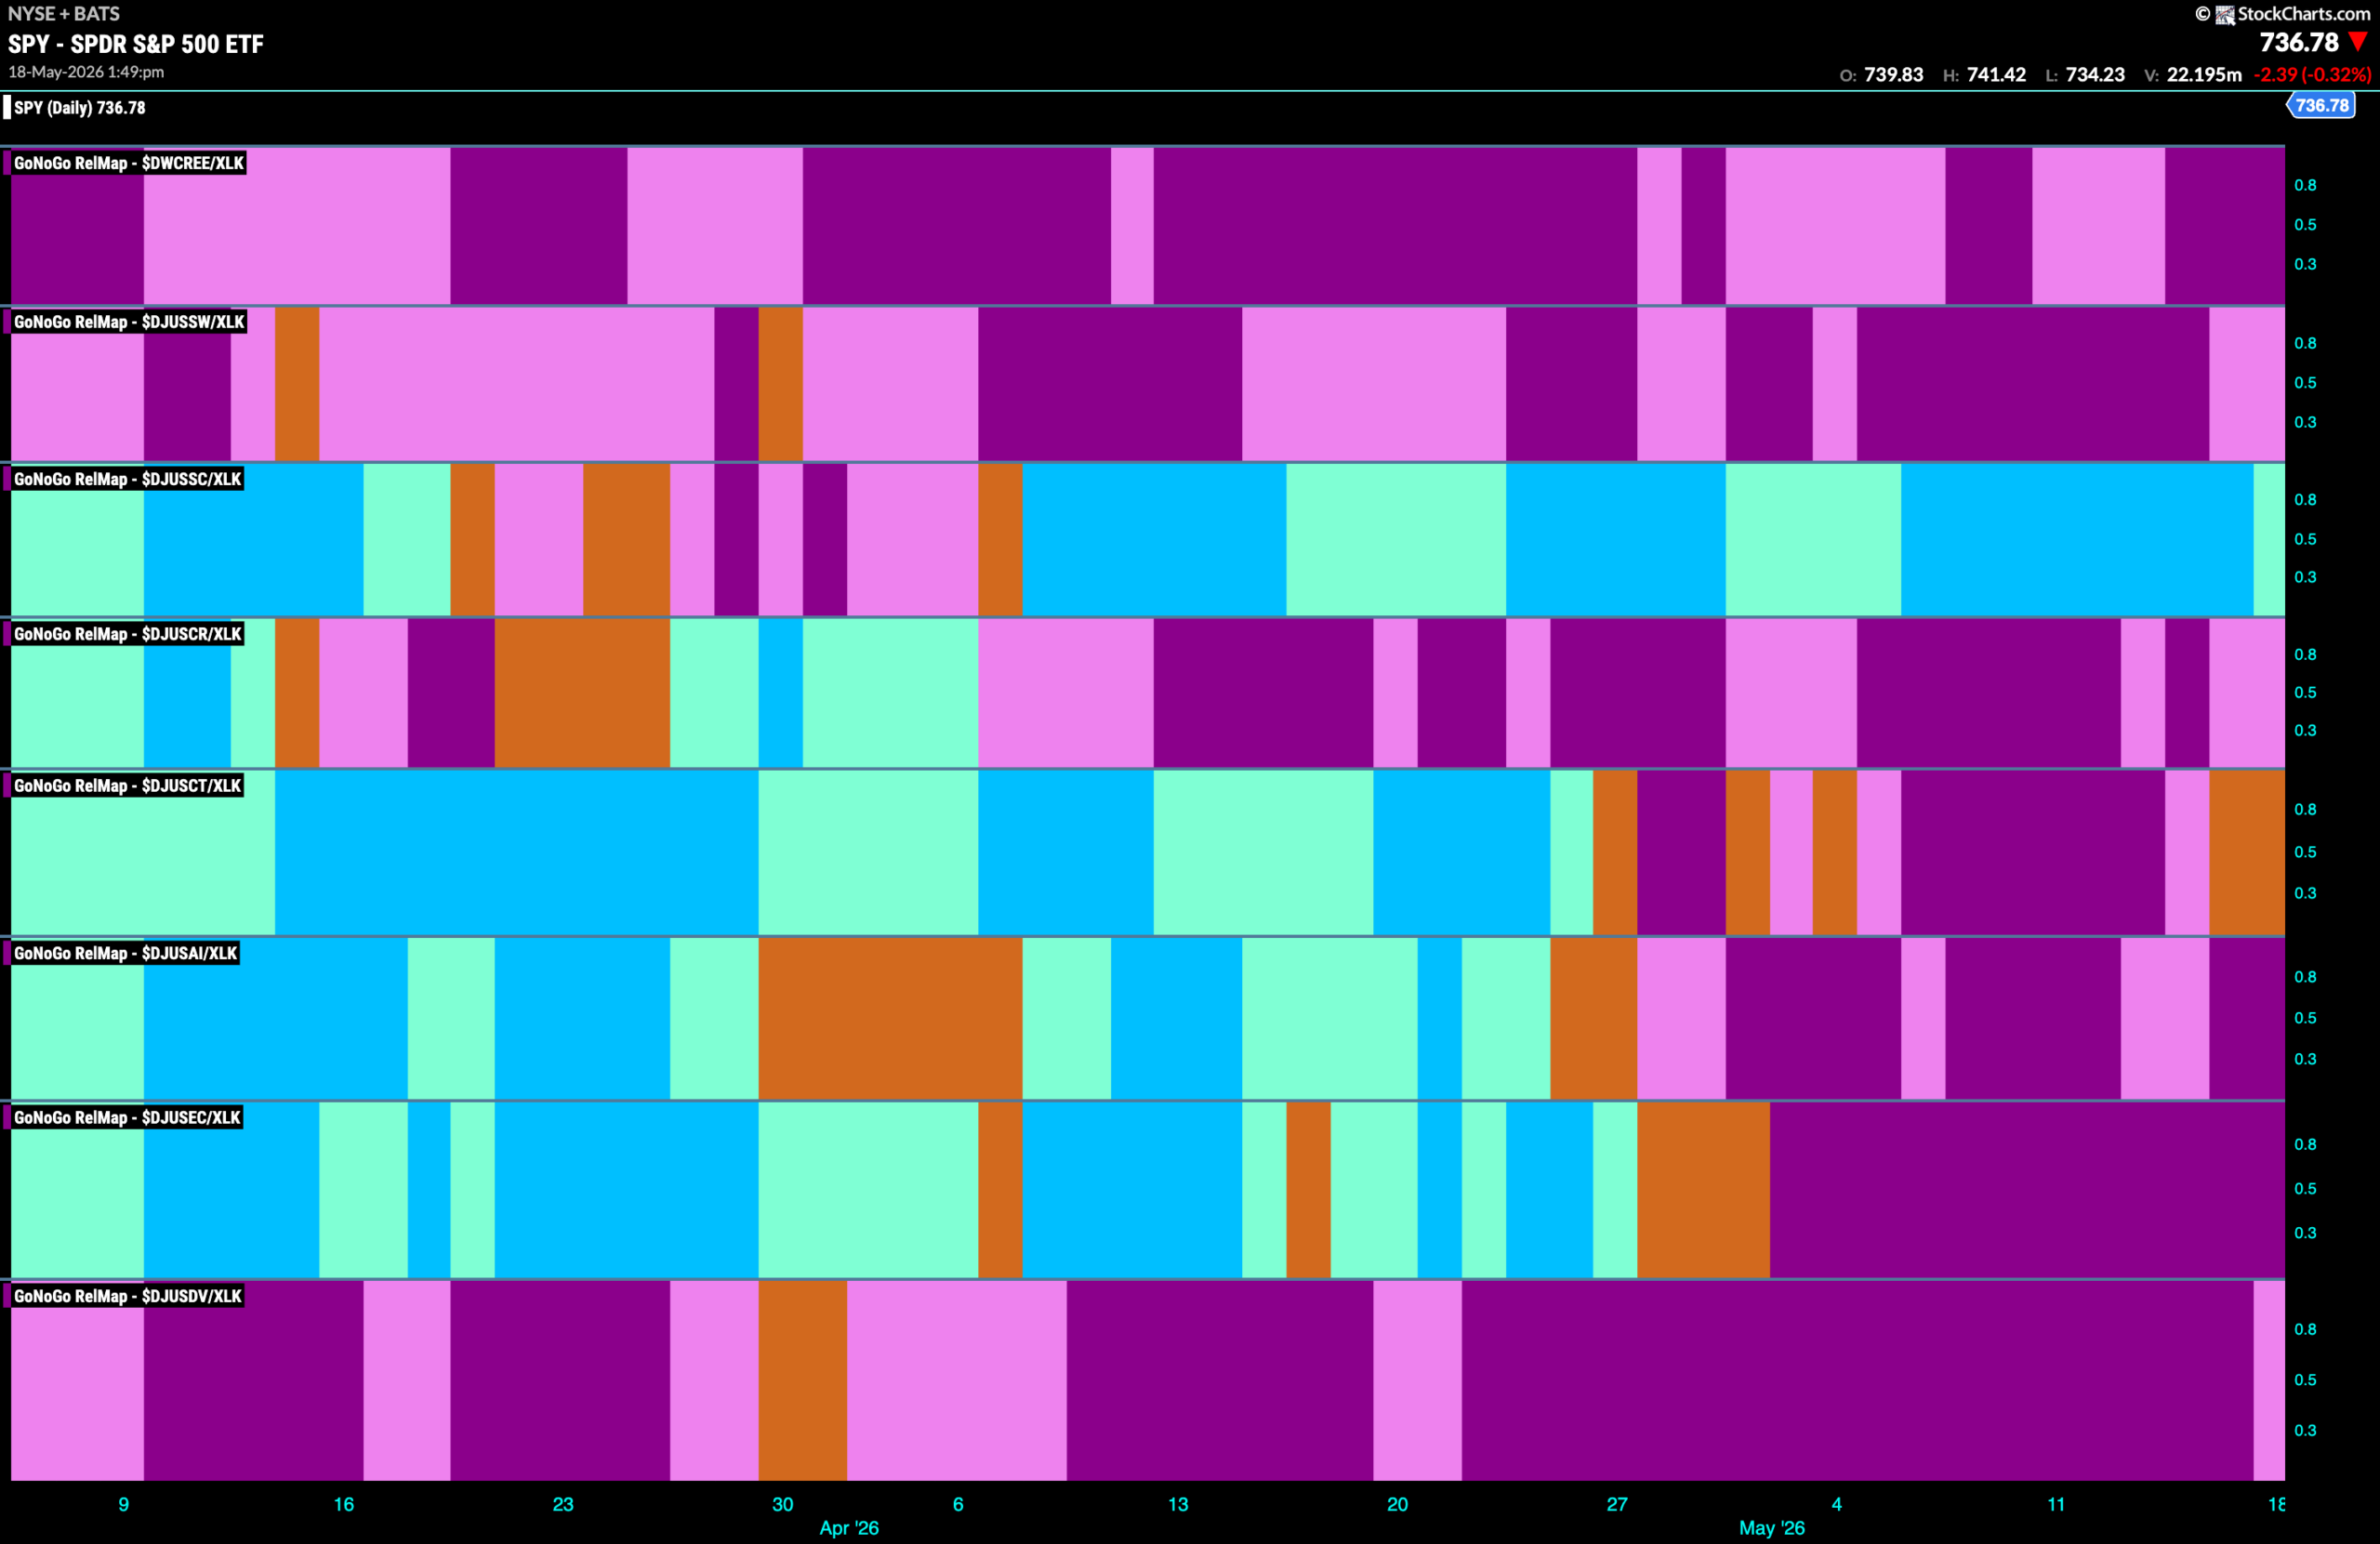
Technology Sub-Group RelMap
The chart below shows a relative trend breakdown of the sub groups within the technology sector this week. The Sub-Group RelMap plots the GoNoGo Trend of each sub index to the $XLK. We saw in the above GoNoGo Sector HeatMap that $XLK continues to outperform and paints “Go” bars. When we look at the below RelMap we can see that the semiconductors index in the 3rd panel continues to paint “Go” bars on a relative basis.
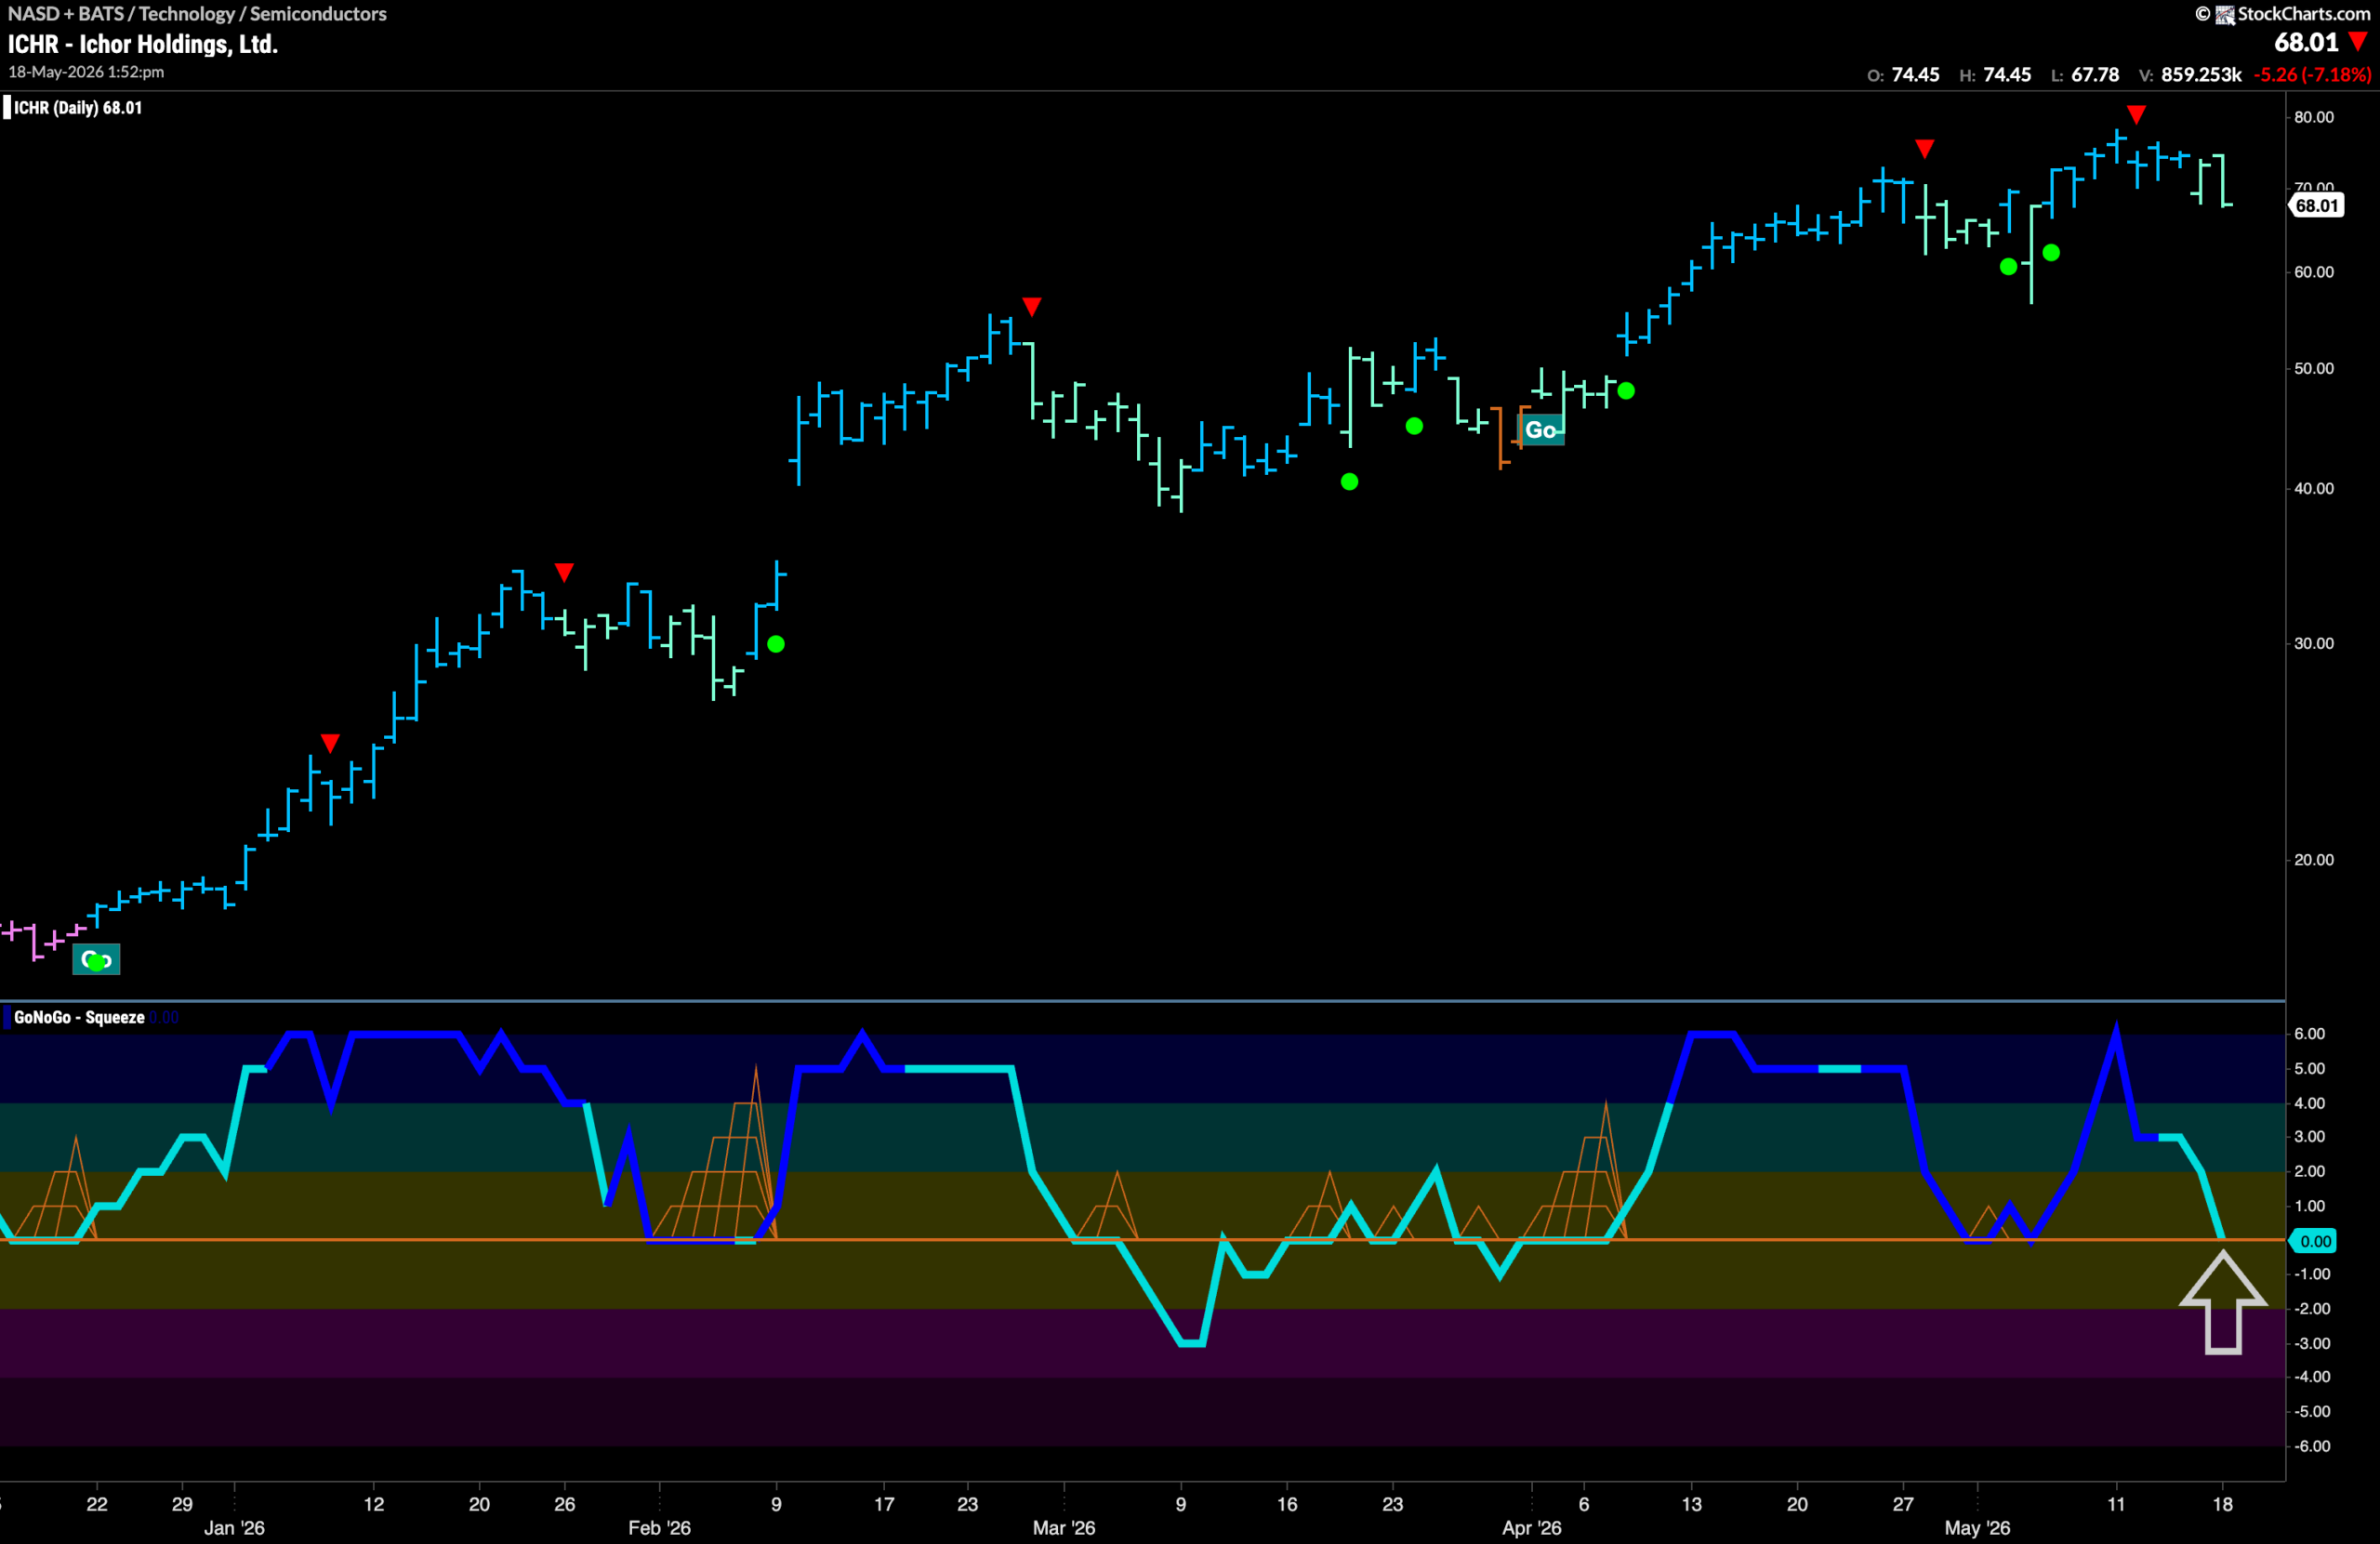
$ICHR Looks For Support in “Go” Trend
The GoNoGo Chart below shows that after hitting another higher high we saw a Go Countertrend Correction Icon (red arrow) indicating that price may struggle to higher in the short term due to waning momentum. Indeed, GoNoGo Trend has started to paint weaker aqua bars as price falls from the high. GoNoGo Oscillator has fallen all the way to the zero line where we will watch to see if it finds support. This will be important if price is to rally and set a new higher low before looking once again for new highs.
$AMD Looking to Hold On
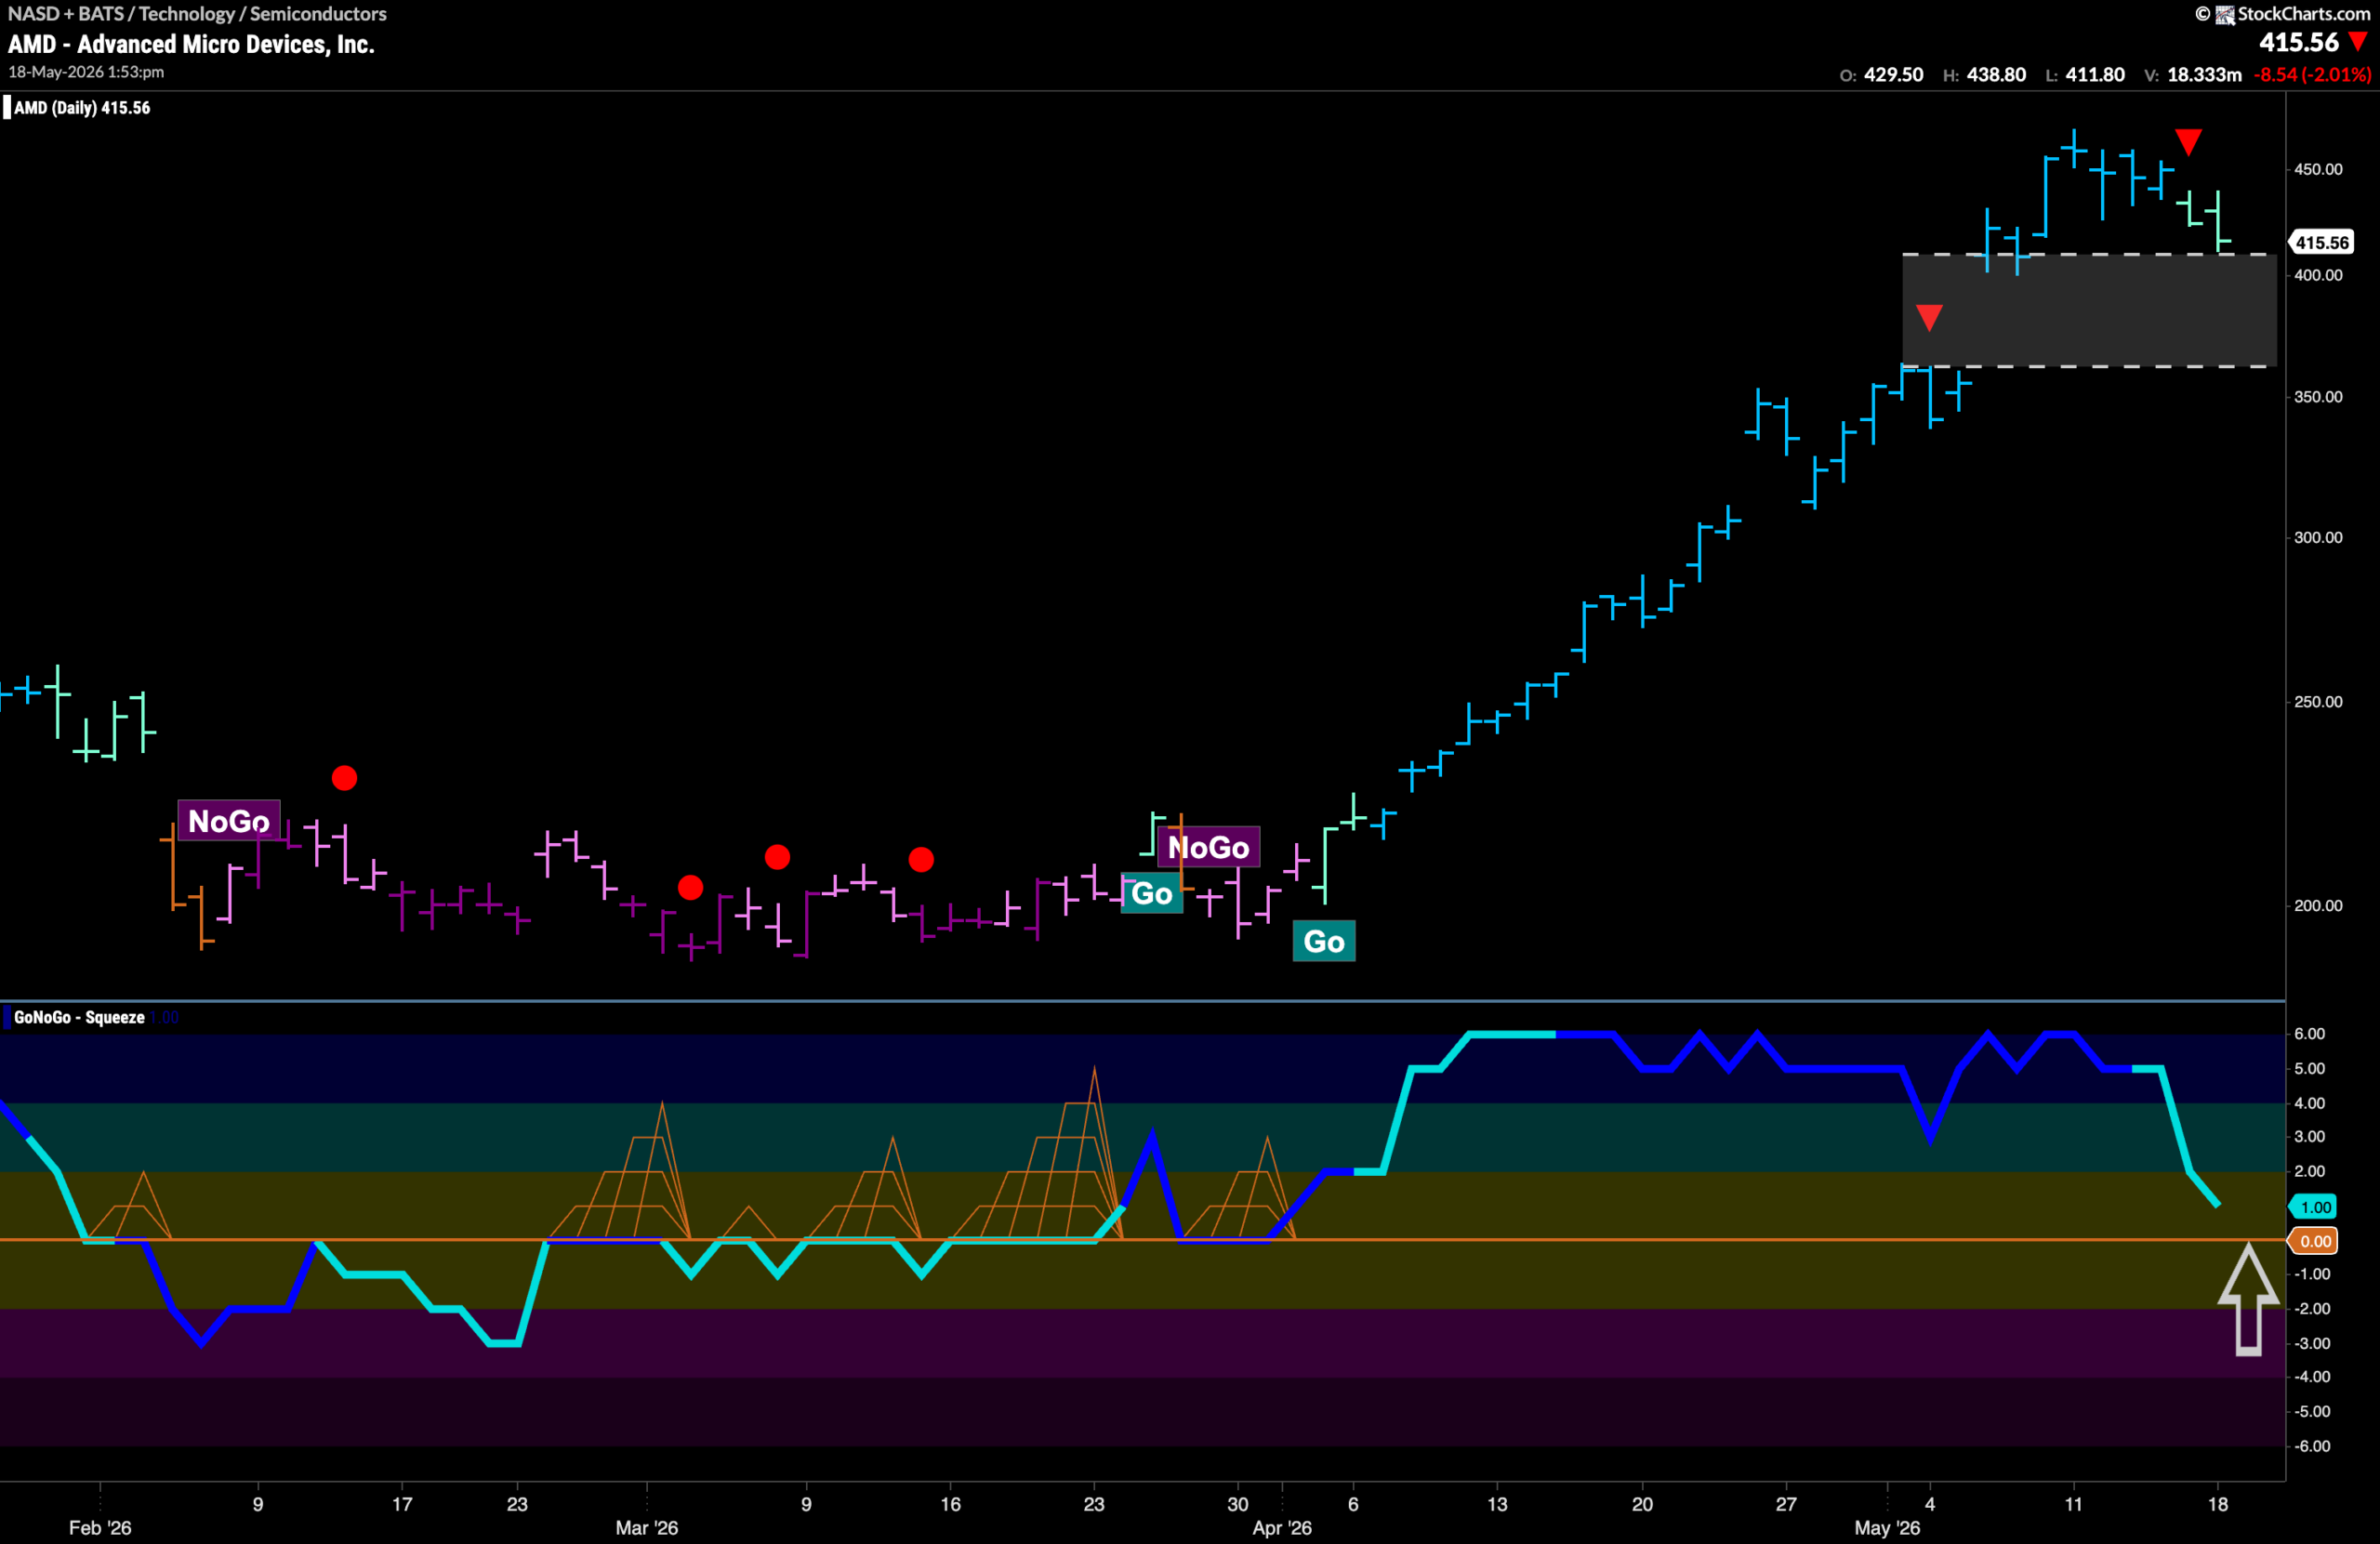
The soaring “Go” trend for $AMD is showing signs of weakness for the first time since exploding higher in early April. After another higher high, we saw a second Go Countertrend Correction Icon (red arrow) telling us that price may struggle to go higher due to waning momentum. Indeed, GoNoGo Trend paints weaker aqua bars as price falls from the high. GoNoGo Oscillator is falling quickly toward the zero line and we will watch to see if it finds support at that level. If it does, then the “Go” trend will likely remain in place.