Good morning and welcome to this week’s Flight Path. We saw some weakness this week as price pulled back a little from all time highs. Momentum cooled, we saw this in the form of Go Countertrend Correction Icons (red arrows) and GoNoGo Trend painted weaker aqua bars. Treasury bond prices gained strength and painted blue bars. U.S. commodity index continued to show market uncertainty and the dollar regained “Go” colors albeit weaker aqua.
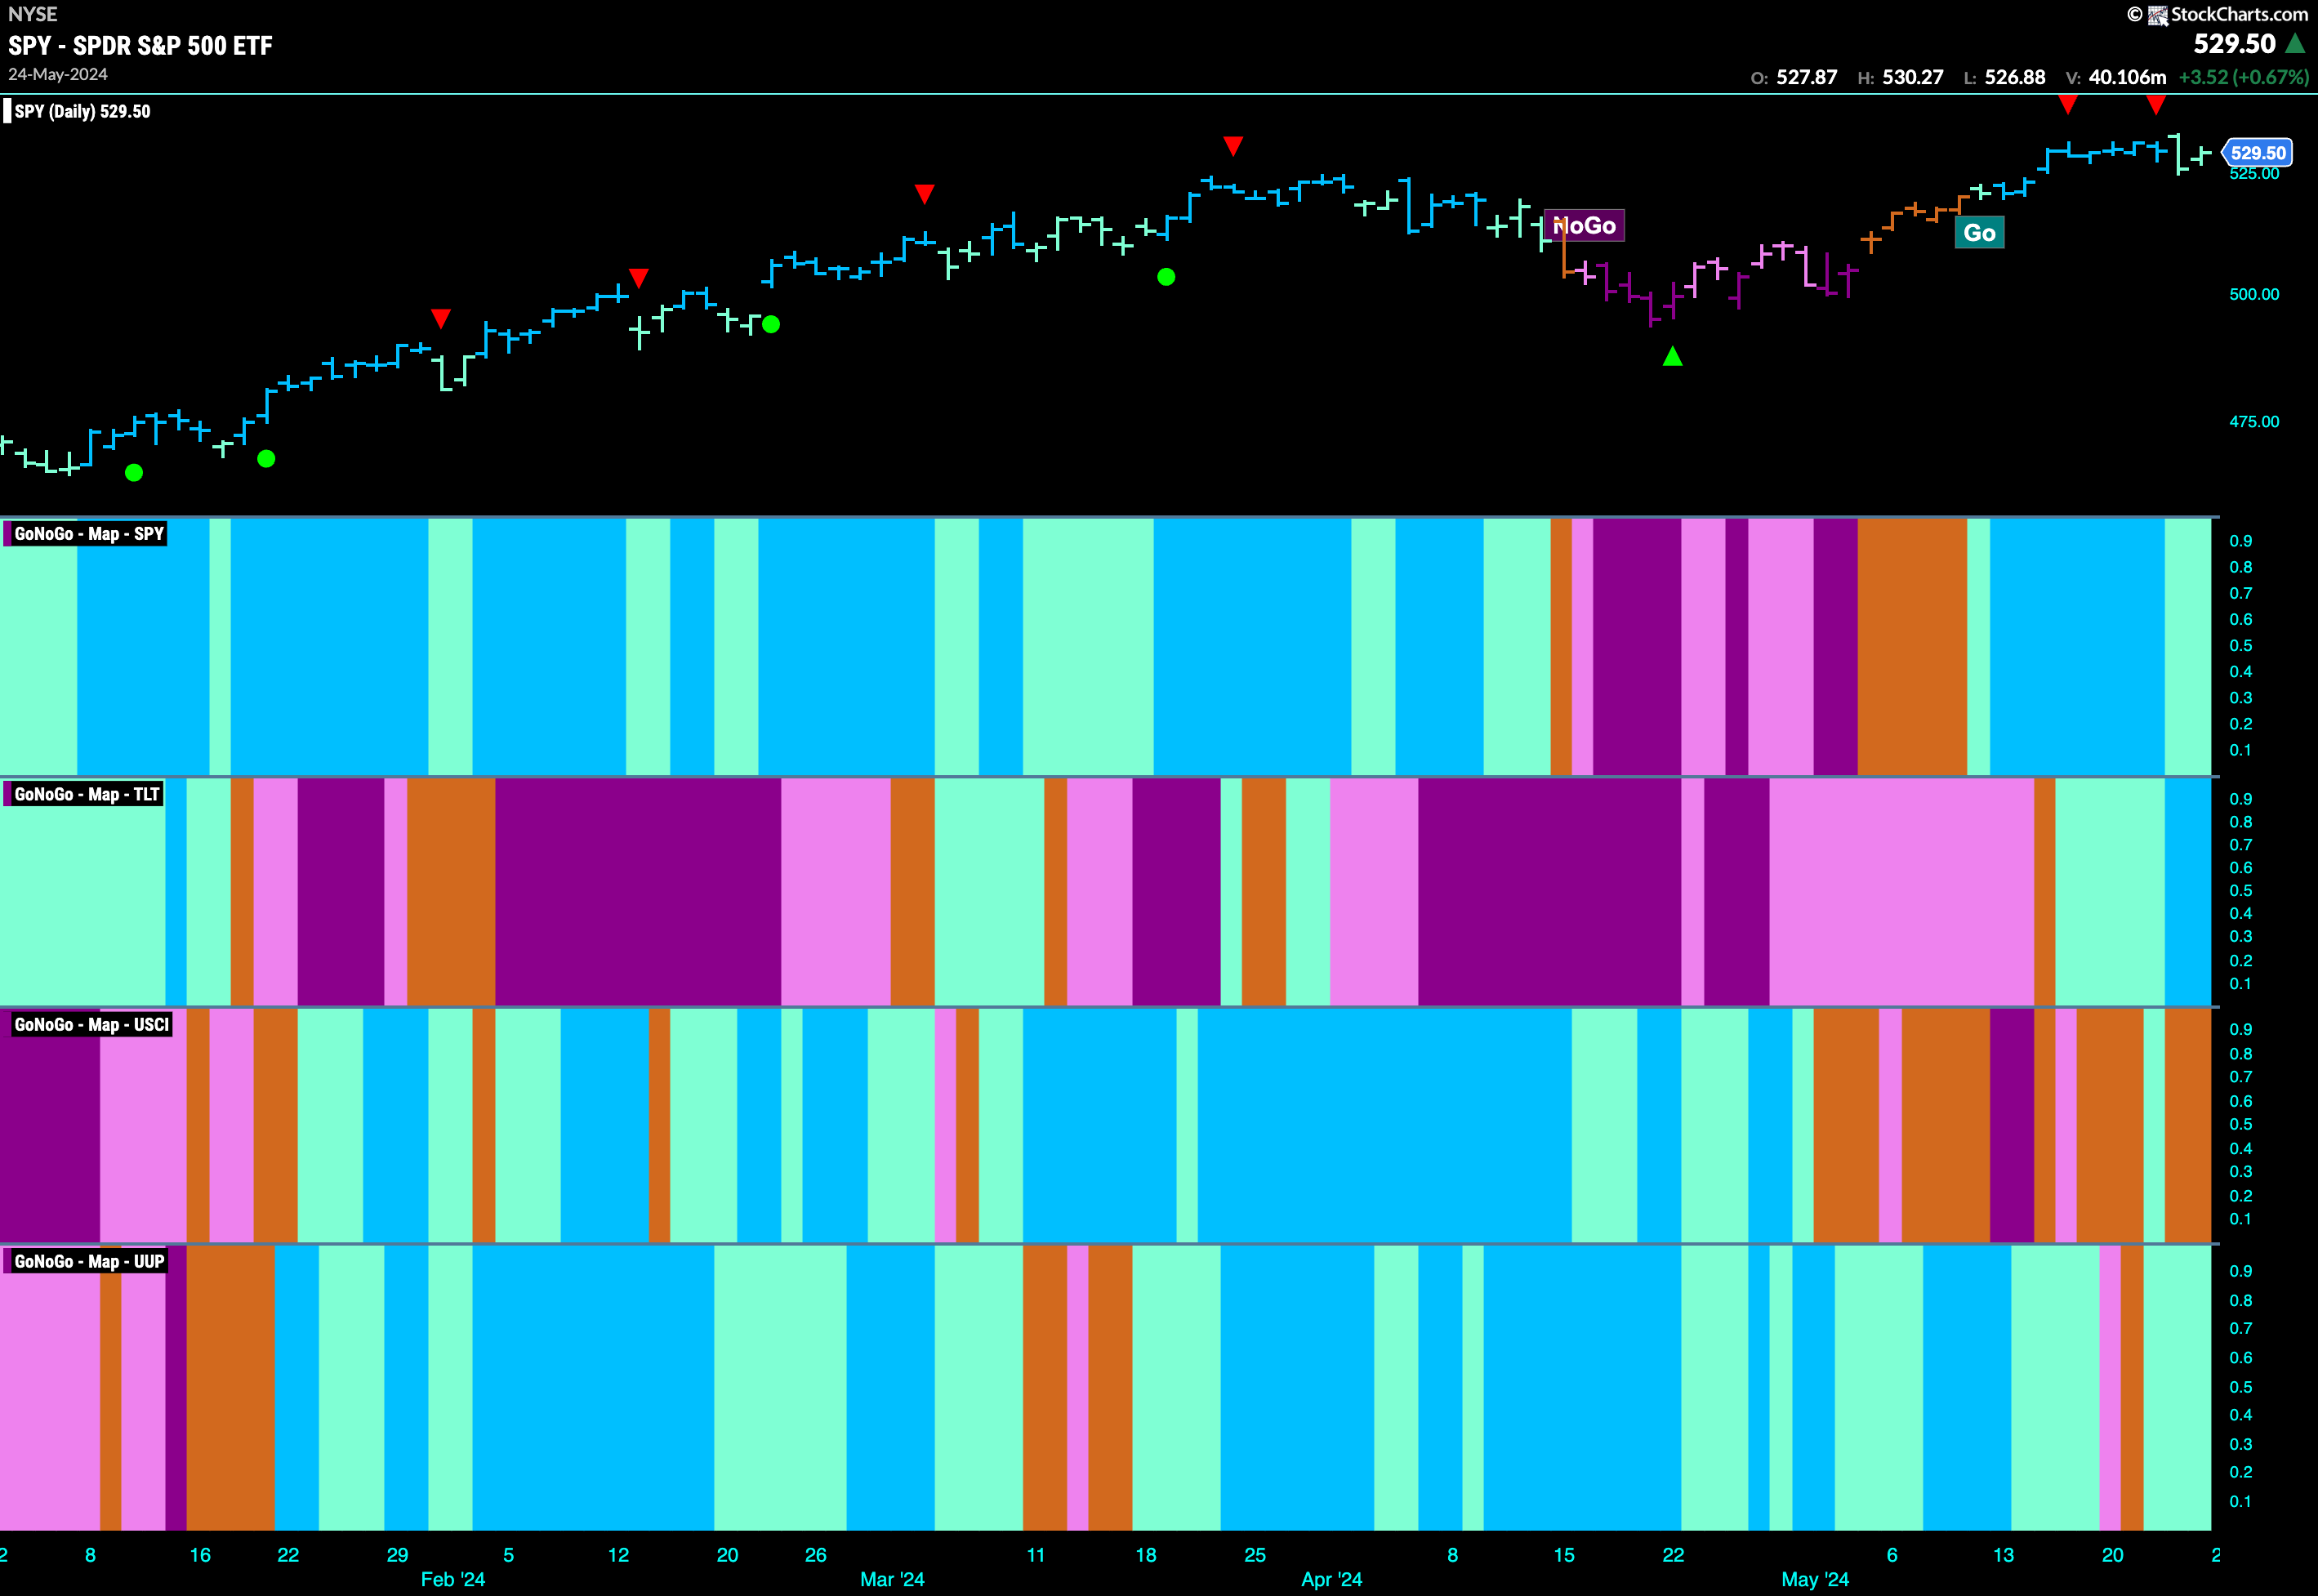
$SPY Shows Investors Digesting Gains
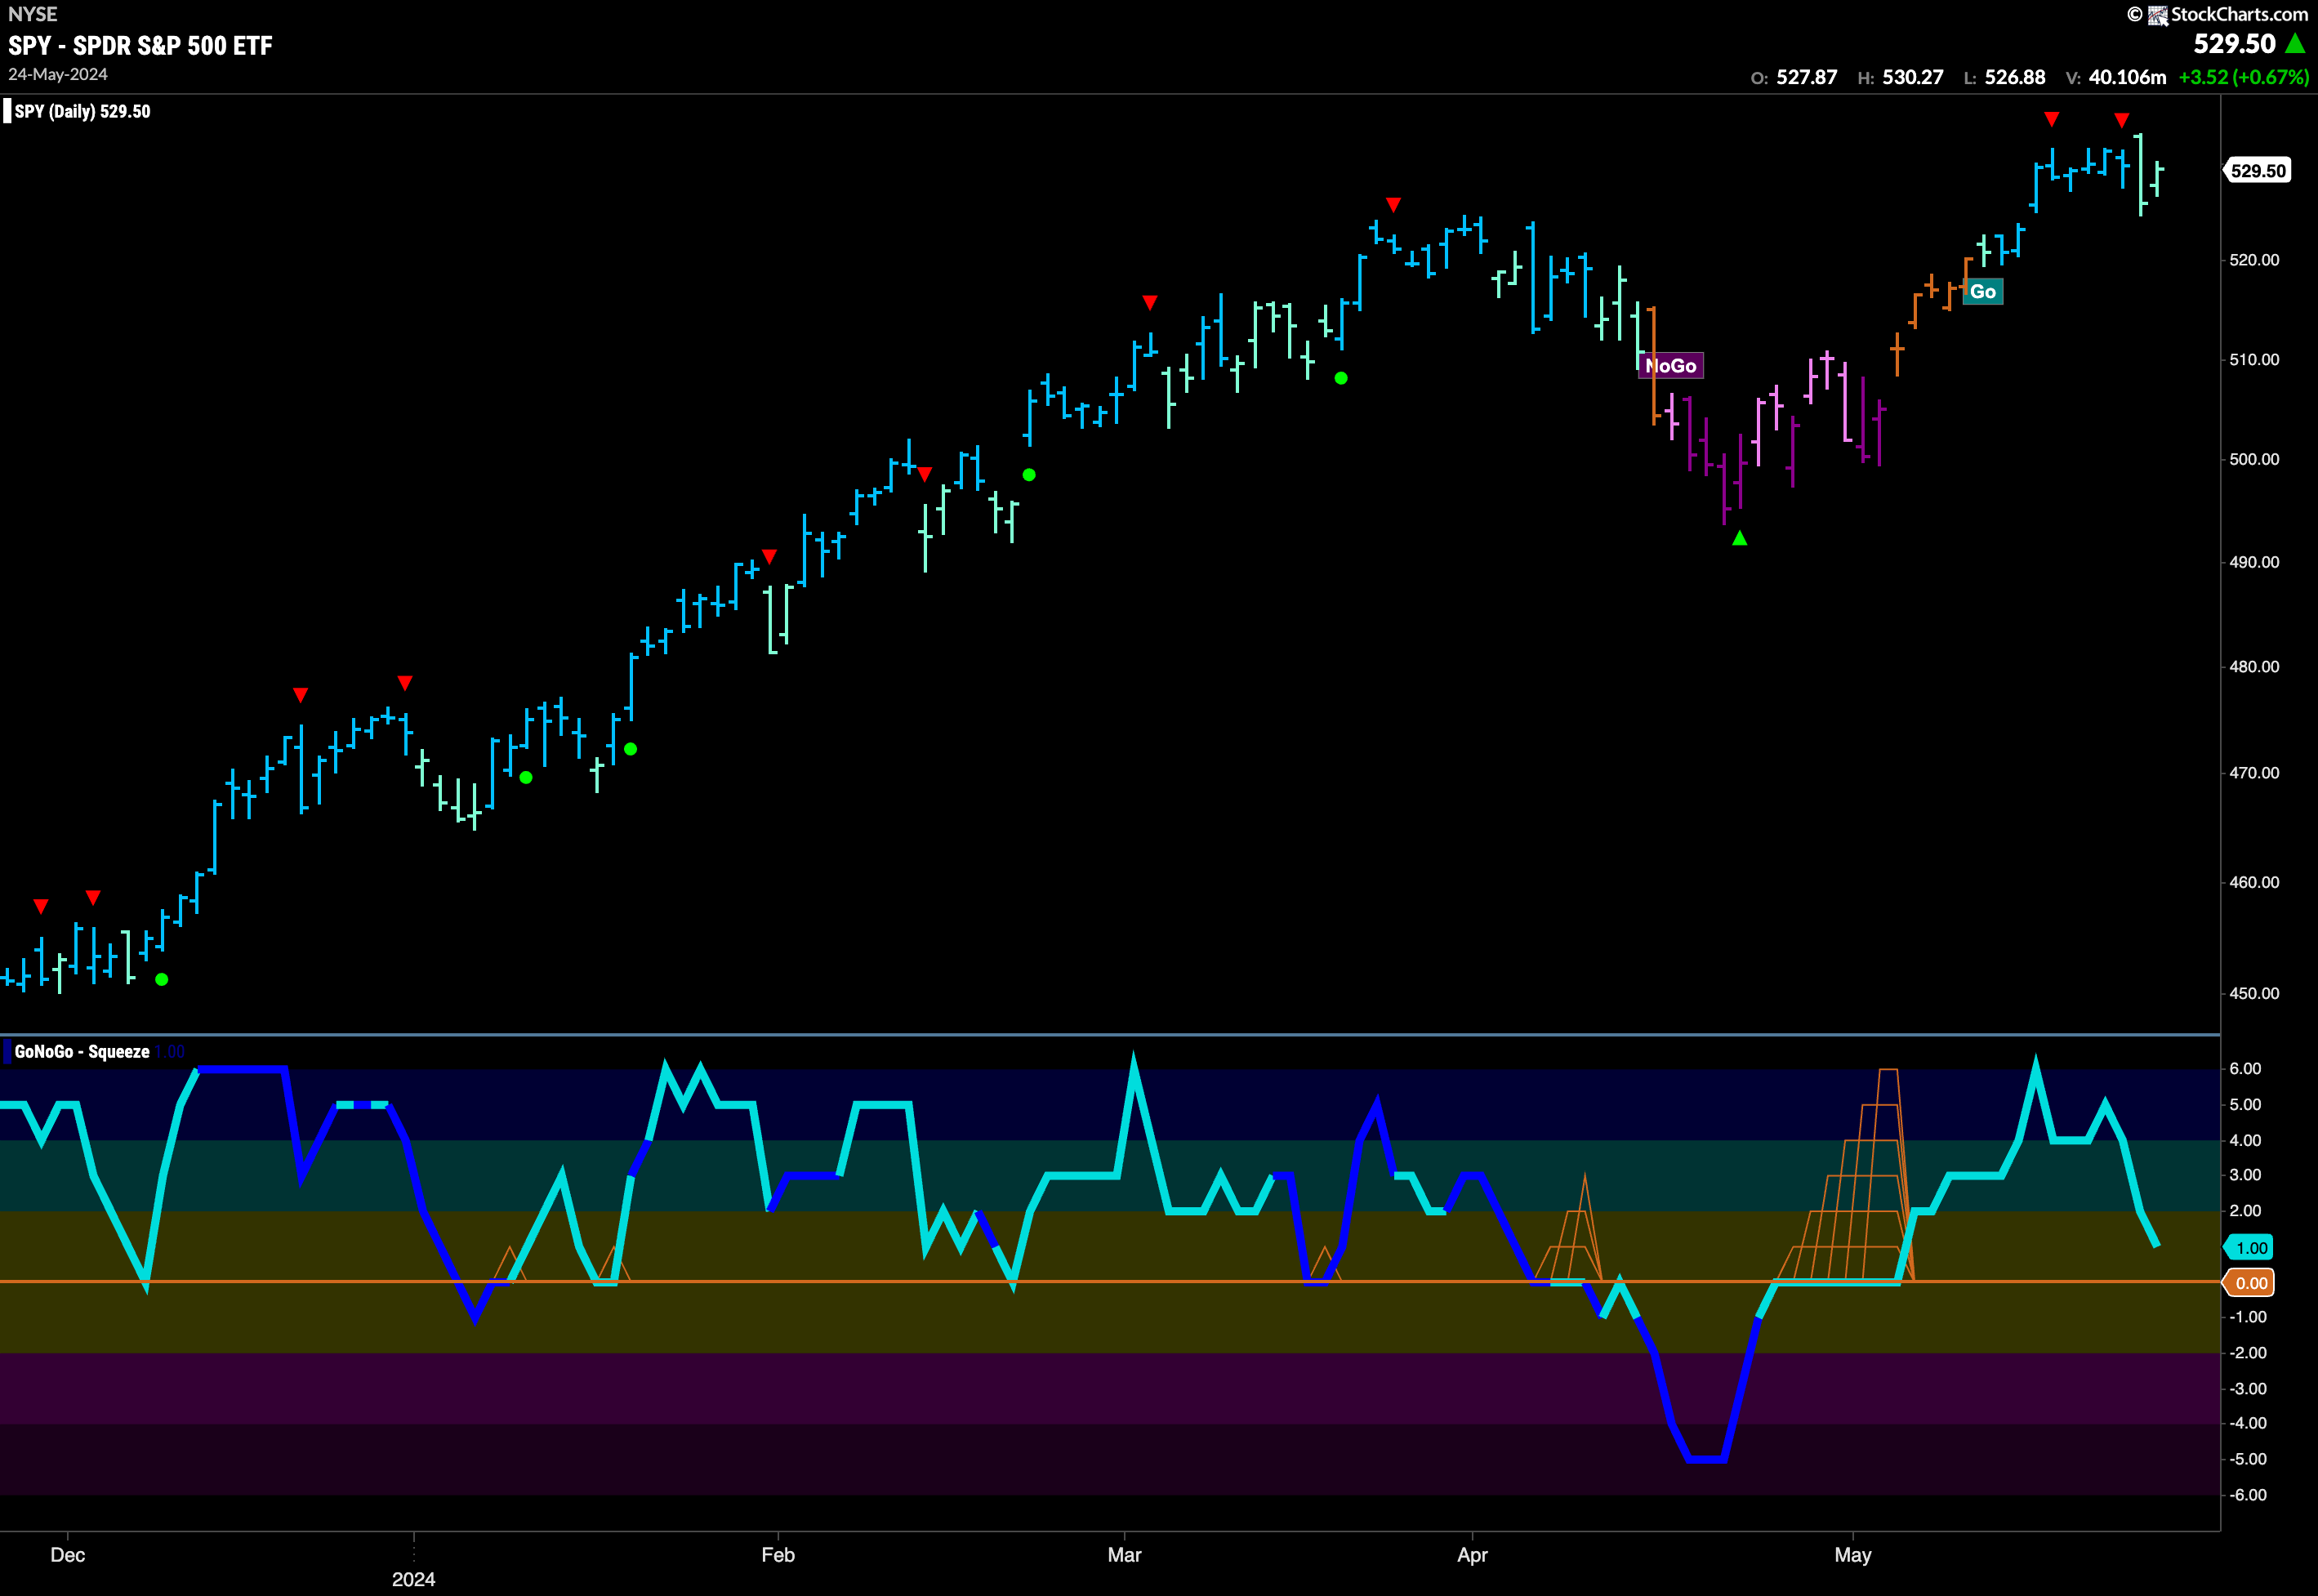
The “Go” remained this week but prices cooled as the market absorbed the gains we’ve seen over the past few weeks. As the week of trading came to a close, we saw weakness as GoNoGo Trend painted a couple of aqua bars. We will now turn out eye to the oscillator panel and watch as GoNoGo Oscillator approaches the zero line. We will look to see if it finds support at this level and bounces back into positive territory. If it does, we will see Go Trend Continuation (green circle) and can expect price to make an attack on a new higher high.
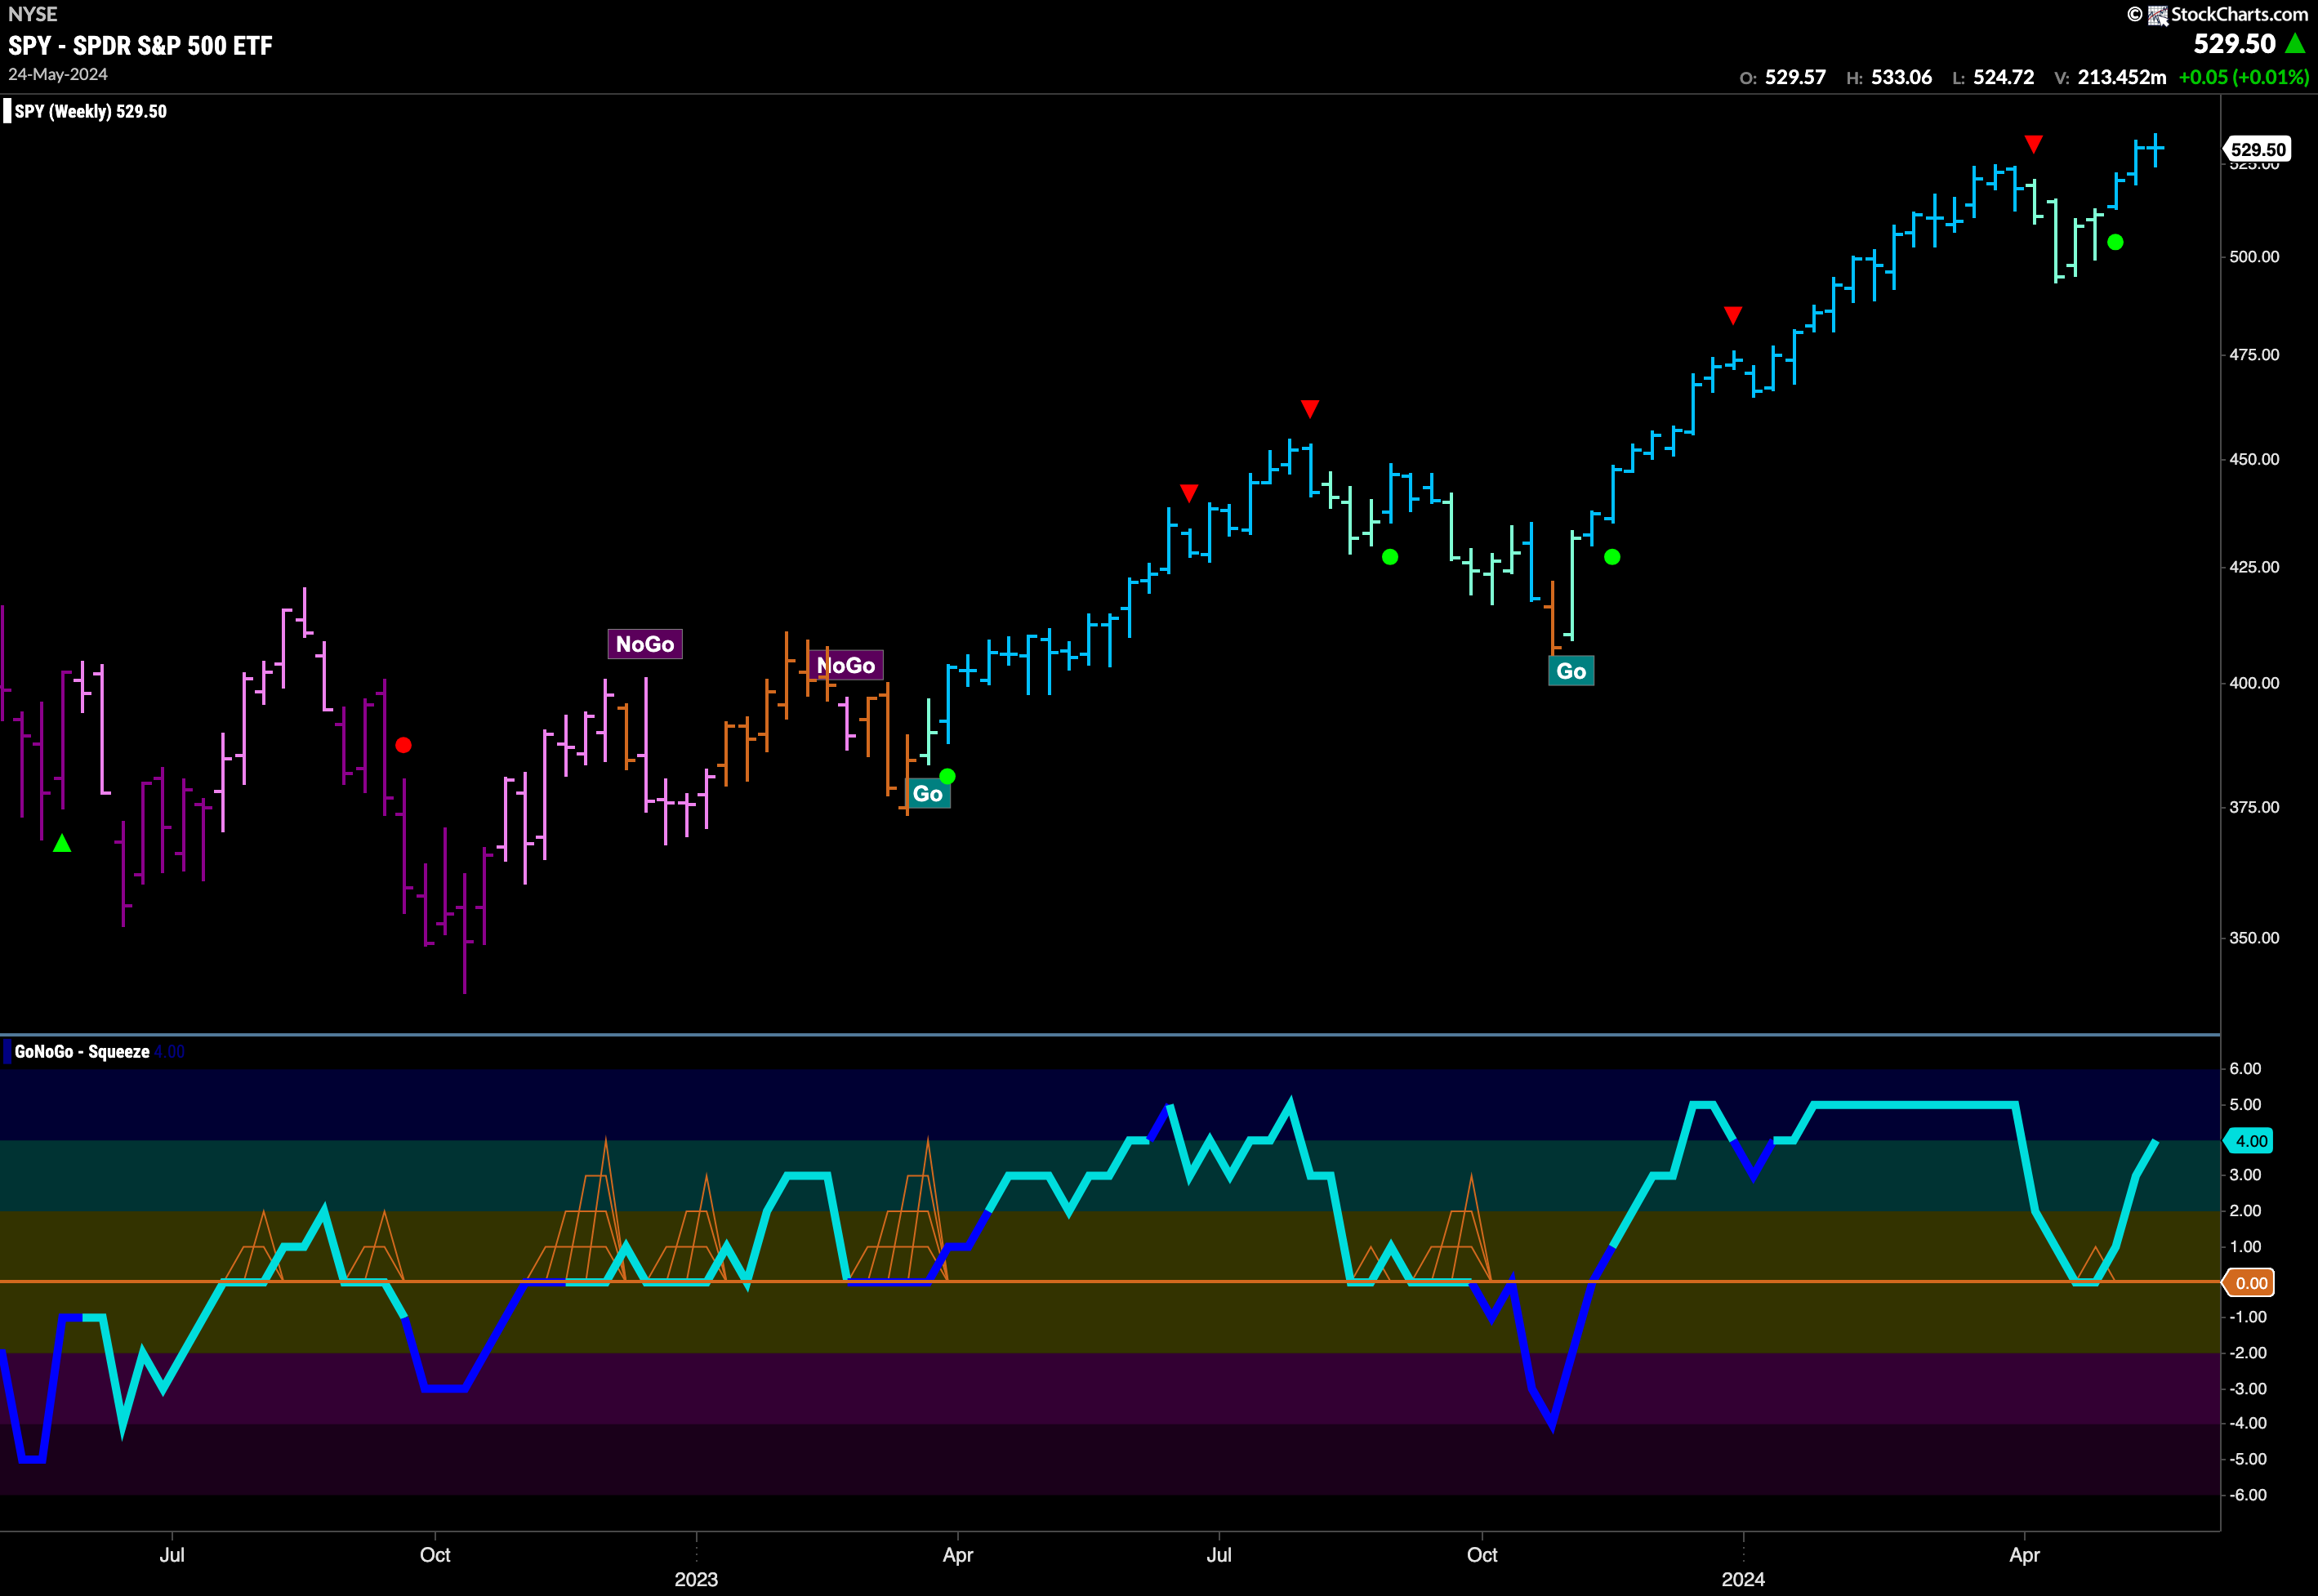
The larger weekly chart shows that the larger picture remains extremely bullish with another strong blue bar painted and price at all time highs. GoNoGo Oscillator is in positive territory but not yet overbought after having found support at the zero level.
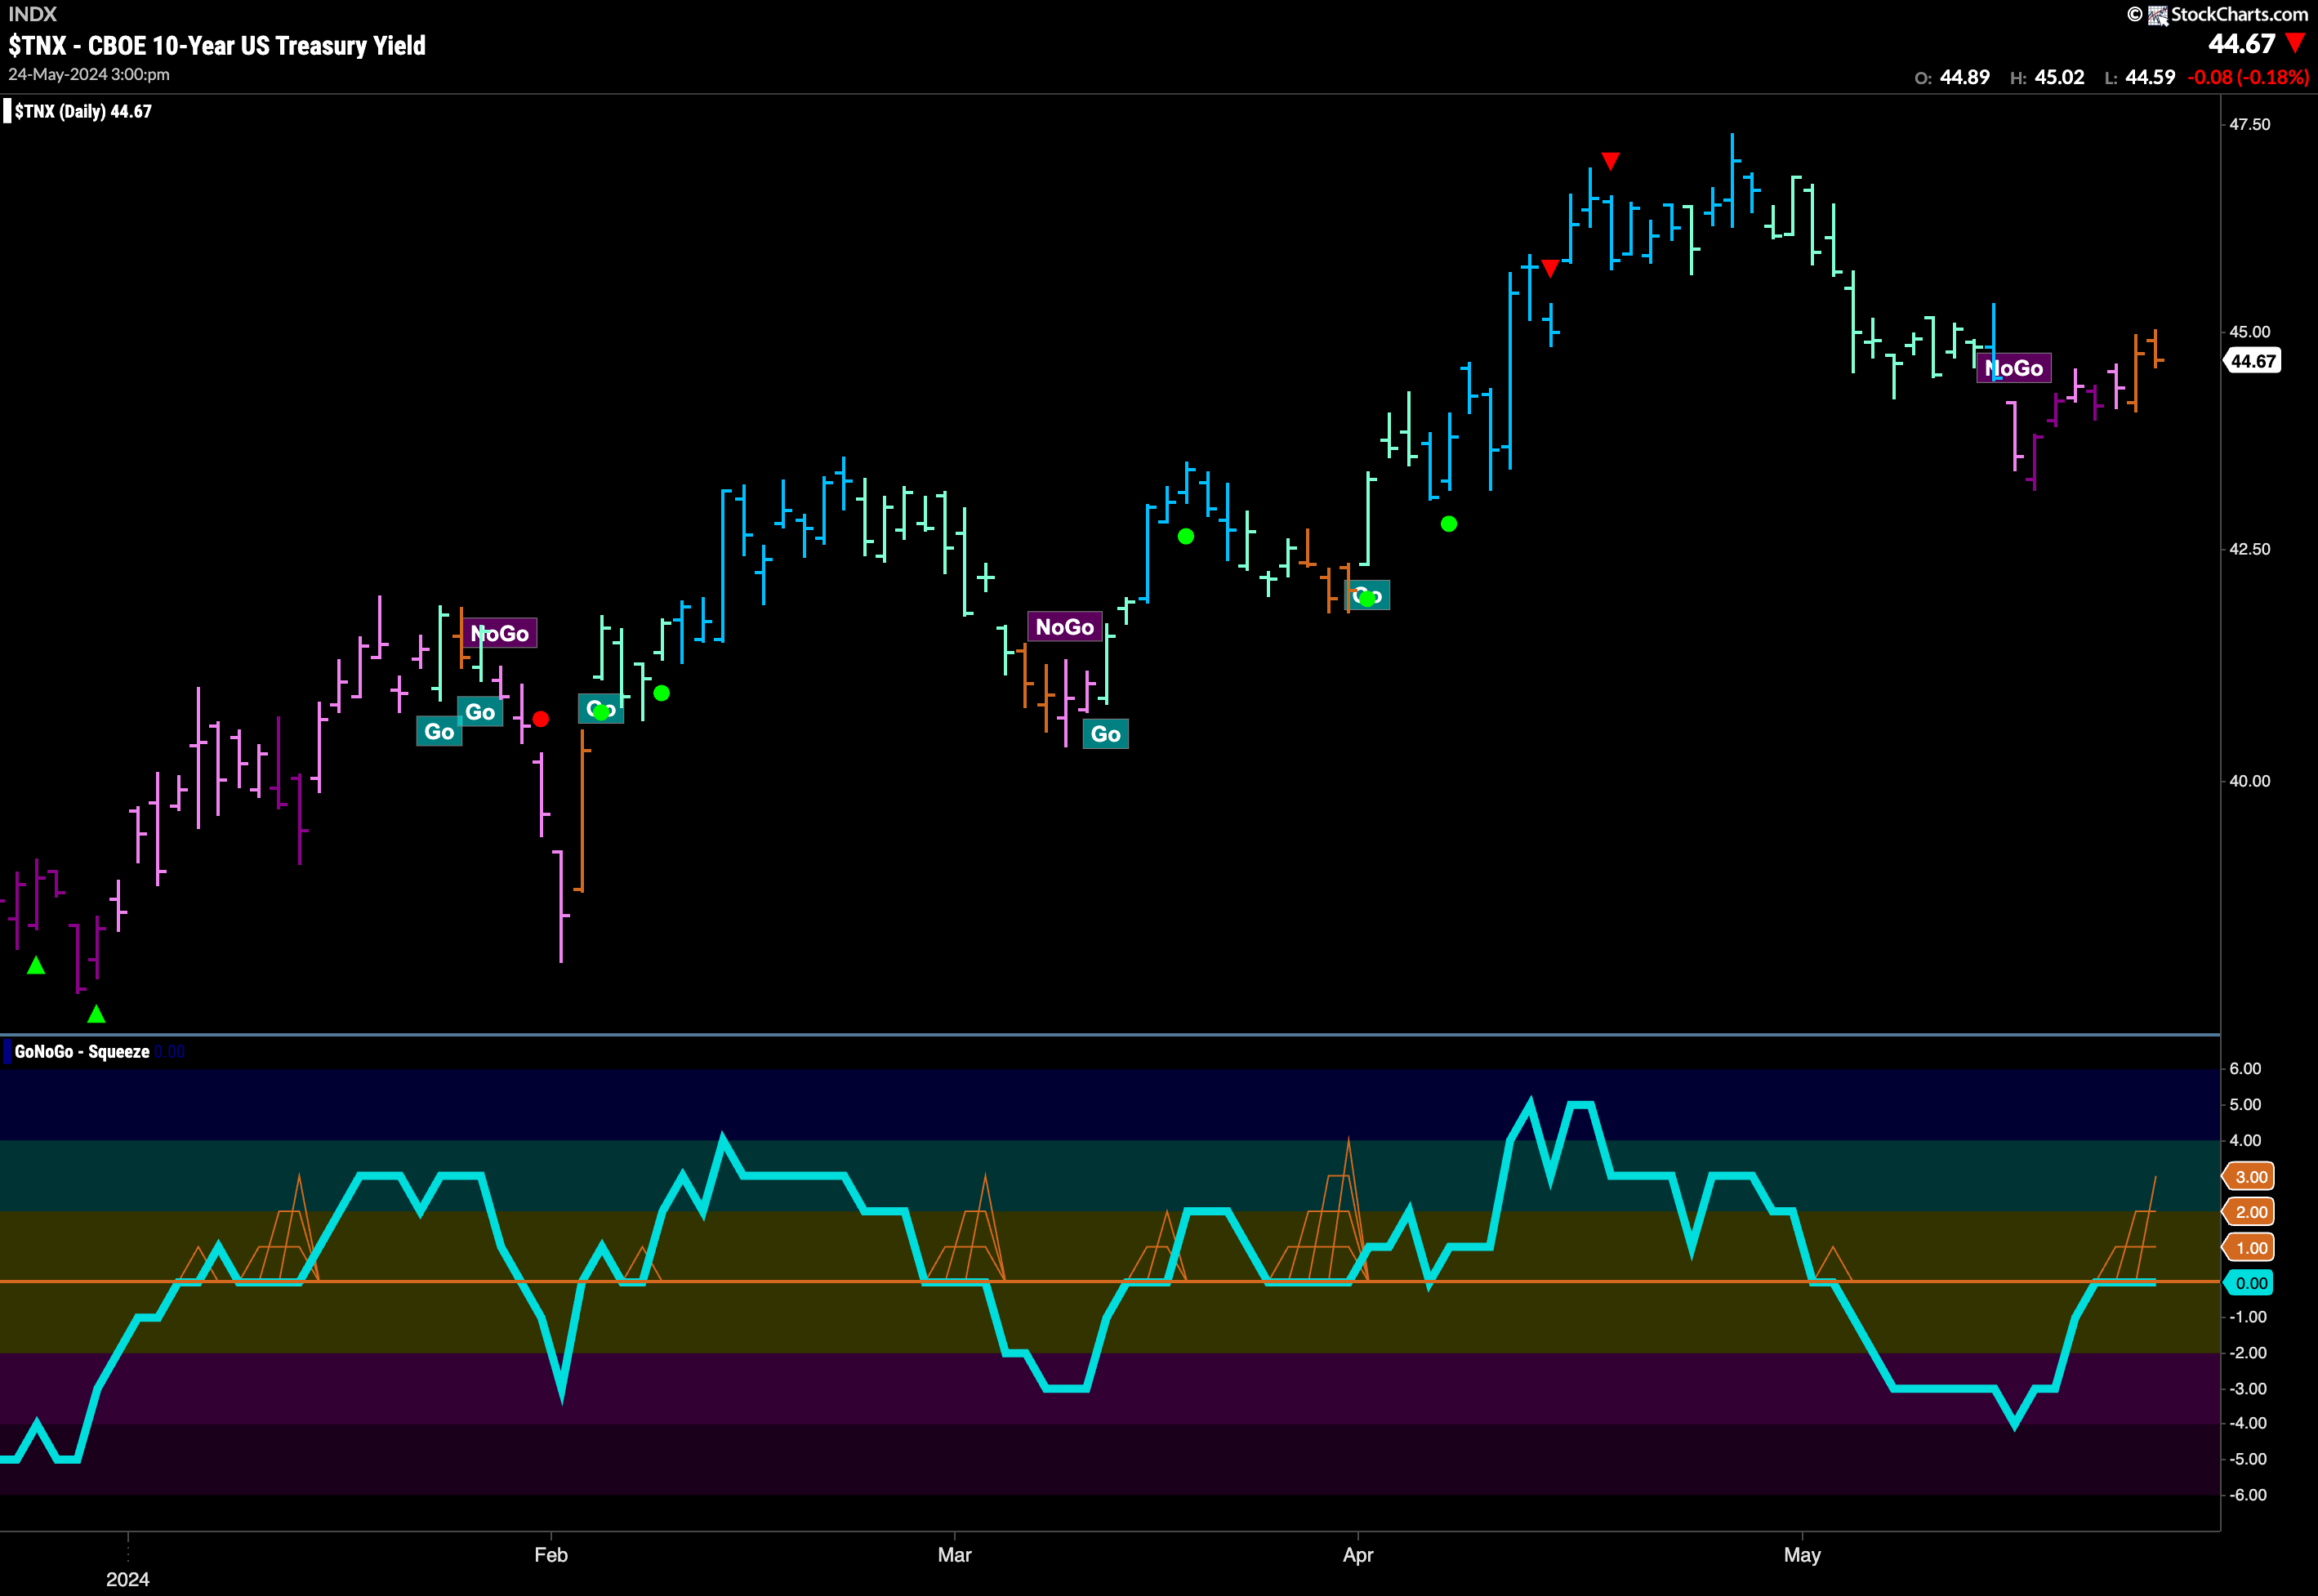
Treasury Rates Flash “Go Fish” Bars
GoNoGo Trend was unable to continue painting amber “Go Fish” bars as last week came to an end. As prices rallied from the most recent low, the indicator rolled out of “NoGo” colors and painted a couple of uncertain “Go Fish” bars. It will be important to note now in which direction the trend goes next. If it falls back into “NoGo” bars that could be a positive for stocks, if it transitions from amber to “Go” colors that could pose a problem. GoNoGo Oscillator is riding the zero line where we see the beginnings of a GoNoGo Squeeze building. The direction of the Squeeze break will likely determine price’s next trend.
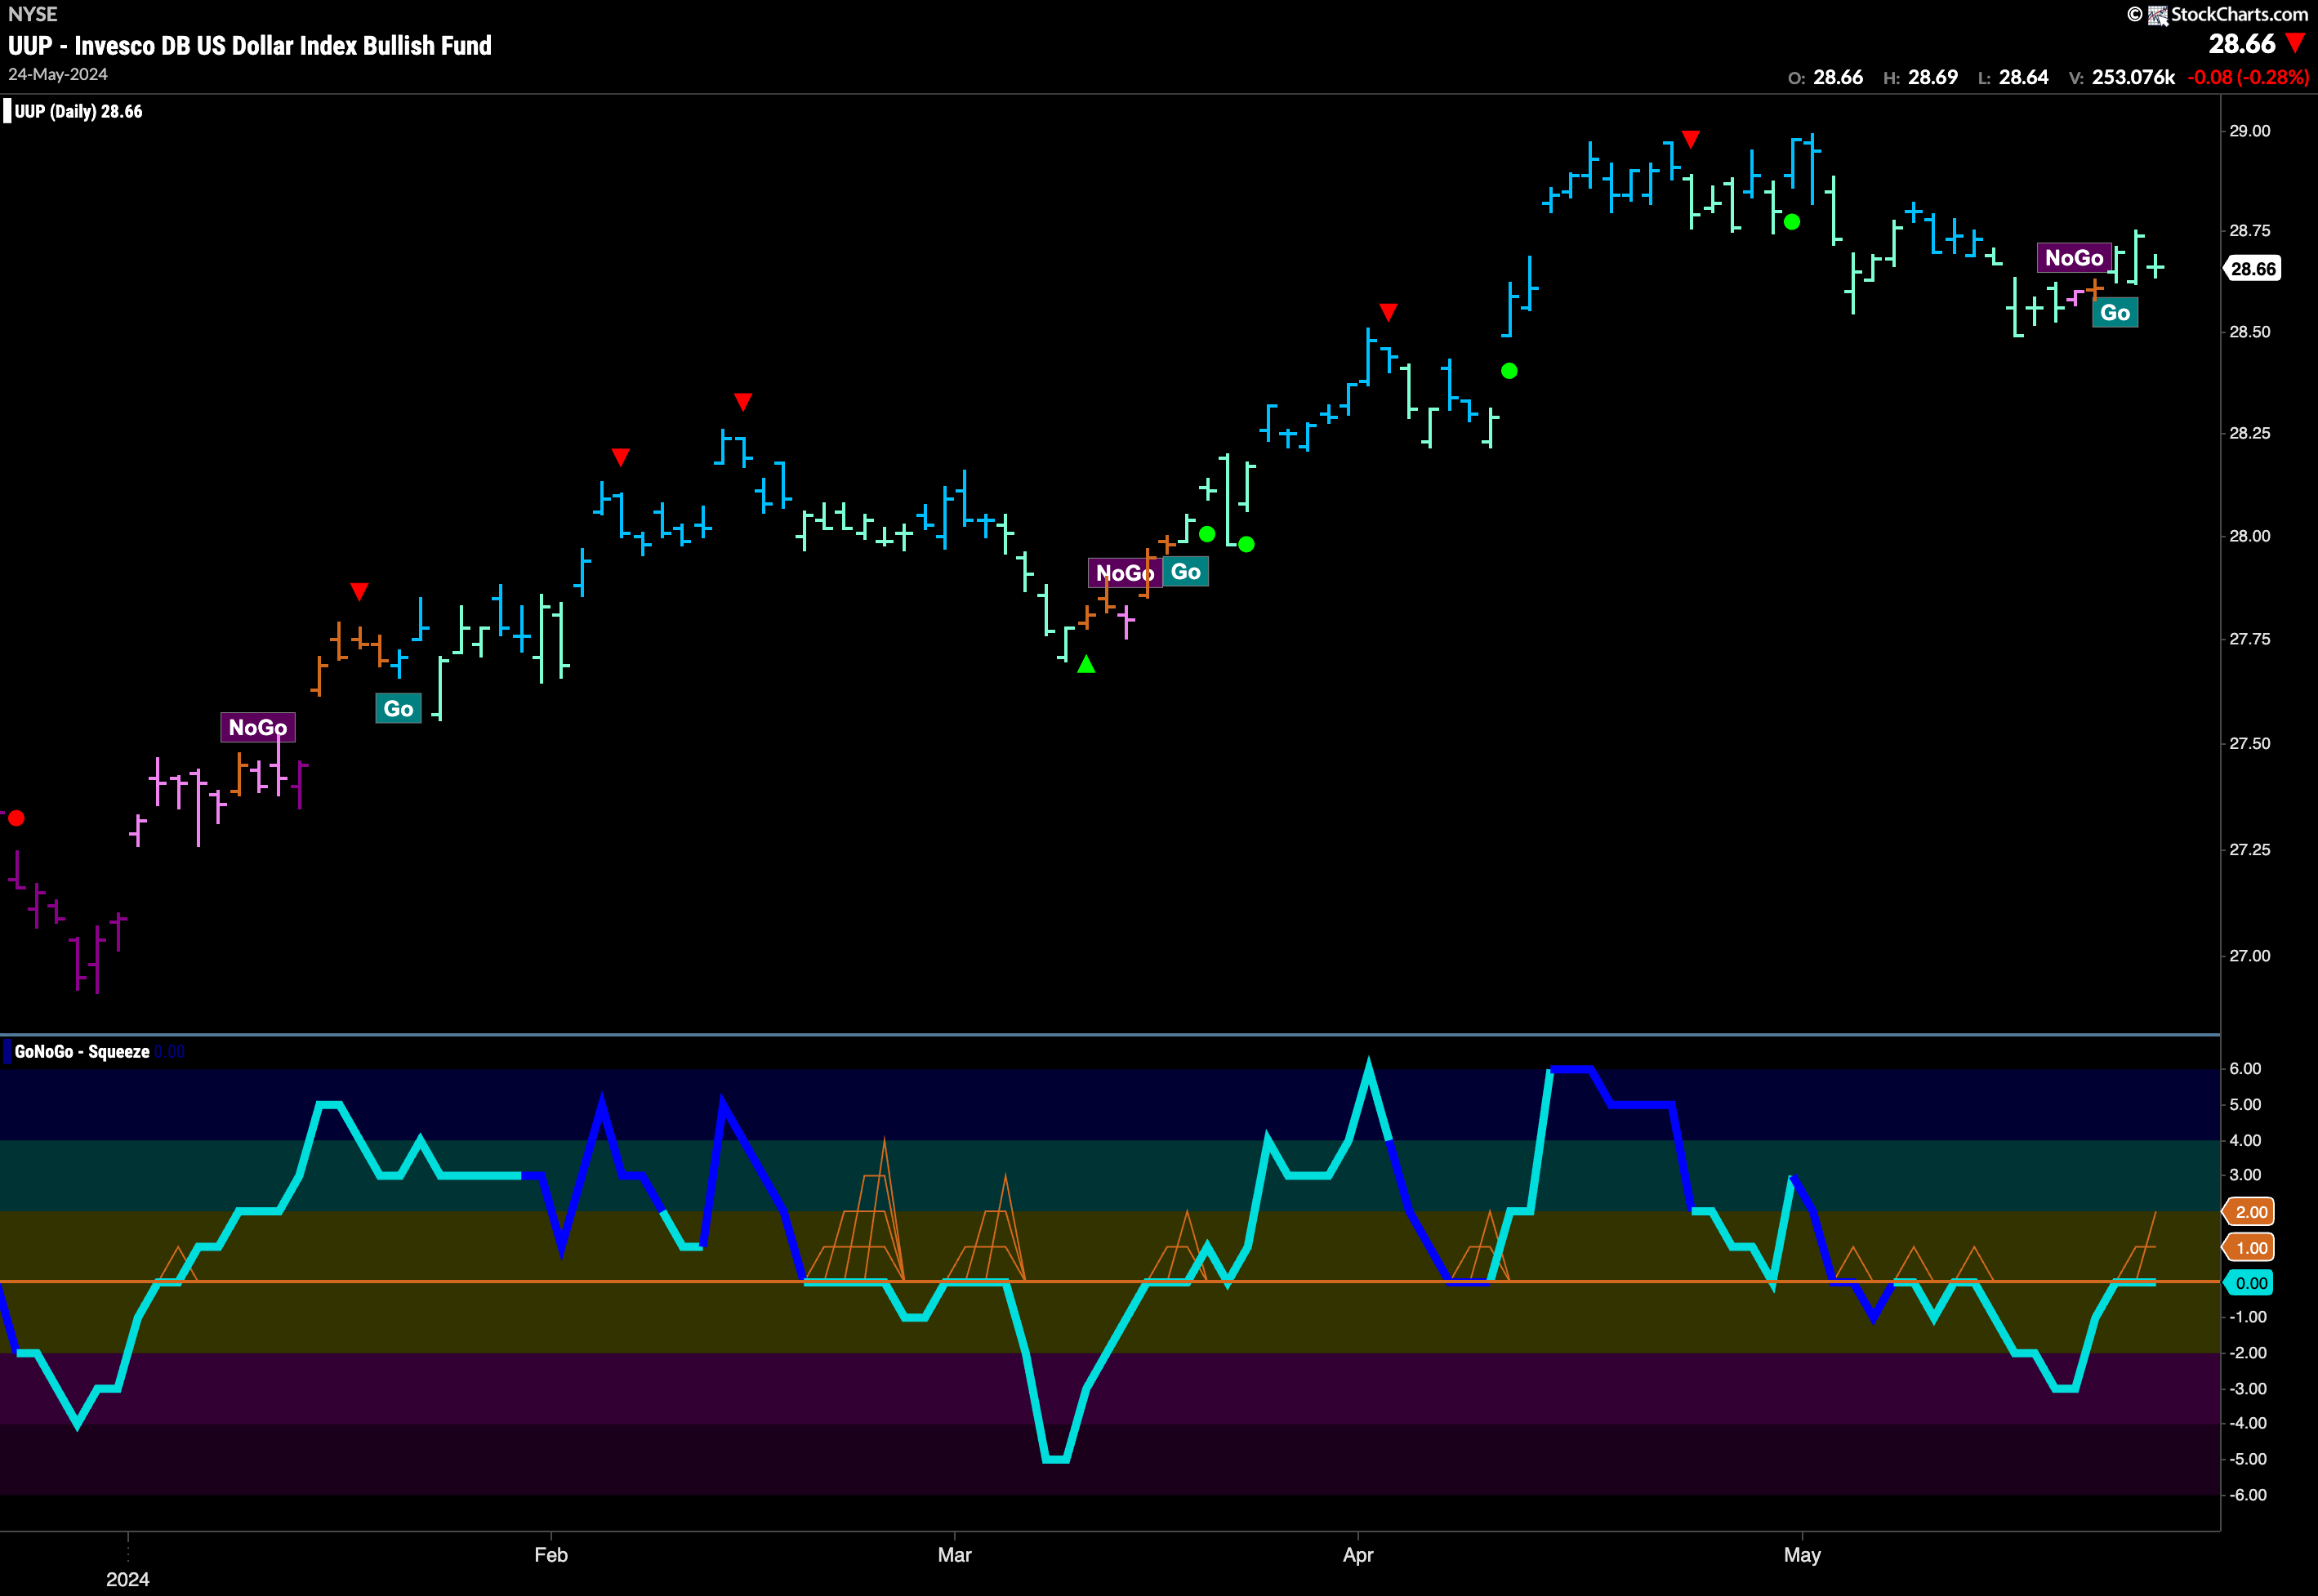
Dollar Recaptures “Go” Trend
After a brief flirtation with a “NoGo” and a “Go Fish” bar, the dollar was able to regain “Go” colors albeit weaker aqua ones. This is an inflection point for the dollar, as we can see that GoNoGo Oscillator is back testing the zero line from below. The oscillator has been in negative territory for a few weeks now, so if the “Go” trend is to survive, it will need to break back into positive territory. If it does, we will likely see the “Go” trend strengthen. If it is rejected again at the zero level, then we will expect further struggles for price.
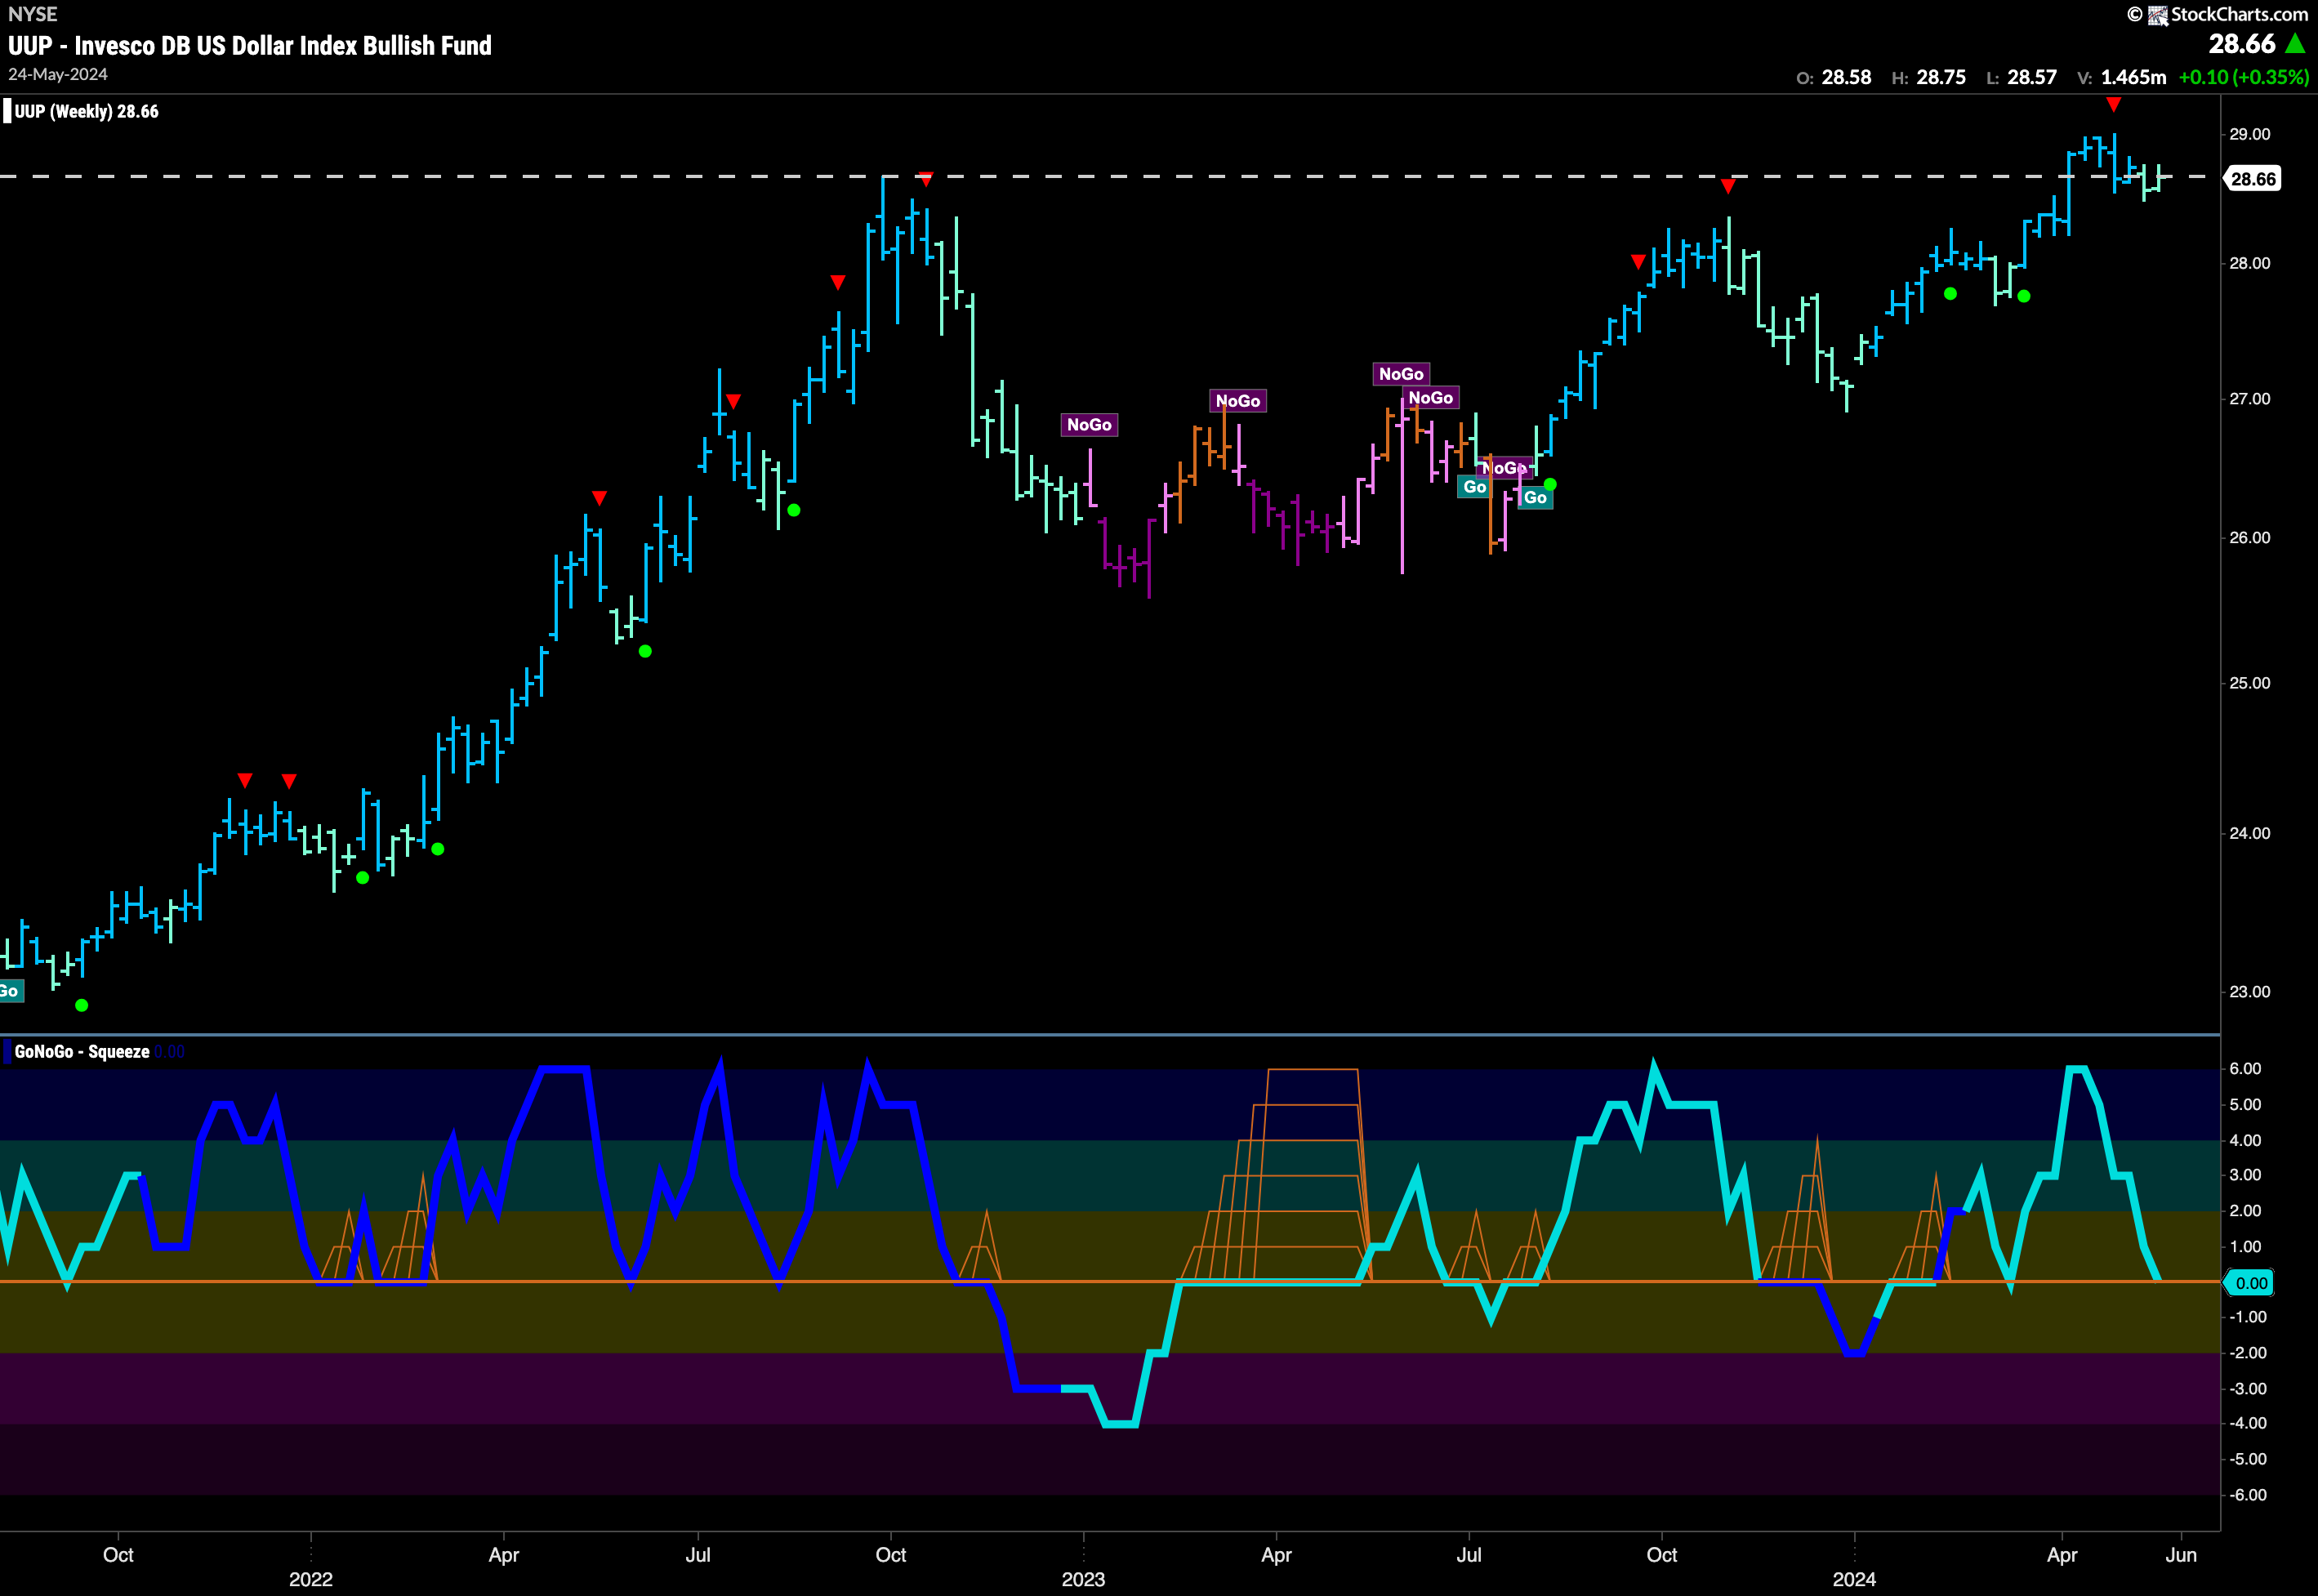
The weekly chart continues to show us how important these levels are. With price now trying hard to find support at prior high levels from over a year ago, GoNoGo Oscillator has crashed back to the zero line. We will watch to see if it finds support here. If it does, we will see a Go Trend Continuation Icon (green circle) under the price bar as an oscillator bounce back into positive territory will tell us that momentum is resurgent in the direction of the underlying “Go” trend.
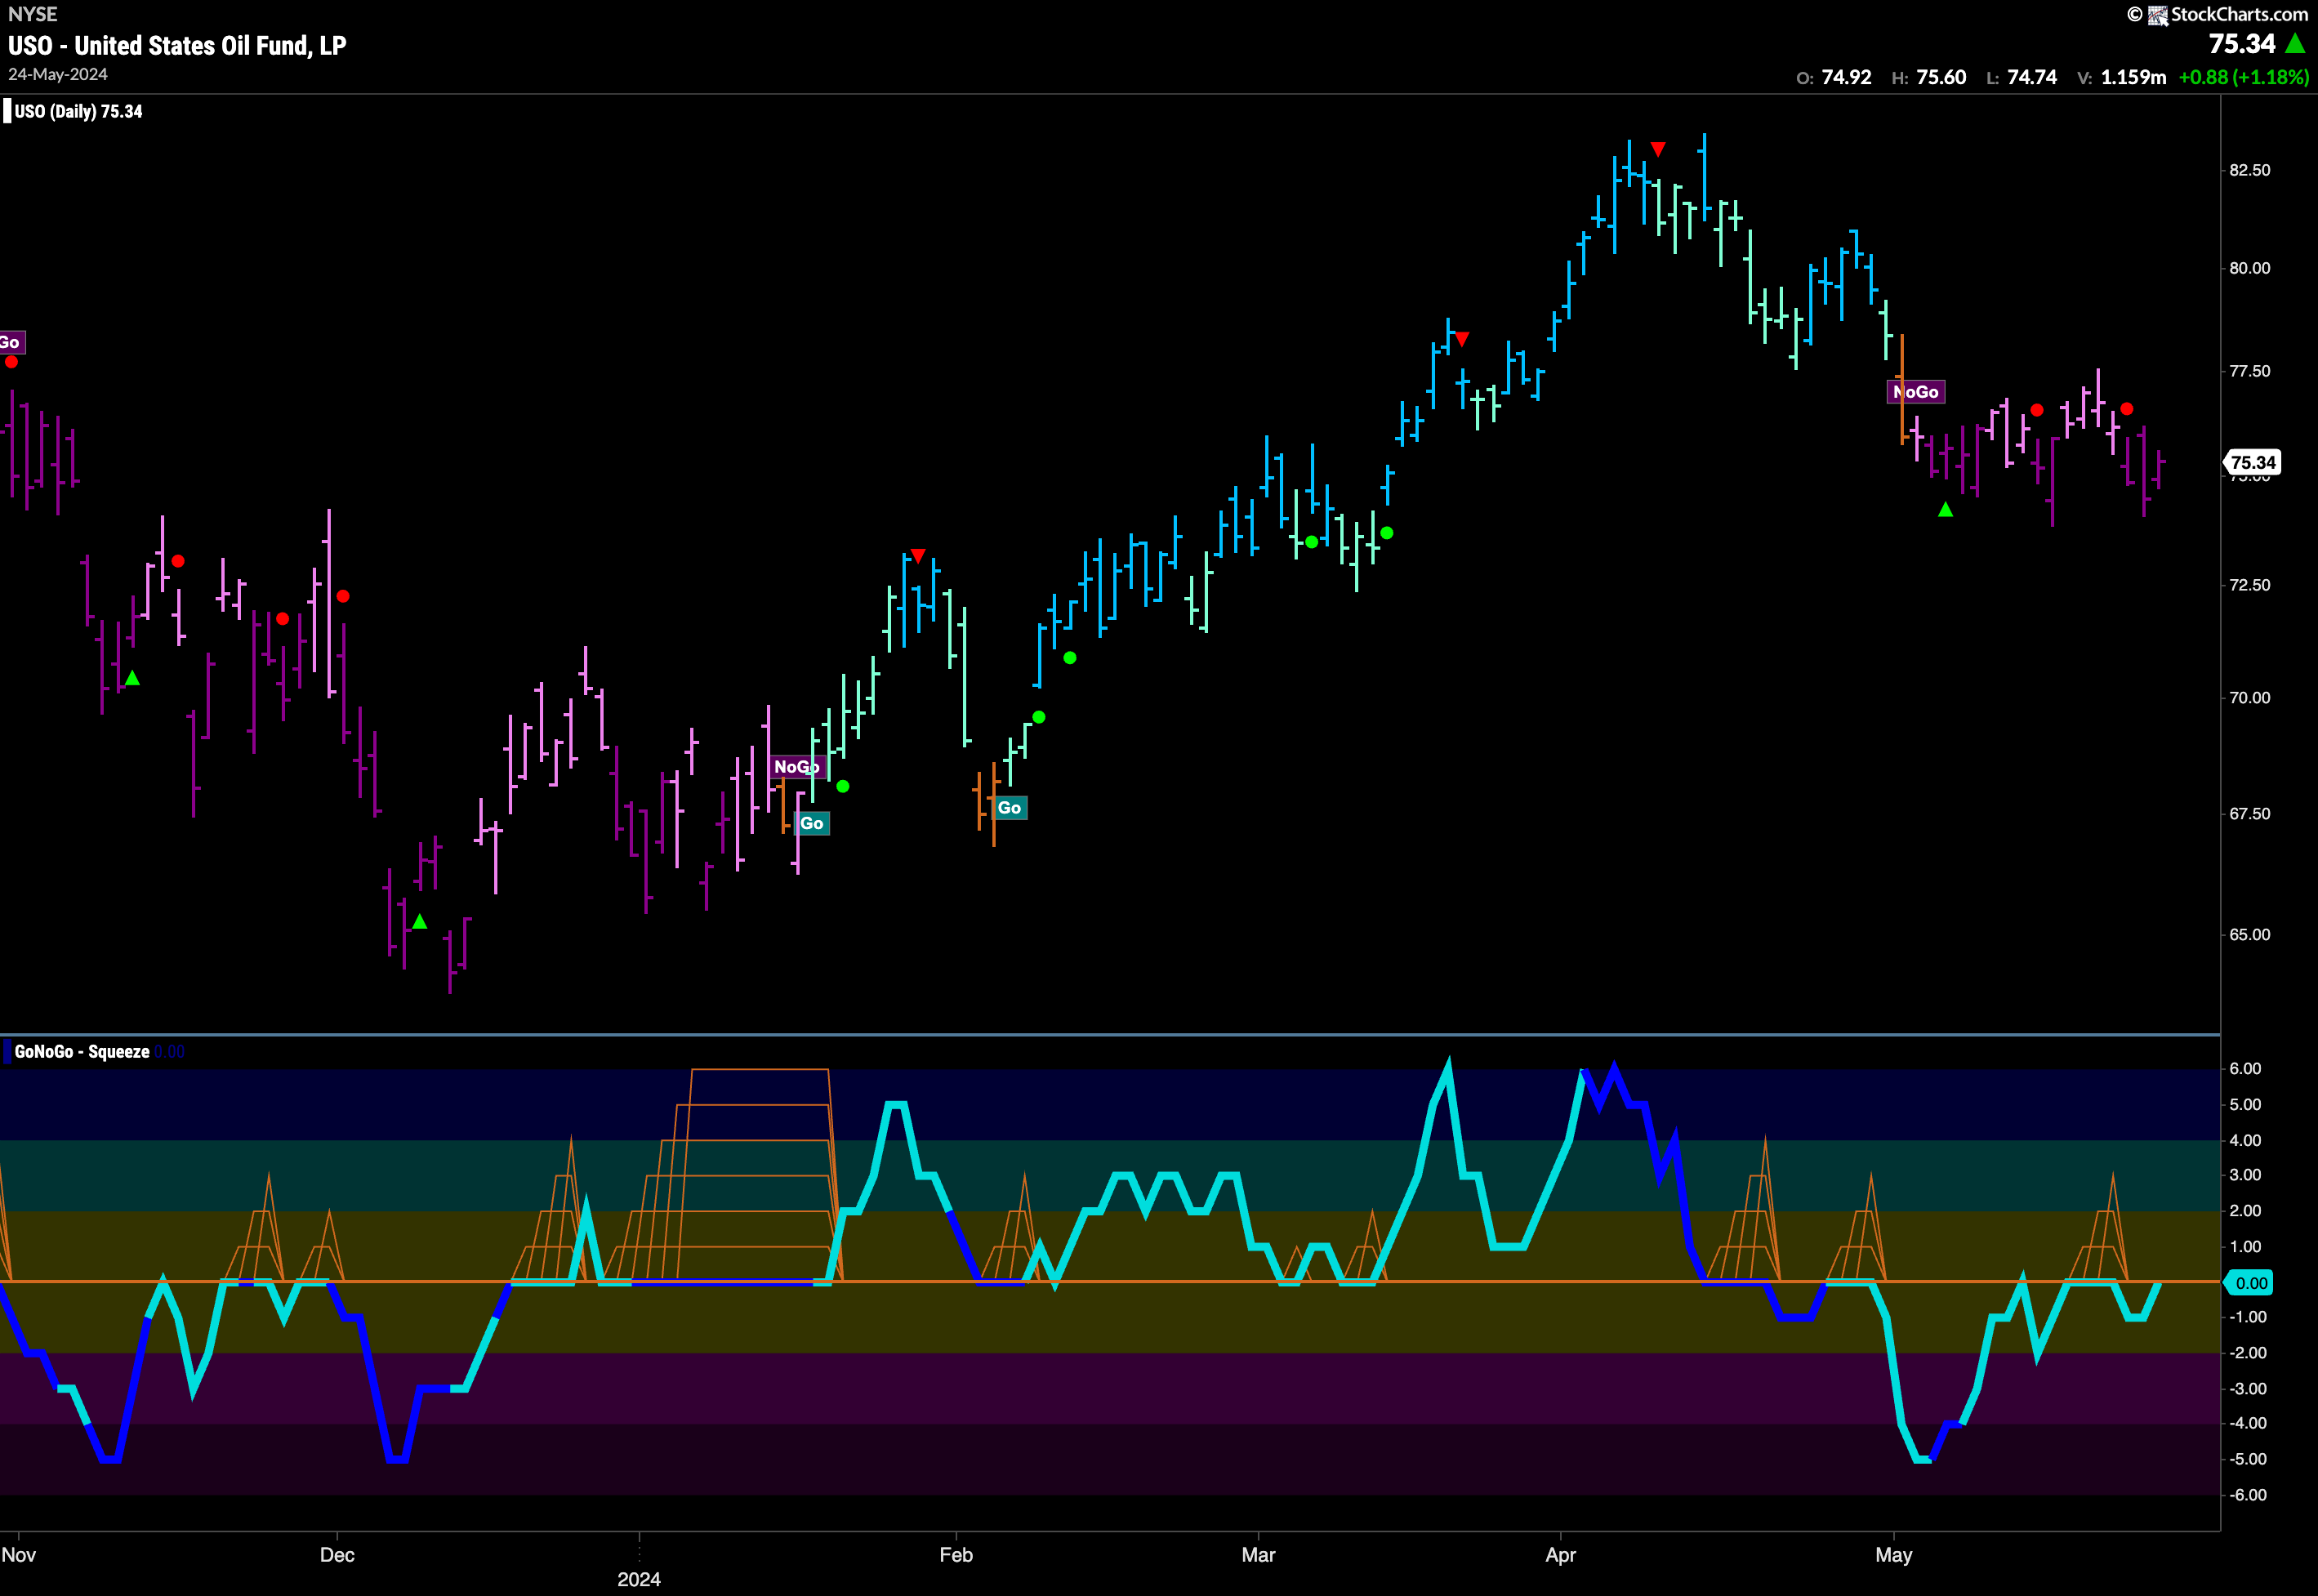
Oil Stays in “NoGo” Trend
The “NoGo” trend is firmly in place, as price edges lower since falling into a “NoGo” trend a month ago. We have now set a lower high, and with GoNoGo Trend painting strong purple bars we know the weight of the evidence suggests further downward pressure. GoNoGo Oscillator has rallied however to test the zero line from below. For us to be confident of new lower lows, we will need to see the zero line act as resistance and turn the oscillator away back into negative territory.
Gold Failed at Prior High Resistance
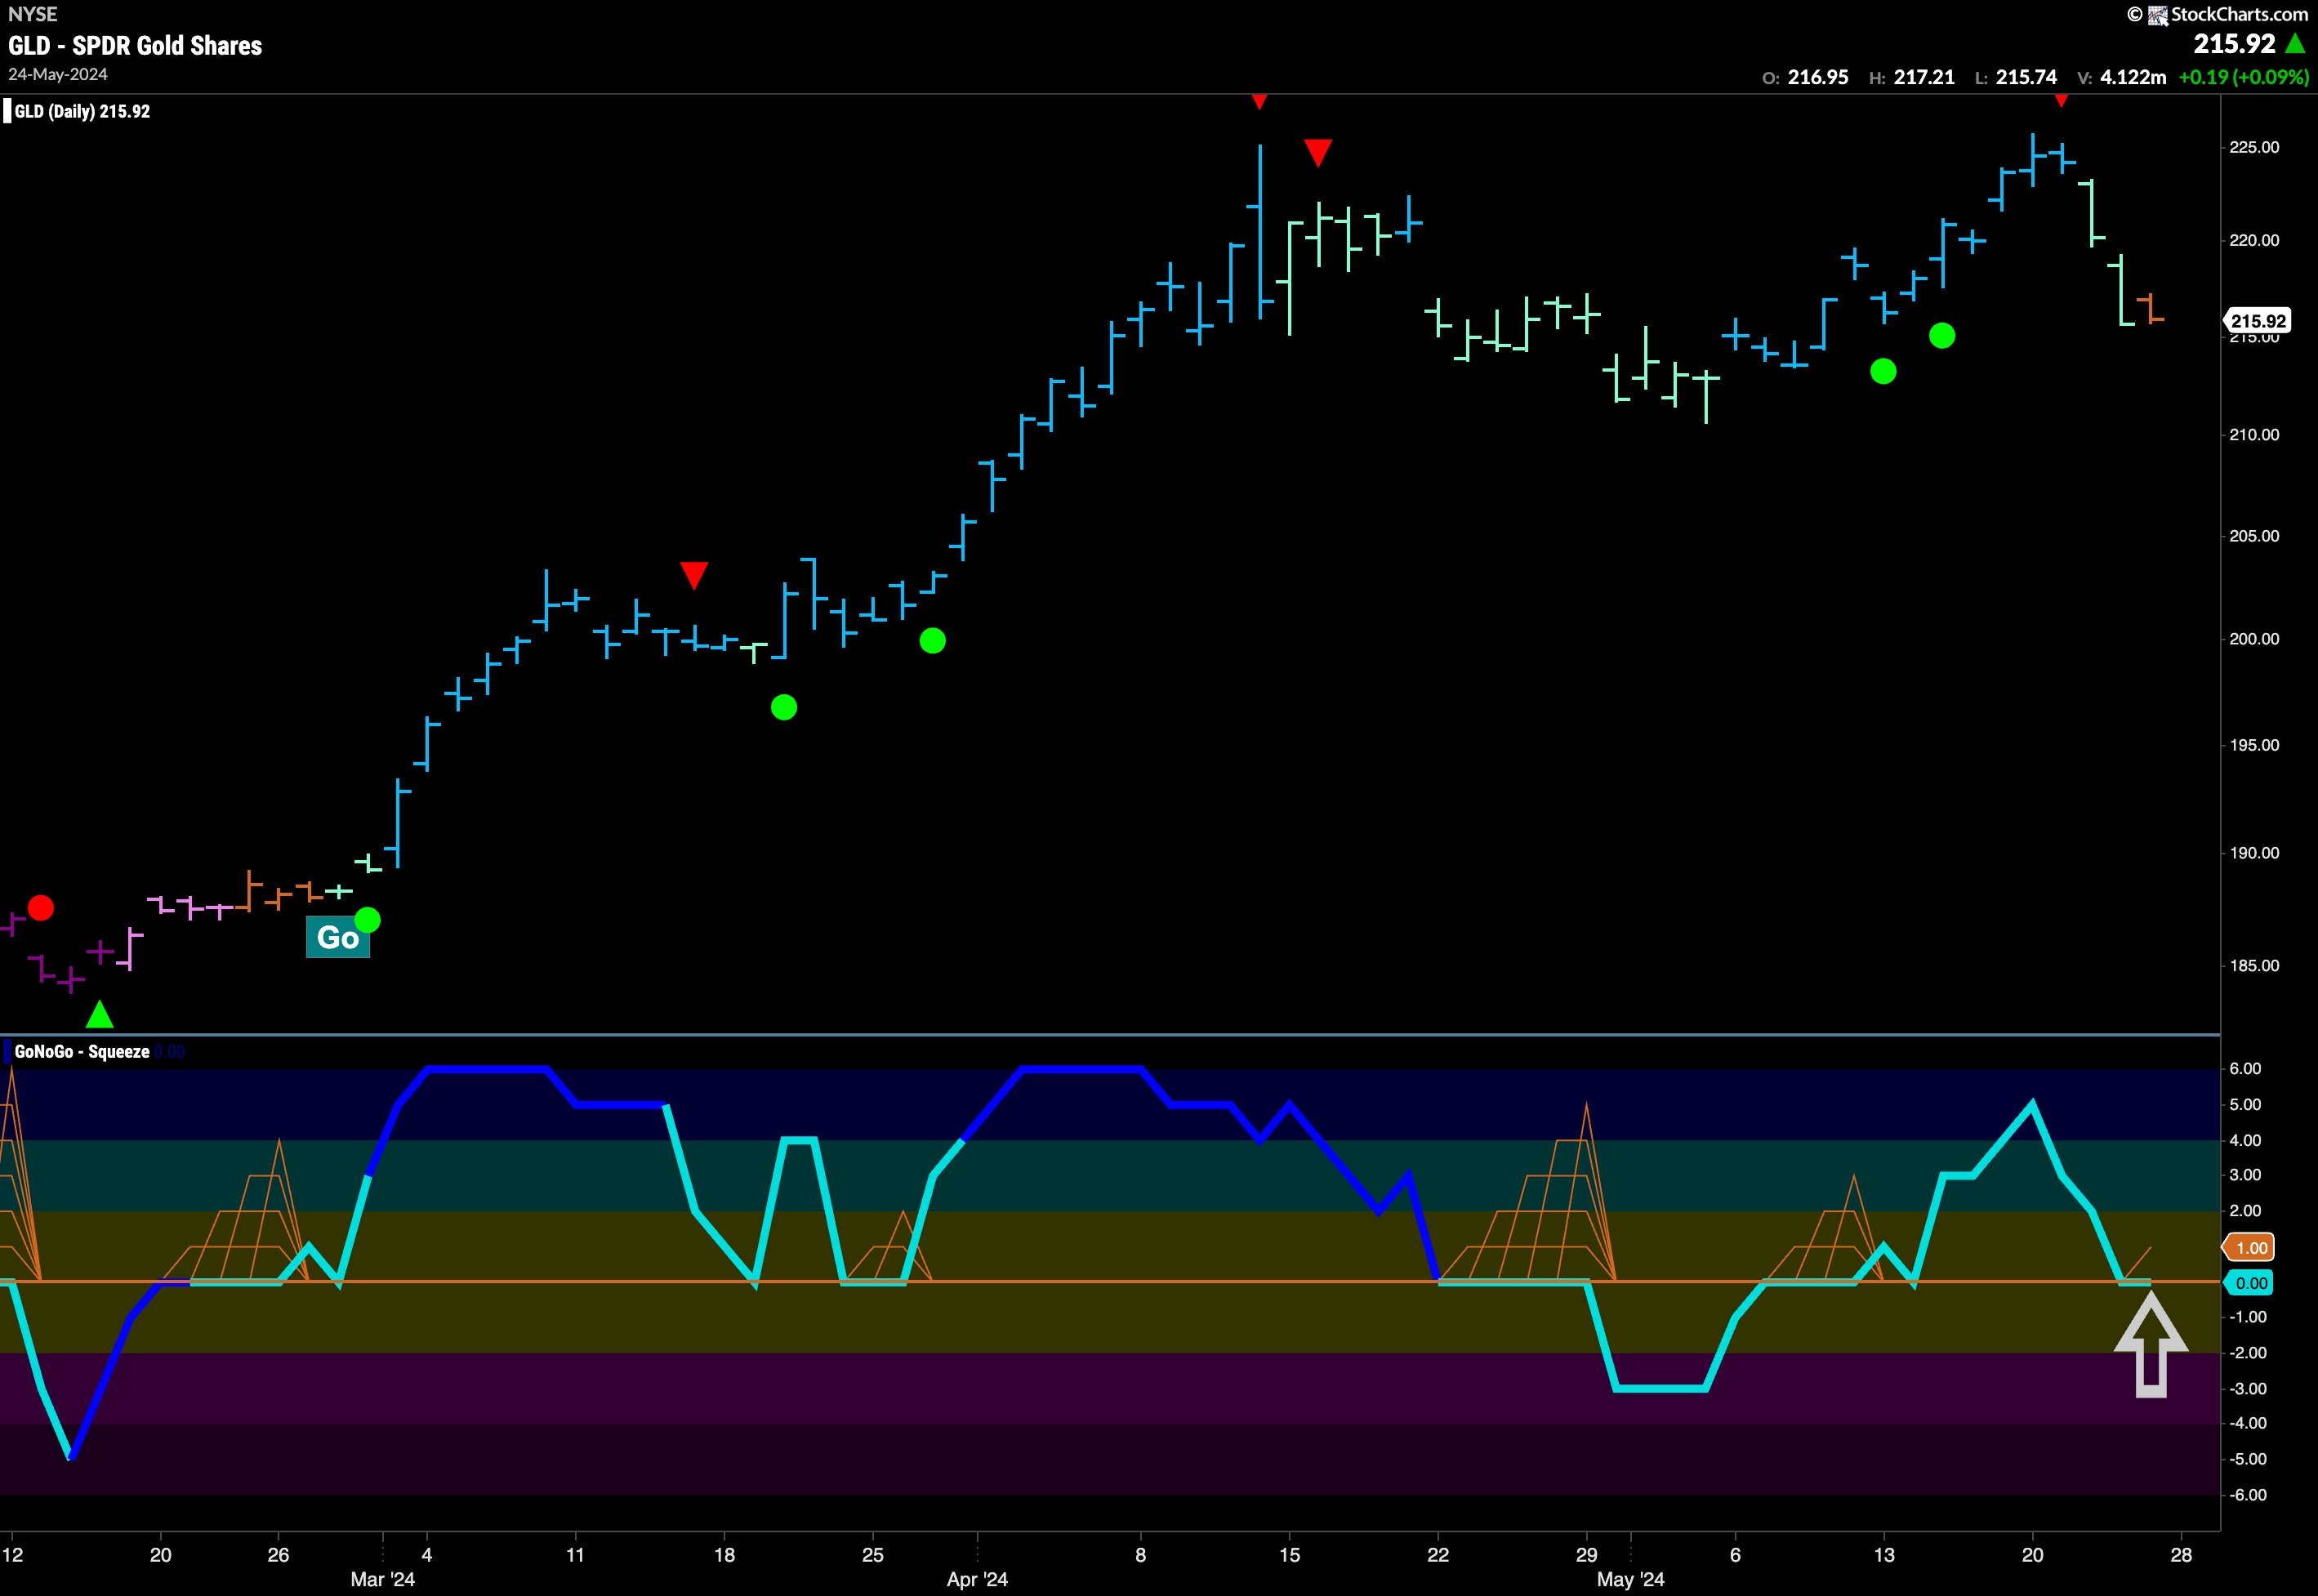
Price fell dramatically last week after failing to set a new higher high. After a Go Countertrend Correction Icon (red arrow) at the most recent high, GoNoGo Trend painted a couple of weaker aqua bars before seeing an amber “Go Fish bar. GoNoGo Oscillator has fallen to test the zero level from above and we will watch to see if it finds support. Price is currently higher than prior lows and so there may be support to be had going forward. If the oscillator bounces back into positive territory it would be quite likely that we see the “Go” return.
Sector RelMap
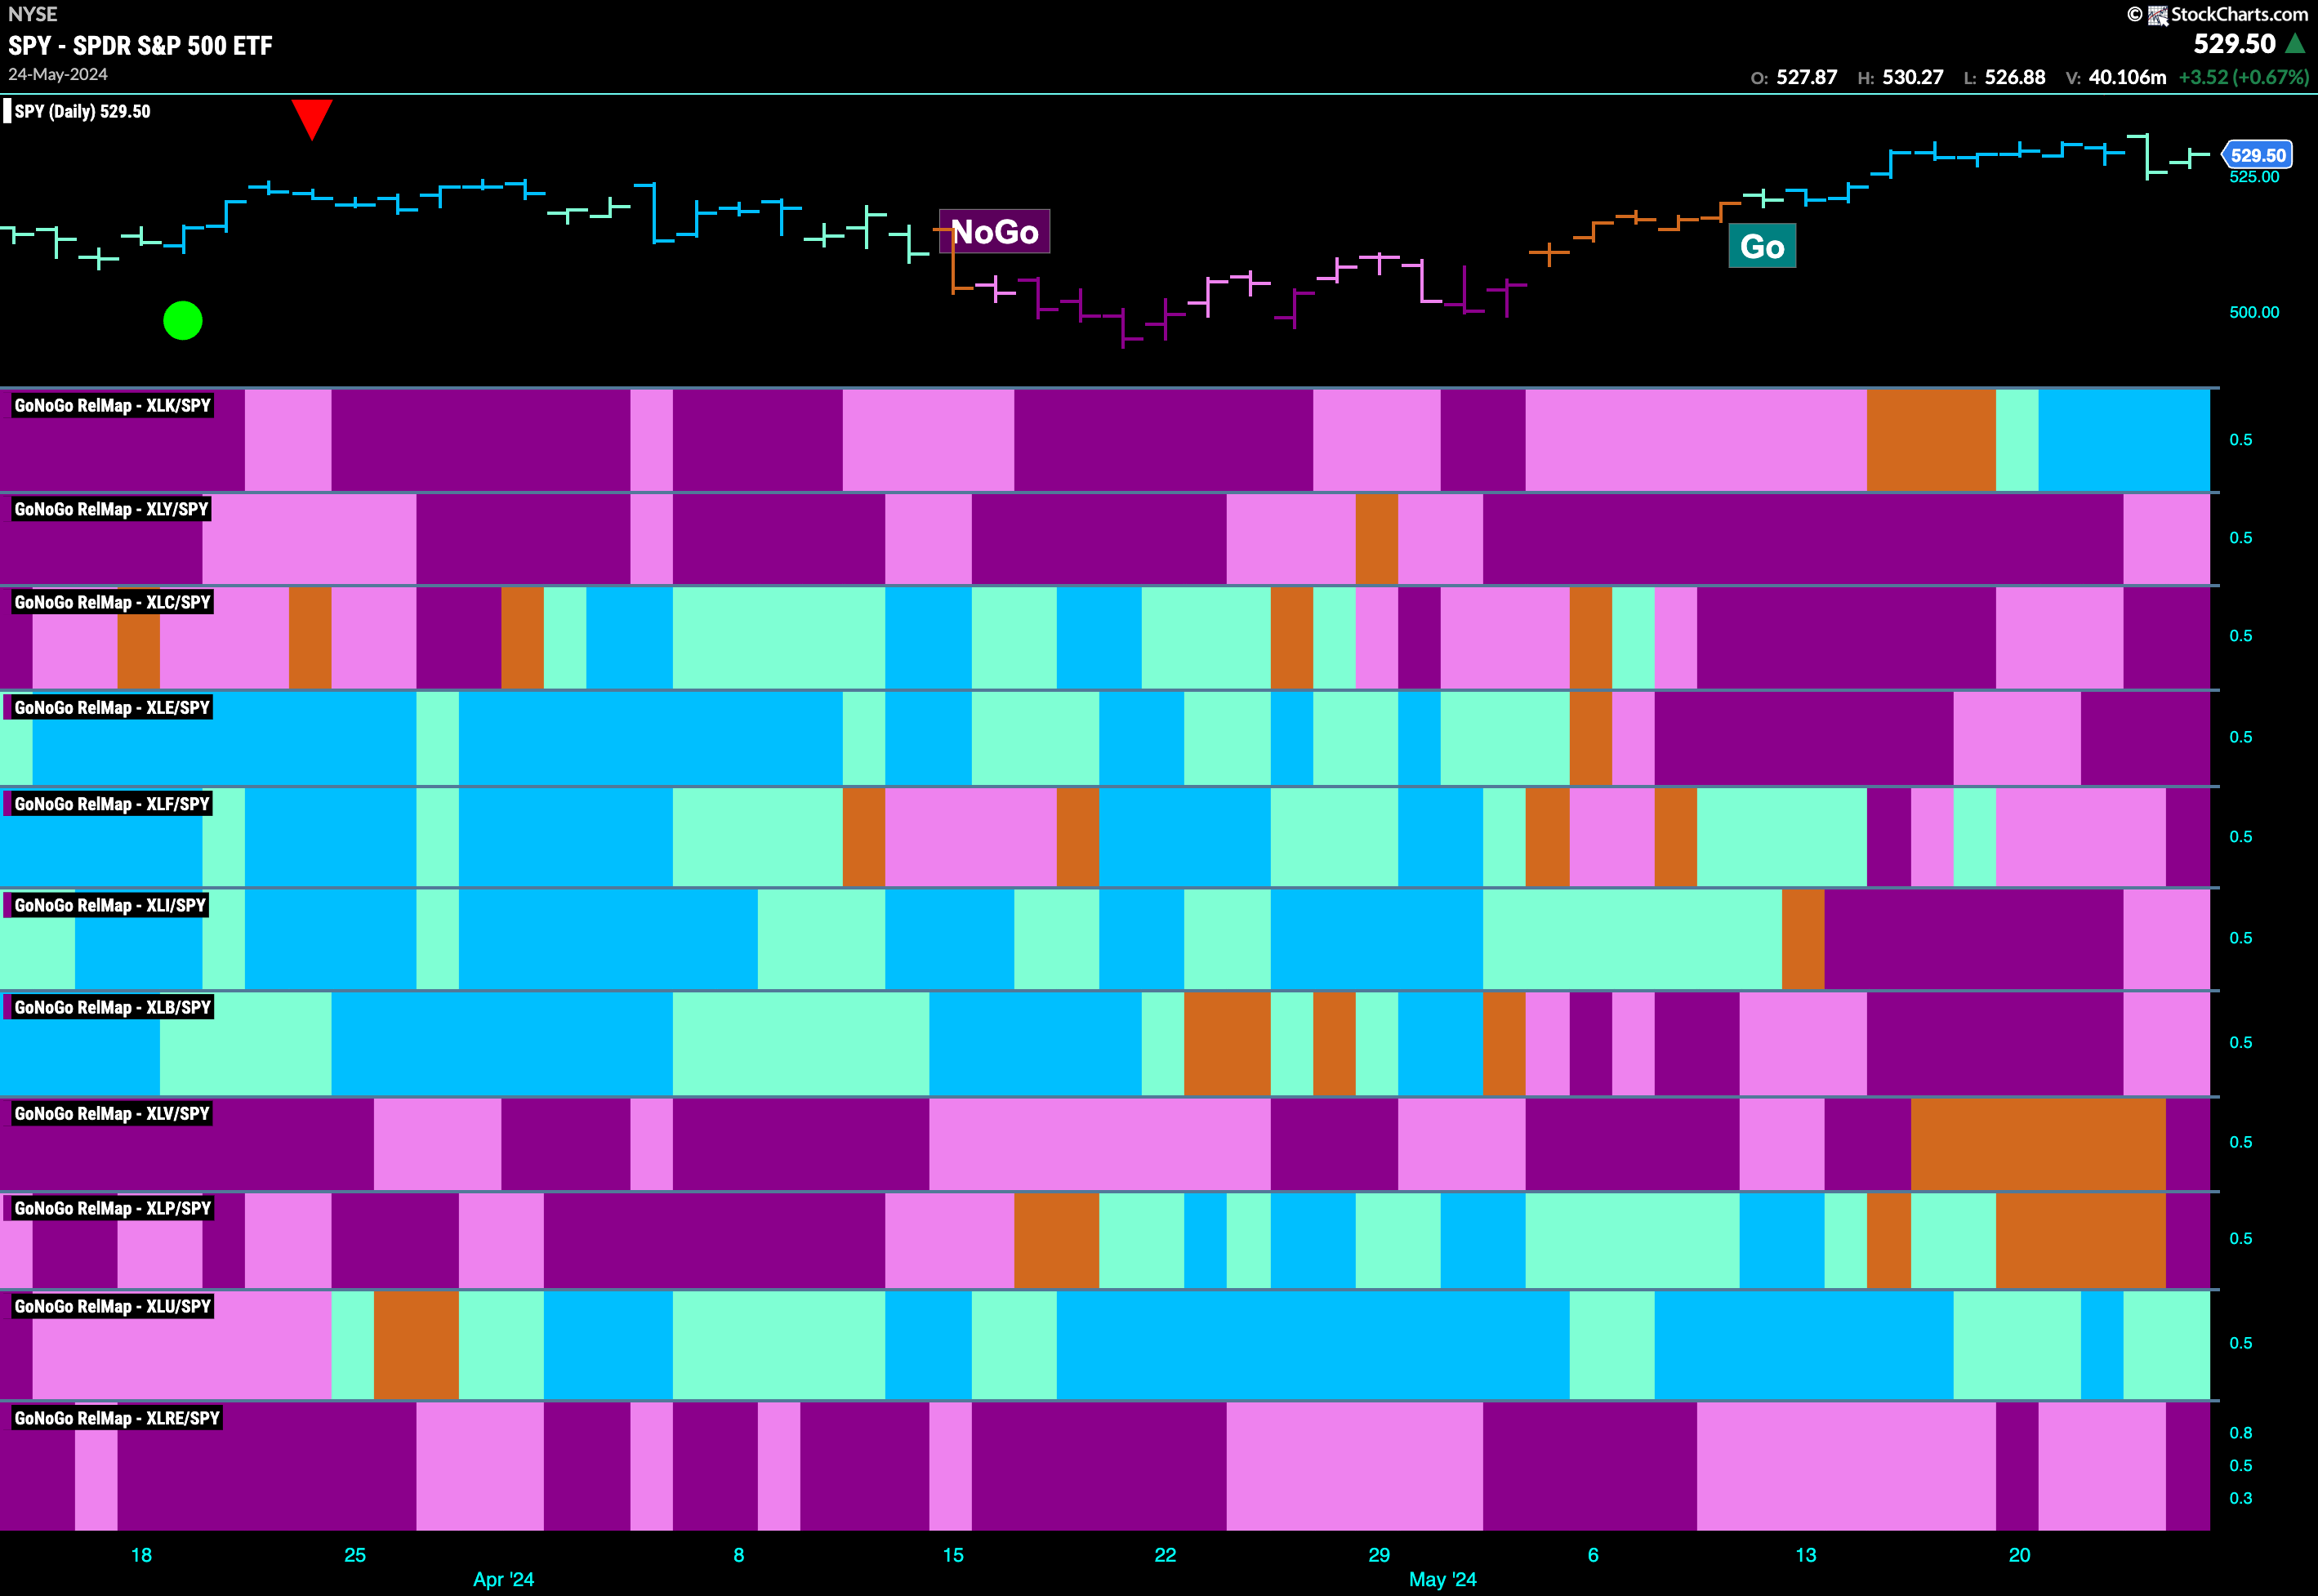
Below is the GoNoGo Sector RelMap. This GoNoGo RelMap applies the GoNoGo Trend to the relative strength ratios of the sectors to the base index. As the technology sector sees the relative “Go” trend strengthen, only 2 sectors are outperforming the base index this week. $XLK, and $XLU are painting relative “Go” bars.
Technology Sub-Group RelMap
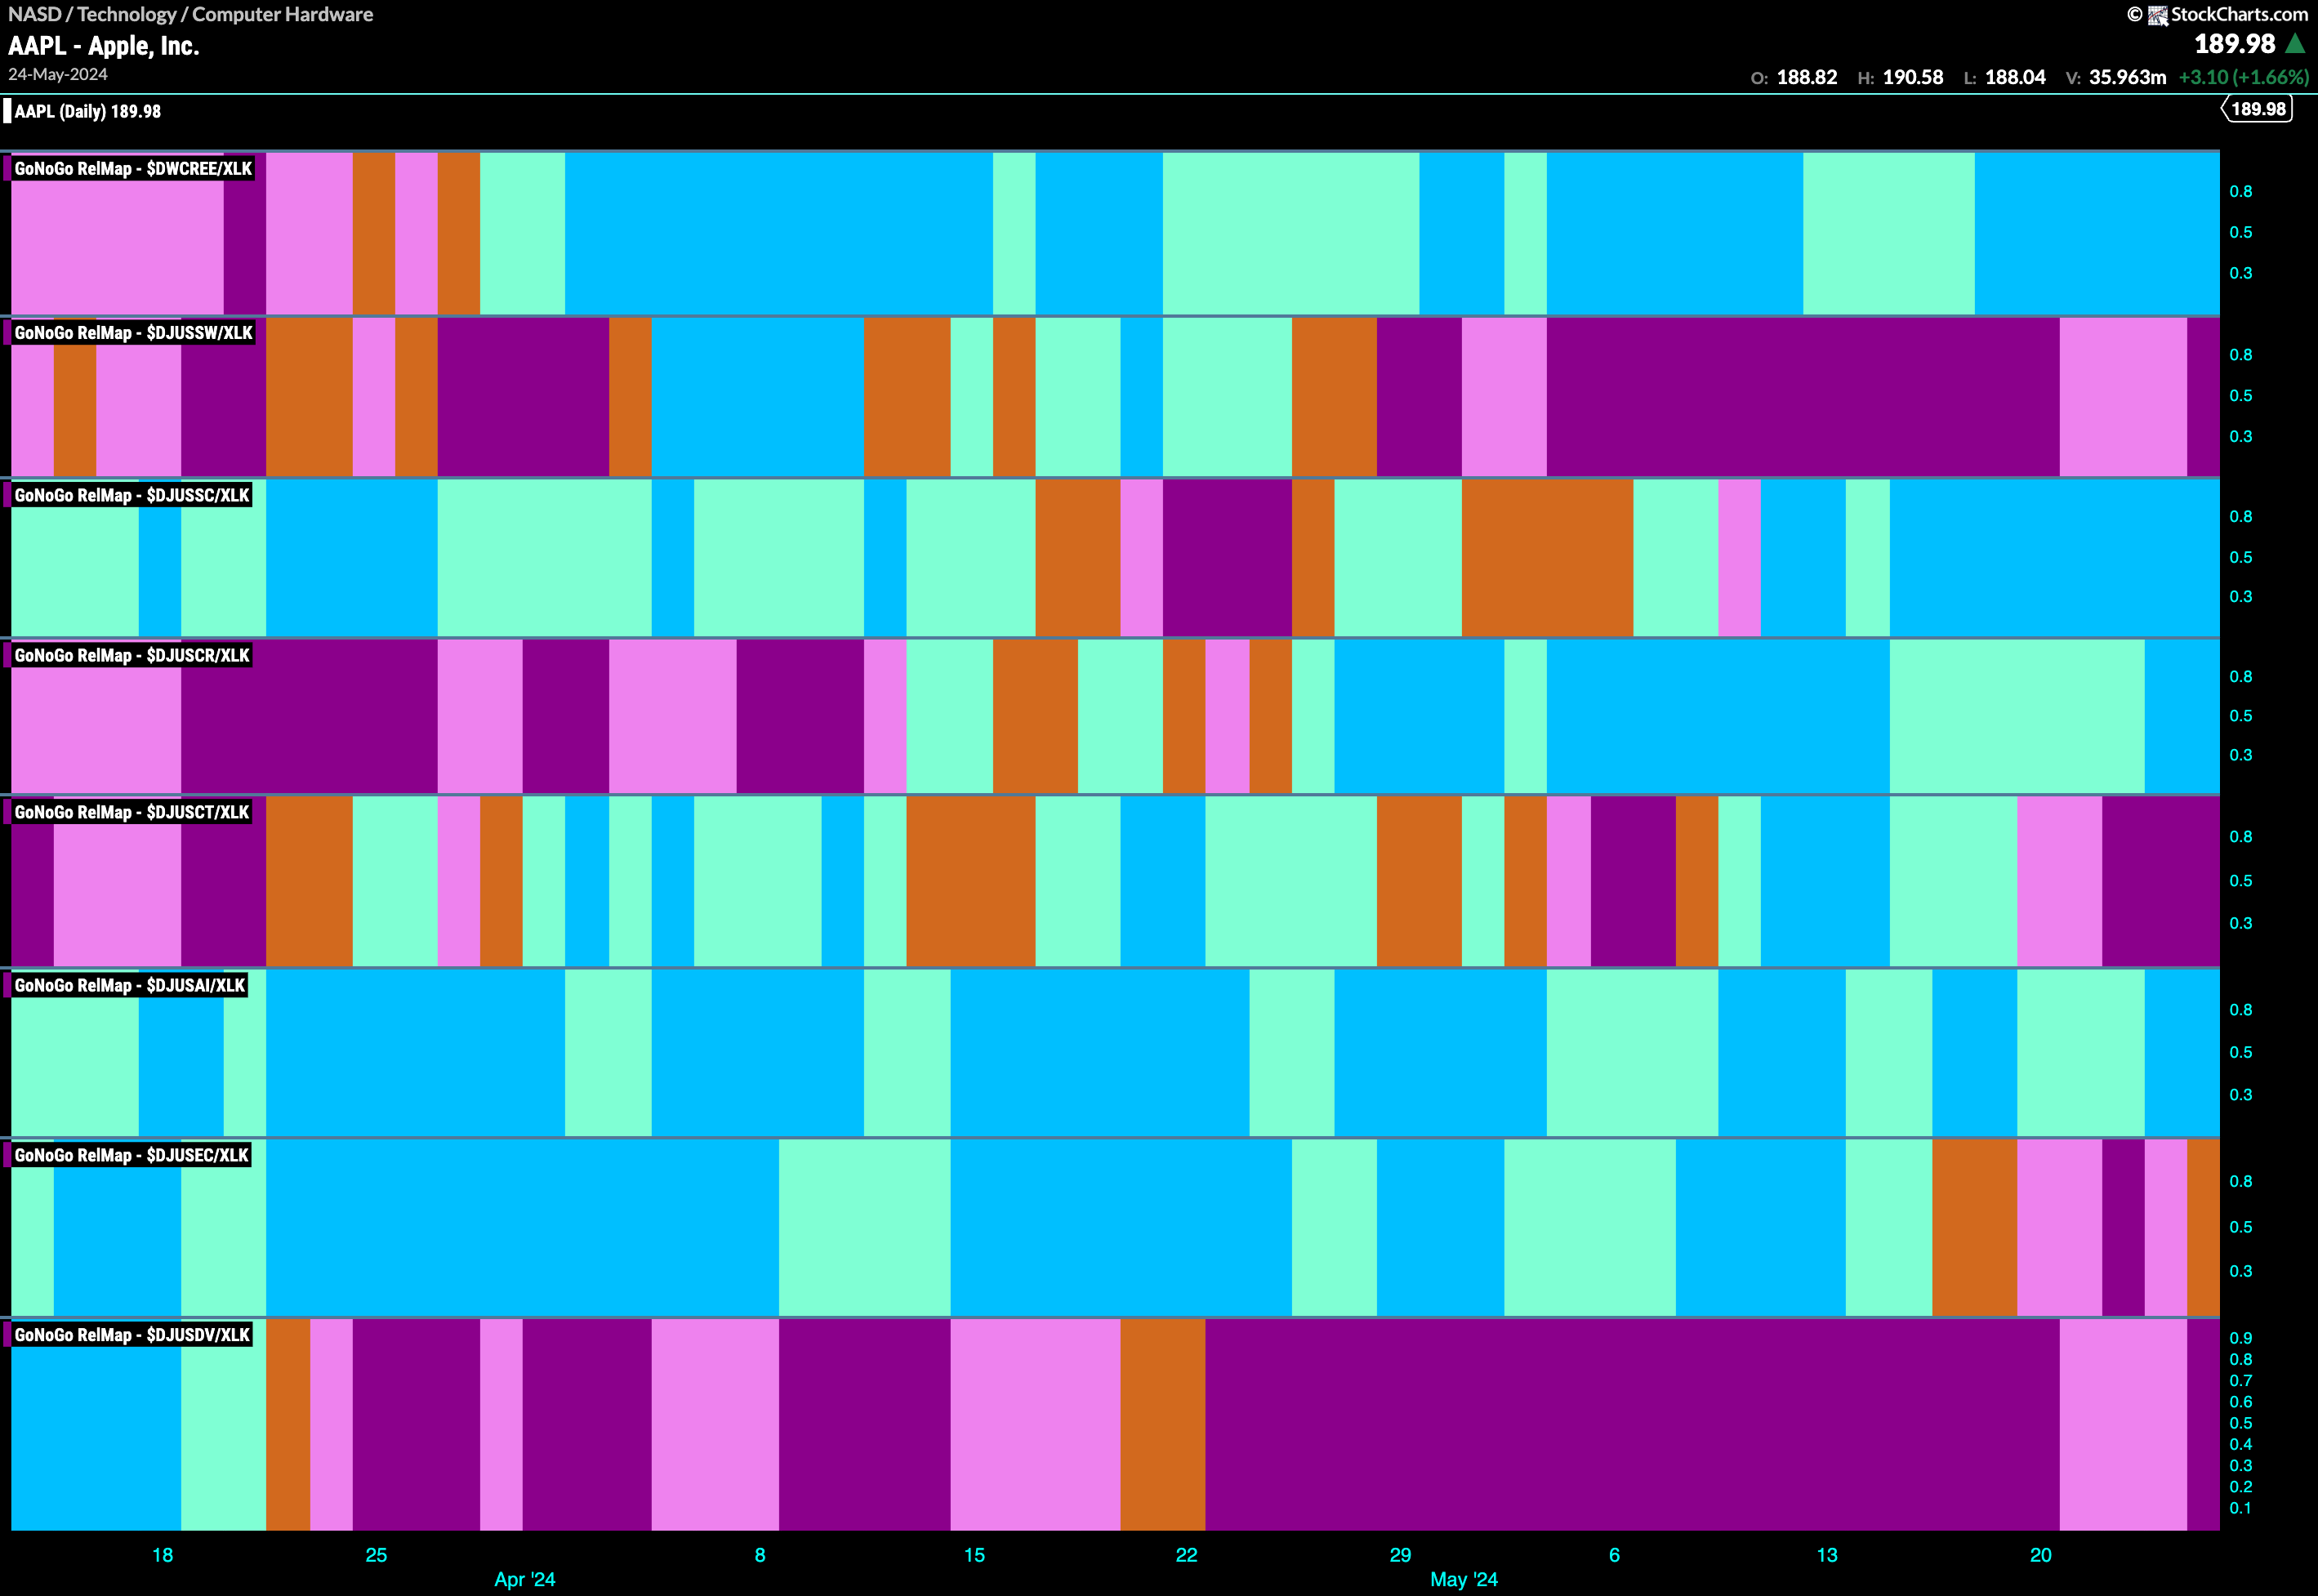
We are looking at technology again this week as it is the only sector showing strong relative “Go” bars to the larger index. The RelMap below shows the sub groups of the technology sector and the relative trend of each to the technology sector itself. We can see that along with renewable energy, semi conductors and electronic equipment, computer hardware has strengthened and is painting strong blue “Go” bars in the fourth panel.
$WDC Looks to Set Higher High
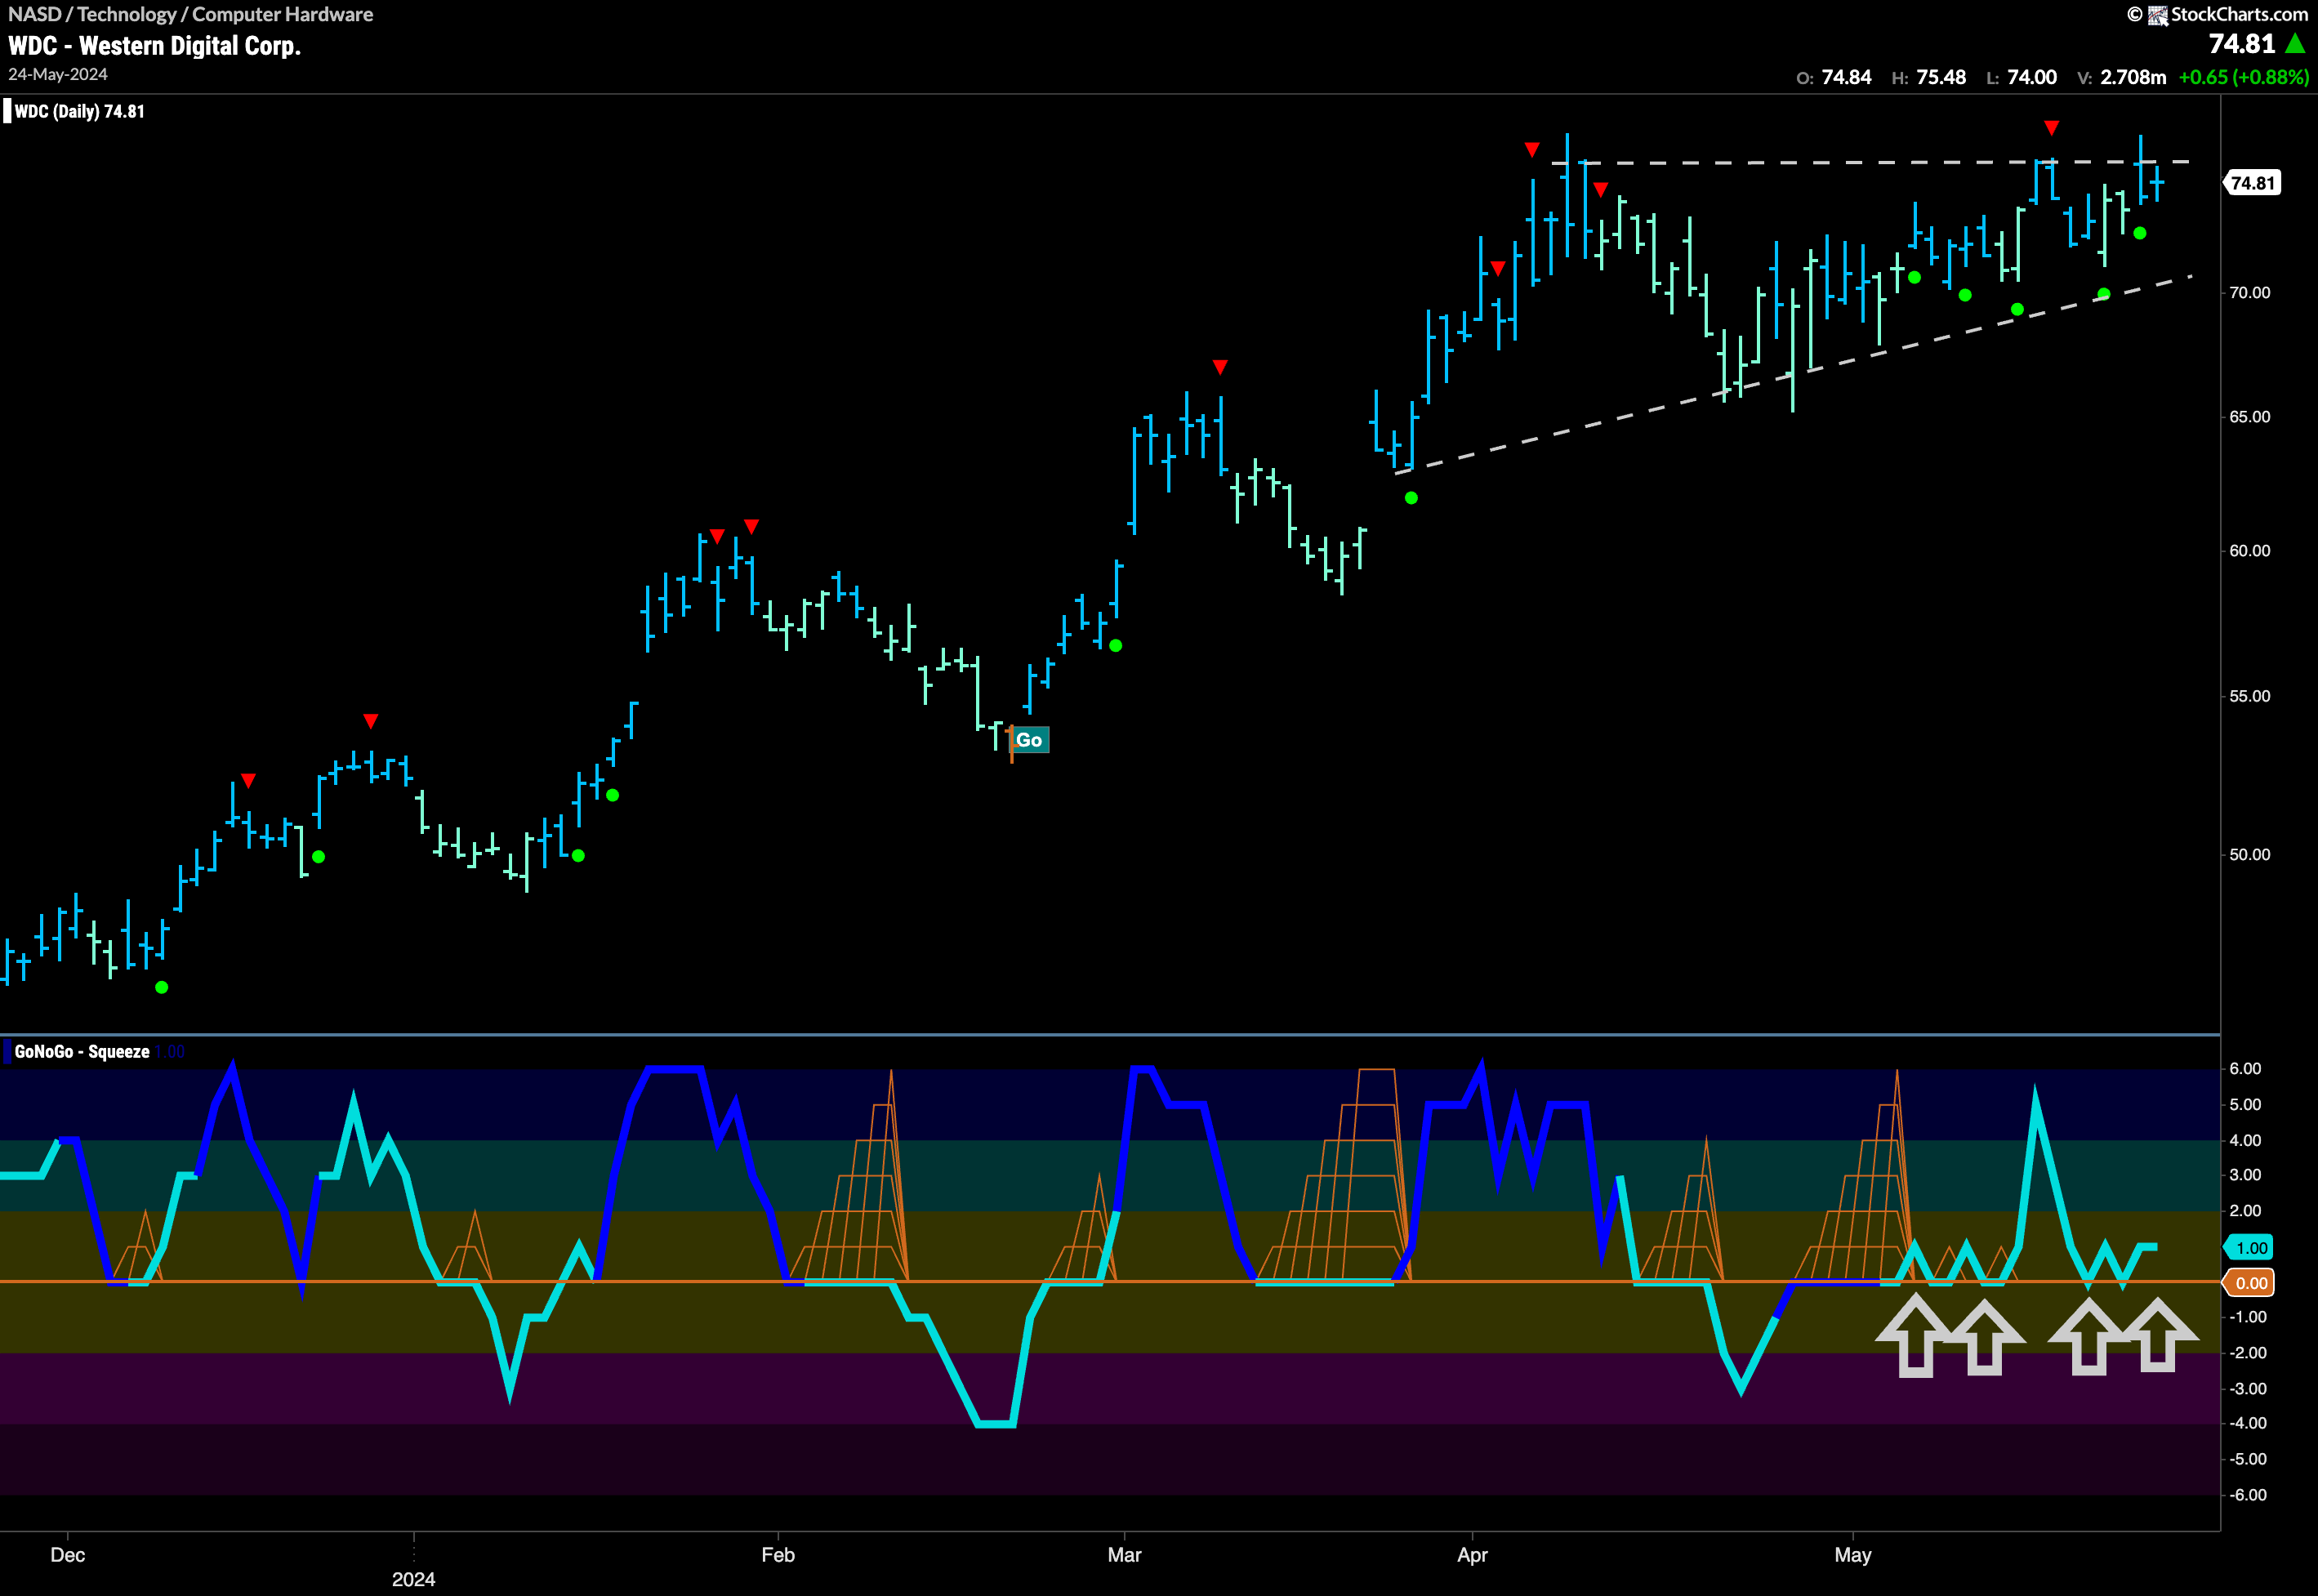
Western Digital Corp has been in a persistent “Go” trend that has seen a series of higher highs and higher lows. We see that more recently, price has not been able to surpass the highs from April. However, since then, buyers have been acting aggressively as we see a series of higher lows that help us define the ascending triangle that we see on the chart. Toward the right side of the pattern, we see a clustering of Go Trend Continuation Icons (green circles) as GoNoGo Oscillator continues to find support at the zero level. With the latest of these coming as price once again attacks prior high resistance, we will watch to see if this resurgent momentum in the direction of the underlying “Go” trend can give price the push it needs to break higher.
$AAPL Sets Up for Fight With Prior High Resistance
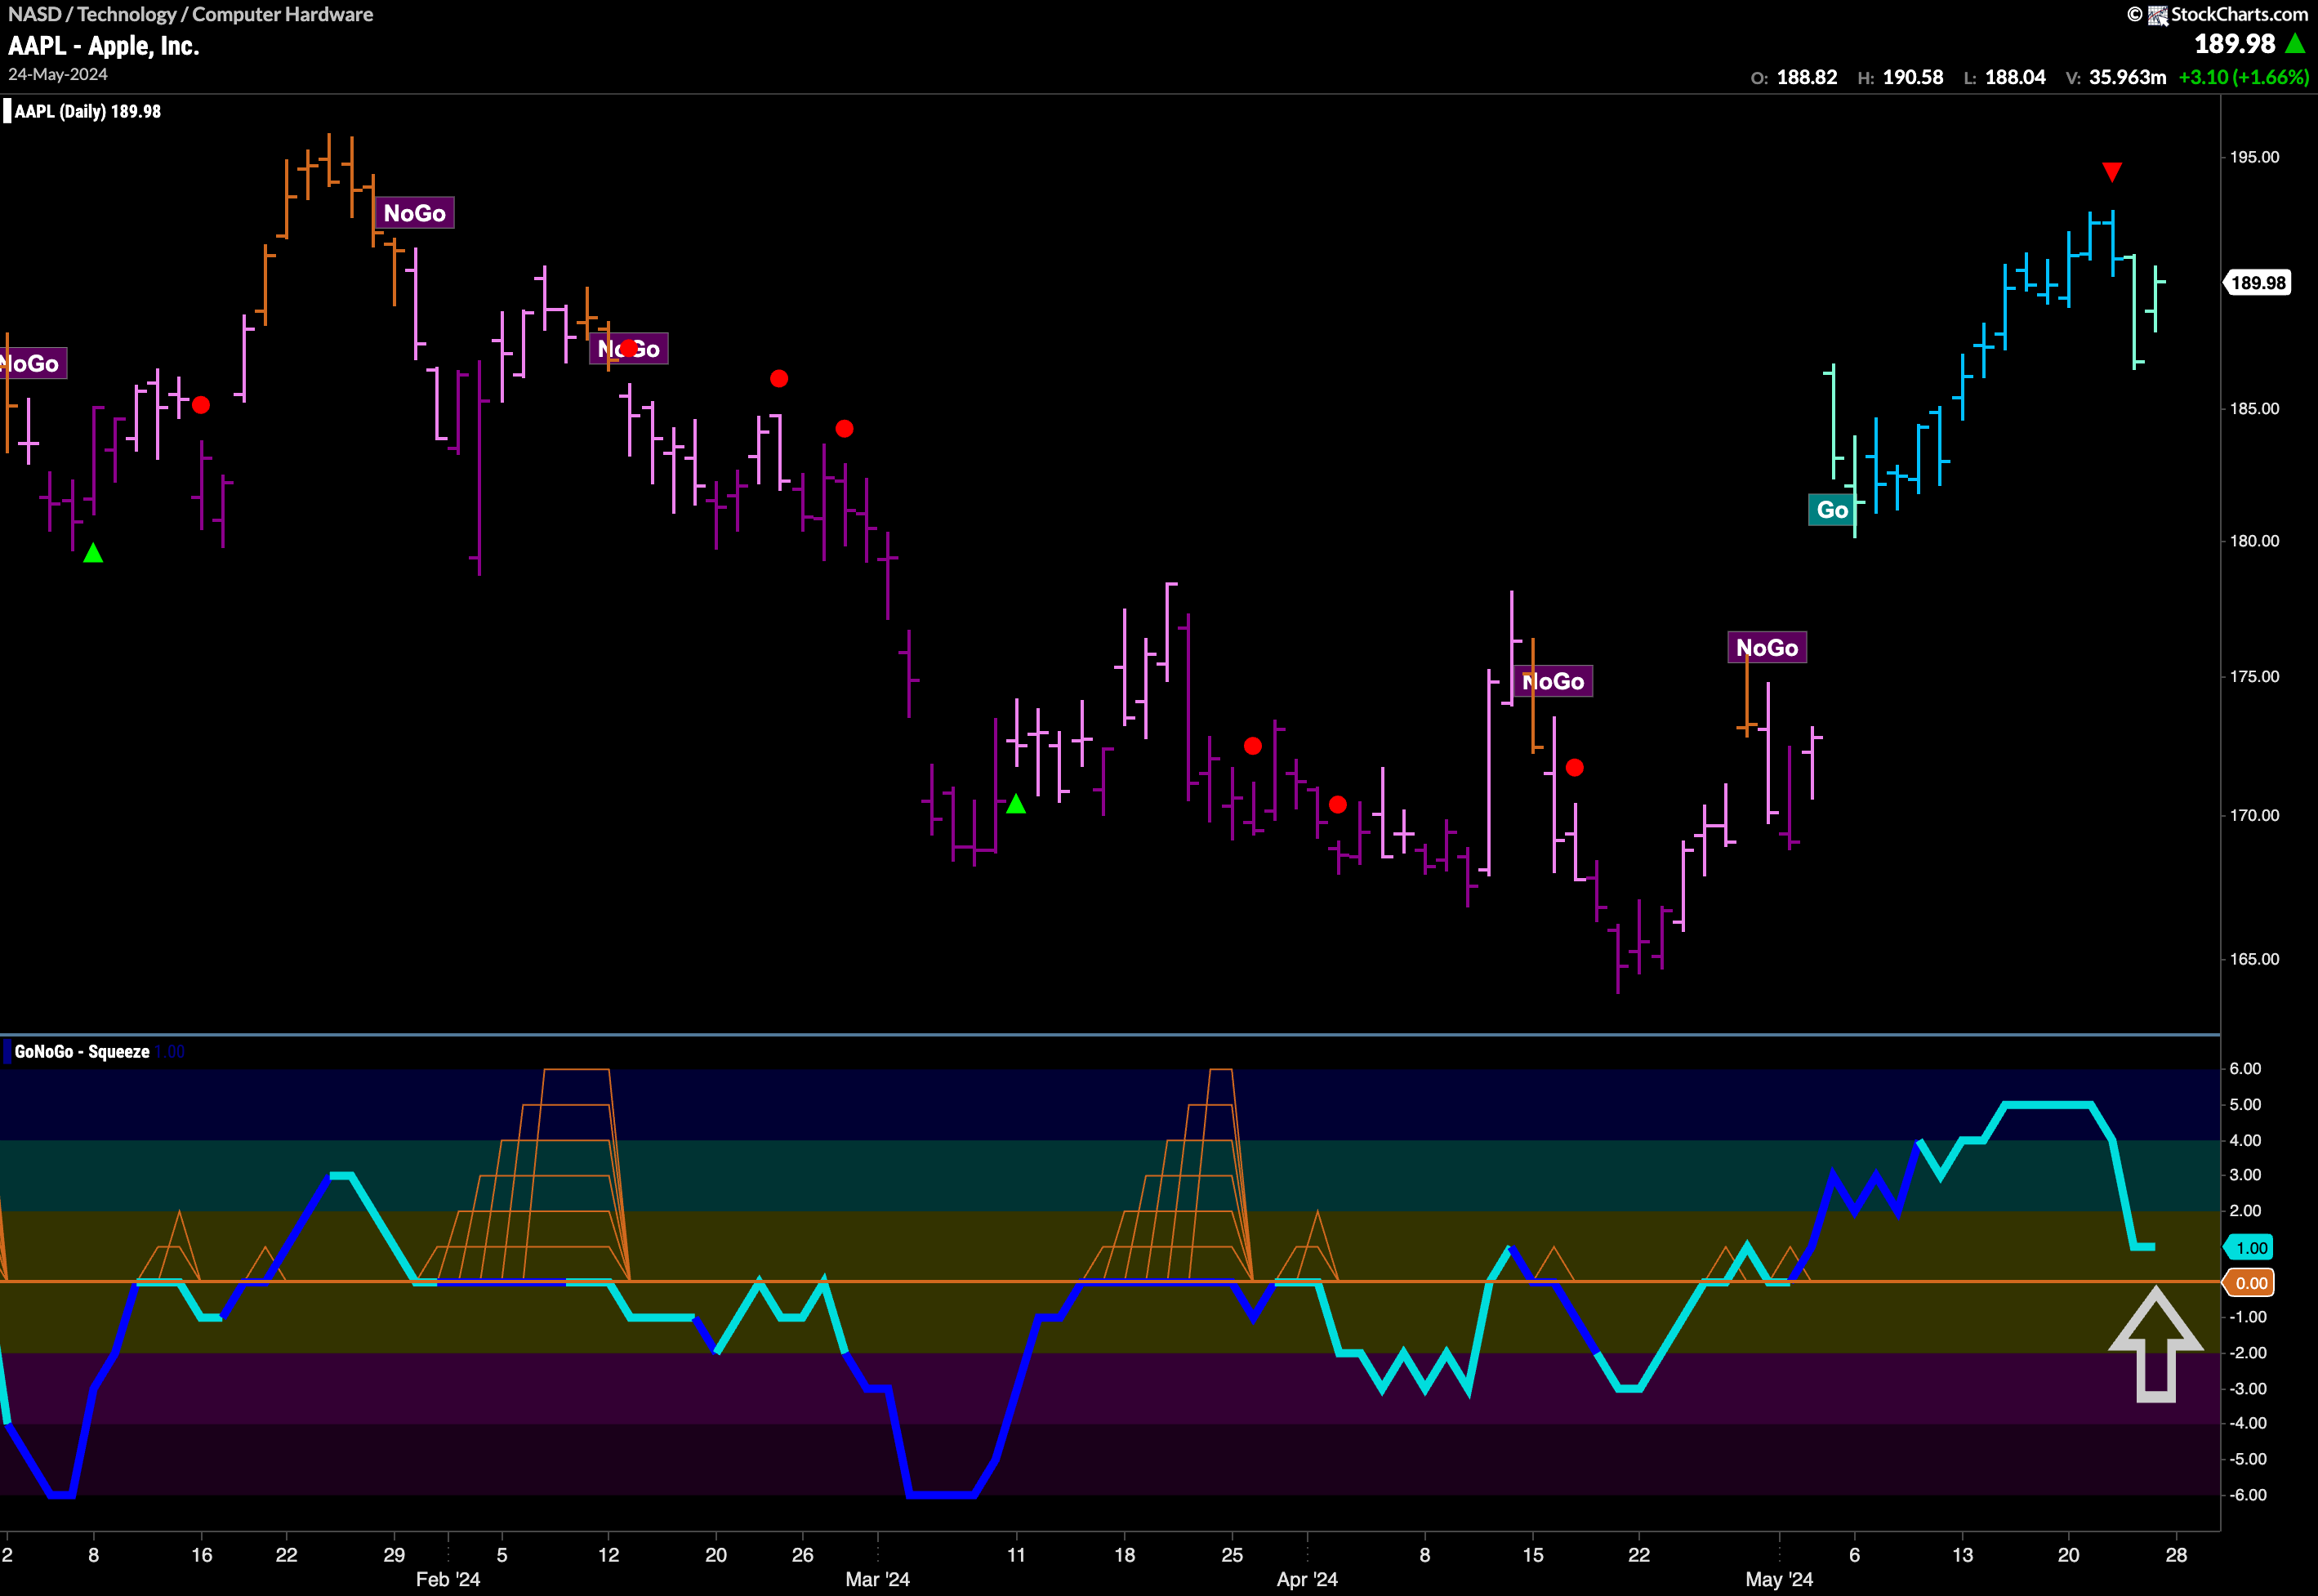
A giant of the computer hardware industry, $AAPL is featured in the GoNoGo Chart below. We can see that after gapping out of the “NoGo” trend price has climbed nicely but has faltered as it approaches levels not seen since early this year. We can see that after a Go Countertrend Correction Icon (red arrow), GoNoGo Trend has painted a couple of weaker aqua bars. GoNoGo Oscillator is falling toward the zero line where we will watch to see if it finds support. If it does, remaining at or above the zero level, we may see opportunities for capitalizing on trend continuation, and will look for price to mount an attack on February’s high.
