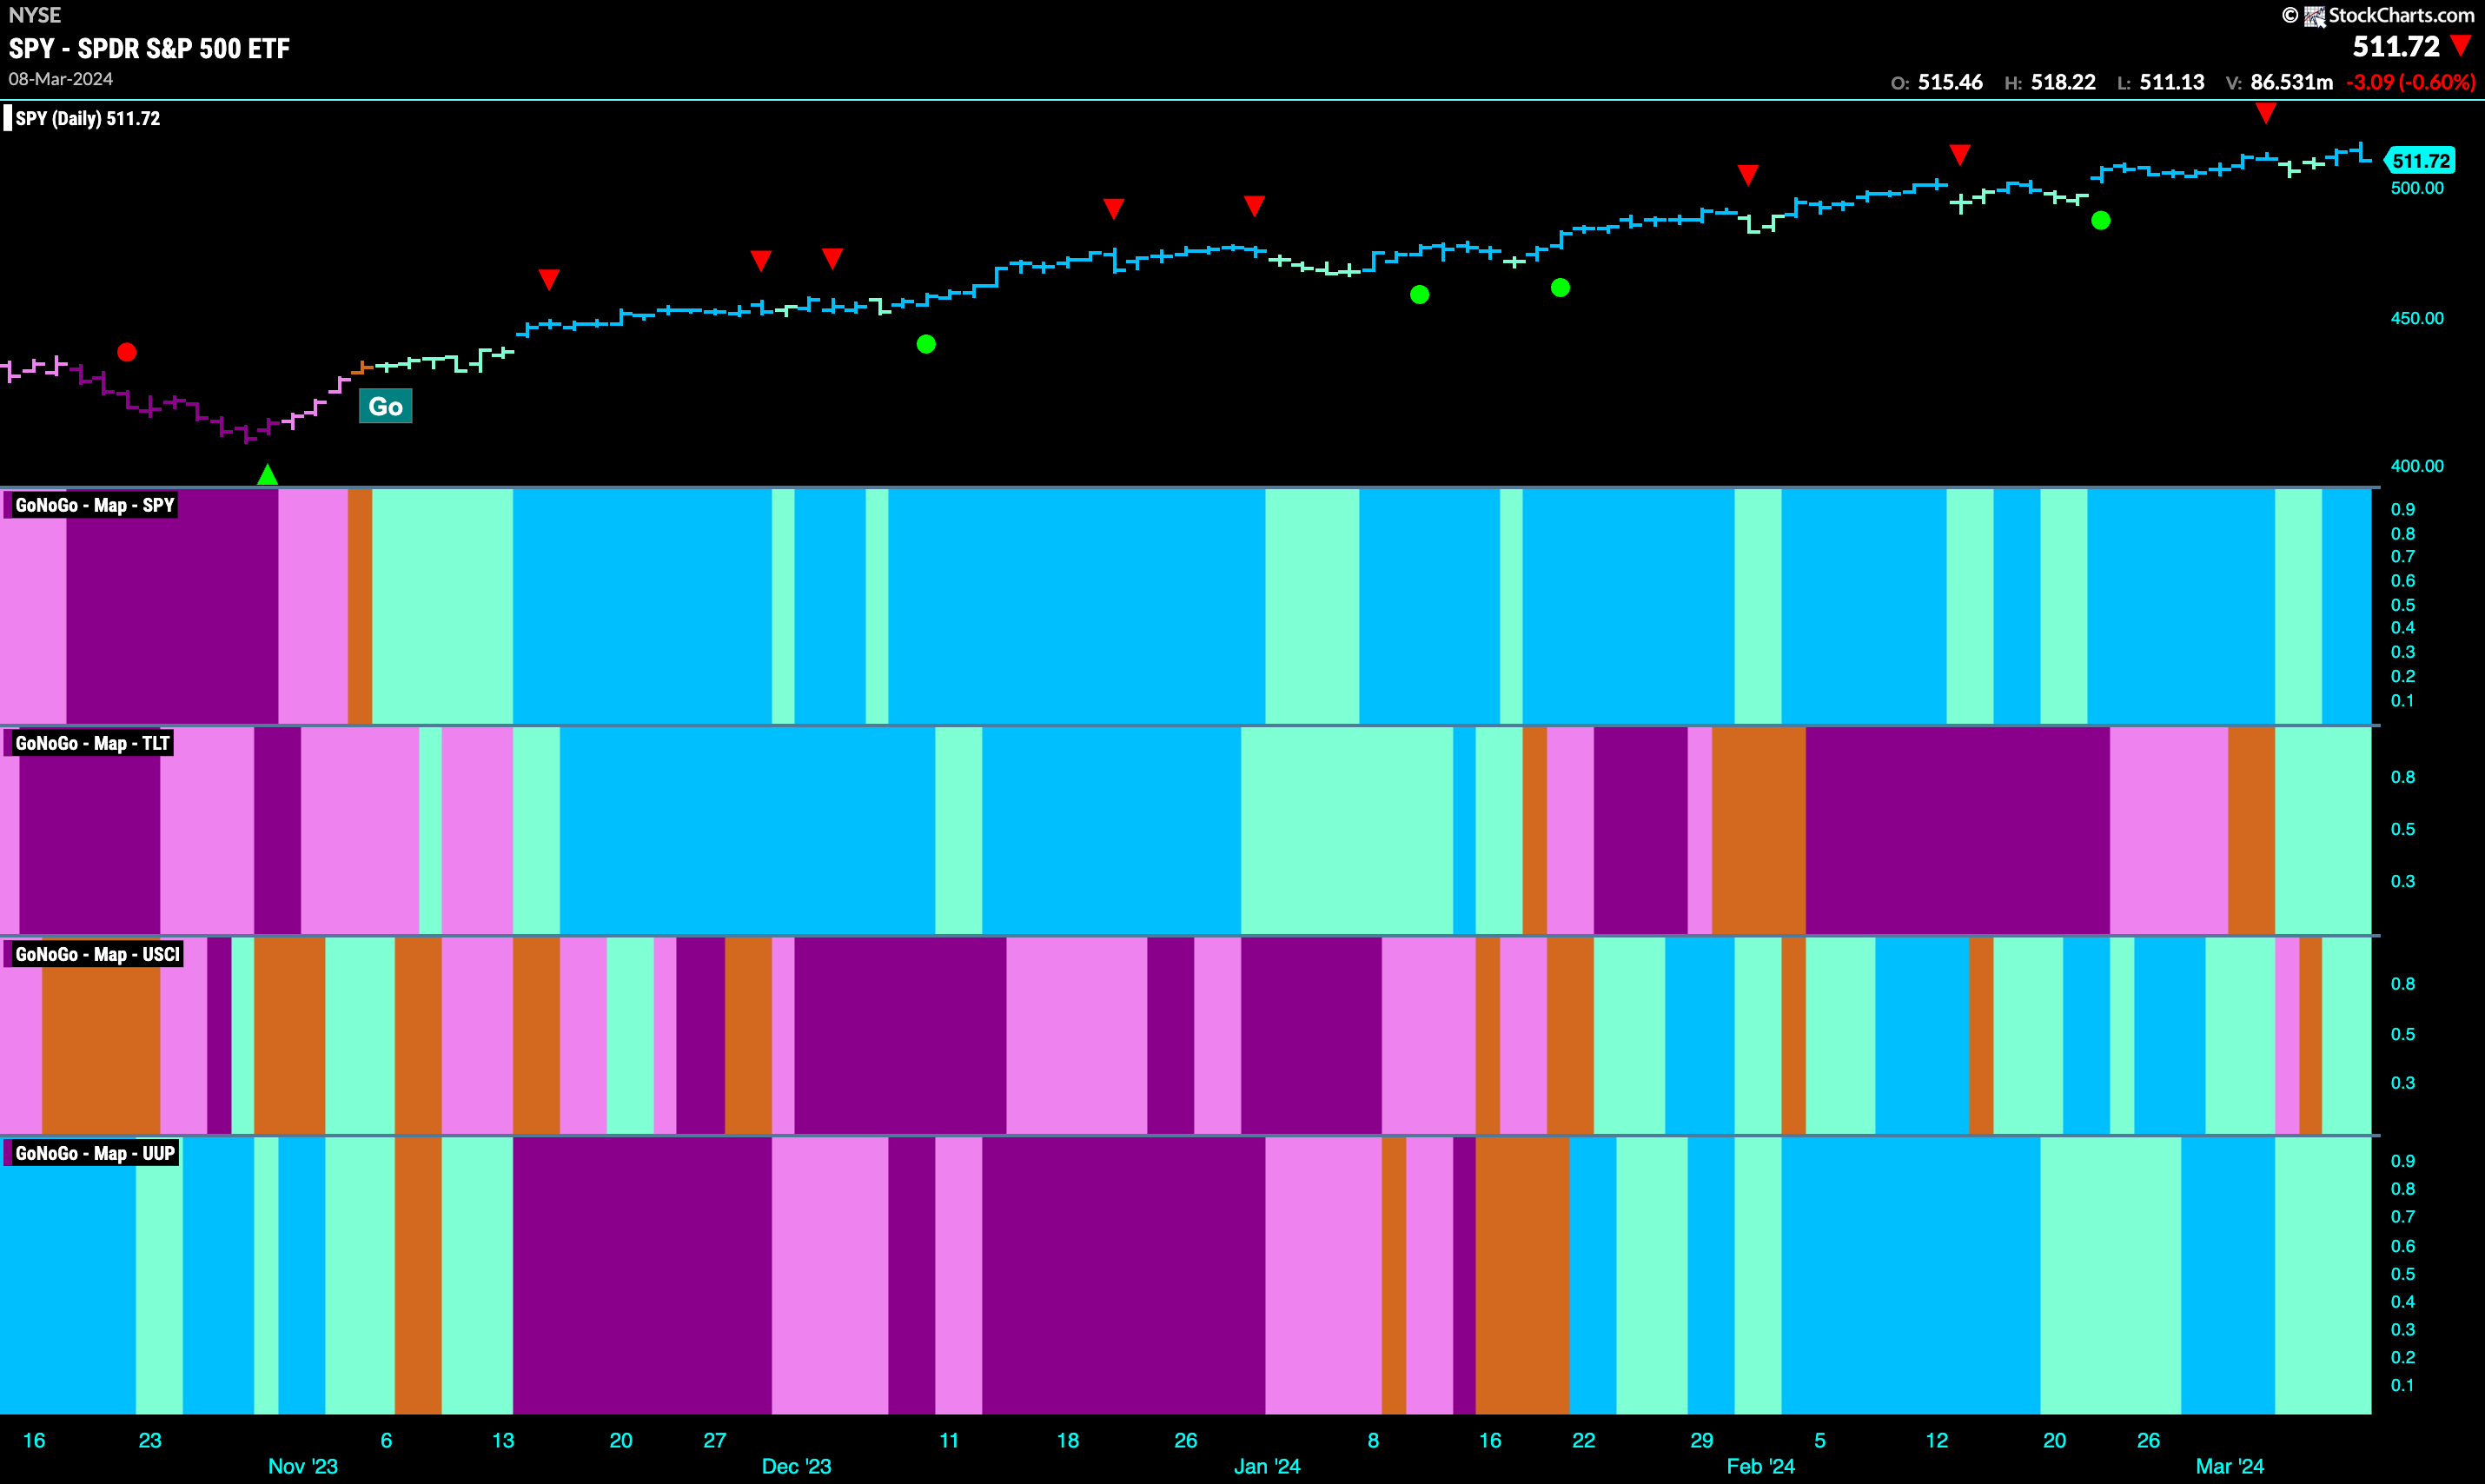
Good morning and welcome to this week’s Flight Path. Equities maintained their strength after a few bars of weakness earlier in the week. Price pushed to another new high before falling back on the last bar of the week. Treasury bond prices entered a “Go” trend painting weak aqua bars. U.S. commodity index flirted with a “NoGo” trend but ultimately reverted back to painting weaker aqua “Go” bars. The dollar showed weakness again this week as GoNoGo Trend painted more aqua “Go” bars.
U.S. Equities Remain Strong for Another Week
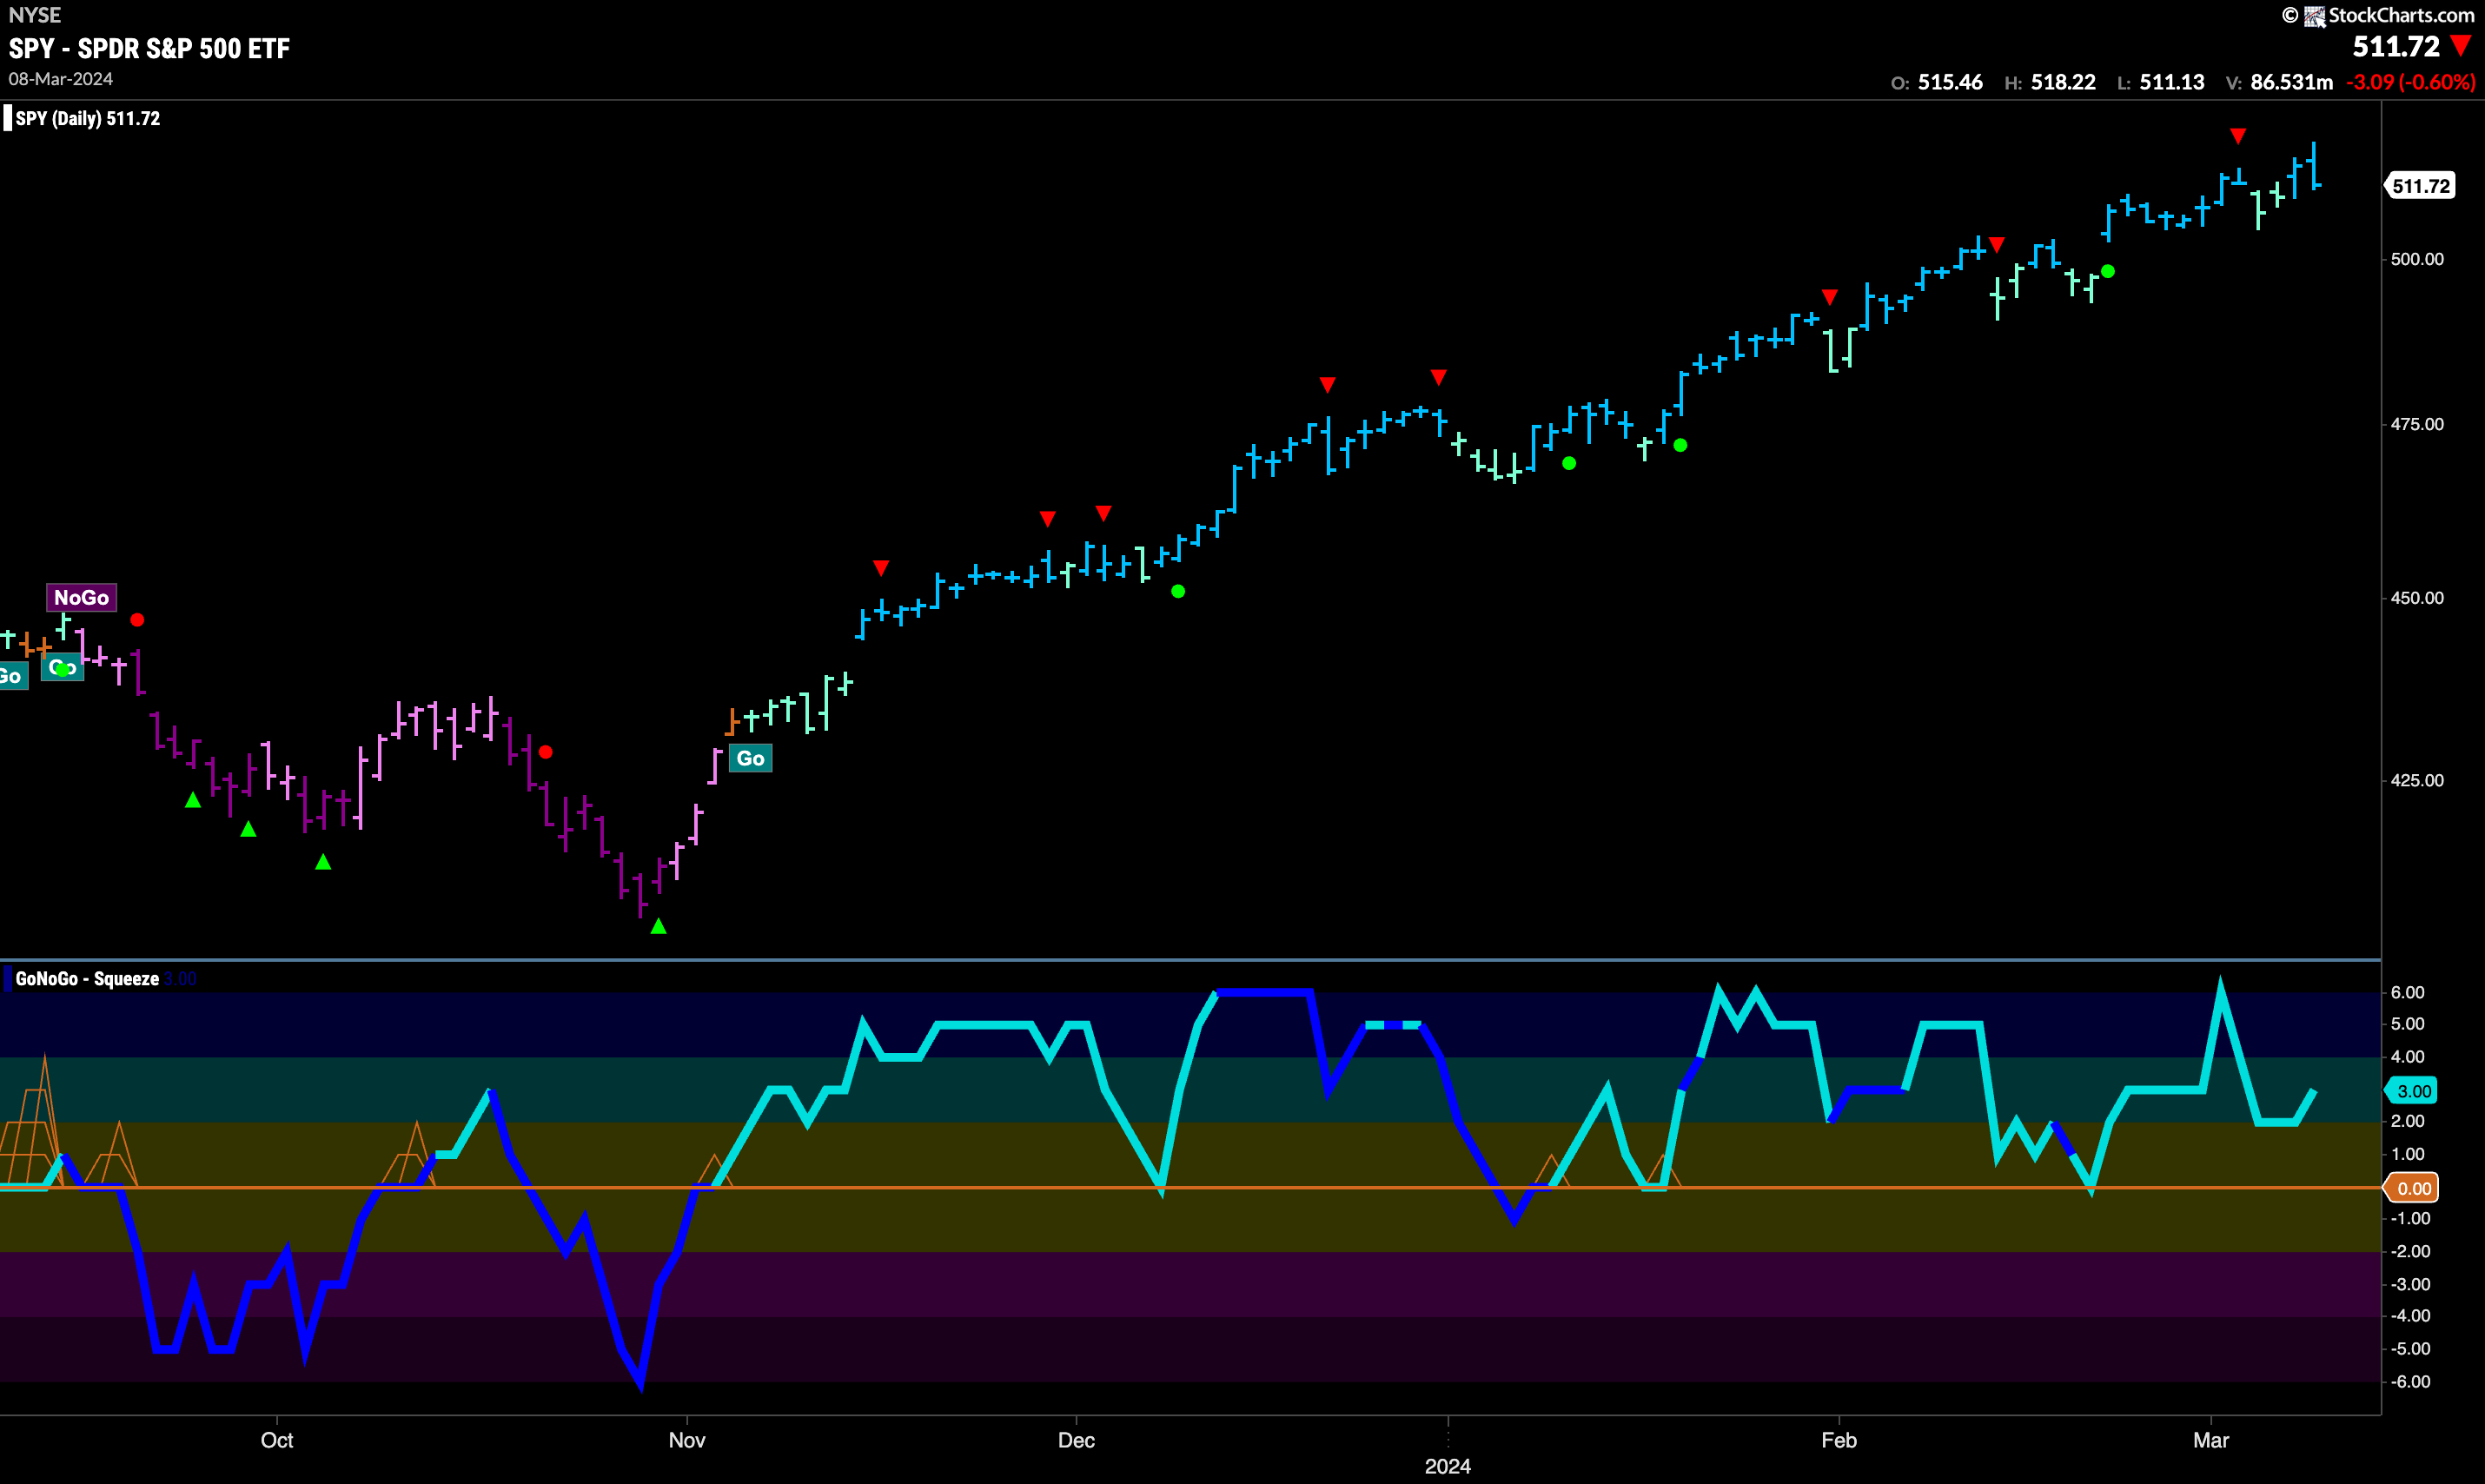
This “Go” trend continues for another week. We saw a few weaker aqua bars earlier in the week but then strong blue bars returned indicating that the trend was still strong. We closed lower on Friday as price fell from another intra week high. GoNoGo Oscillator fell from overbought levels but has been able to stay in positive territory without threatening the zero line yet. Momentum is at a value of 3.
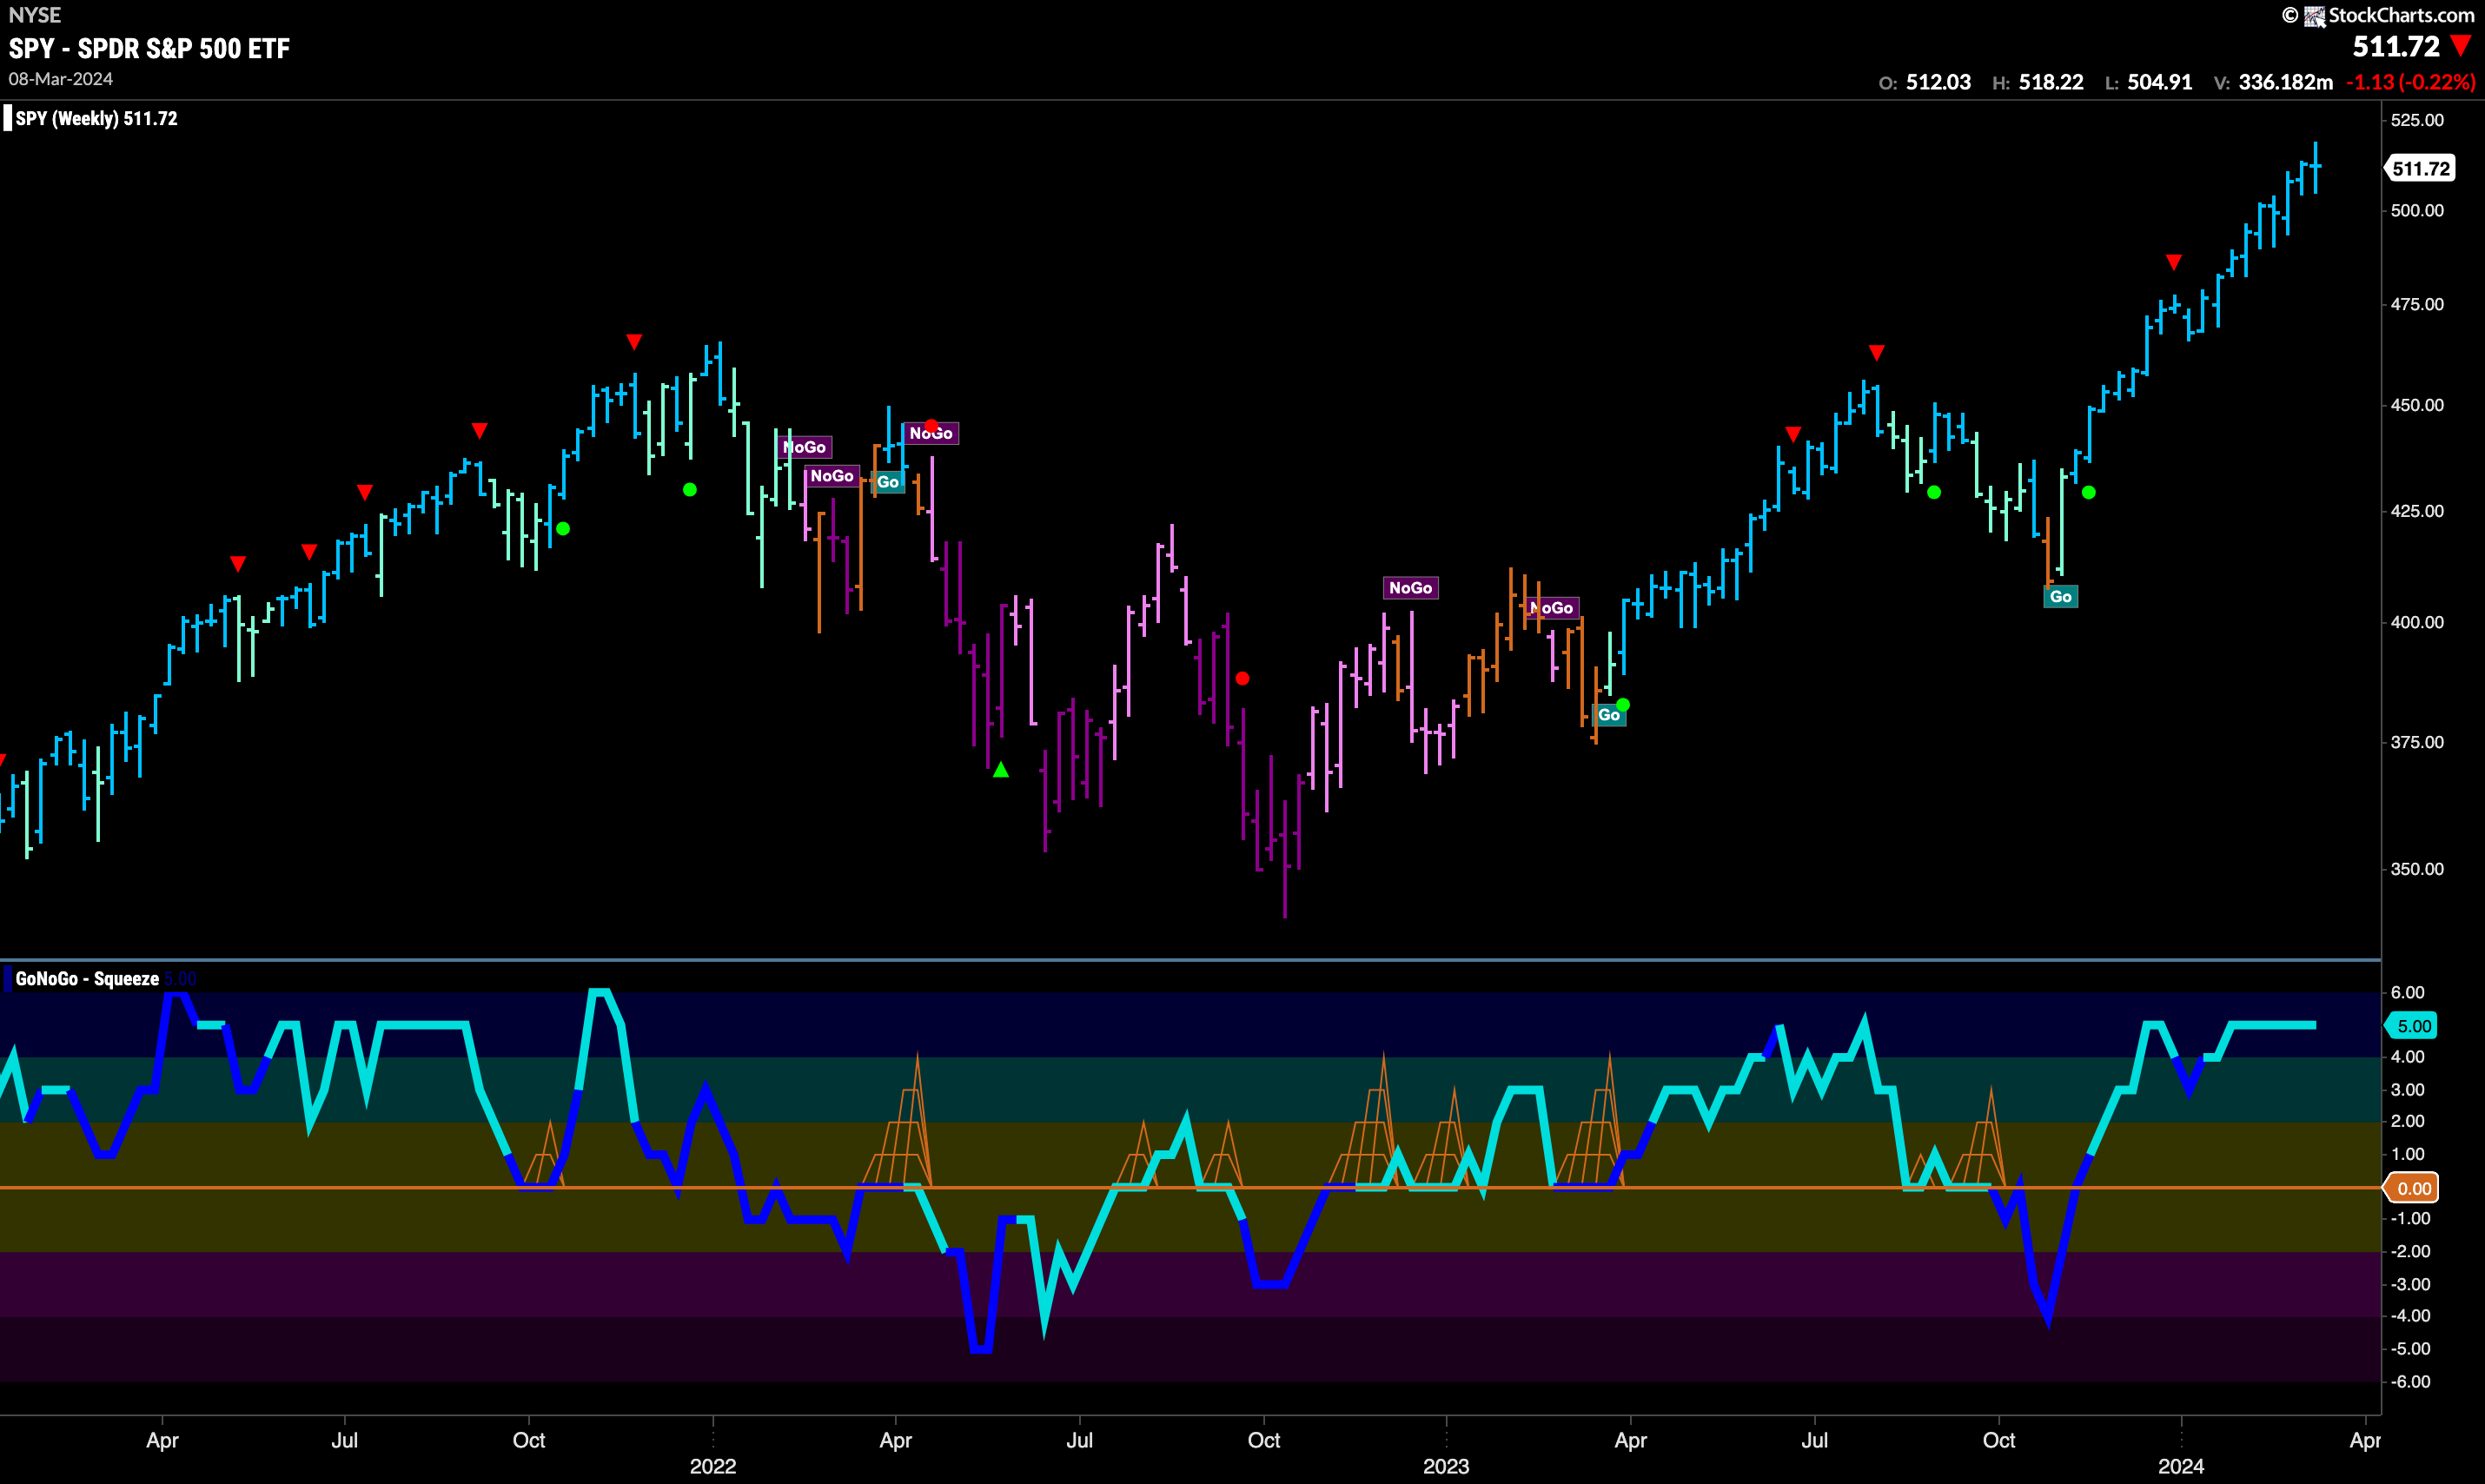
Not this week! On a weekly basis, price couldn’t quite close higher this week. In fact, we see what looks like a doji, with the open and close price for the week at very similar levels. We know this indicates uncertainty in the market as there was somewhat of a stalemate between the buyers and sellers. The weight of the evidence tells us that the trend is still strong though, with GoNoGo conditions such that the Trend indicator paints another strong blue “Go” bar. GoNoGo Oscillator remains overbought for another week at a value of 5.
Rates Take a Turn Lower
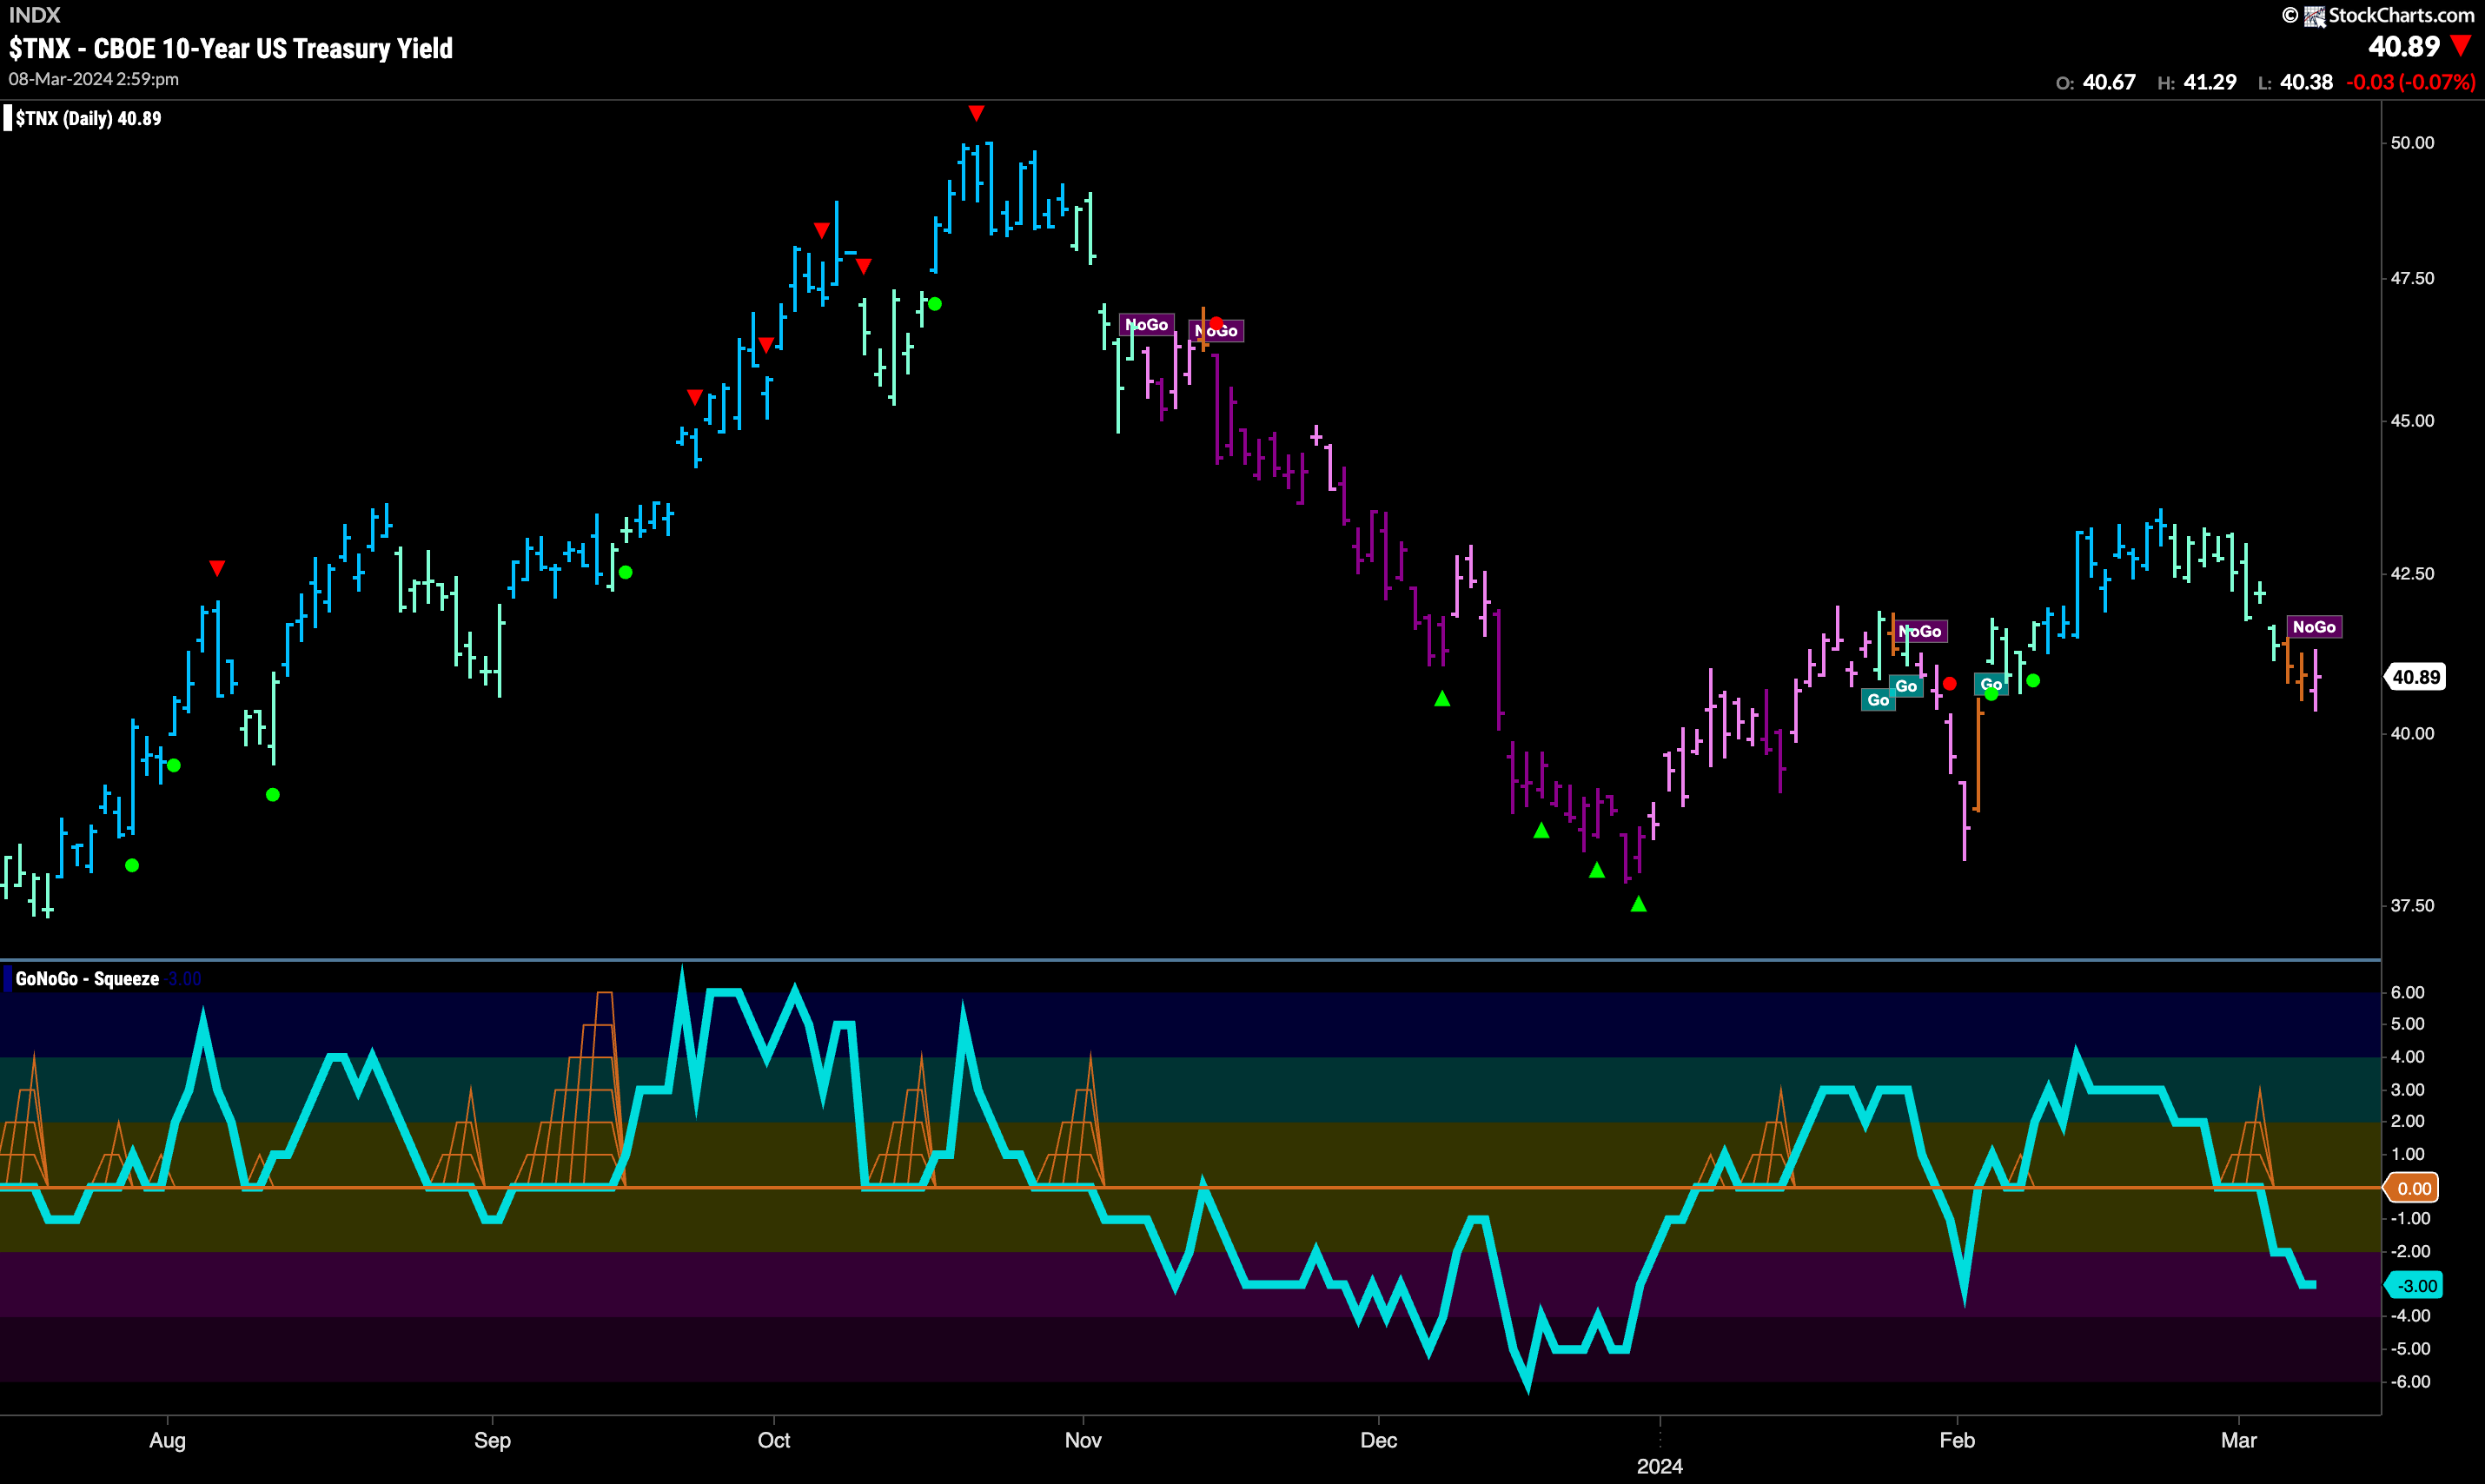
Treasury rates fell this week and the price action was enough for GoNoGo Trend to move through amber “Go Fish” bars and paint a first pink “NoGo” bar at the end of the week. This comes after GoNoGo Oscillator fell through the zero line unable to find support at that level. Now we can say that momentum is surging in the direction of the new “NoGo” trend and we will watch to see if rates will continue lower and challenge prior lows. Falling rates should help the equity market maintain its strength.
The Dollar in Trouble?
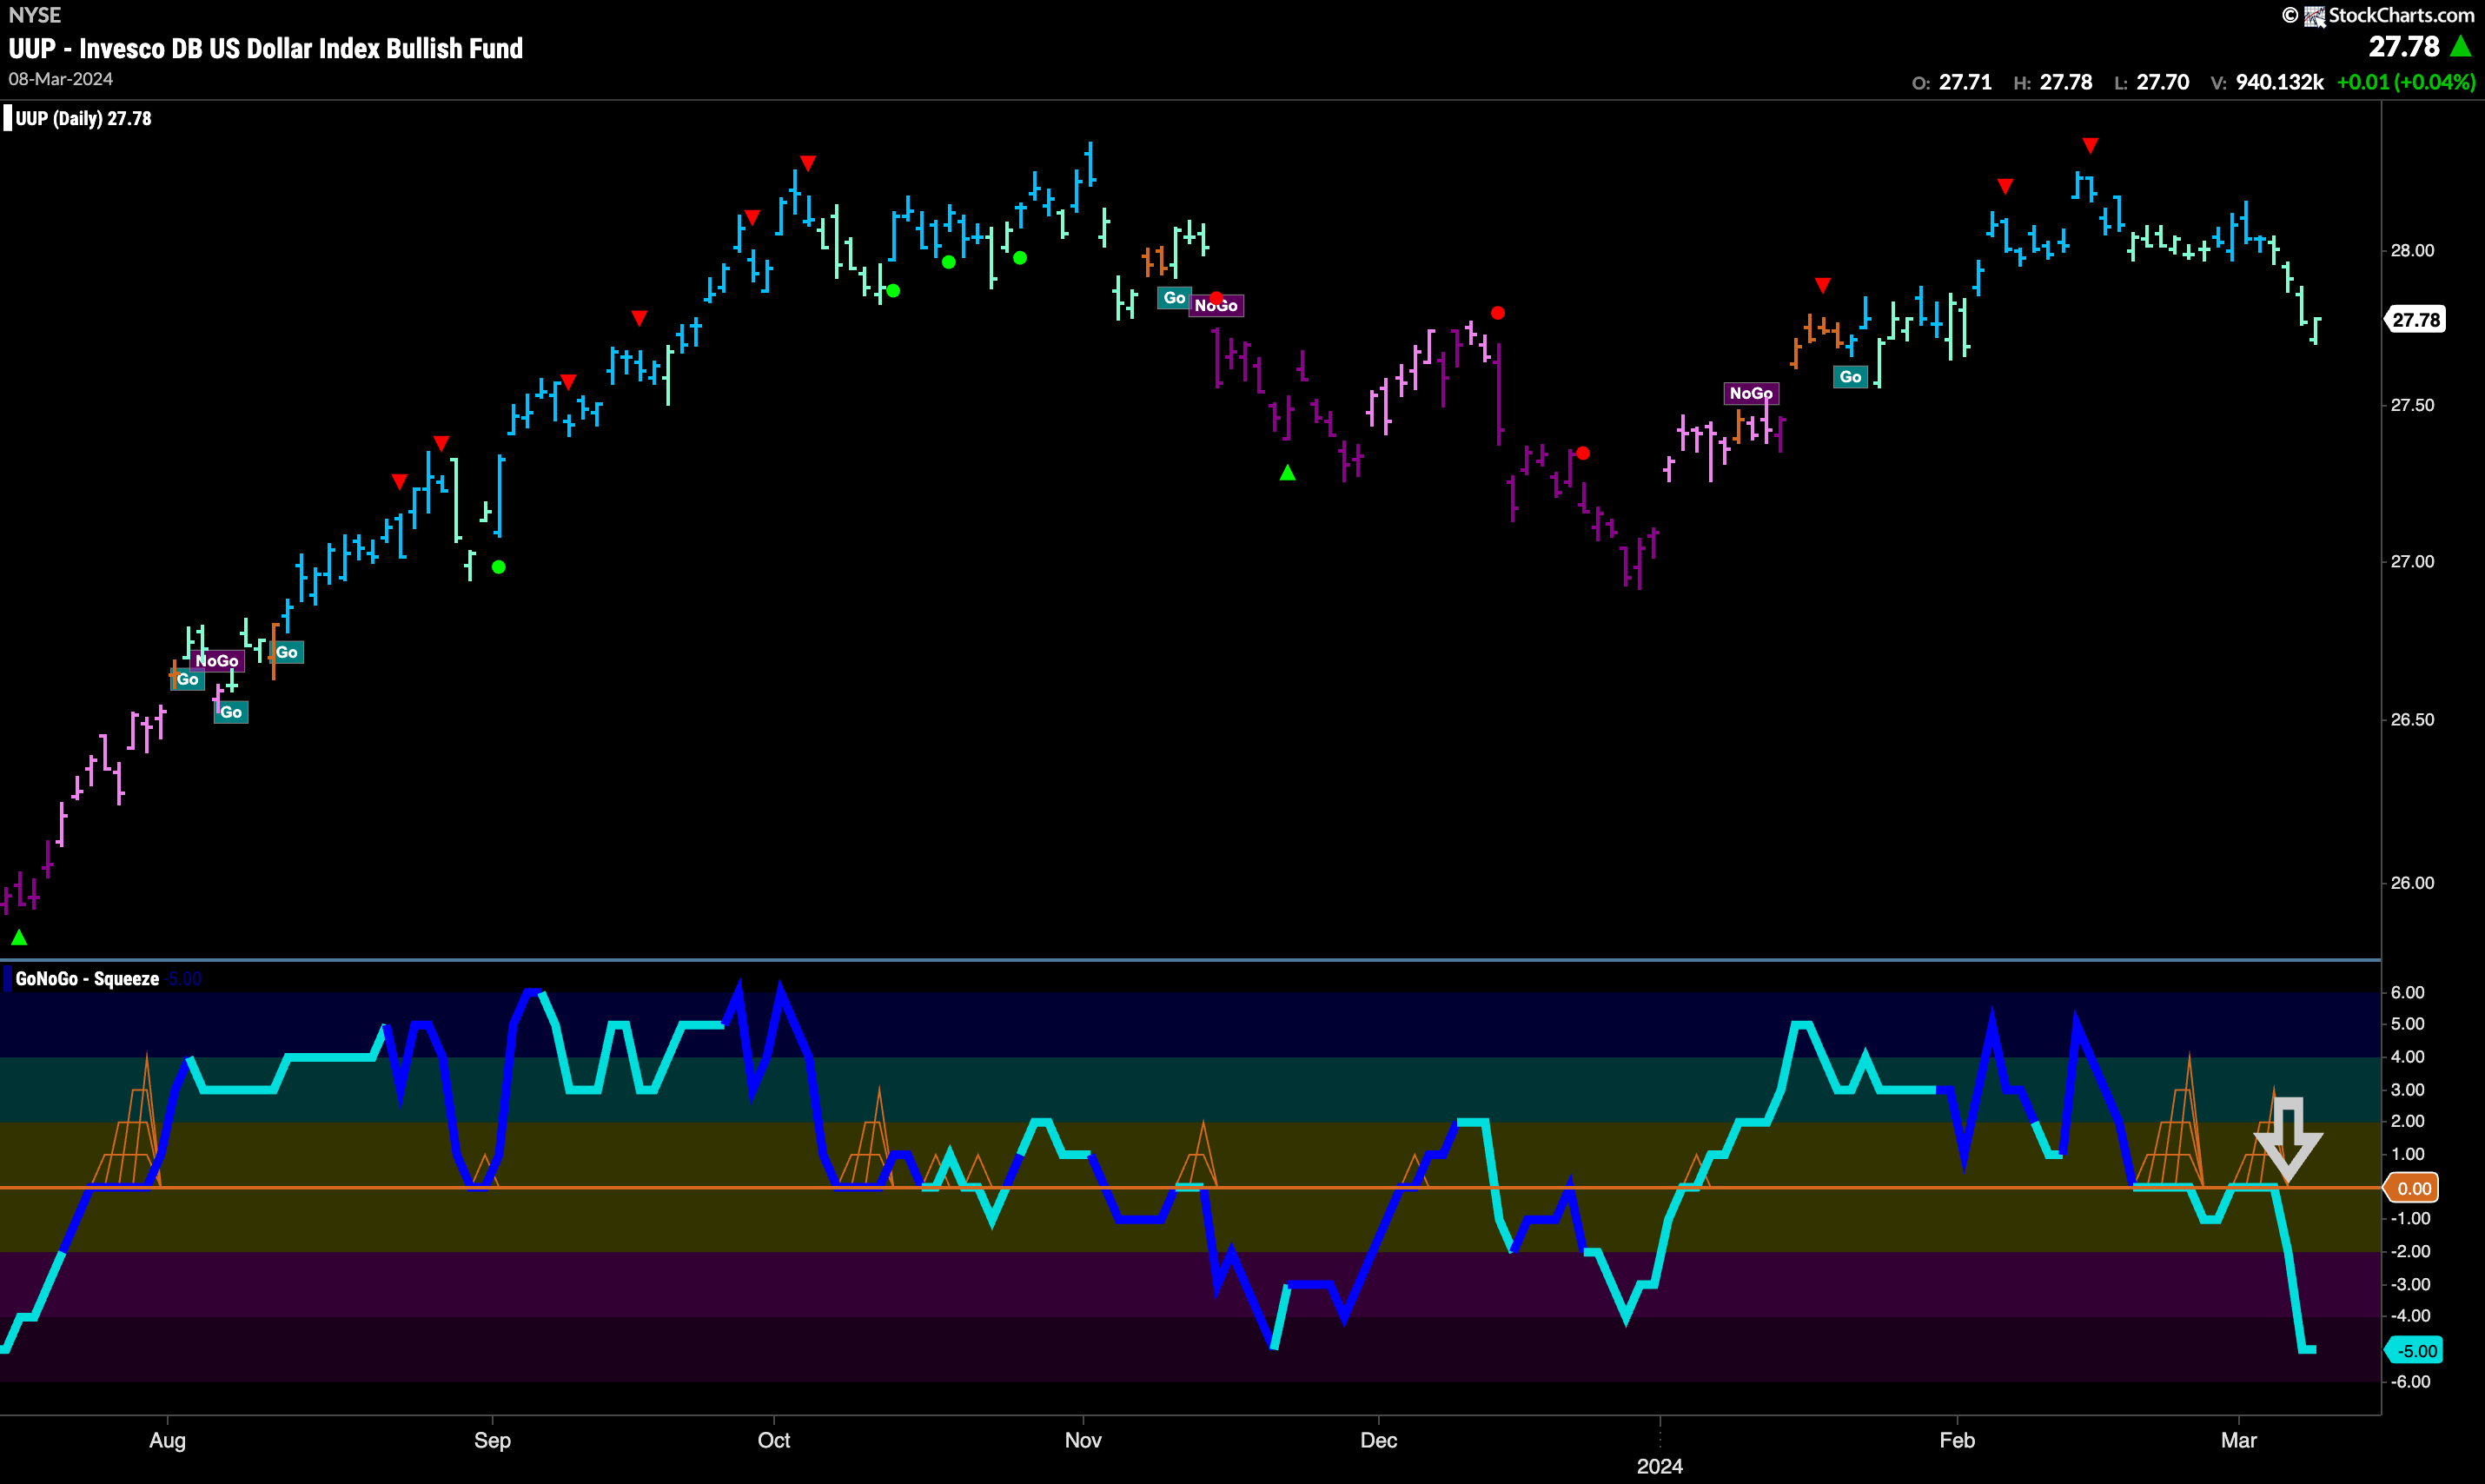
The dollar fell this week as GoNoGo Trend painted a string of weaker aqua “Go” bars. This comes as GoNoGo Oscillator crashed through the zero line out of a small GoNoGo Squeeze and has moved sharply to oversold levels at a value of 5. This kind of negative momentum is not healthy for a “Go” trend and so we would expect possible further bearish price action that could cause GoNoGo Trend to move into a “NoGo” trend.
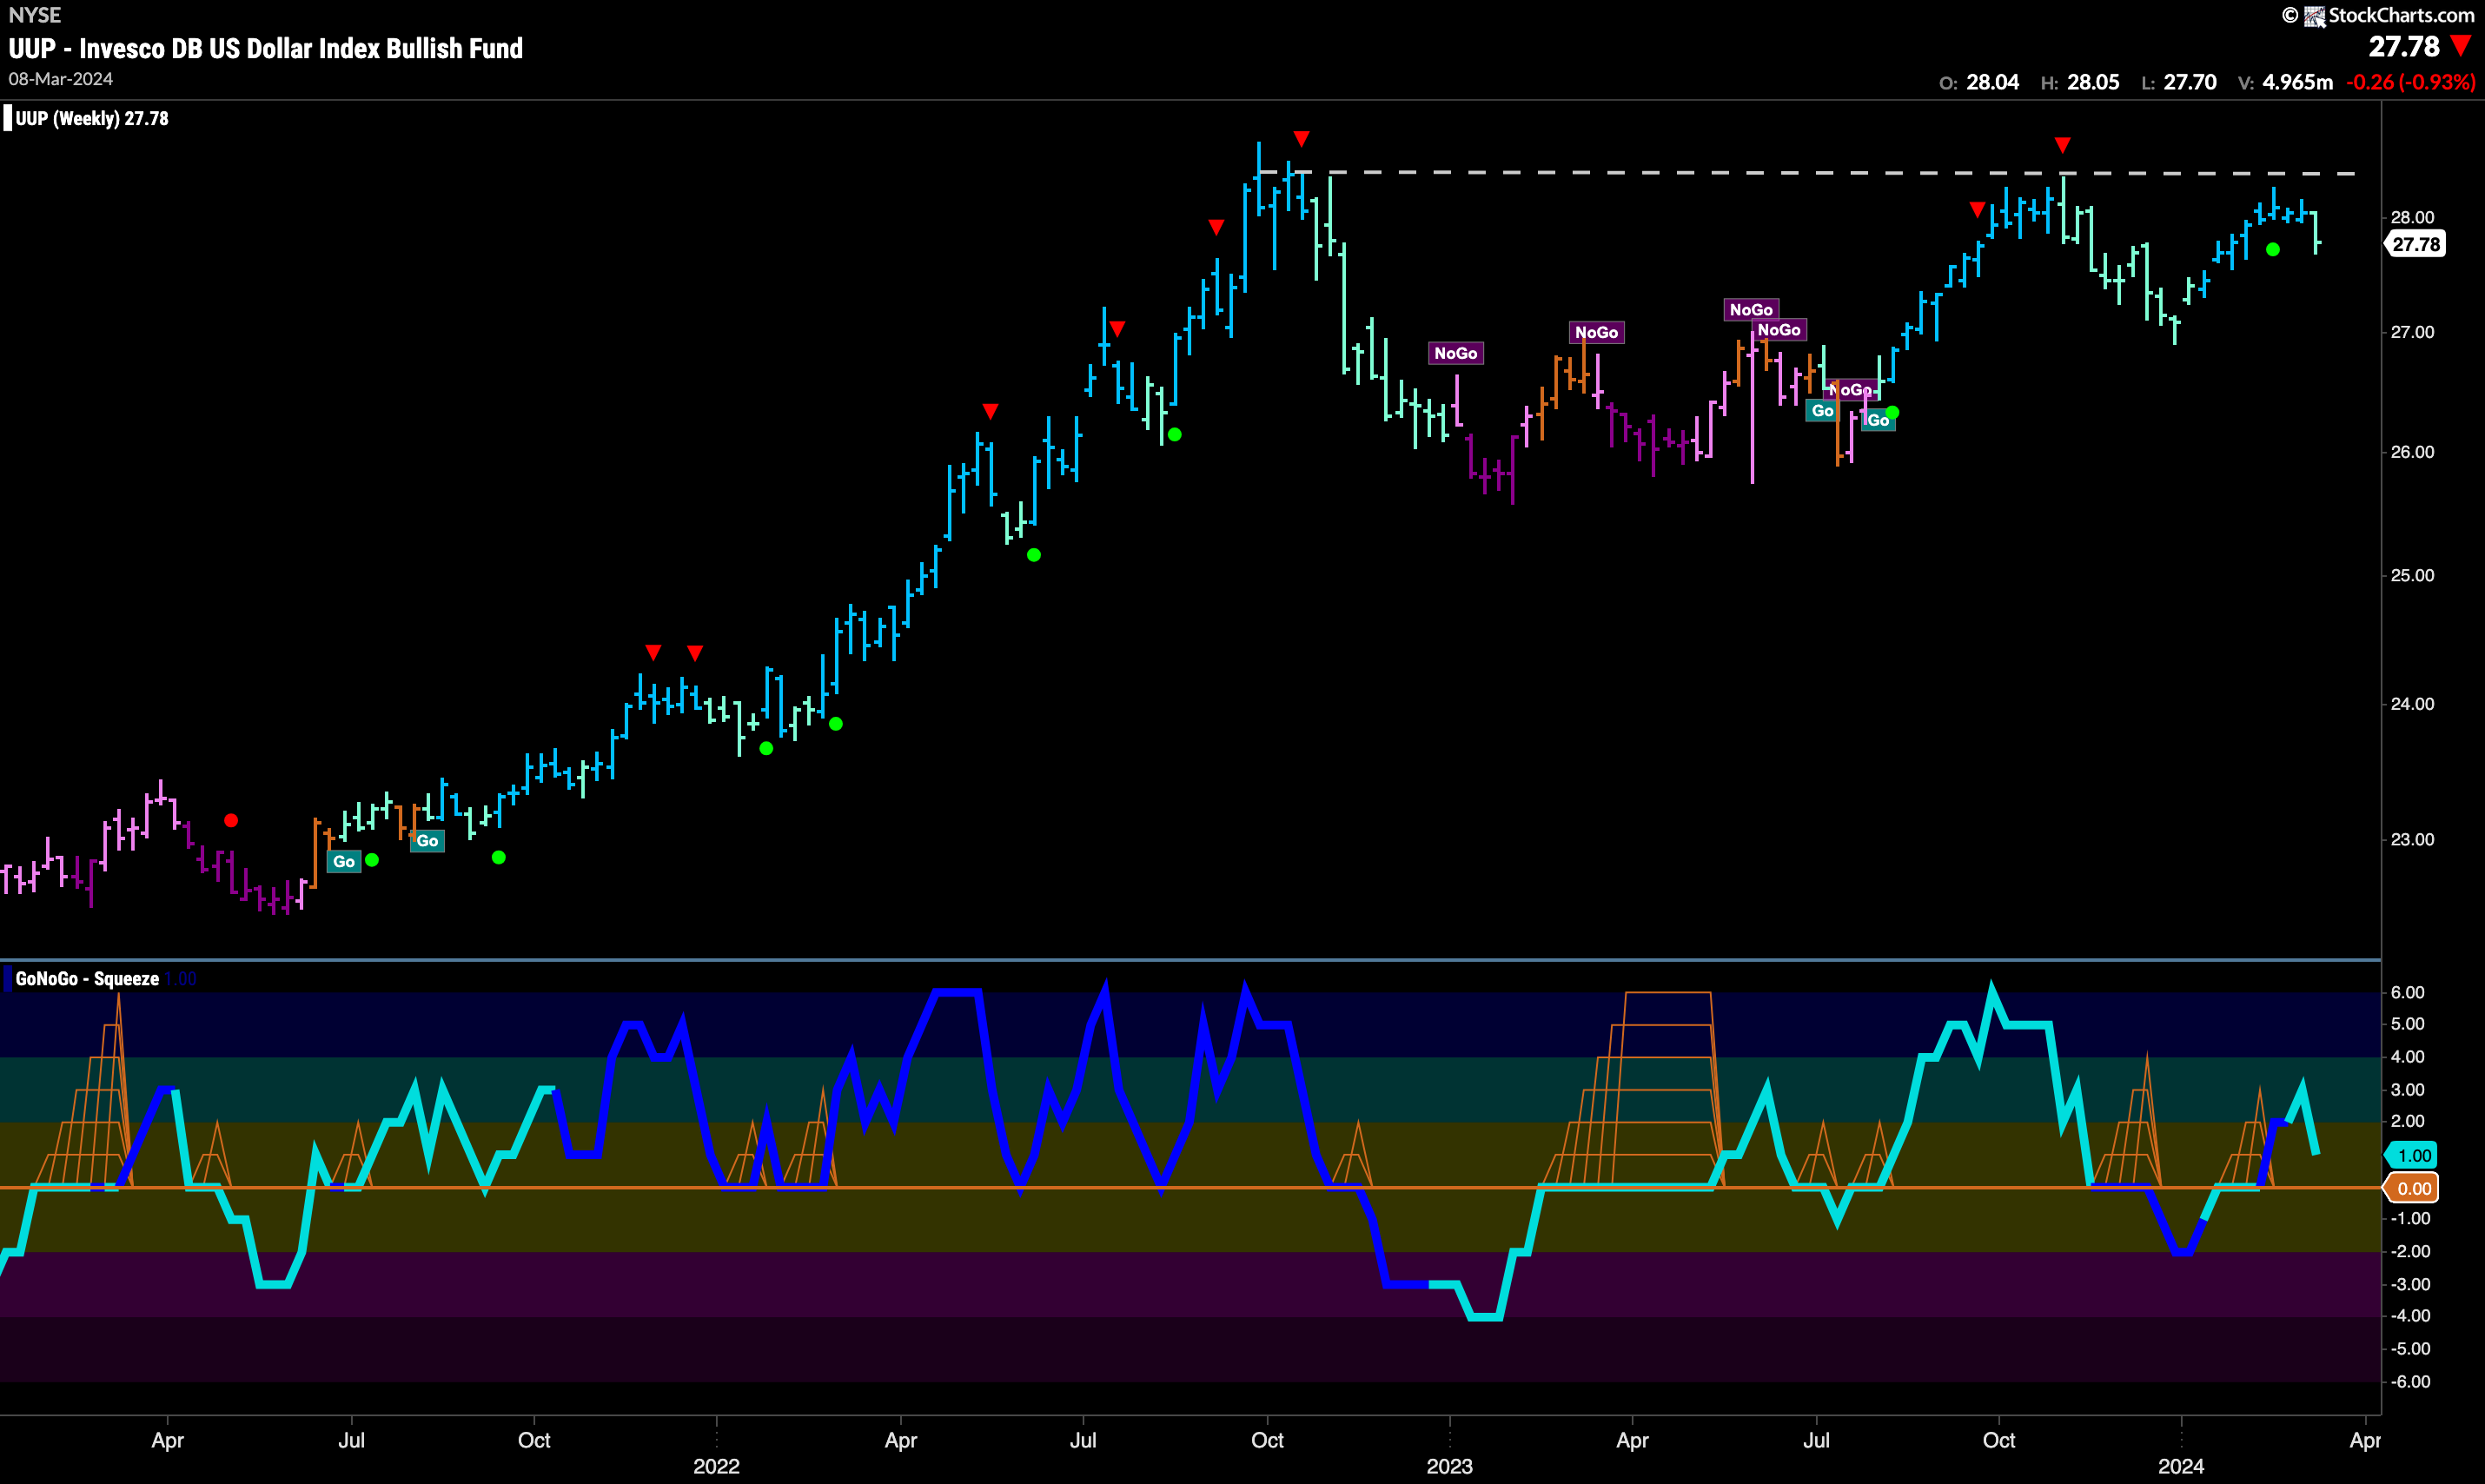
The longer term chart shows that the overhead resistance is strong. Last week saw price fall once again from levels that have proven to be resistance in the past. GoNoGo Trend painted a first weaker aqua bar this week as the greenback looks to hold on to the trend. GoNoGo Oscillator while in positive territory has quickly reversed direction and is heading for the zero line. We will look to see if the oscillator finds support at zero in order for the trend to remain in place in the price panel above.
Oil at Important Moment
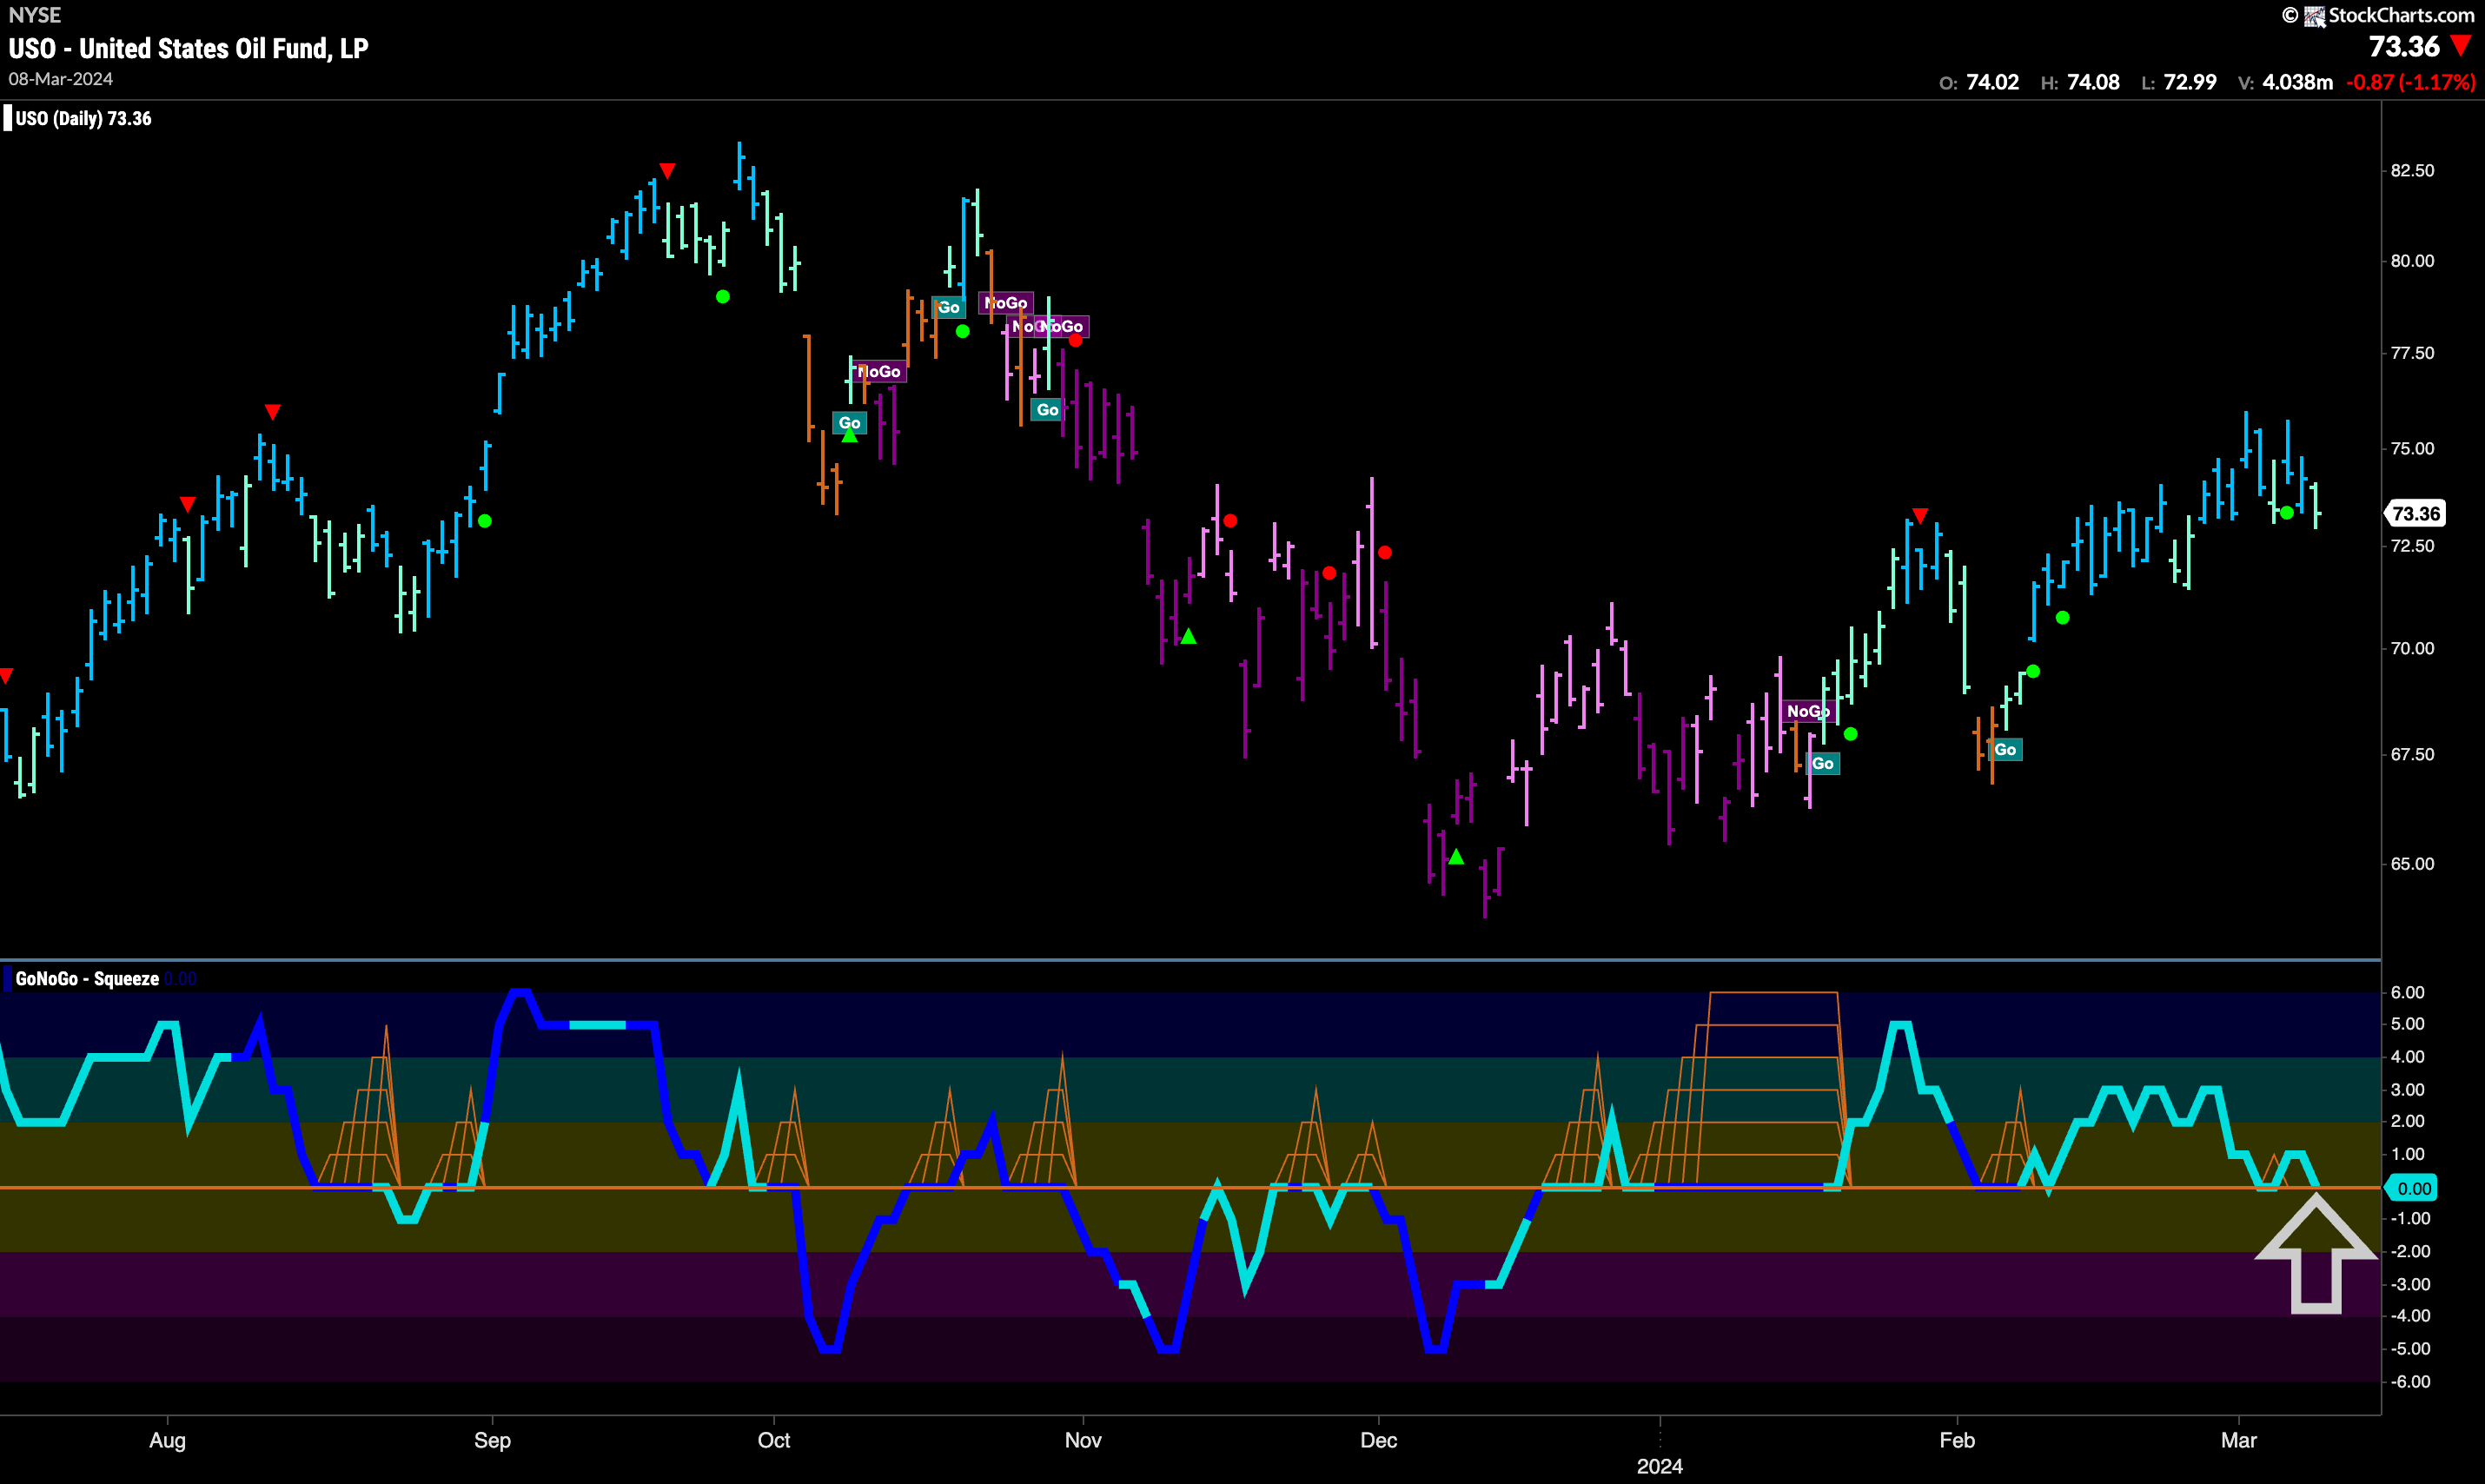
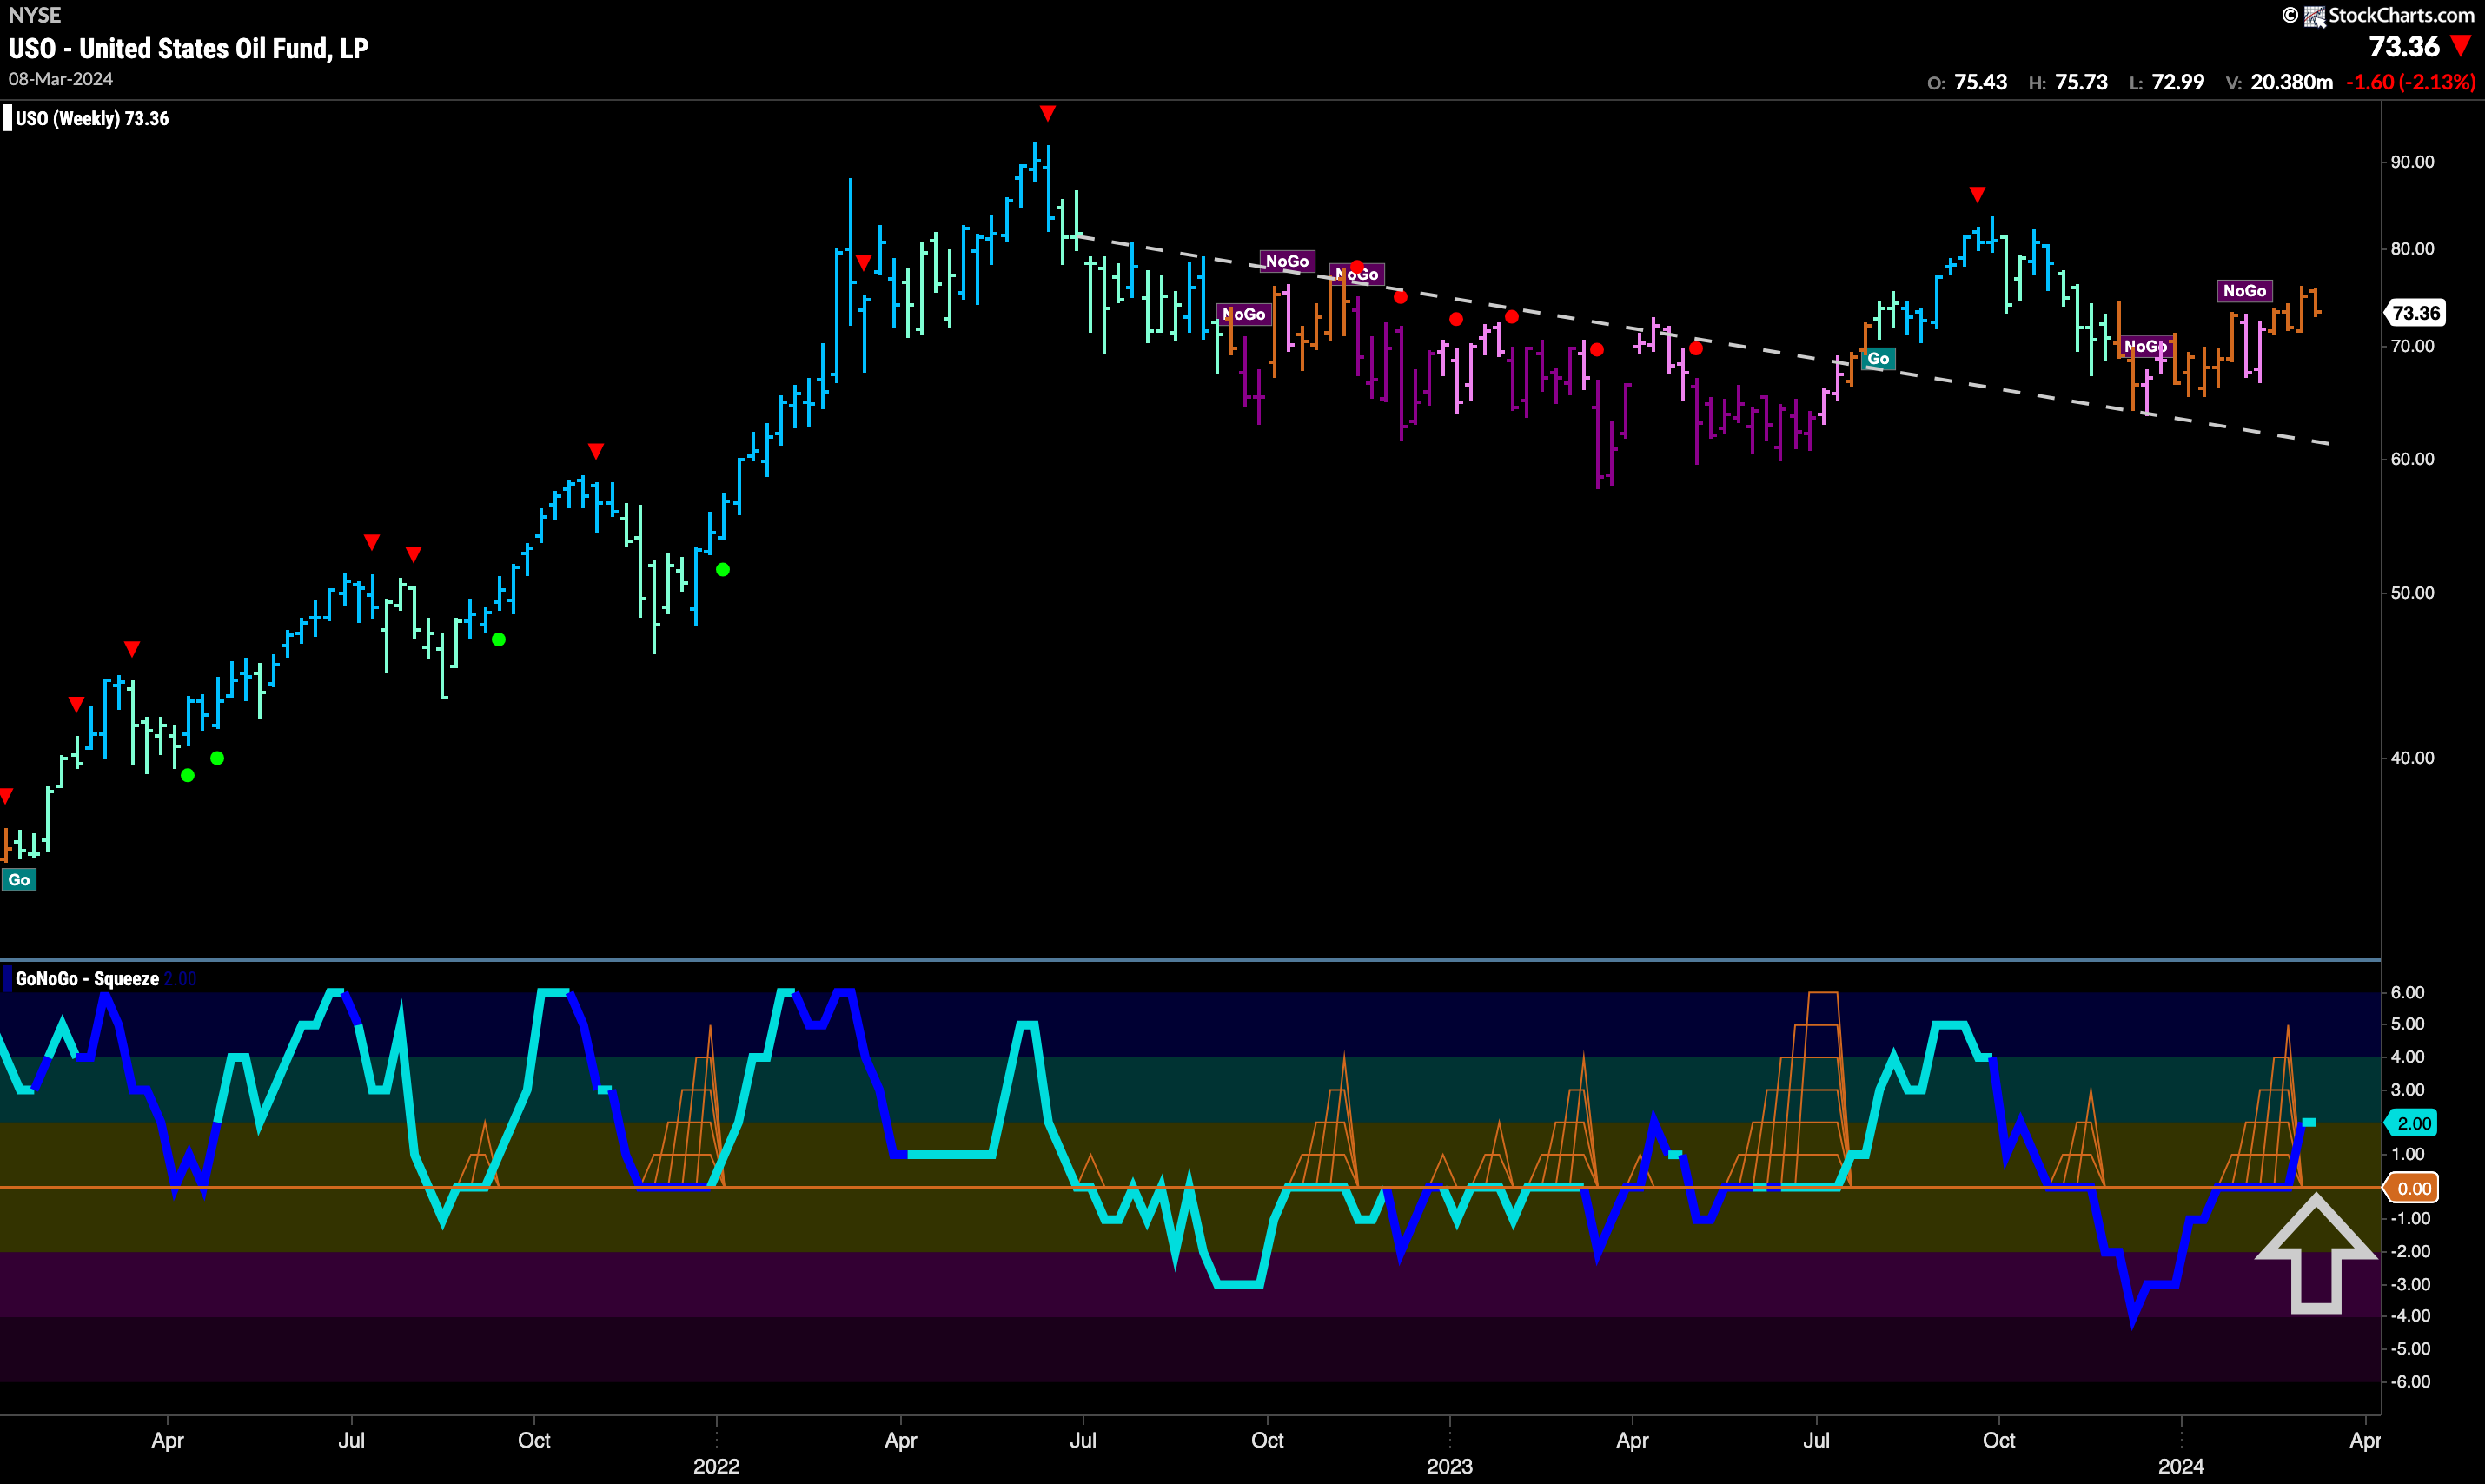
GoNoGo Trend painted more “Go” bars this week although it did end the week with a weaker aqua bar as price fell back from its new high. With this, GoNoGo Oscillator fell to the zero line again where we will look to see if it can find support. If it does, then we would be able to say that momentum is resurgent in the direction of the underlying “Go” trend. We could then look for price to make an attempt at a new high. A break of the zero line into negative territory on the other hand would signal trouble for the “Go” trend.
The weekly chart shows that the market remains uncertain in terms of the long term direction of price. Another amber “Go Fish” bar tells us that not enough criteria were met to paint a trend in either direction for a fourth straight week. We do see that GoNoGo Oscillator has broken out of a GoNoGo Squeeze into positive territory and that is a bullish sign. This leads us to suspect the next trend is potentially more likely to be a “Go”.
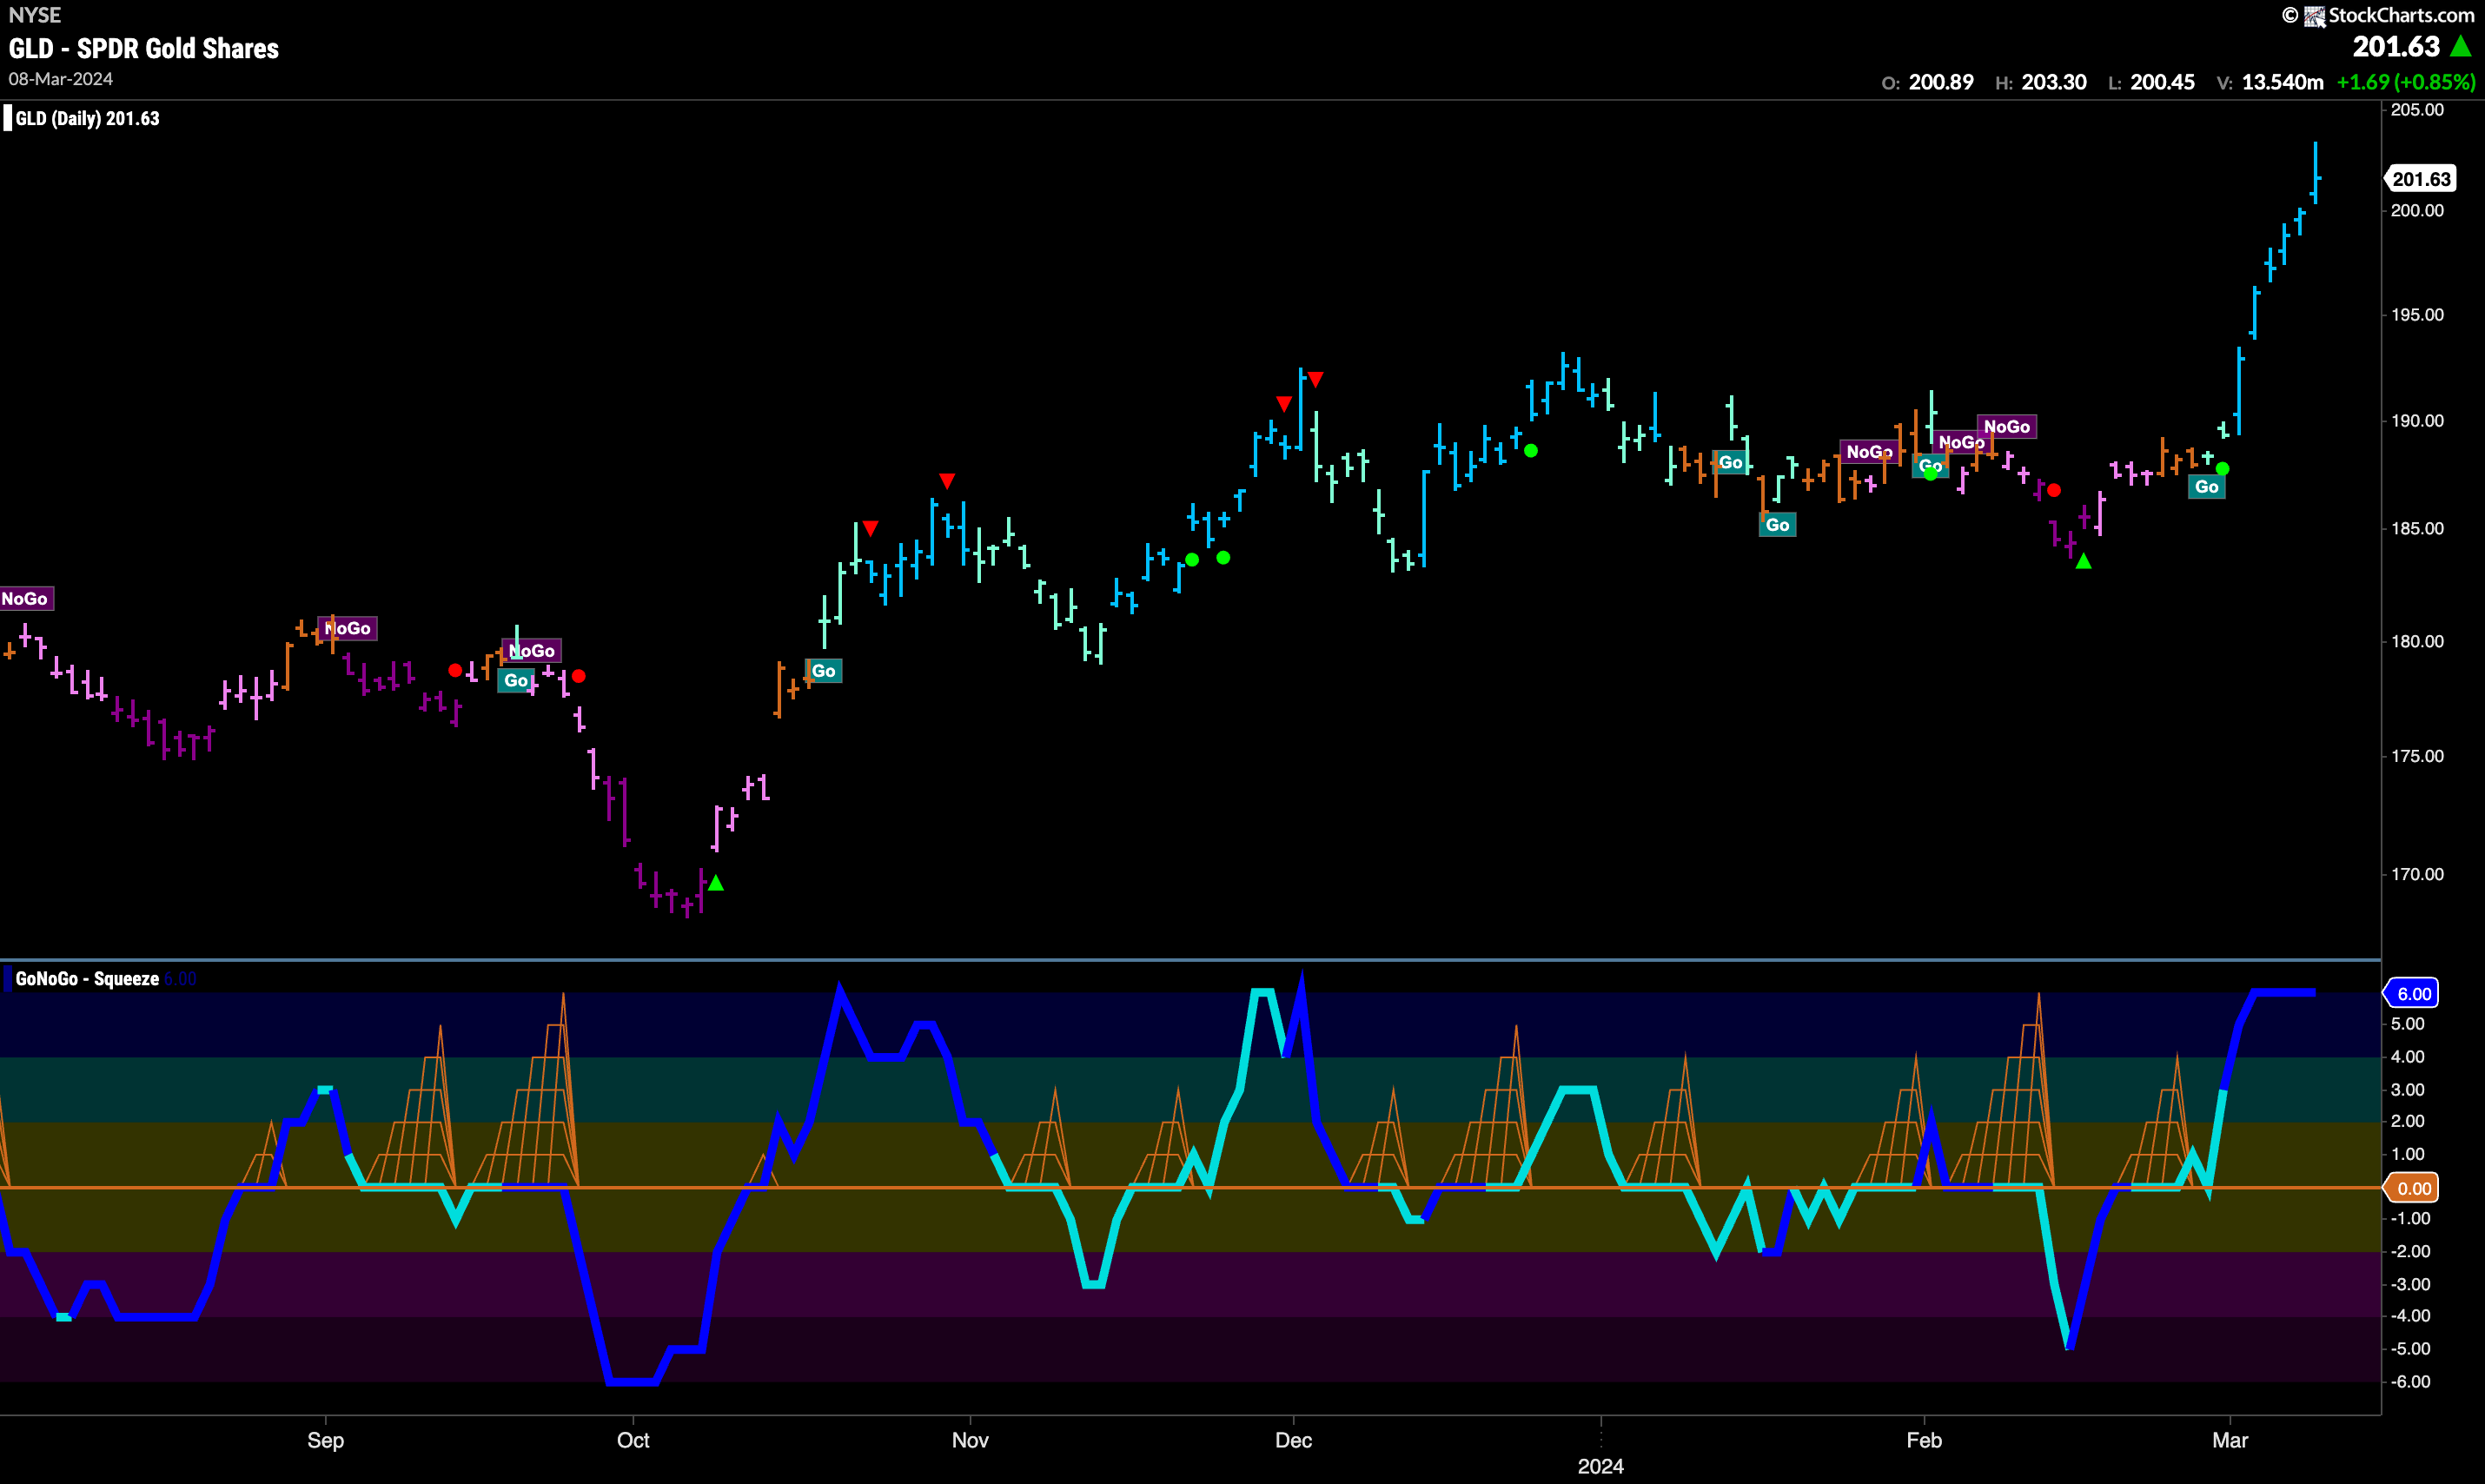
Gold Flies Higher
Well, well, well. Is this the move that the gold bulls have been waiting for? After breaking out of a small GoNoGo Squeeze and moving sharply into positive territory, GoNoGo Oscillator also shows us that there was heavy volume this week (oscillator color turning darker blue) and so there was strong market participation in this latest move higher. Gold closed higher every day of the week and GoNoGo Trend painted a string of uninterrupted strong blue “Go” bars.
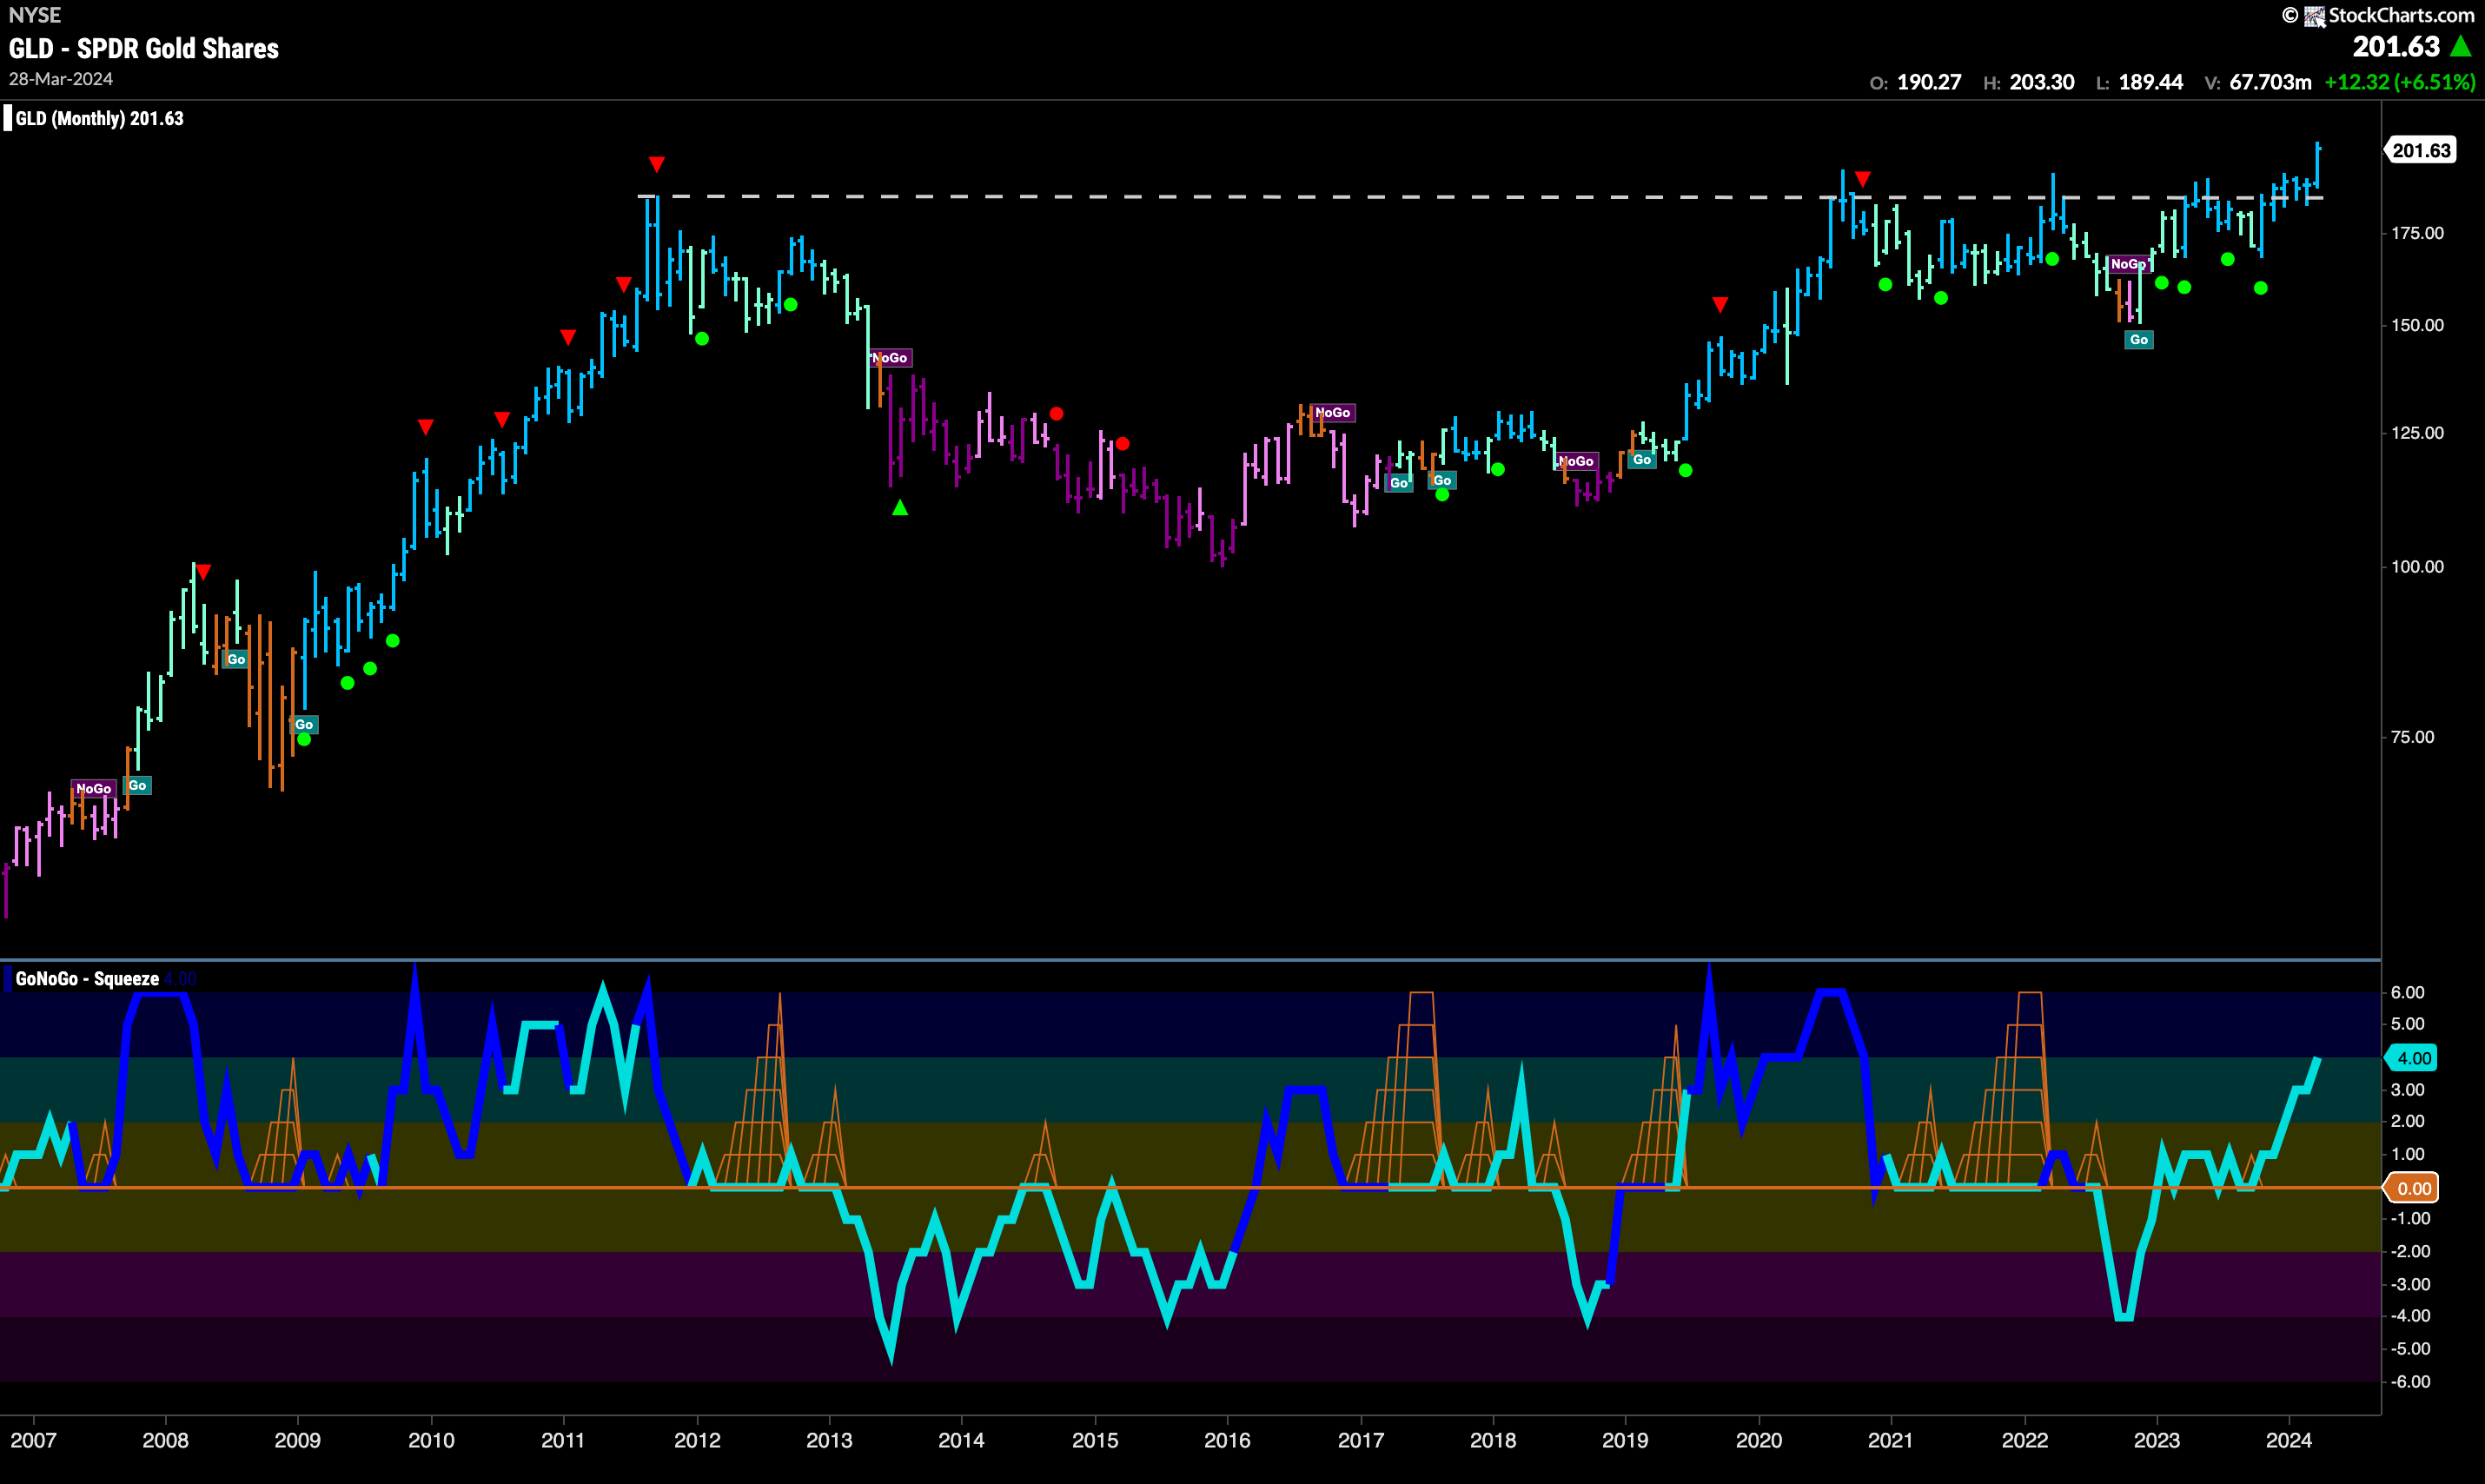
And here it is! The monthly chart we have been watching for years and years! It appears that price has broken above the resistance that we have seen in the form of a giant decade plus cup and handle pattern. Of course, we are mid month, and so we will have to see where the month closes, but this is as high above the horizontal resistance as we have ever seen it. GoNoGo Oscillator is at a value of 4 so not yet overbought.
Sector RelMap
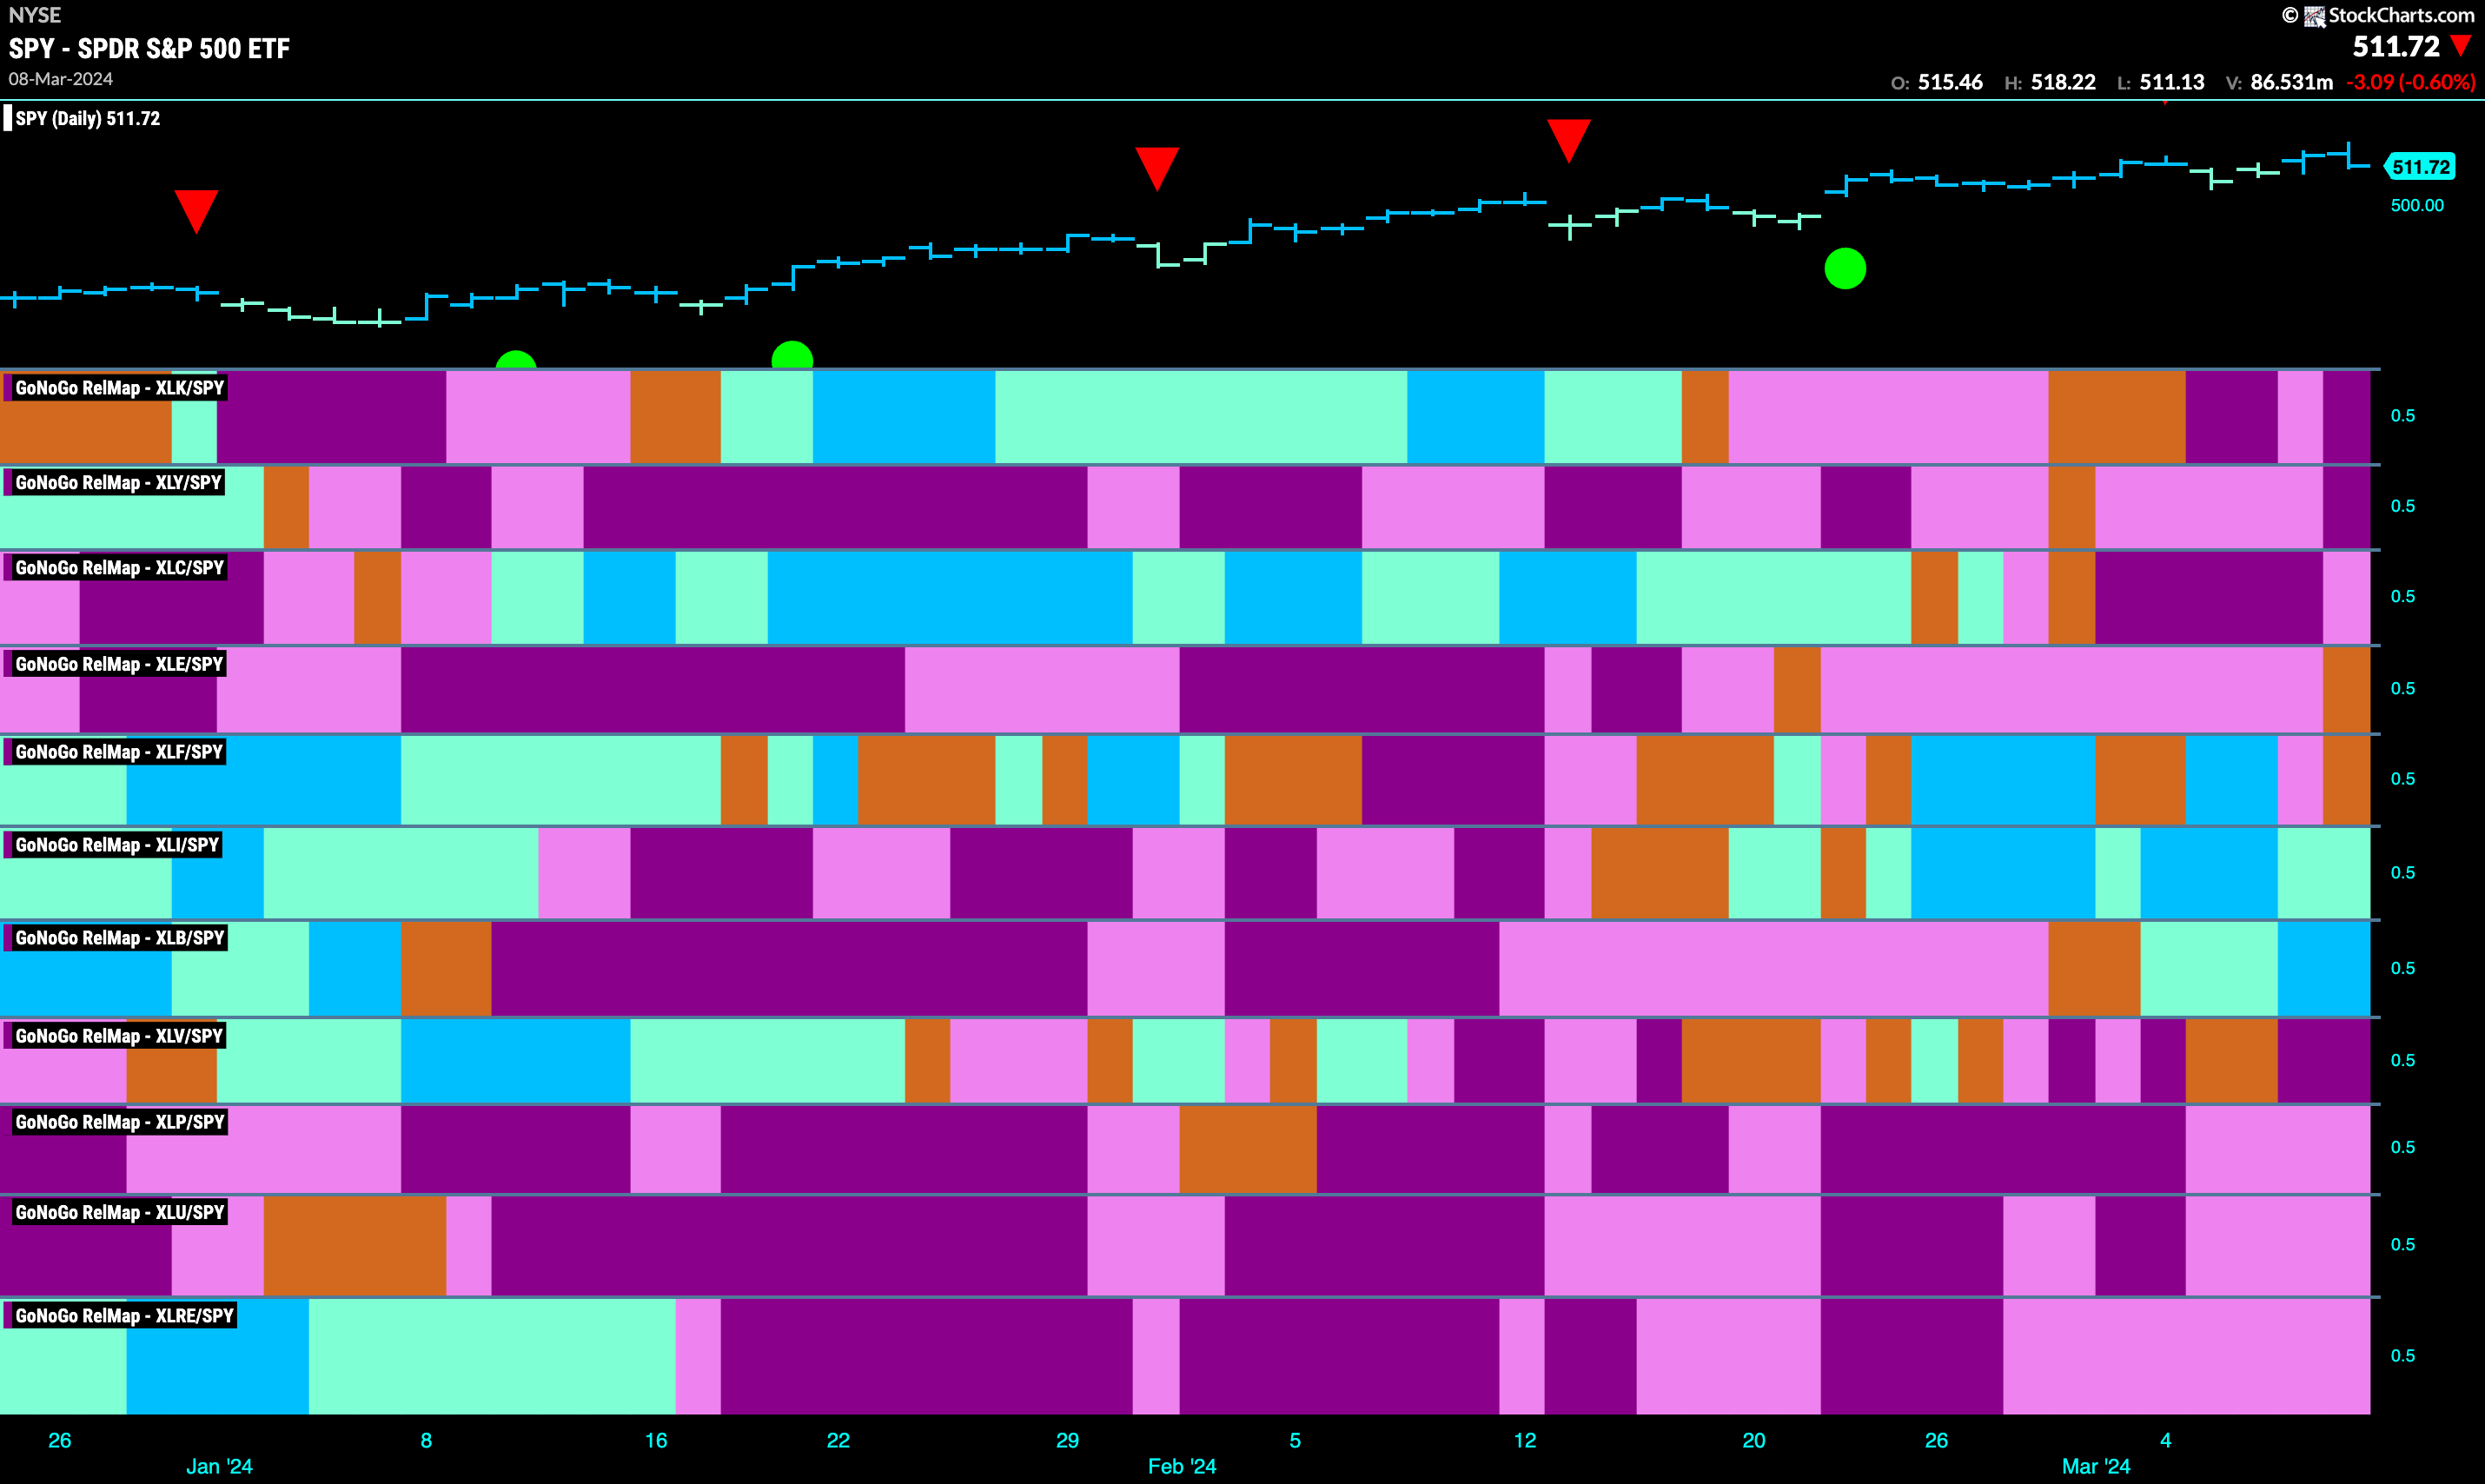
Below is the GoNoGo Sector RelMap. This GoNoGo RelMap applies the GoNoGo Trend to the relative strength ratios of the sectors to the base index. Looking at this map, we can quickly see where the relative outperformance is coming from as well as which sectors are lagging on a relative basis. Only 2 sectors are outperforming the base index this week. $XLI, and $XLB are painting relative “Go” bars.
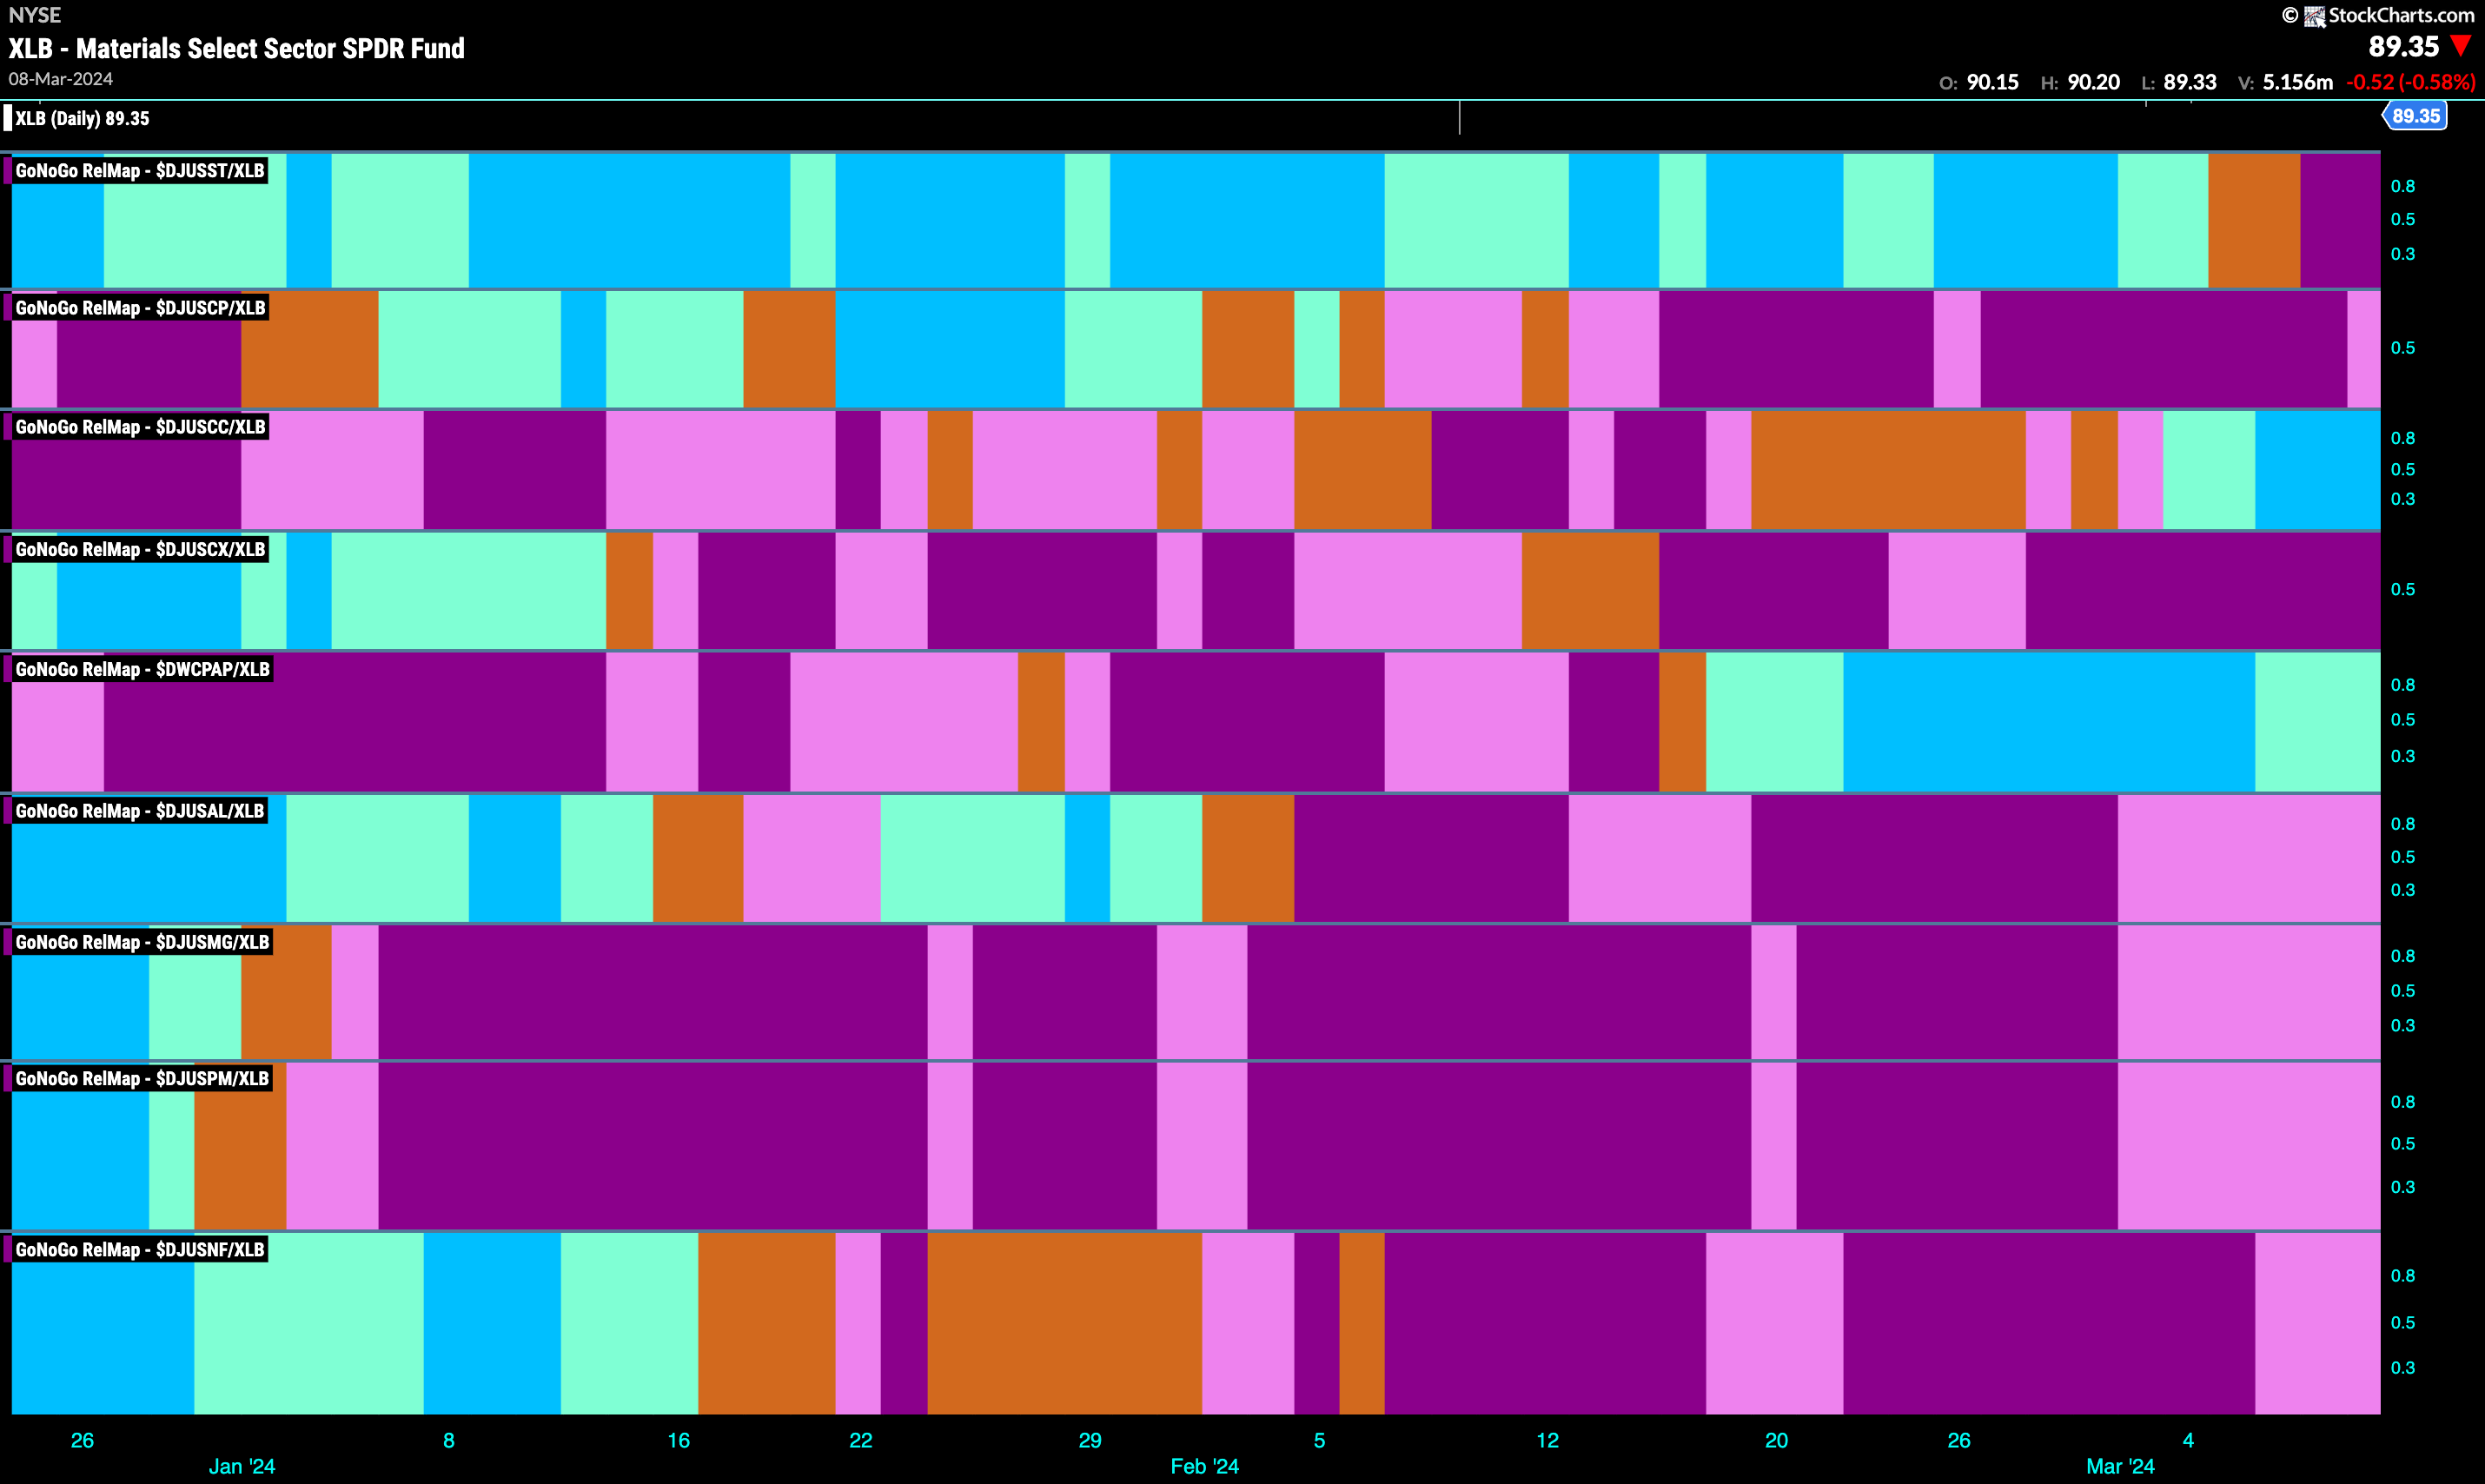
Materials Sub-Group RelMap
The GoNoGo Sector RelMap above shows that the materials sector has joined forces with the industrials sector and started to outperform on a relative basis for another week. Below, we see the individual groups of the sector relative to the sector itself. We apply the GoNoGo Trend to those ratios to understand where the relative outperformance is coming from within a sector. We see that it is relatively thin leadership from within this sector. Only commodity chemicals (5th panel) and commercial paper are outperforming. Commercial paper is in a relatively fresh “Go” trend and painting strong blue “Go” bars on a relative basis.
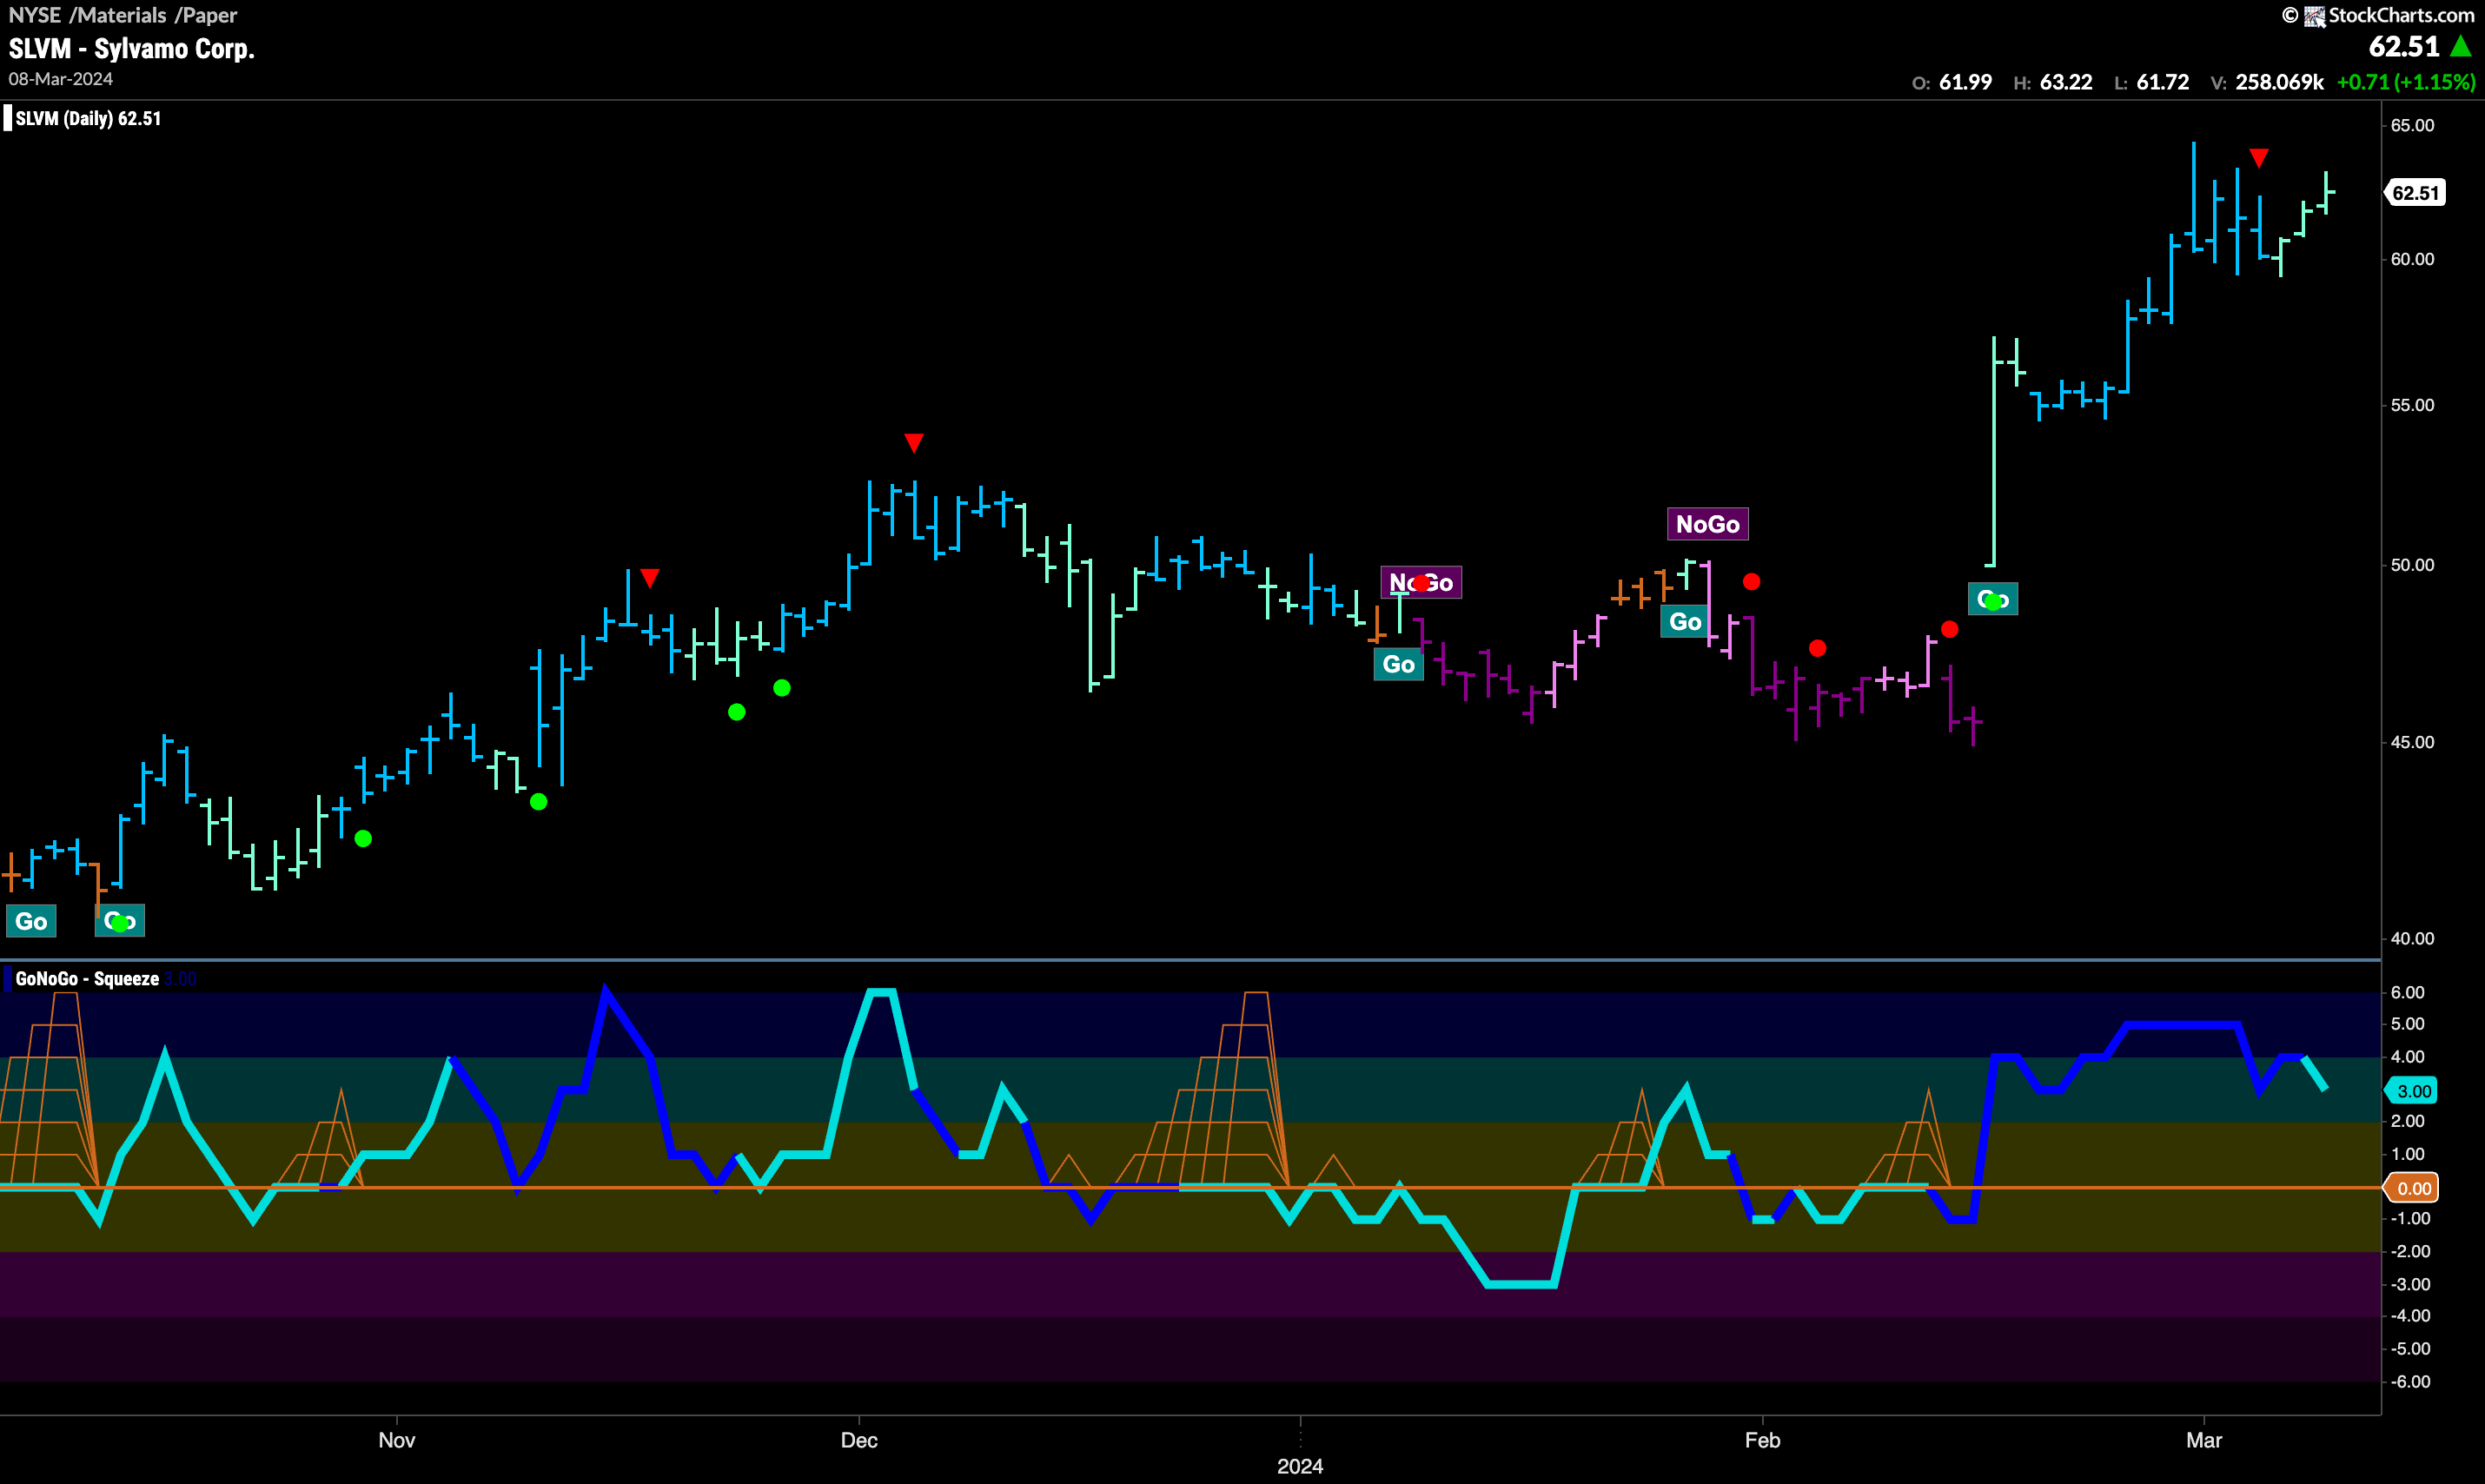
$SLVM Setting up for New High?
Sylvamo Corp looks to be in a healthy “Go” trend. We could do well looking for opportunities to participate perhaps by looking for pullbacks or by stepping down a time frame. On the daily chart below, we can see that we have moved sideways since hitting a high and triggering a Go Countertrend Correction Icon (red arrow) and are now painting weaker aqua bars. GoNoGo Oscillator has been able to stay well into positive territory though at a value of 3. We will watch to see if the oscillator falls to the zero line or turns around before that level. Any surge momentum may give price the push it needs to attack new highs.
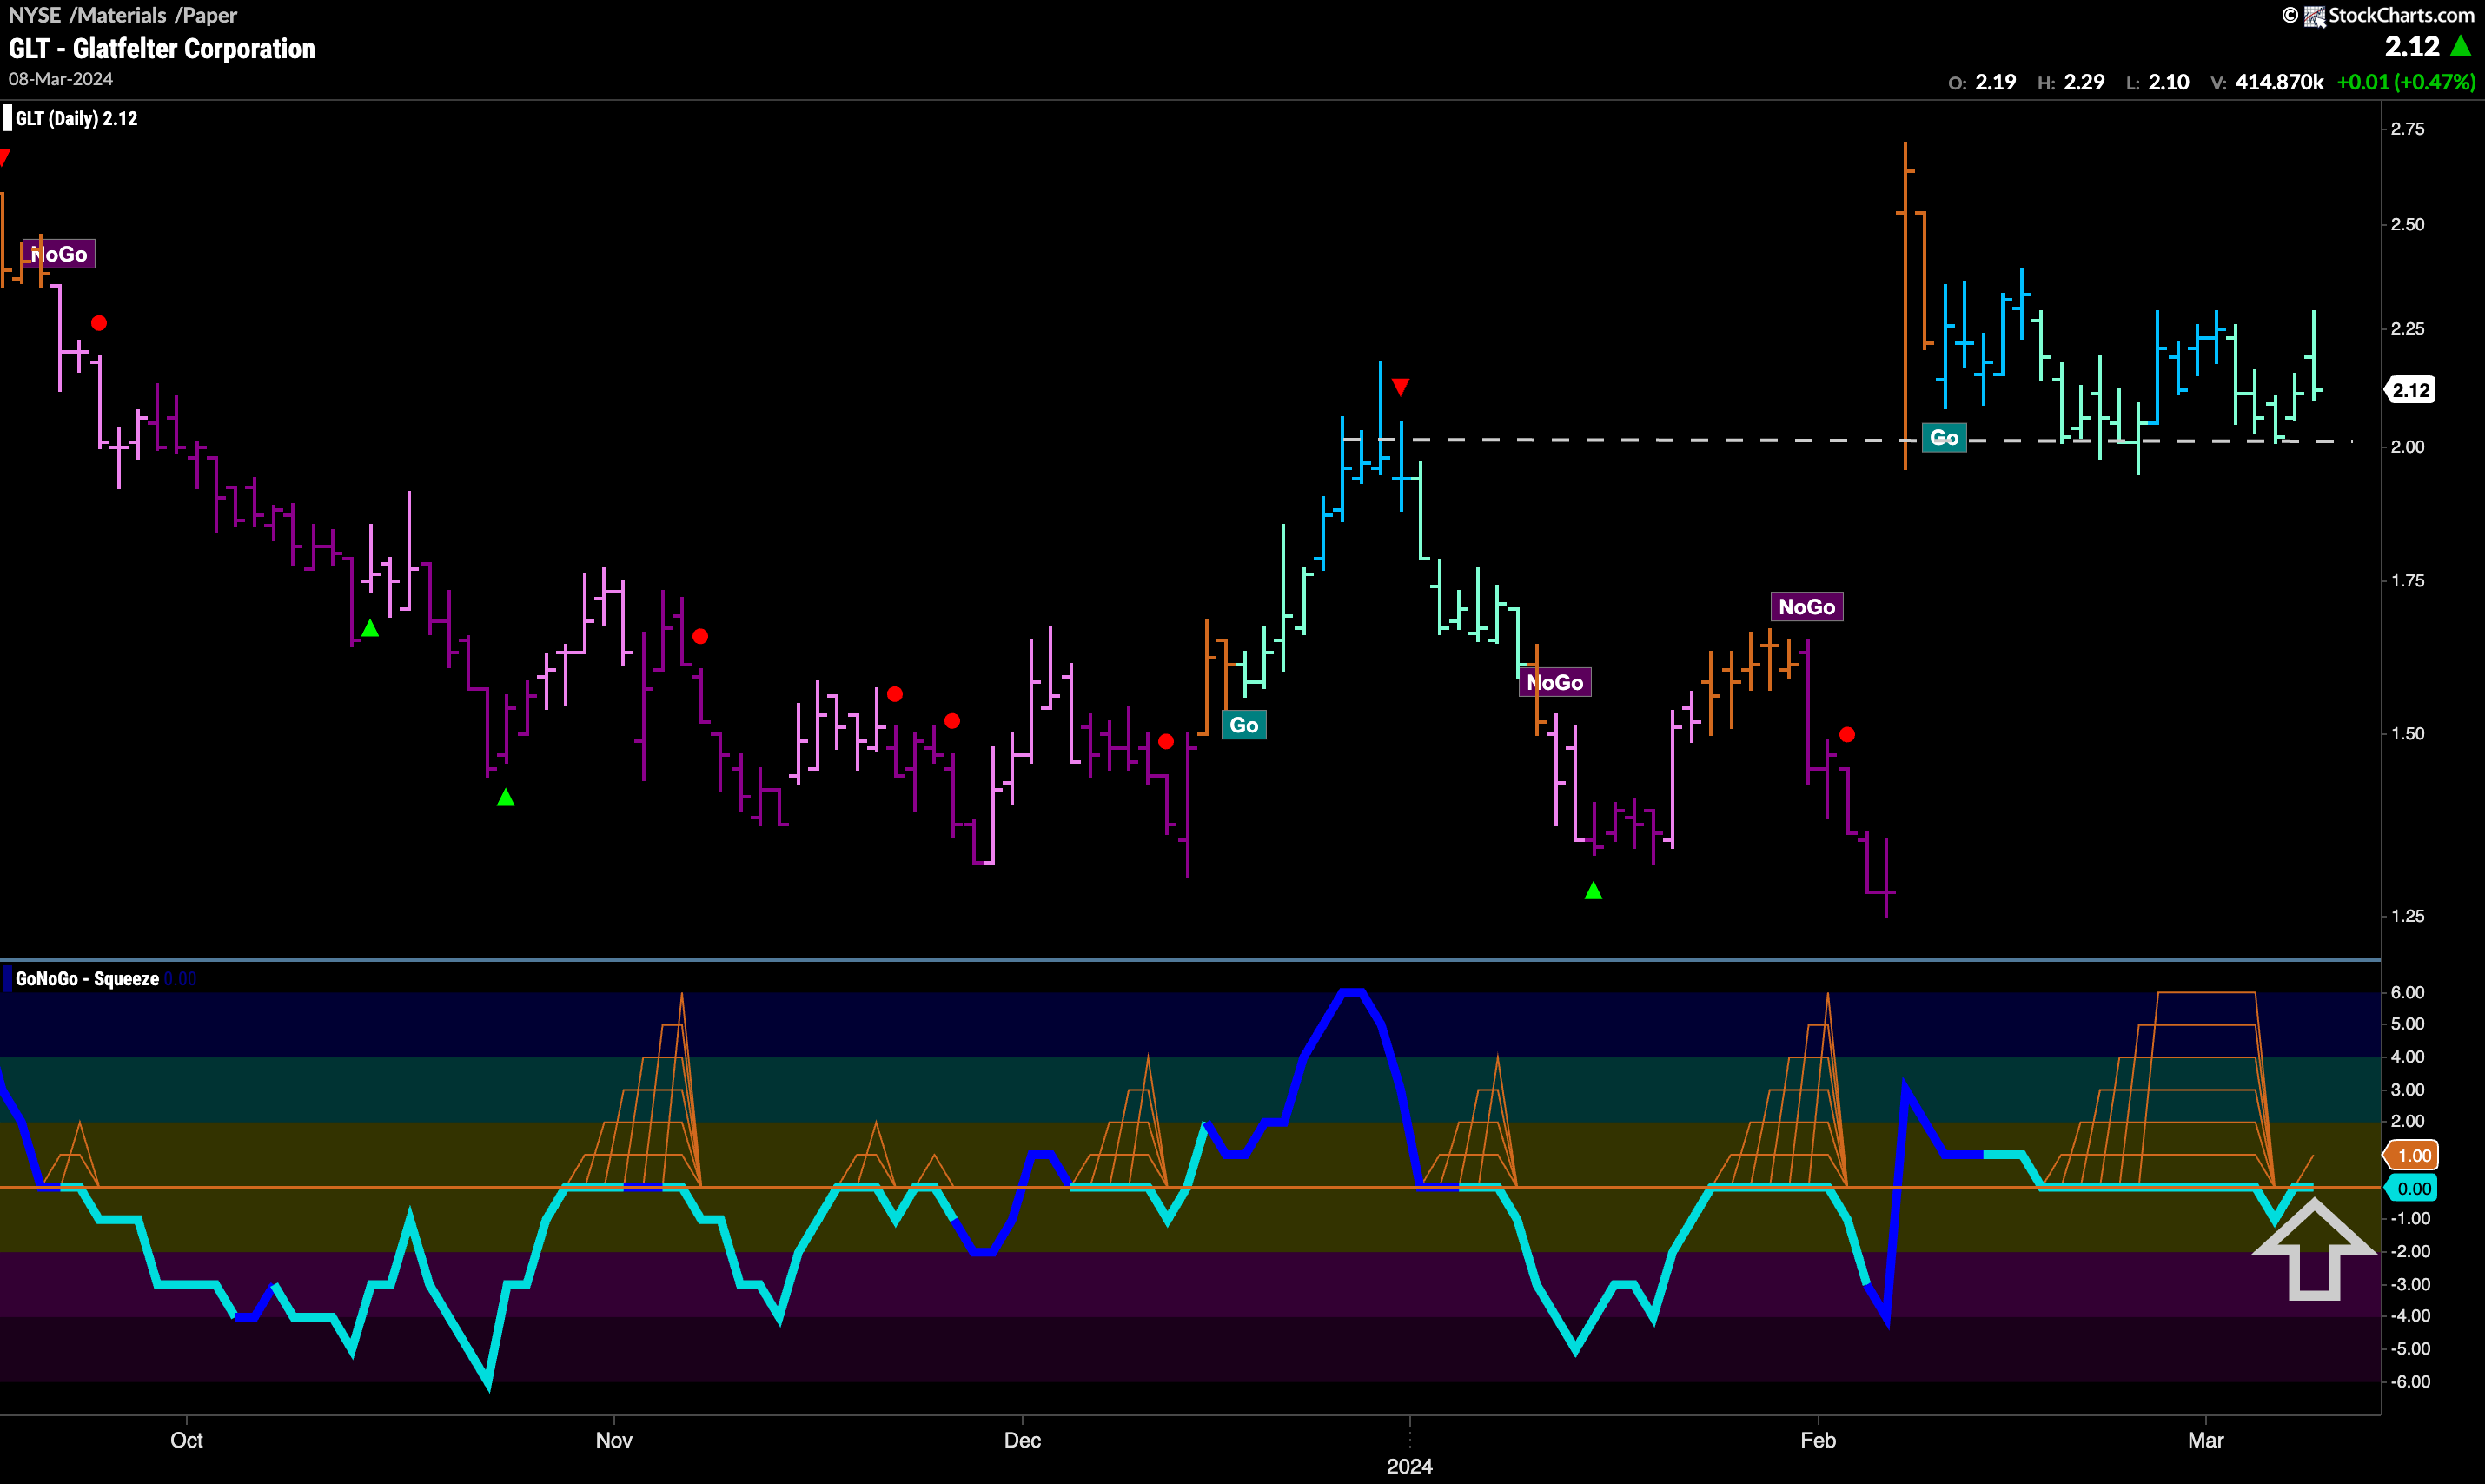
$GLT Finding Support at Gap in “Go” Trend
We can see that since gapping higher in February, $GLT has moved sideways but GoNoGo Trend has managed to maintain “Go” colors. It is also important to note that price has found support repeatedly at the top of that gap. During that time we saw a Max GoNoGo Squeeze build telling us that there was a tug of war in play between buyers and sellers at that level. Now, that Max GoNoGo Squeeze appears to be being broken. At the zero line again after one bar in negative territory, it will be really important to see in which direction this resolves. A clear move into positive territory would likely propel price higher.
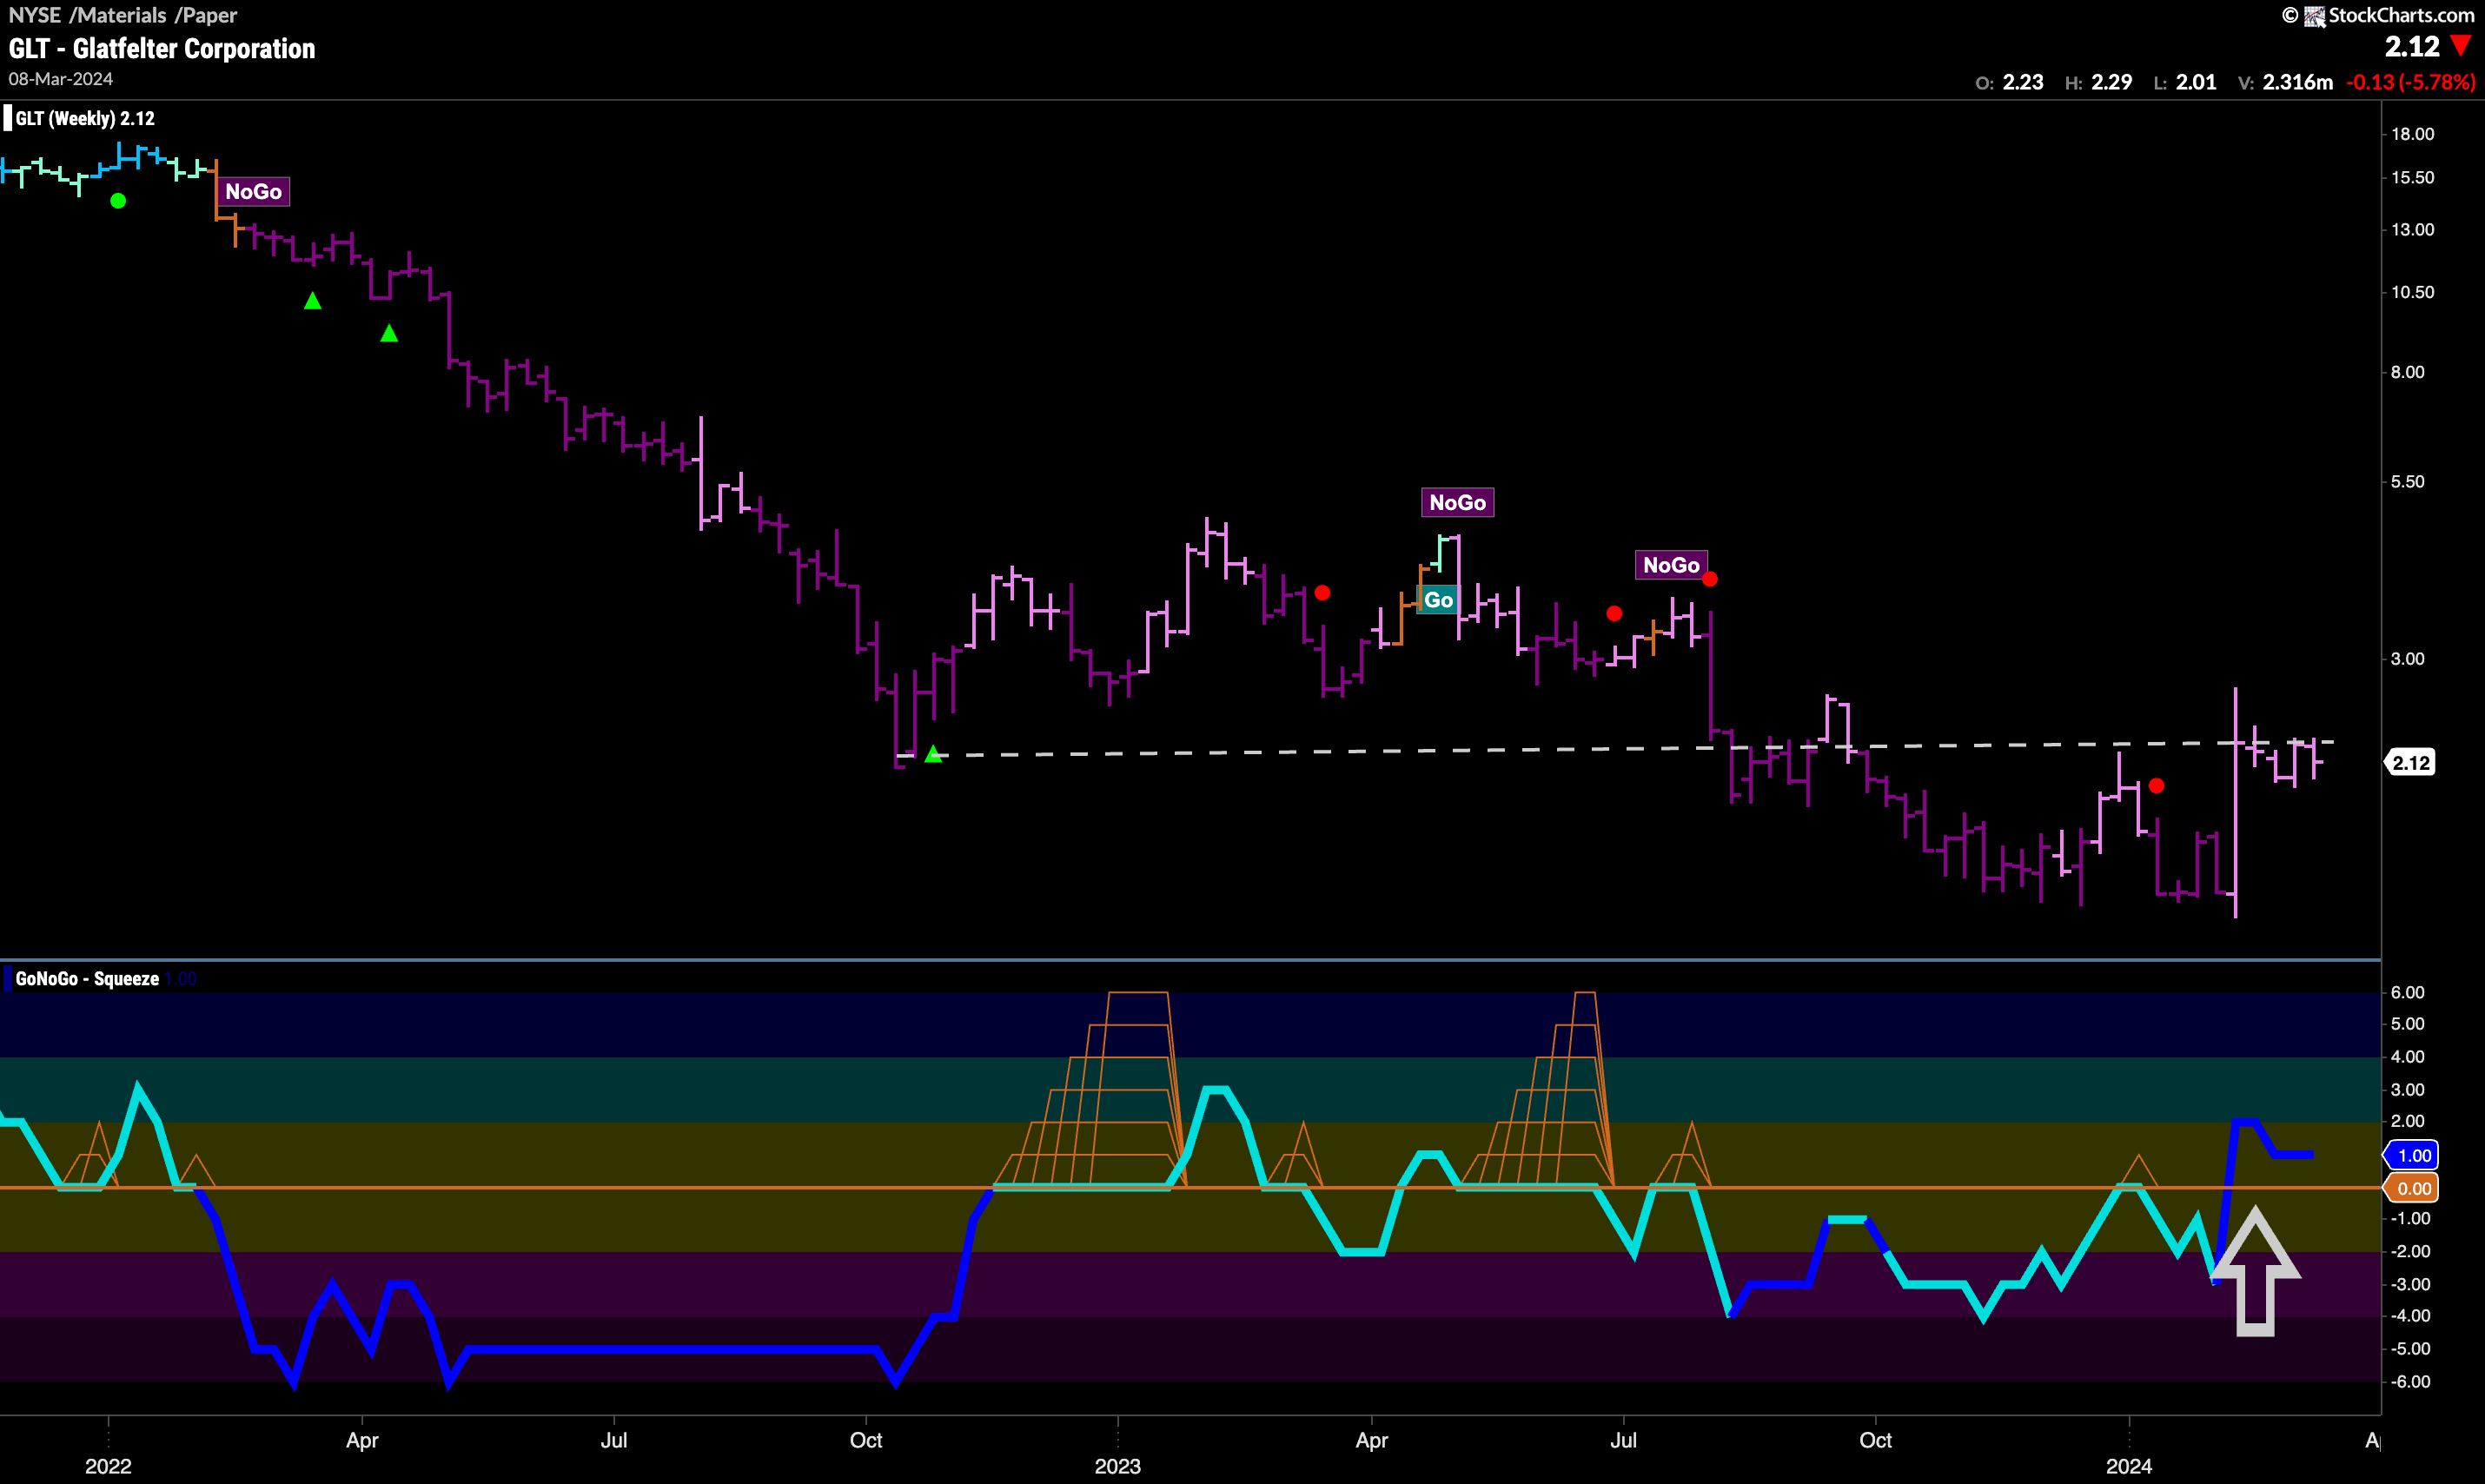
The weekly chart shows that a move higher will be well earned! $GLT is in a very strong “NoGo” trend but are we seeing signs of basing? GoNoGo Trend is painting weaker pink bars as price rallies off the latest low. We also see that price is threatening a level that has been resistance and support and we will watch closely to see how it deals with this level. Importantly, GoNoGo Oscillator has broken through the zero line on heavy volume and so this positive momentum could help price reach new higher highs on this weekly chart.
