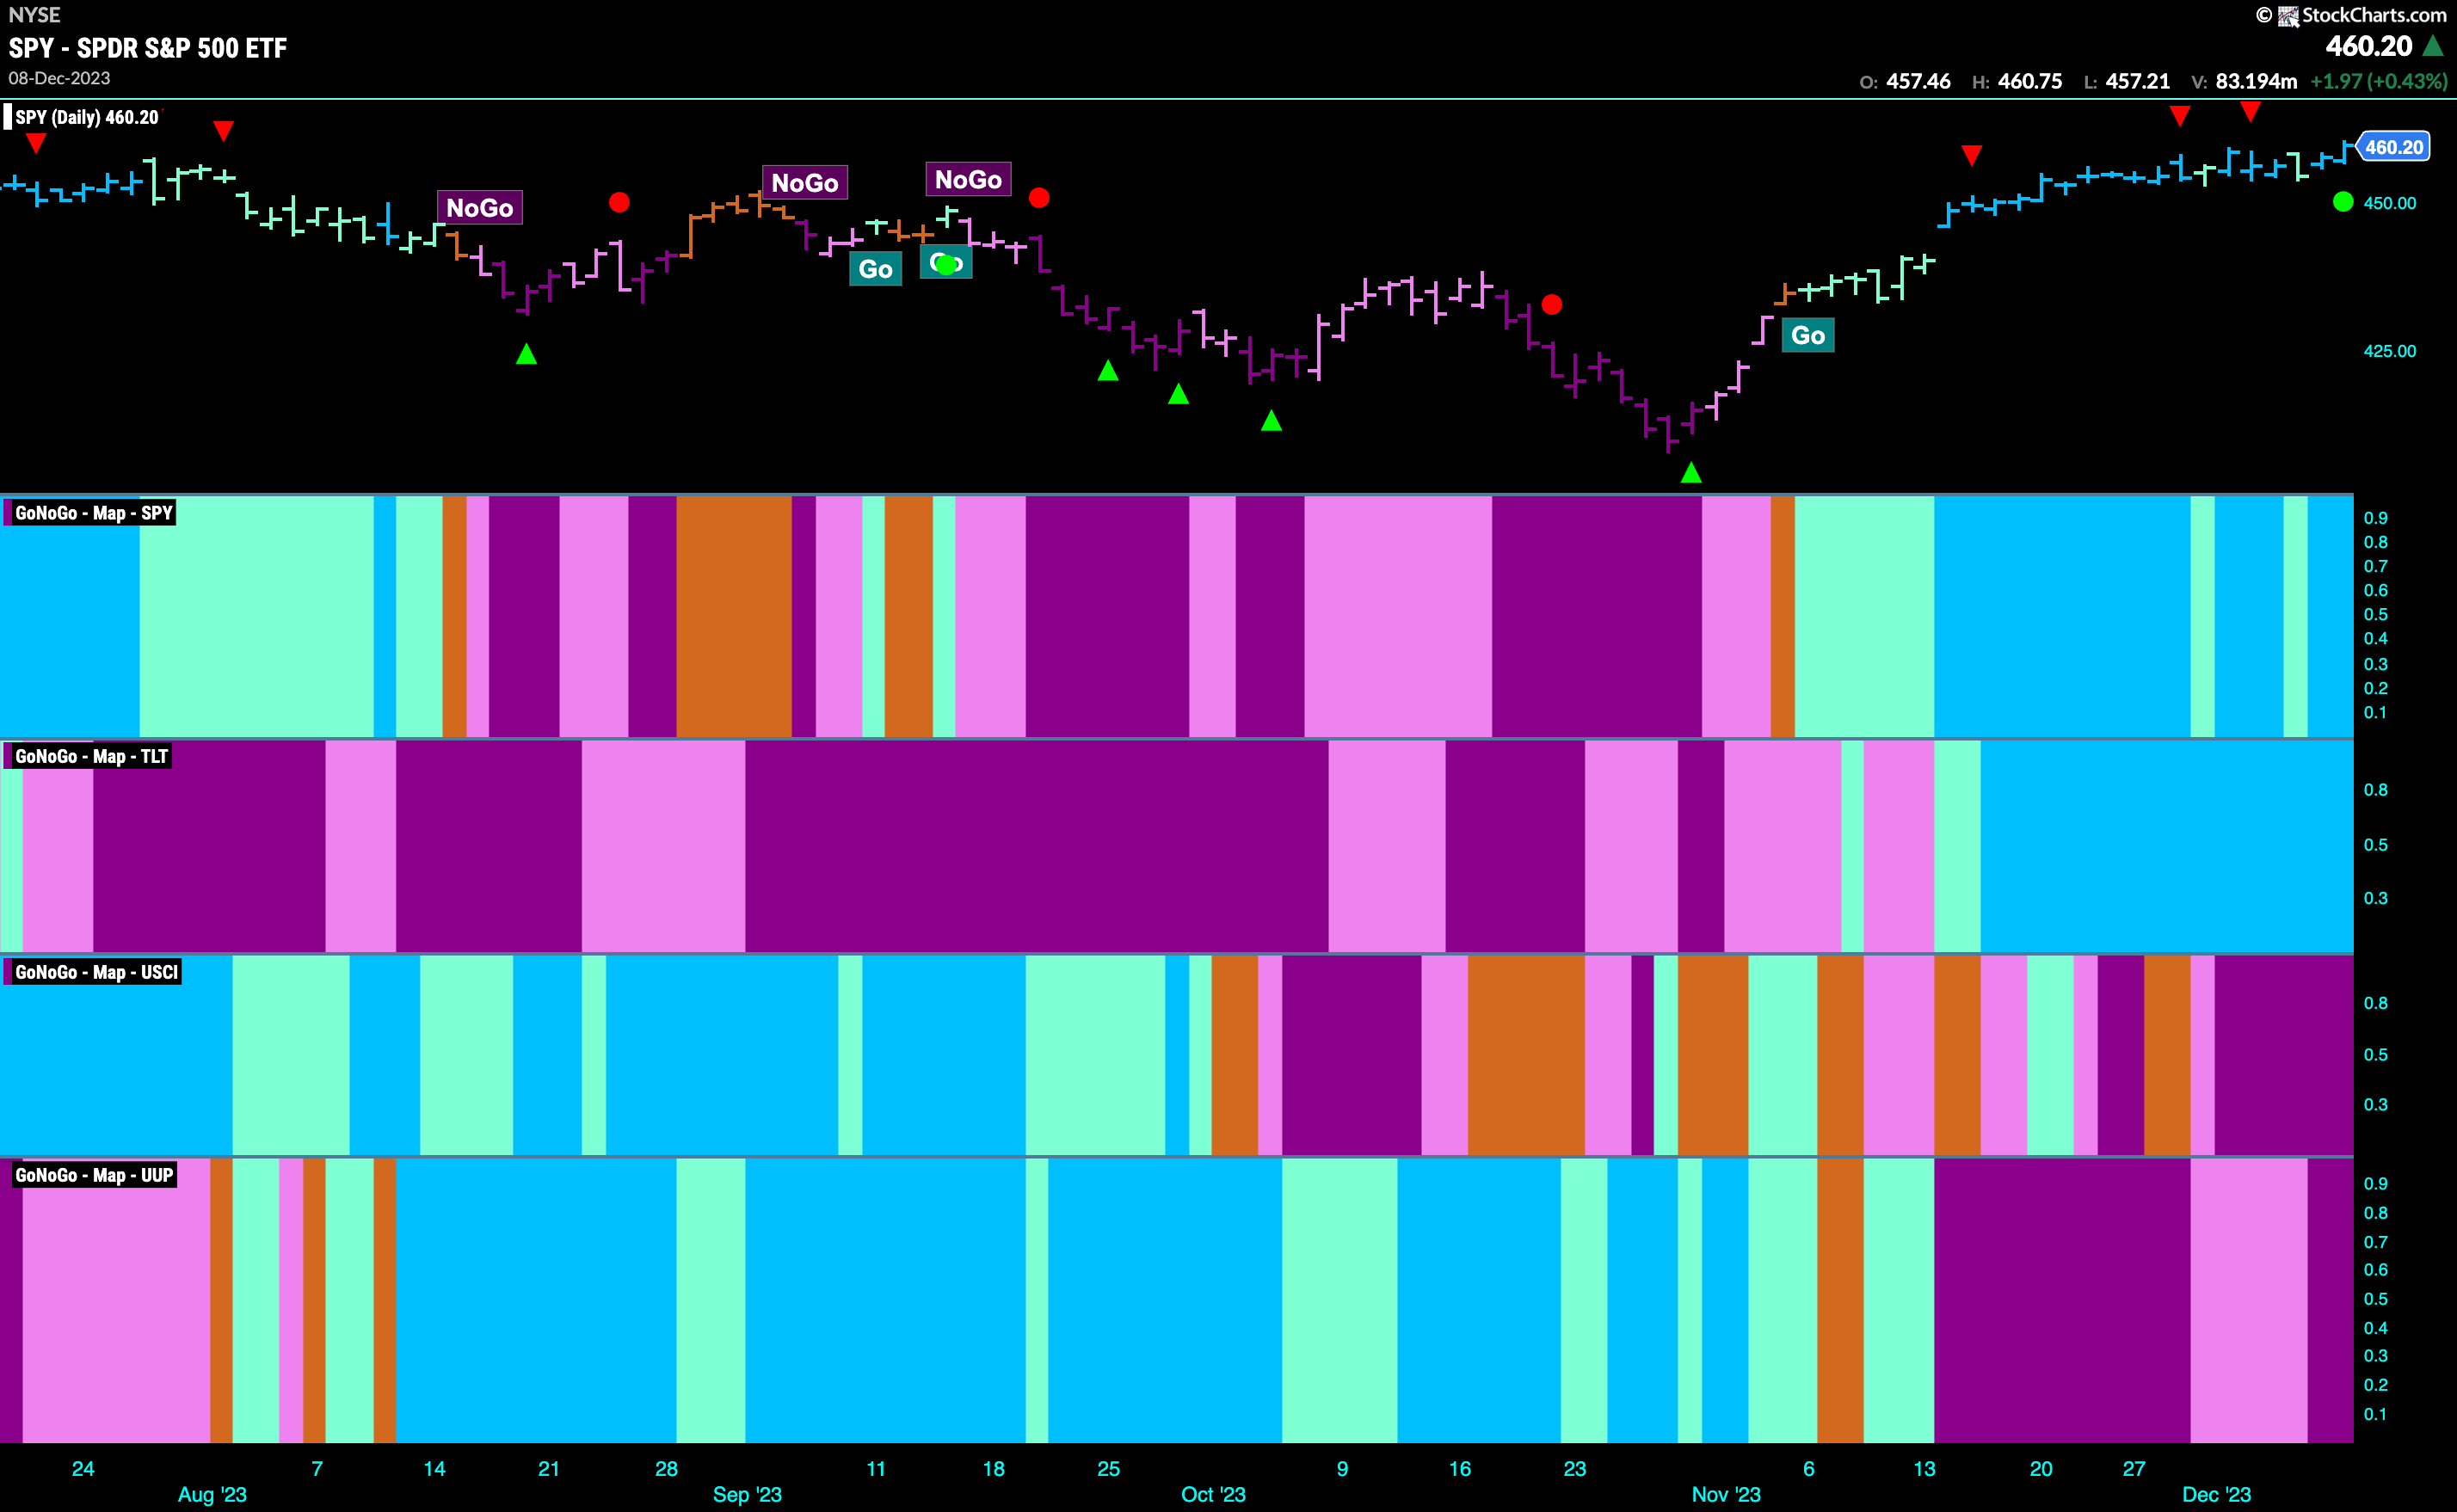
Good morning and welcome to this week’s Flight Path. Equity prices moved sideways for much of the week but found strong signs of Go Trend Continuation as the week ended with a green circle under price indicating that momentum had returned in the direction of the “Go” trend. Treasury bond prices continued to paint strong blue bars as commodities painted a full week of strong “NoGo” bars. The dollar saw its “NoGo” trend remain in place and GoNoGo Trend showed increased strength as it painted purple bars as the week came to a close.
Equity Prices Consolidate above Resistance
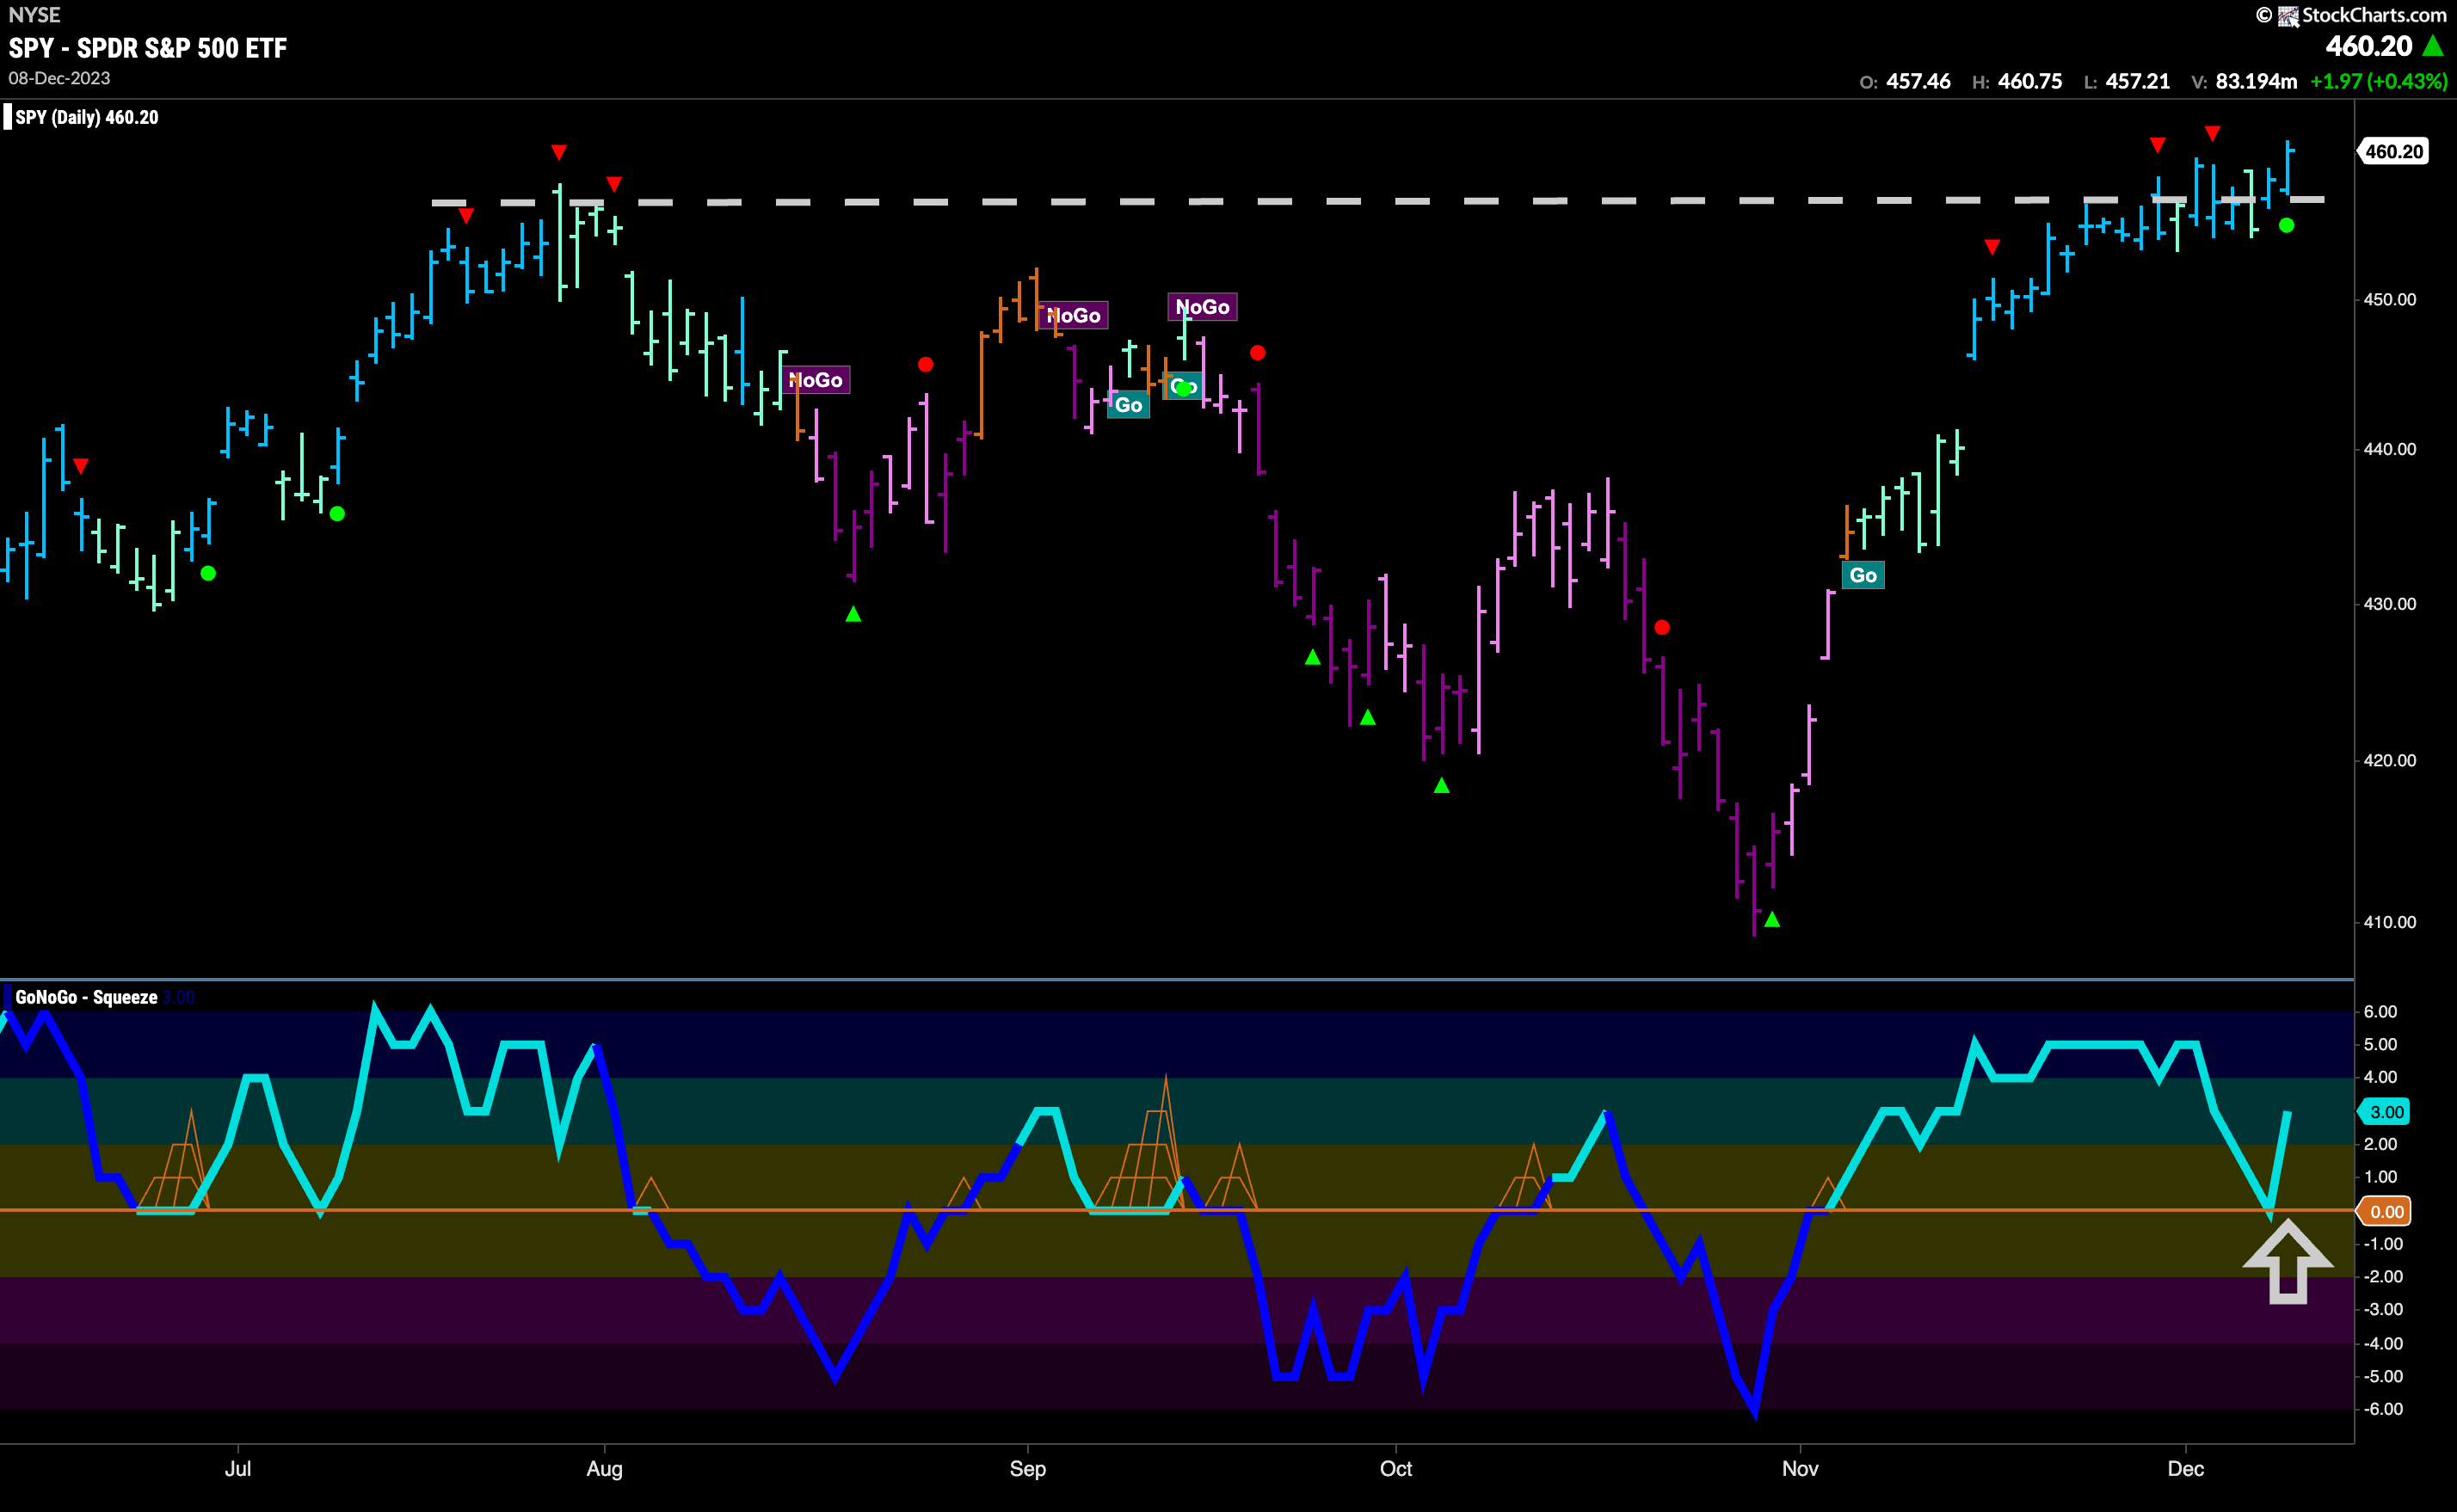
This week we saw equity prices move mostly sideways before ending the week on a high note just like the week before. Price closed at a new weekly high and GoNoGo Oscillator found support at the zero line causing a Go Trend Continuation Icon (green circle) to appear on the chart. We will look for price to move higher from here with momentum resurgent in the underlying trend direction.
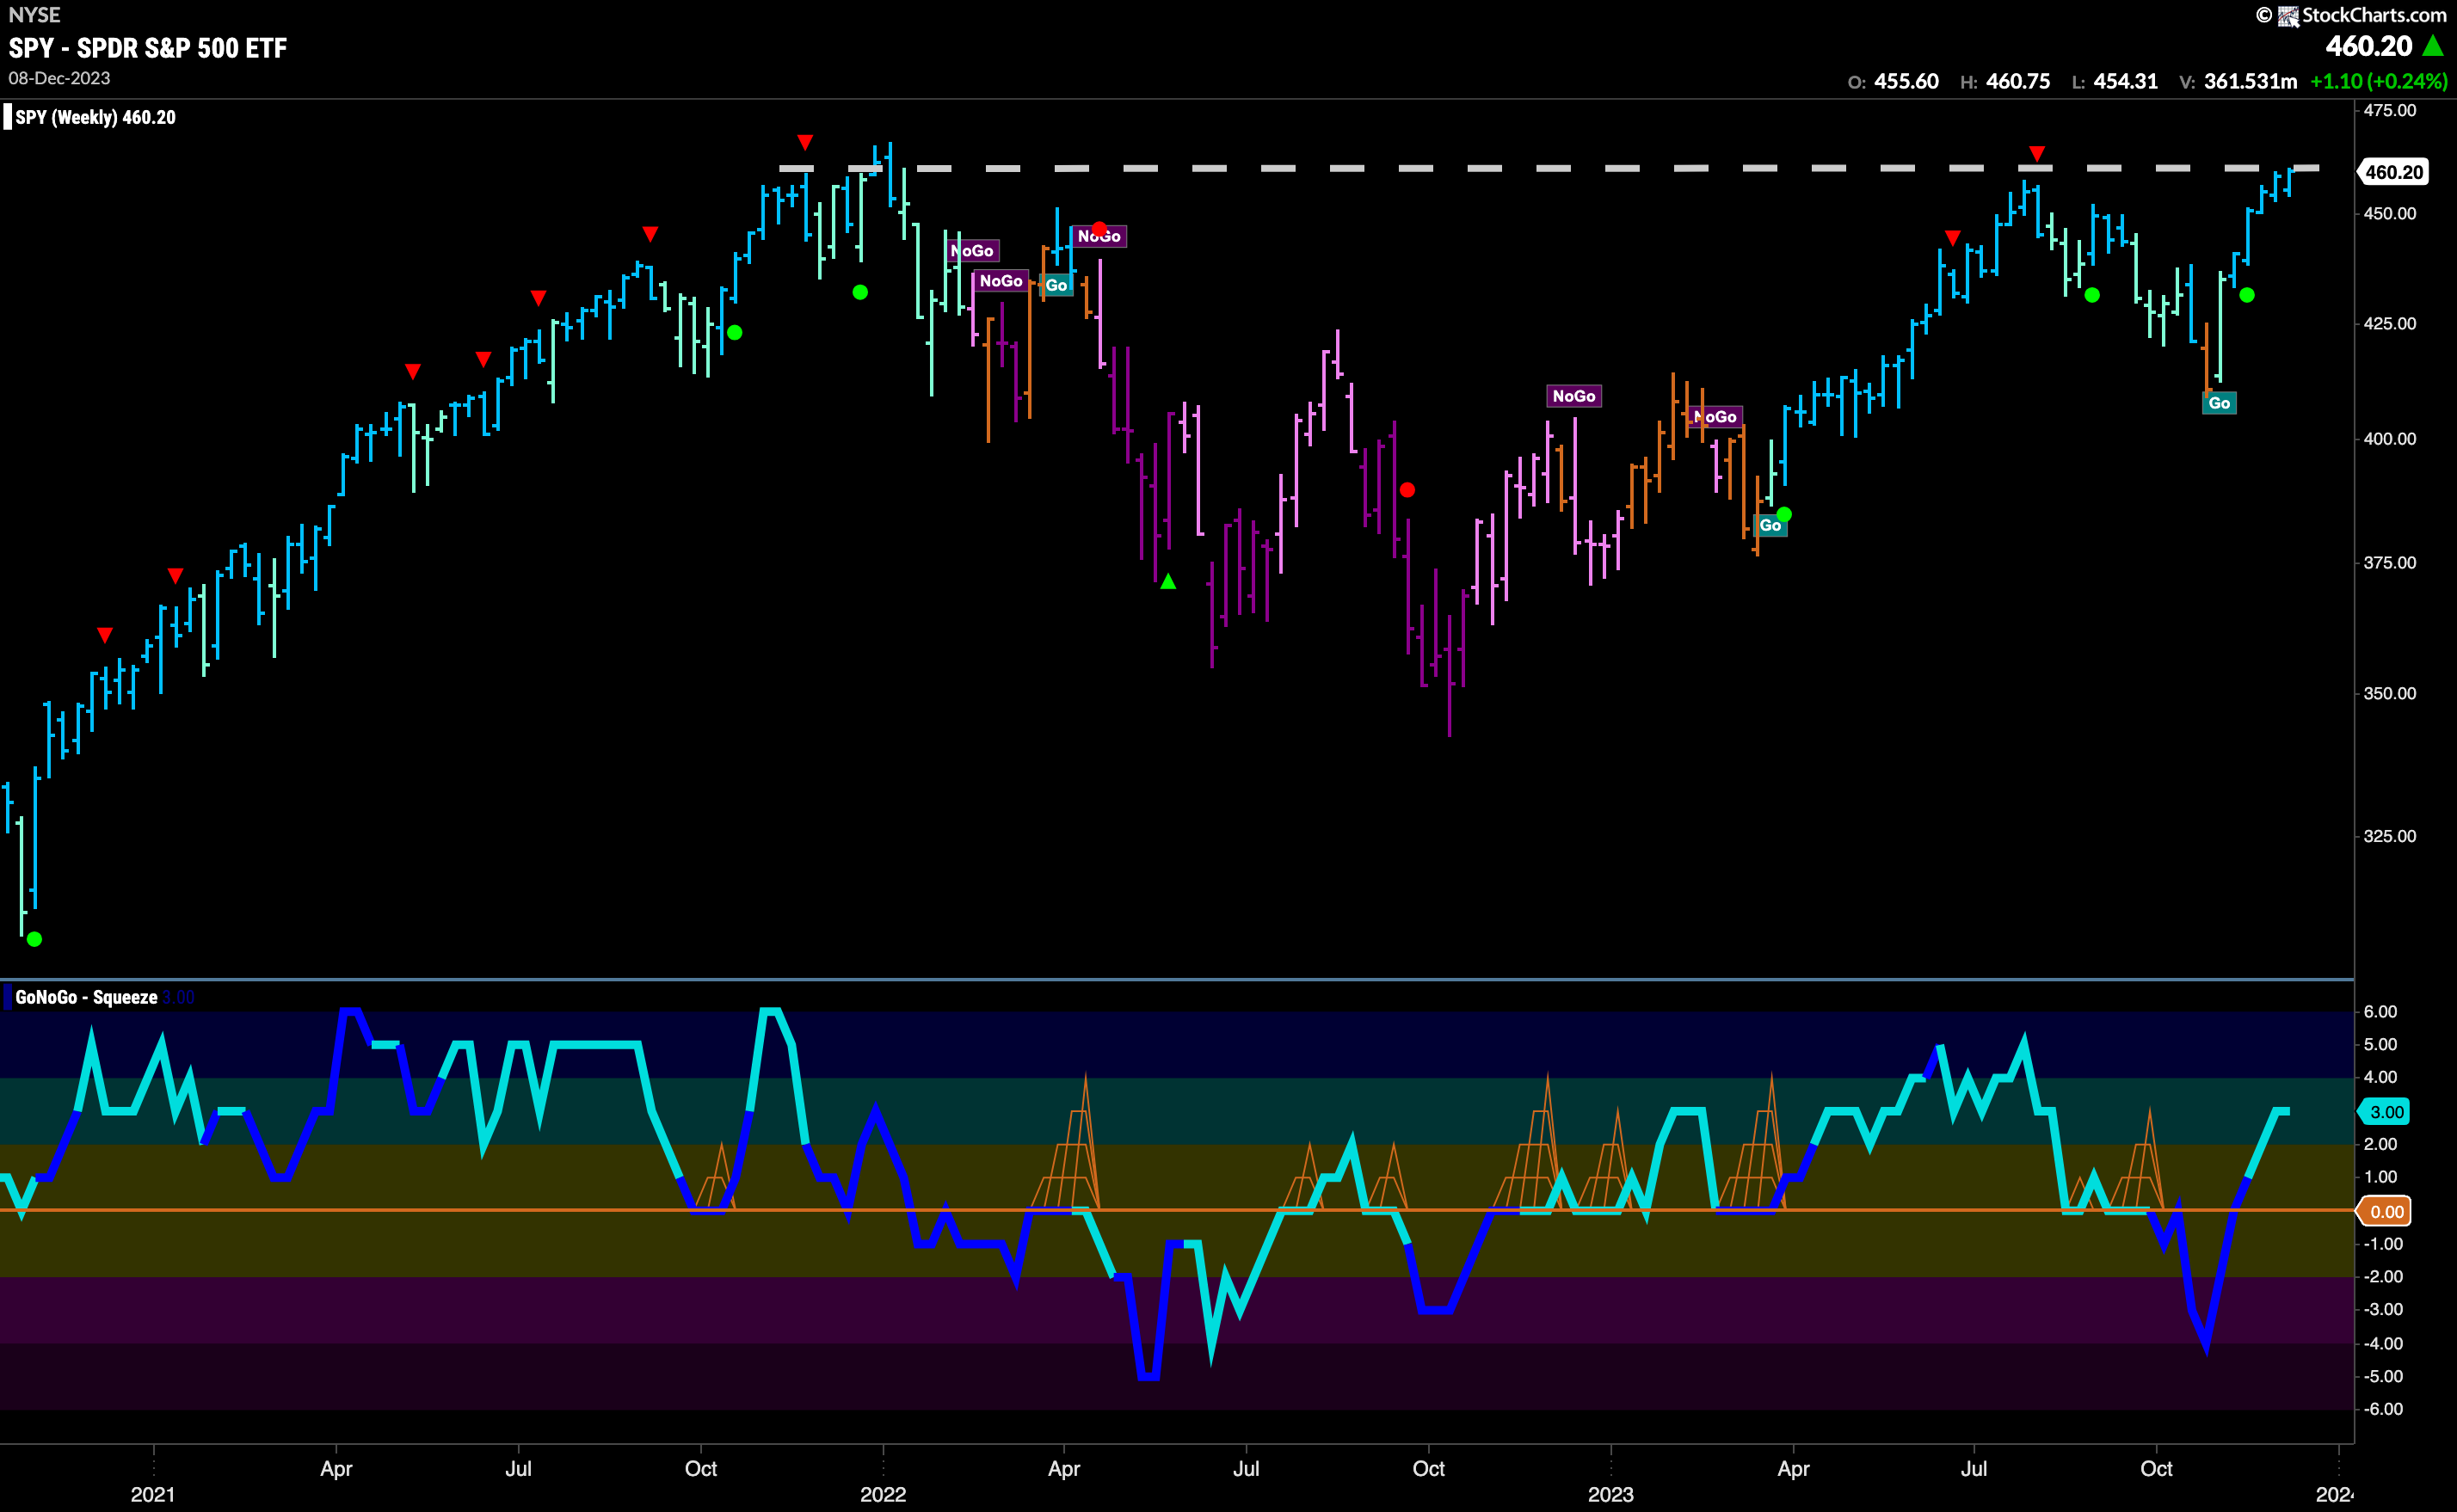
The weekly chart provides some context in terms of how much work will need still to be done for price to break above all time highs. Resistance looms on the chart from the end of 2021. However, we have now seen consecutive weekly closes push ever closer and we have GoNoGo Oscillator in positive territory but not oversold, telling us that there is healthy momentum in the direction of this “Go” trend. Very important moment as we watch to see if prices can continue higher from here.
Treasury Remain in “NoGo” Trend
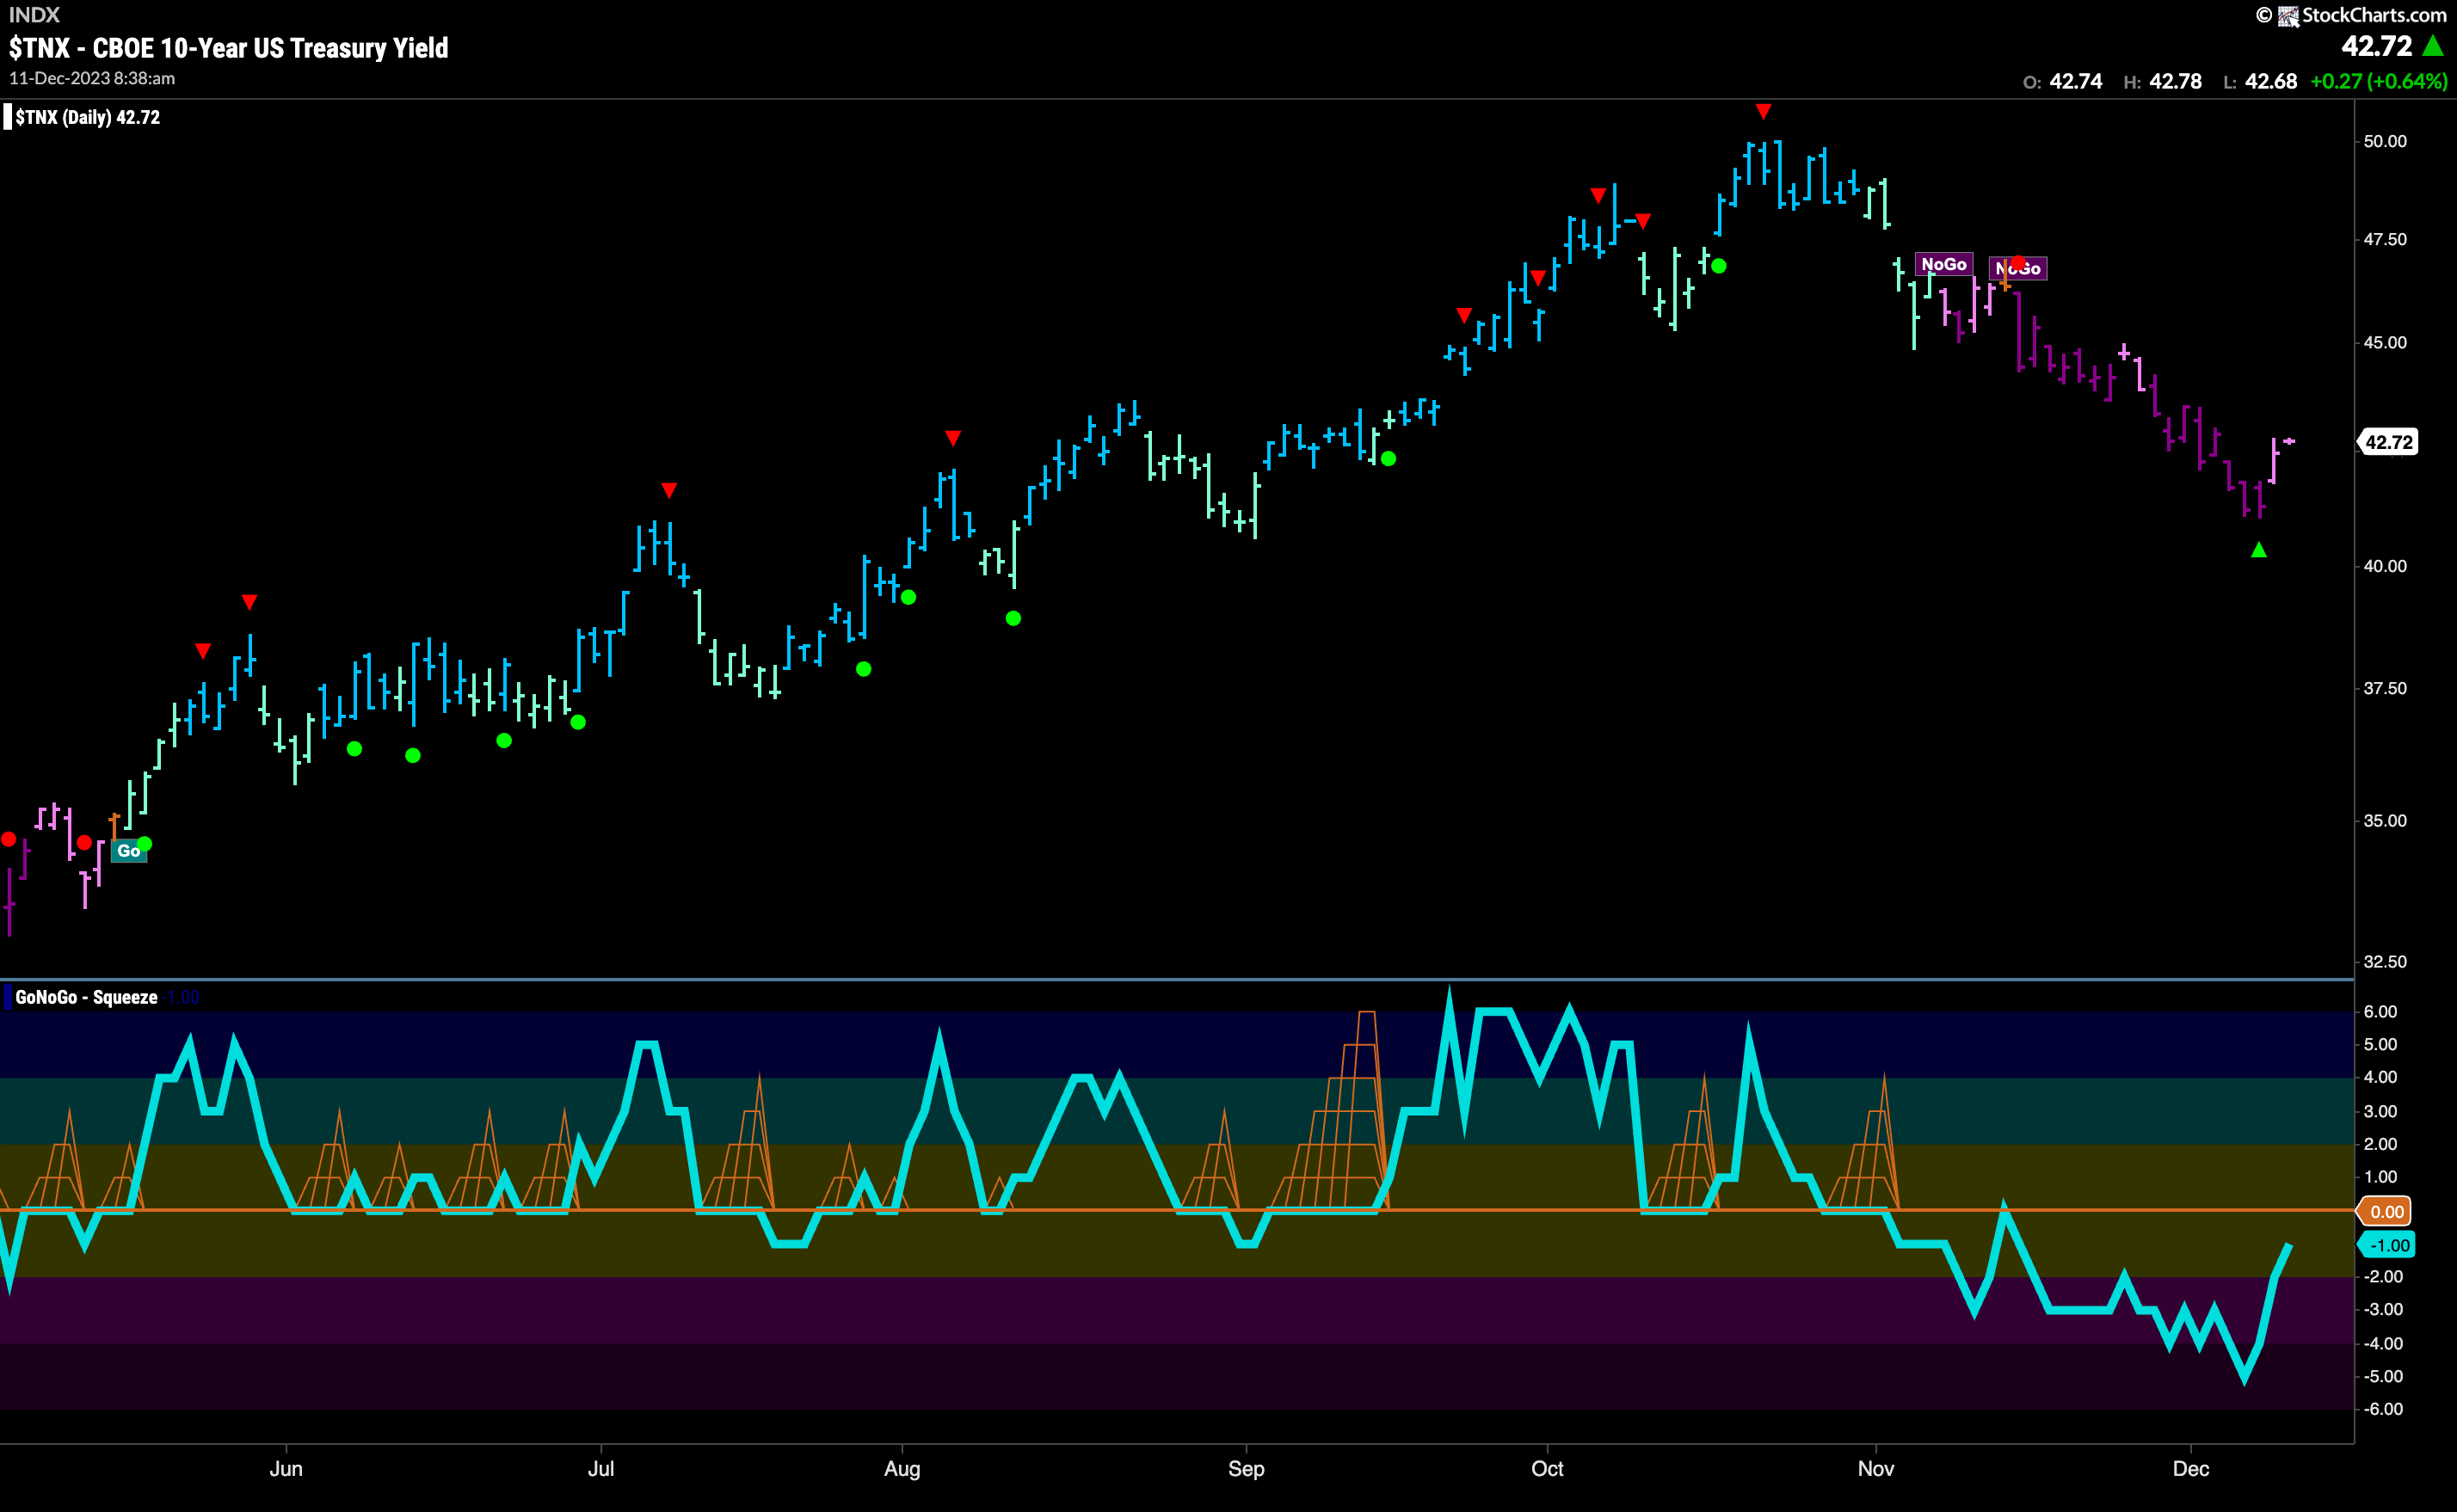
The “NoGo” trend continues in rates and we saw a new lower low this week as price fell on strong purple “NoGo” bars. The end of the week saw prices rally from those lows and indeed, we saw a NoGo Countertrend Correction Icon (green arrow) indicating that price may struggle to go lower in the short term. GoNoGo Oscillator is rising toward the zero line and so we will watch to see if it finds resistance at that level. If it does, we could see price roll over and fall further.
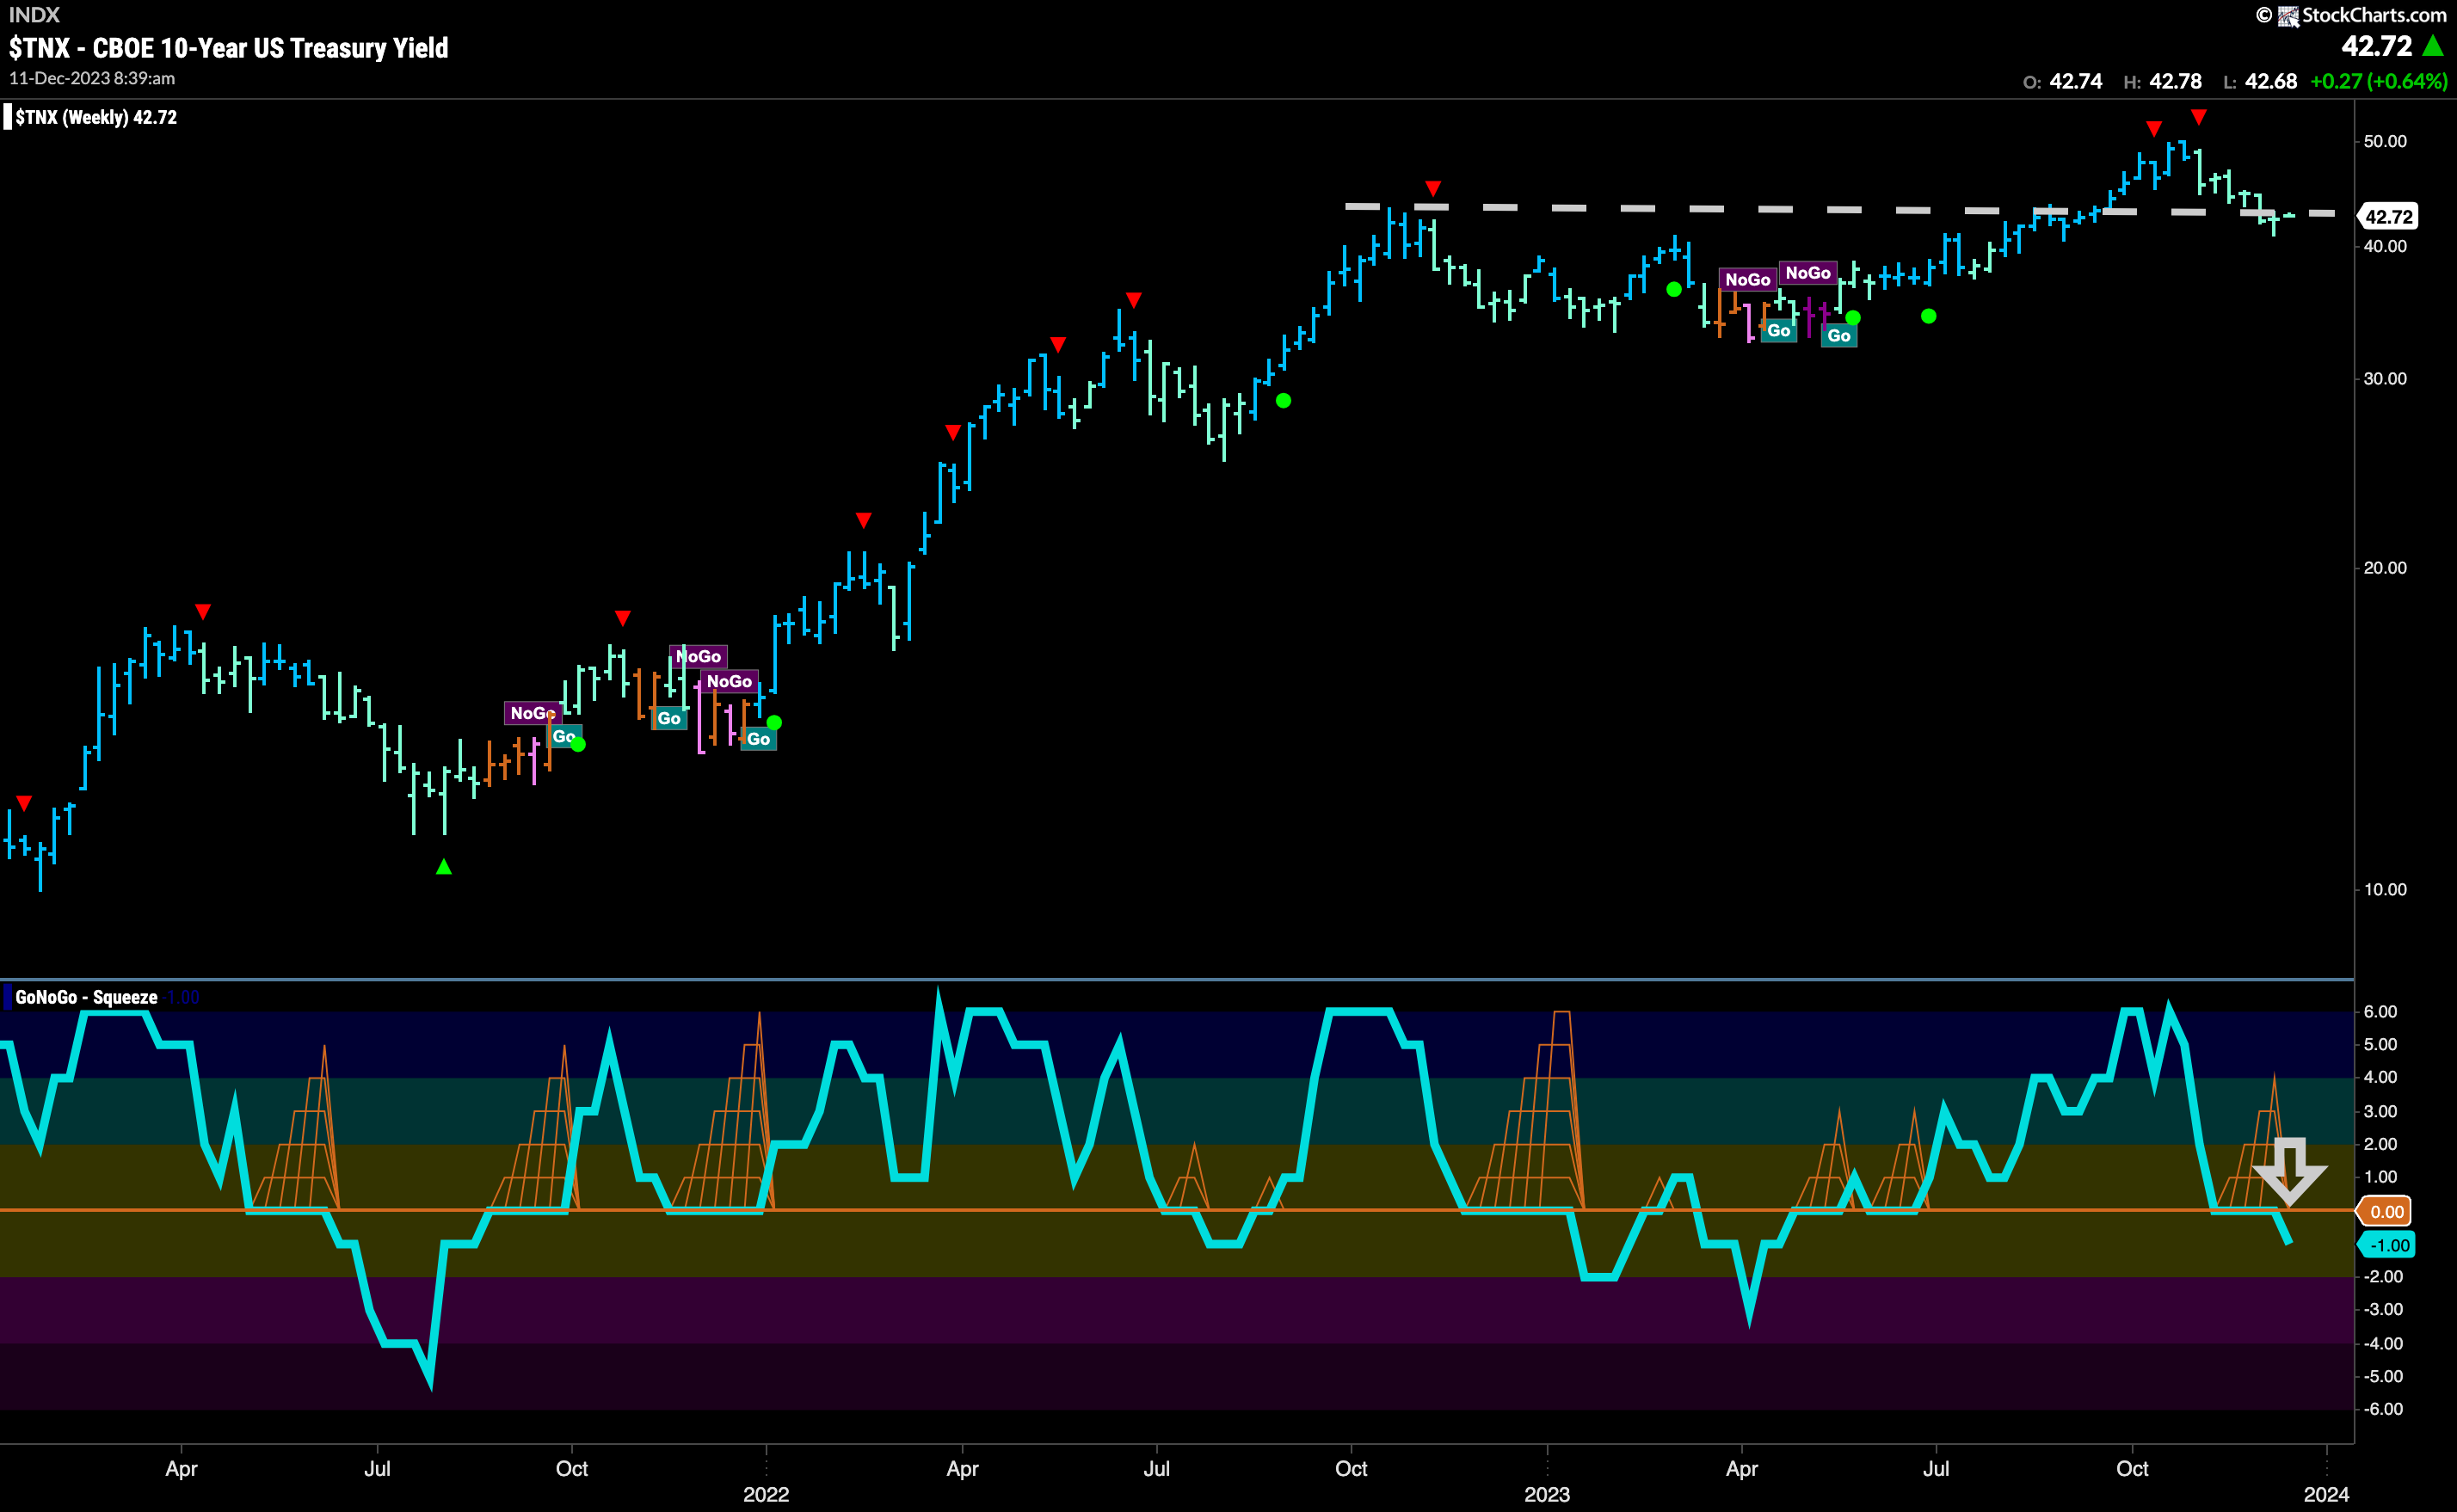
The larger timeframe chart shows where the potential support is coming from. We can see that as we threatened to go lower this week we ran into prior high support from late last year. Right at that level now, we will watch to see if the “Go” trend can hold. In the lower panel, we see that GoNoGo Oscillator has fallen below the zero line which should not happen in a healthy “Go” trend. With momentum now out of line with the trend, we will watch to see if price moves below horizontal support.
Dollar stays in “NoGo”
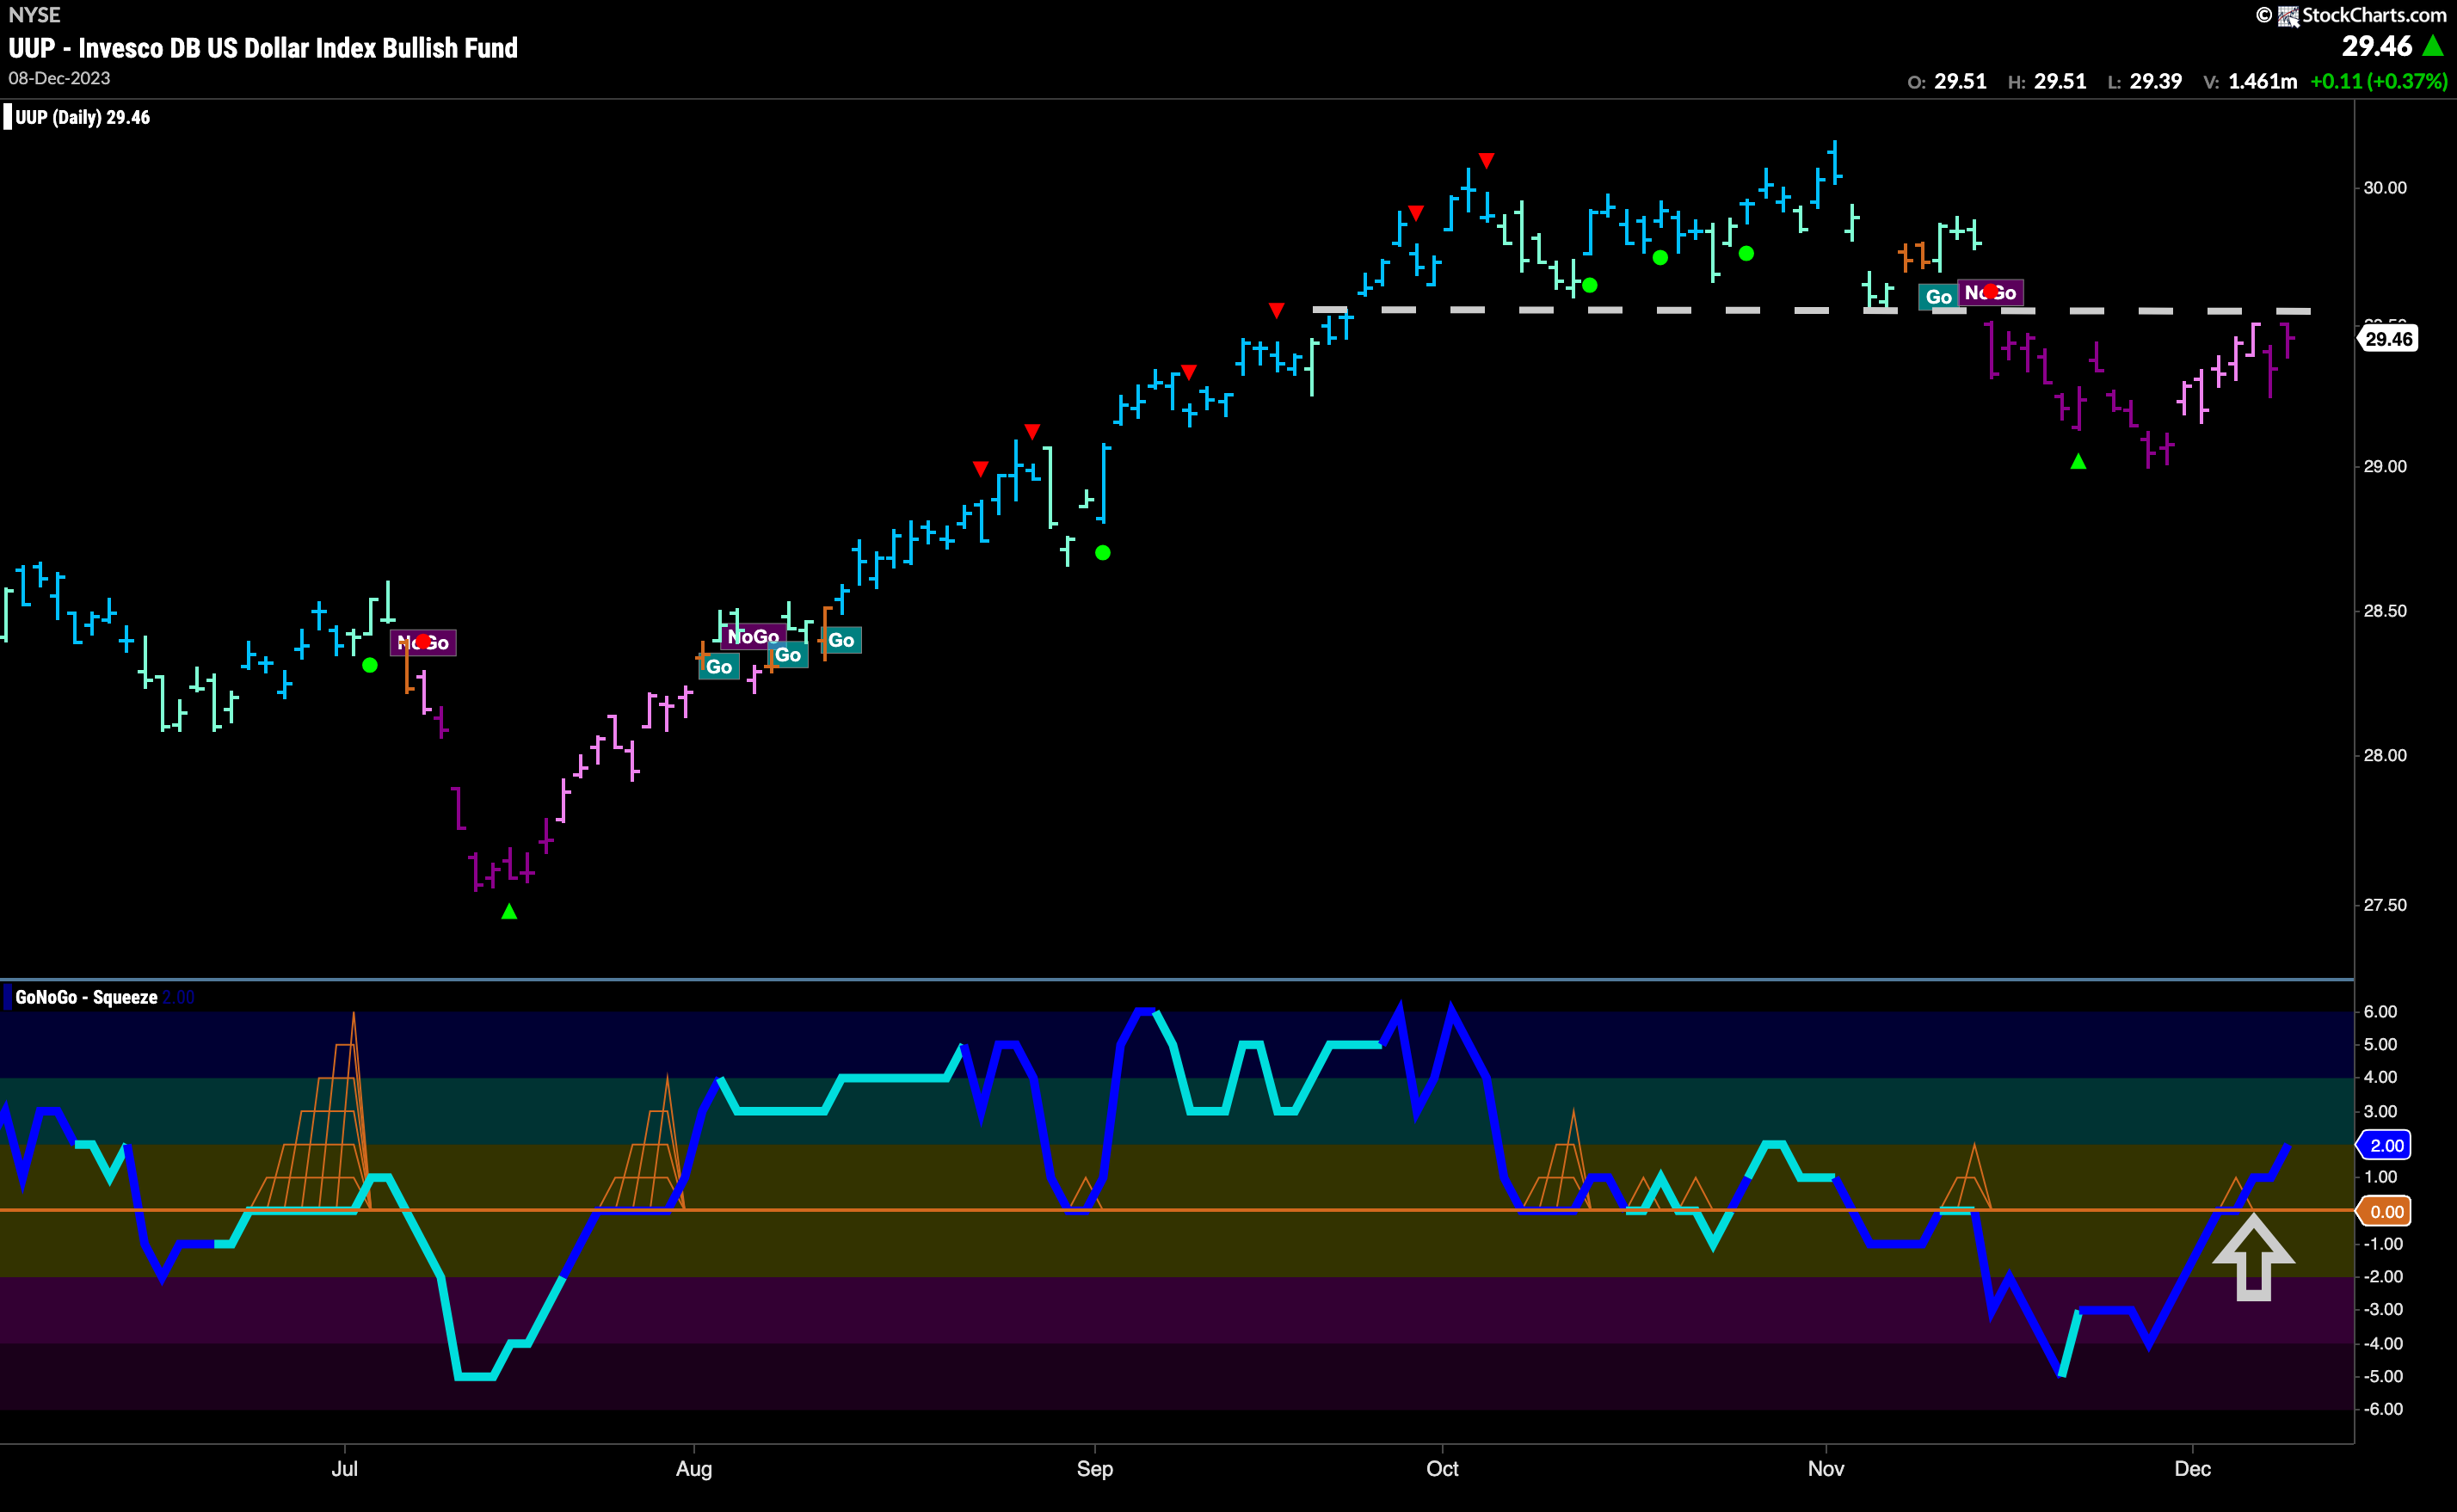
We see clear resistance on the chart of the U.S. dollar. As price rallied for much of the last two weeks, it finally ran into resistance from prior support levels. This level will likely be hard to break through, and GoNoGo Trend returned to paint stronger purple “NoGo” bars as the week ended. Looking at the lower panel tells us a slightly different story. We can see that the oscillator has broken above zero on heavy volume (dark blue oscillator) and that tells us that for the moment, momentum has fallen out of line with the “NoGo” trend. We will watch to see if this positive momentum is enough to push price above horizontal resistance and potential to a new trend.
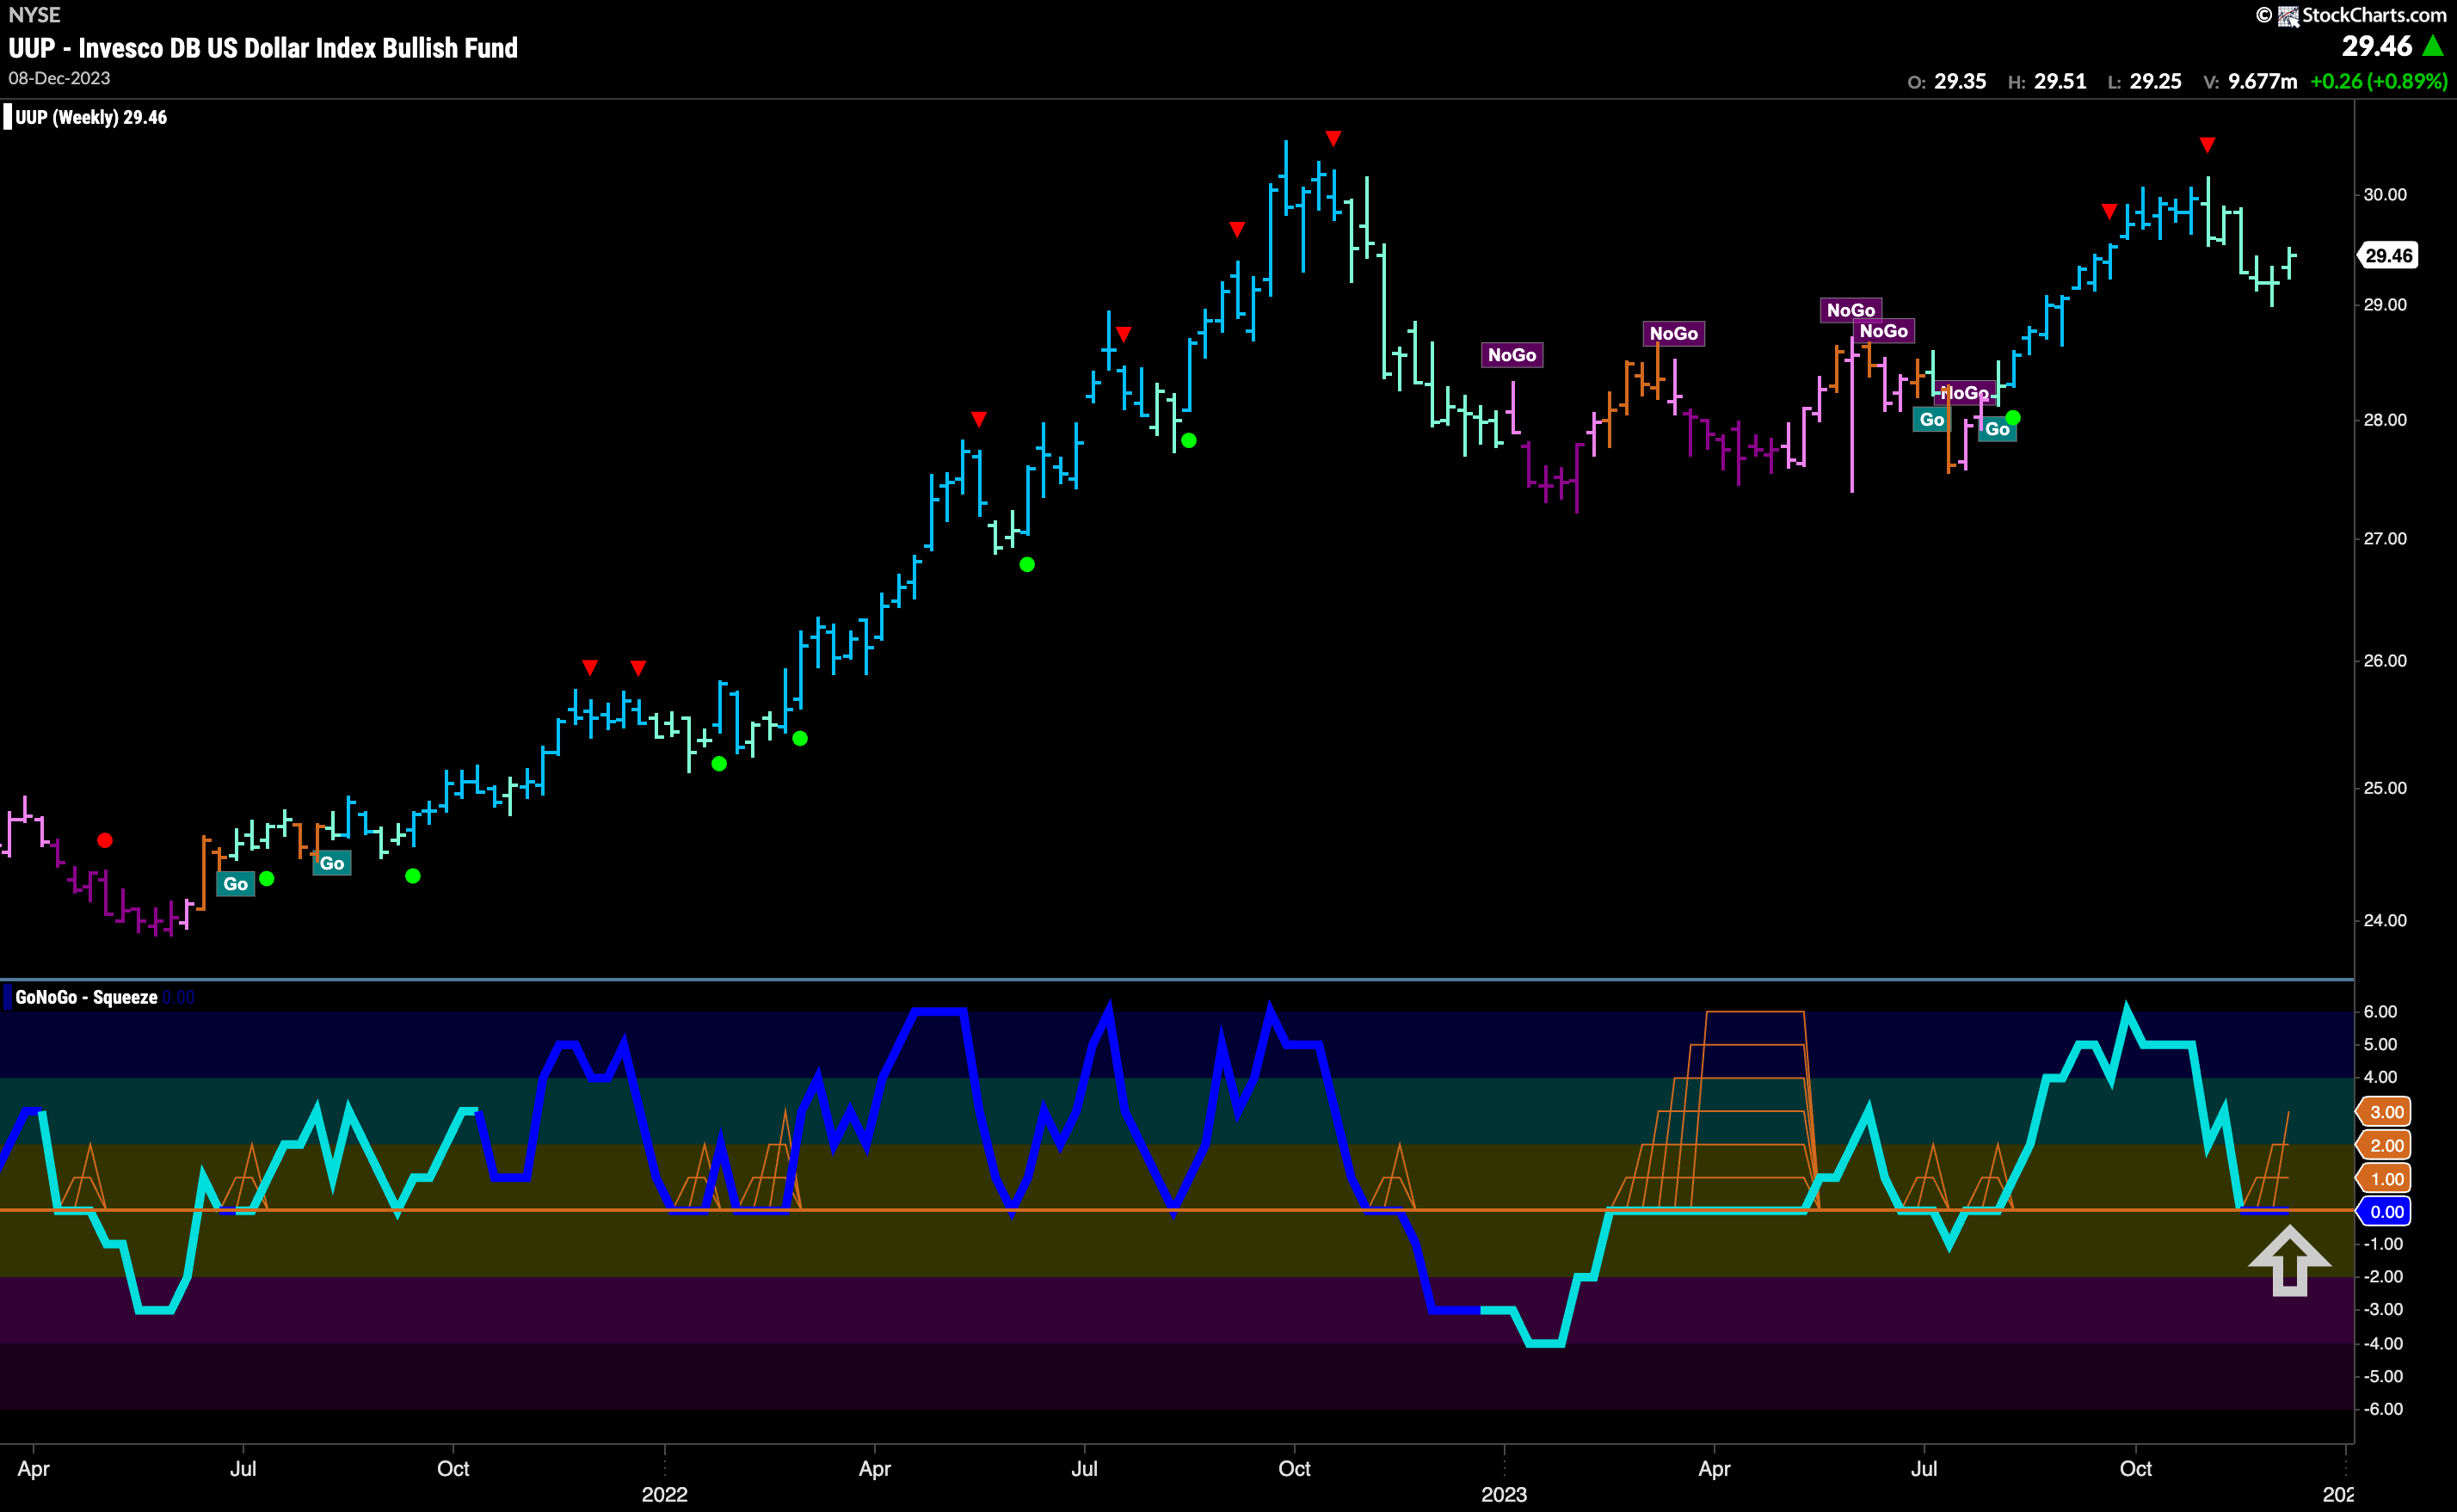
The weekly chart shows that the “Go” trend continues to be tested. Another weaker aqua “Go” bar tells us that the “Go” trend isn’t strong. Price has pulled back from the Go Countertrend Correction Icon (red arrow) that came as price tested last year’s highs. Now, GoNoGo Oscillator remains at zero for a third week and we see the beginning of a GoNoGo Squeeze as the amber grid starts to build. The oscillator will need to find support here if the “Go” trend is to remain healthy.
Oil Makes Another Lower Low
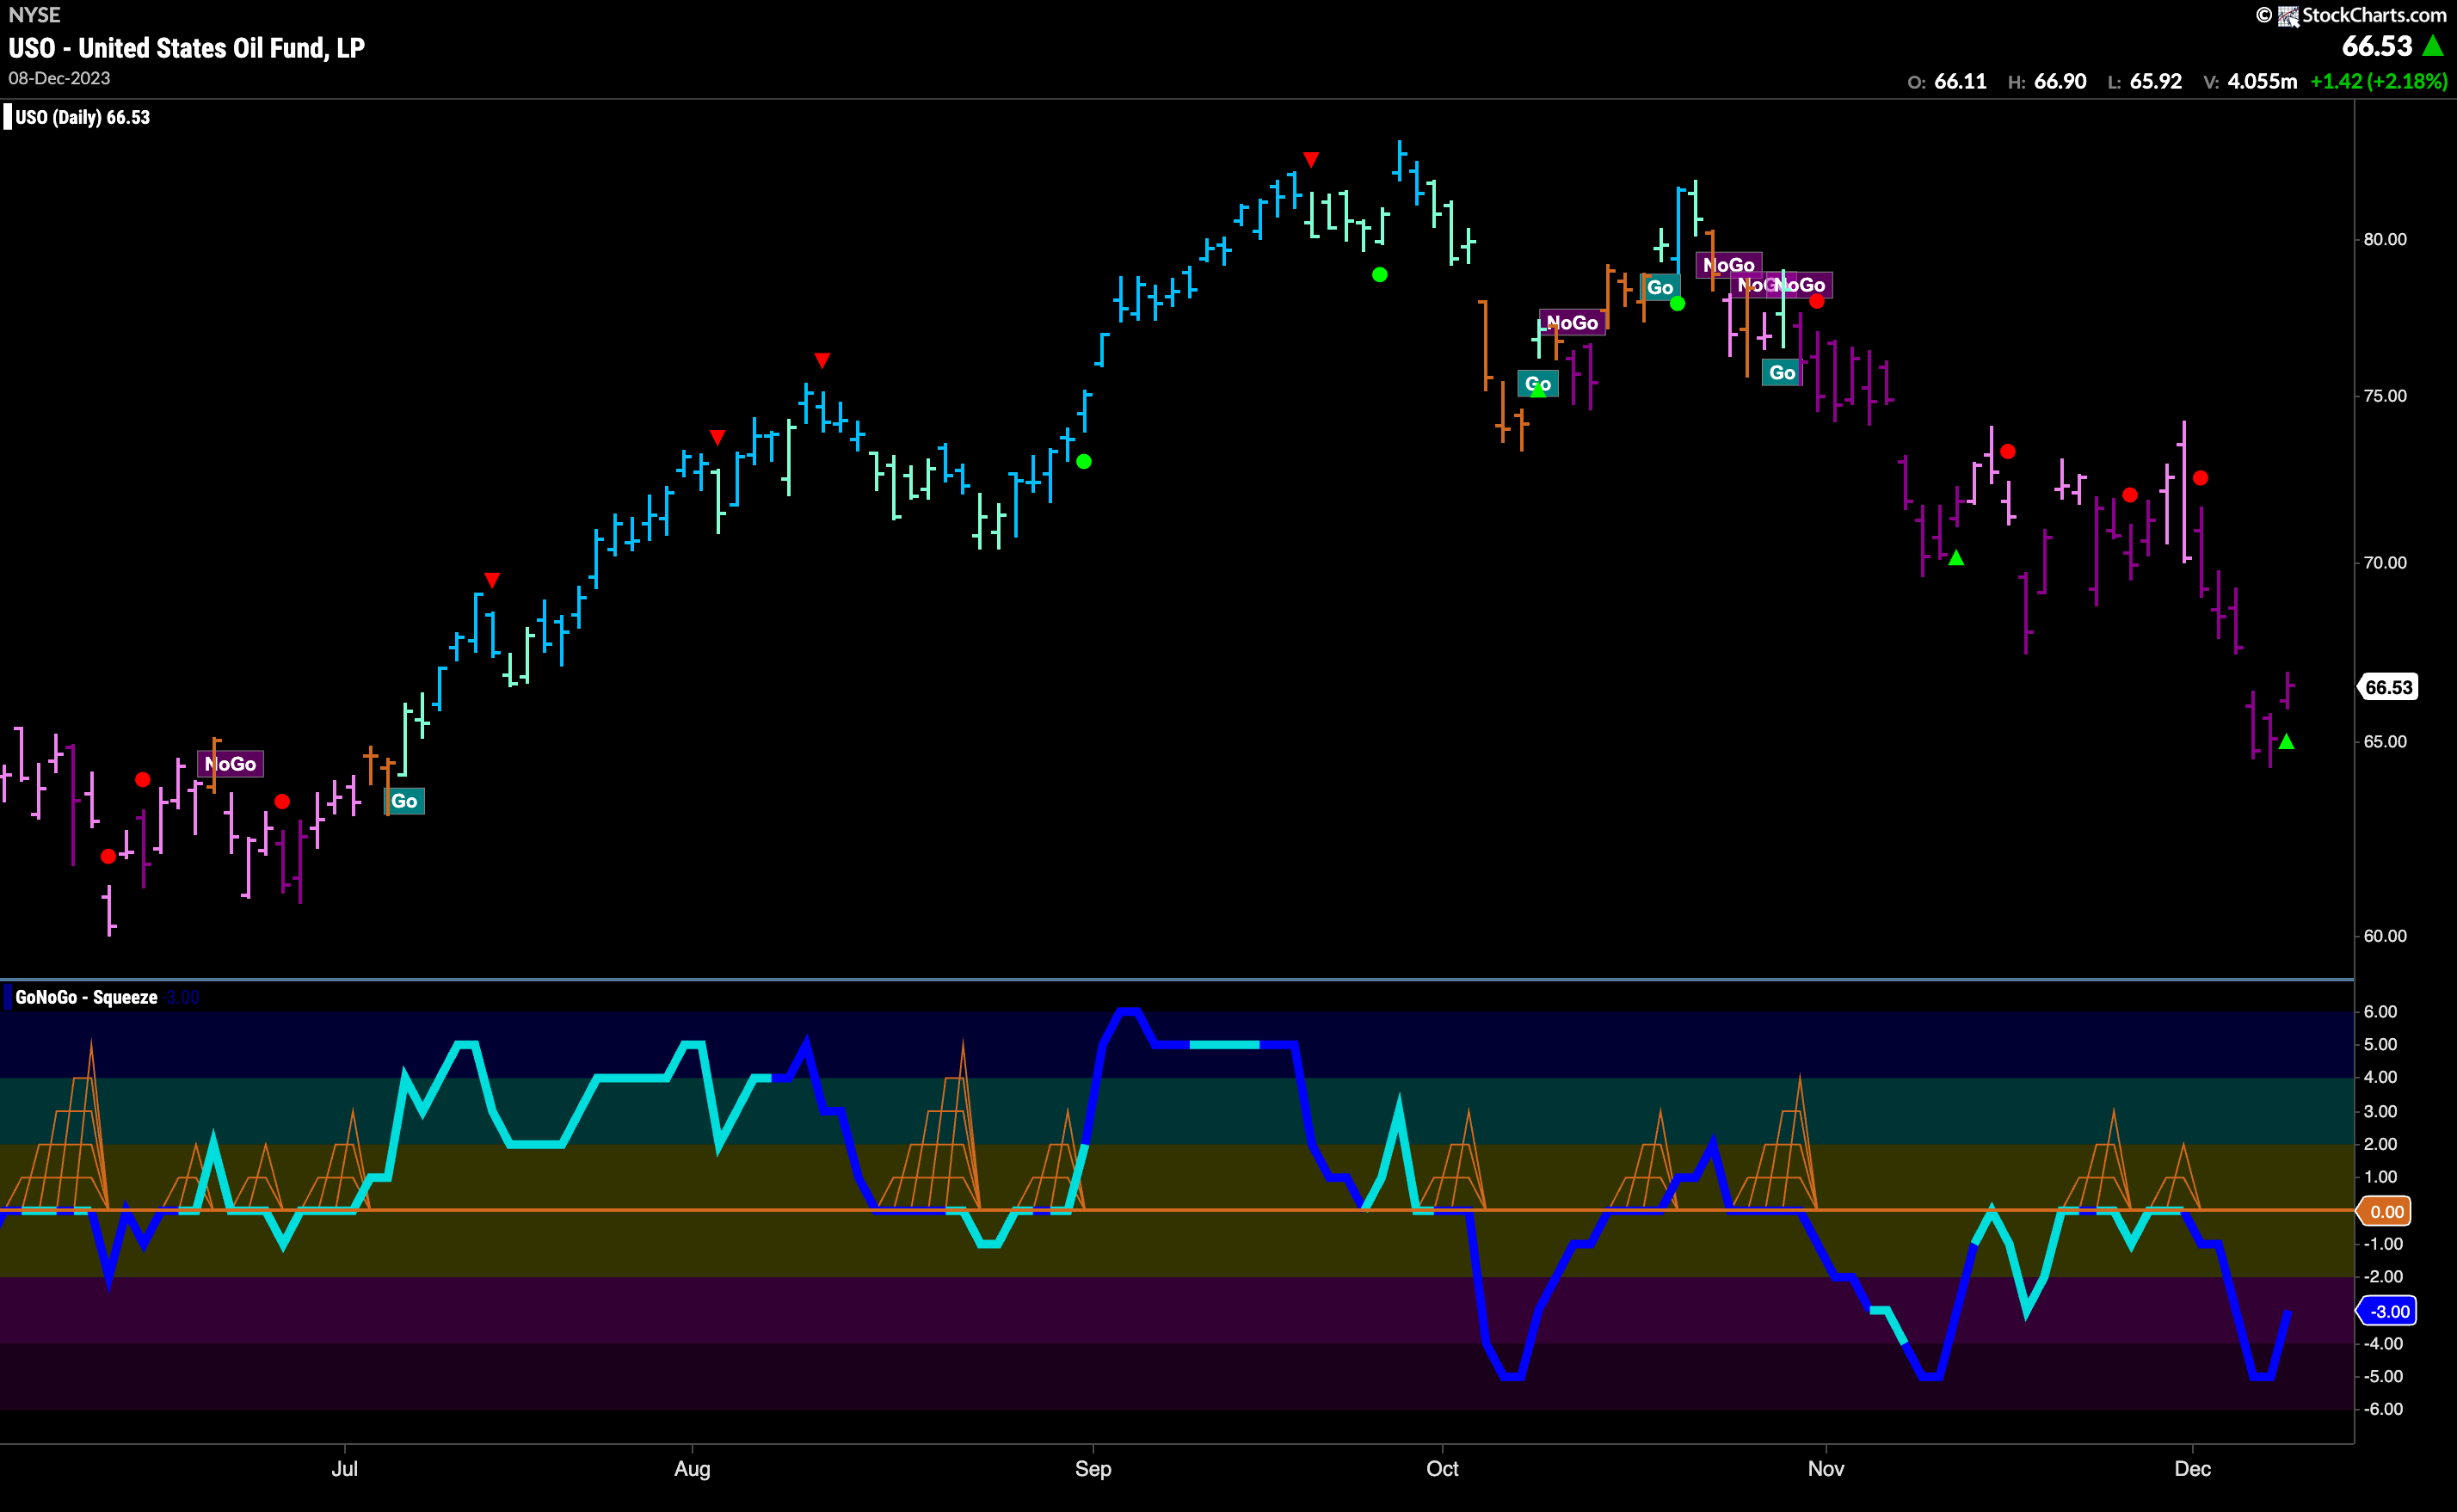
A string of uninterrupted strong purple “NoGo” bars saw price hit a new low this week. GoNoGo Oscillator fell deep into negative territory on heavy volume as momentum confirmed the movements in price. Now, the oscillator has moved out of oversold levels and so we see a NoGo Countertrend Correction Icon (green arrow) under the price bar indicating that in the short term price may stall and not move lower. That being said, the weight of the evidence tells us clearly that the trend is a strong “NoGo” with momentum in negative territory but no longer oversold.
Gold Pulls Back in “Go” Trend
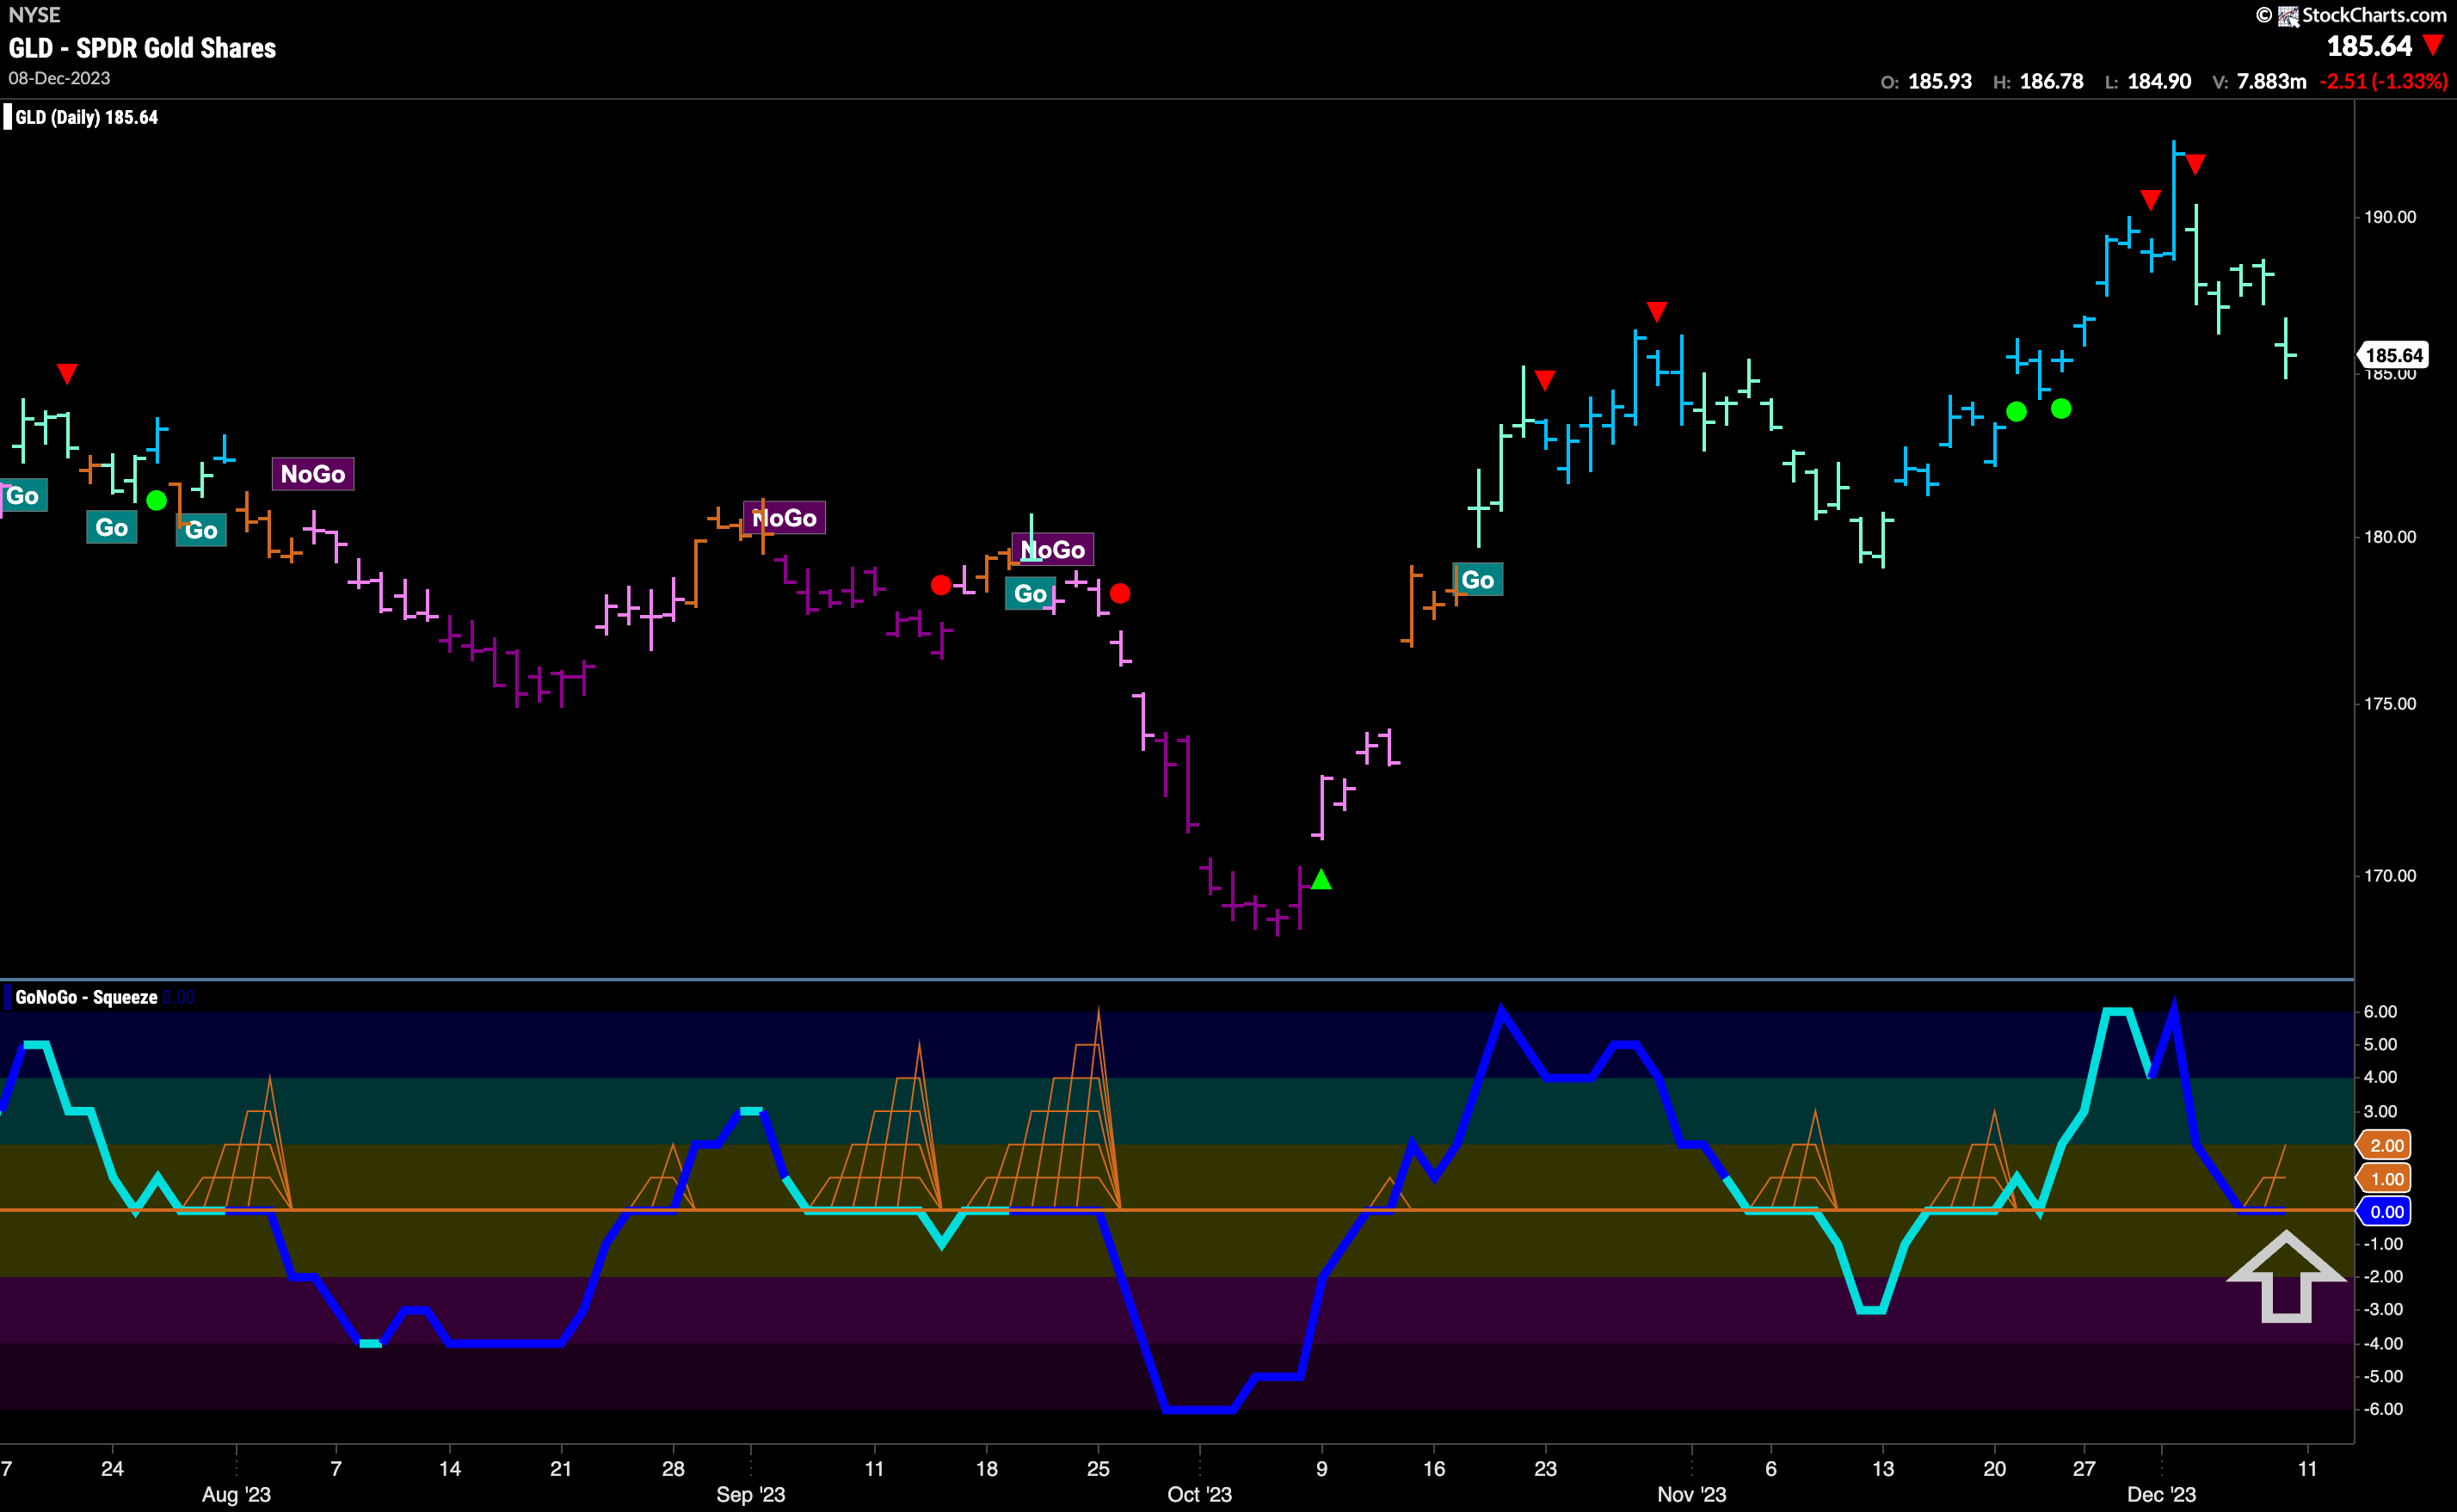
GoNoGo Trend painted weaker aqua bars all of this past week. After the Go Countertrend Correction Icons (red arrows) signaled a possible reprieve, price has fallen to test levels that coincide with the prior October highs. GoNoGo Oscillator has fallen sharply to test the zero line from above and volume is heavy. We will look to see if the oscillator finds support here and if it does that would be a sign of good things for the bulls.
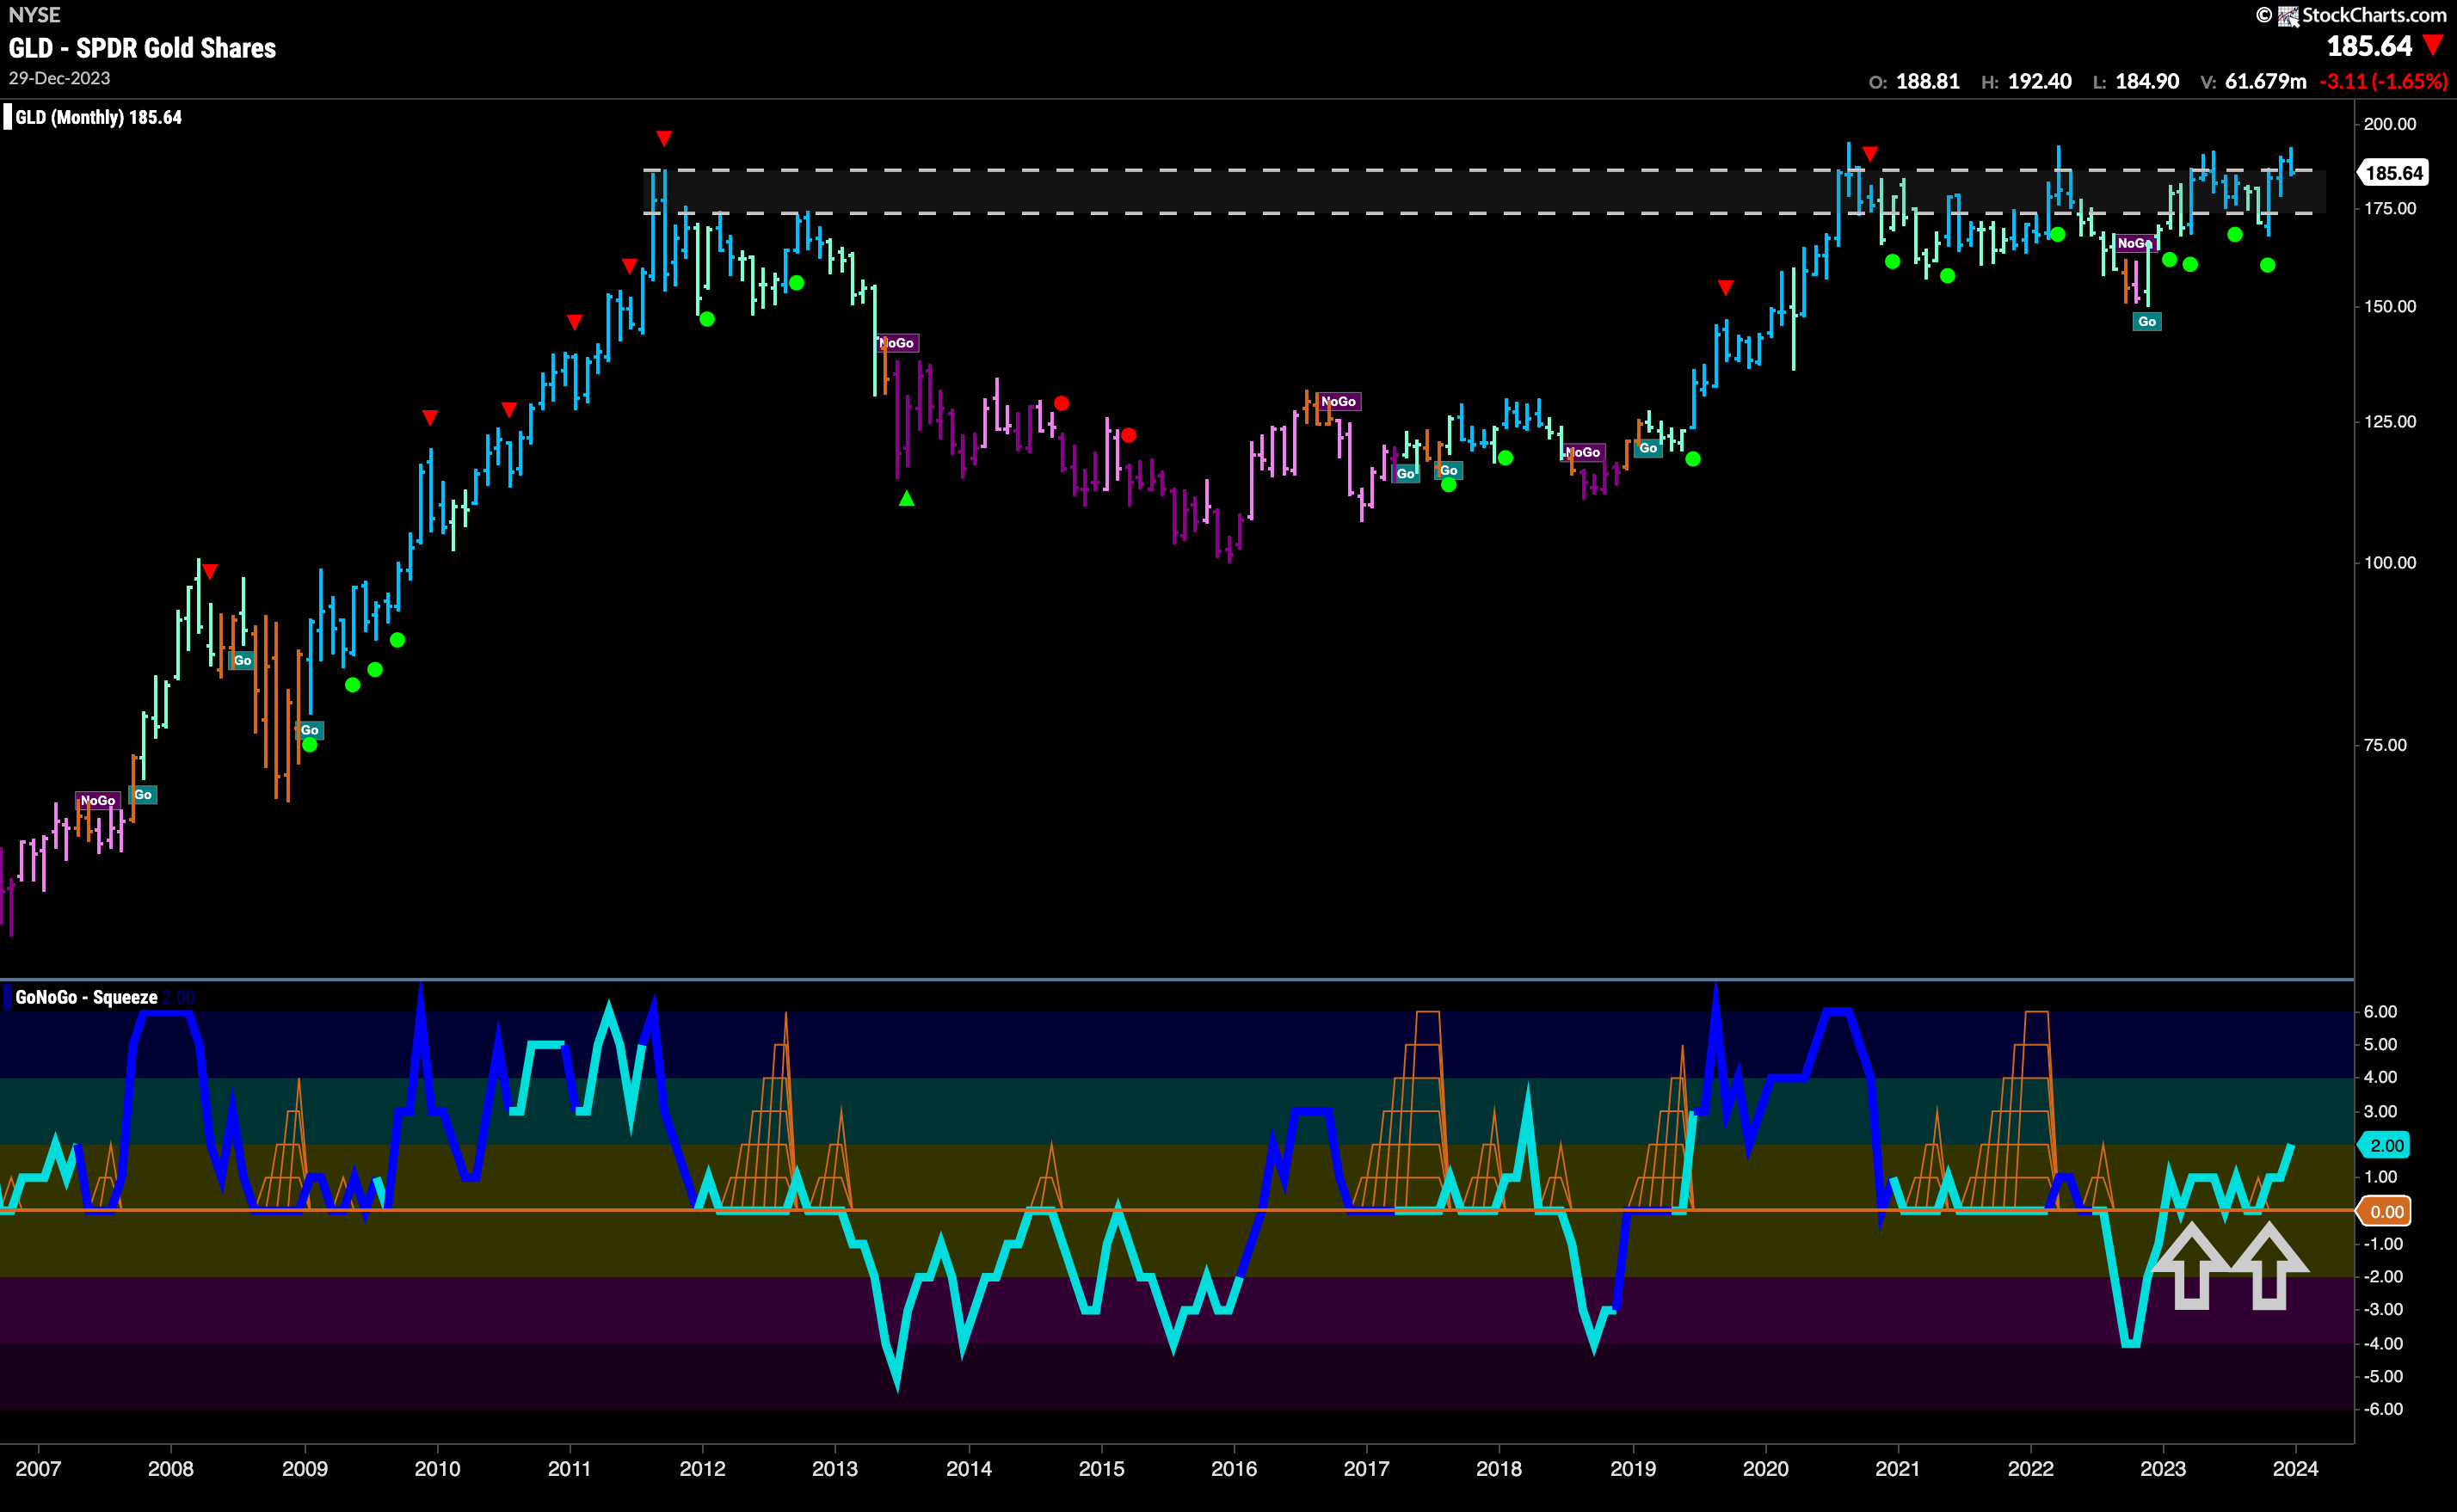
Zooming out to a monthly chart, we can see just how incredibly important these levels are for the precious metal. We are valiantly trying once again to consolidate at new highs which would complete a more than a decade long cup and handle pattern. With GoNoGo Oscillator repeatedly finding support at zero momentum is staying on the side of the “Go” trend as it tries to forge higher. With no resistance overhead, this could be the move the gold bugs have been waiting for.
Sector RelMap
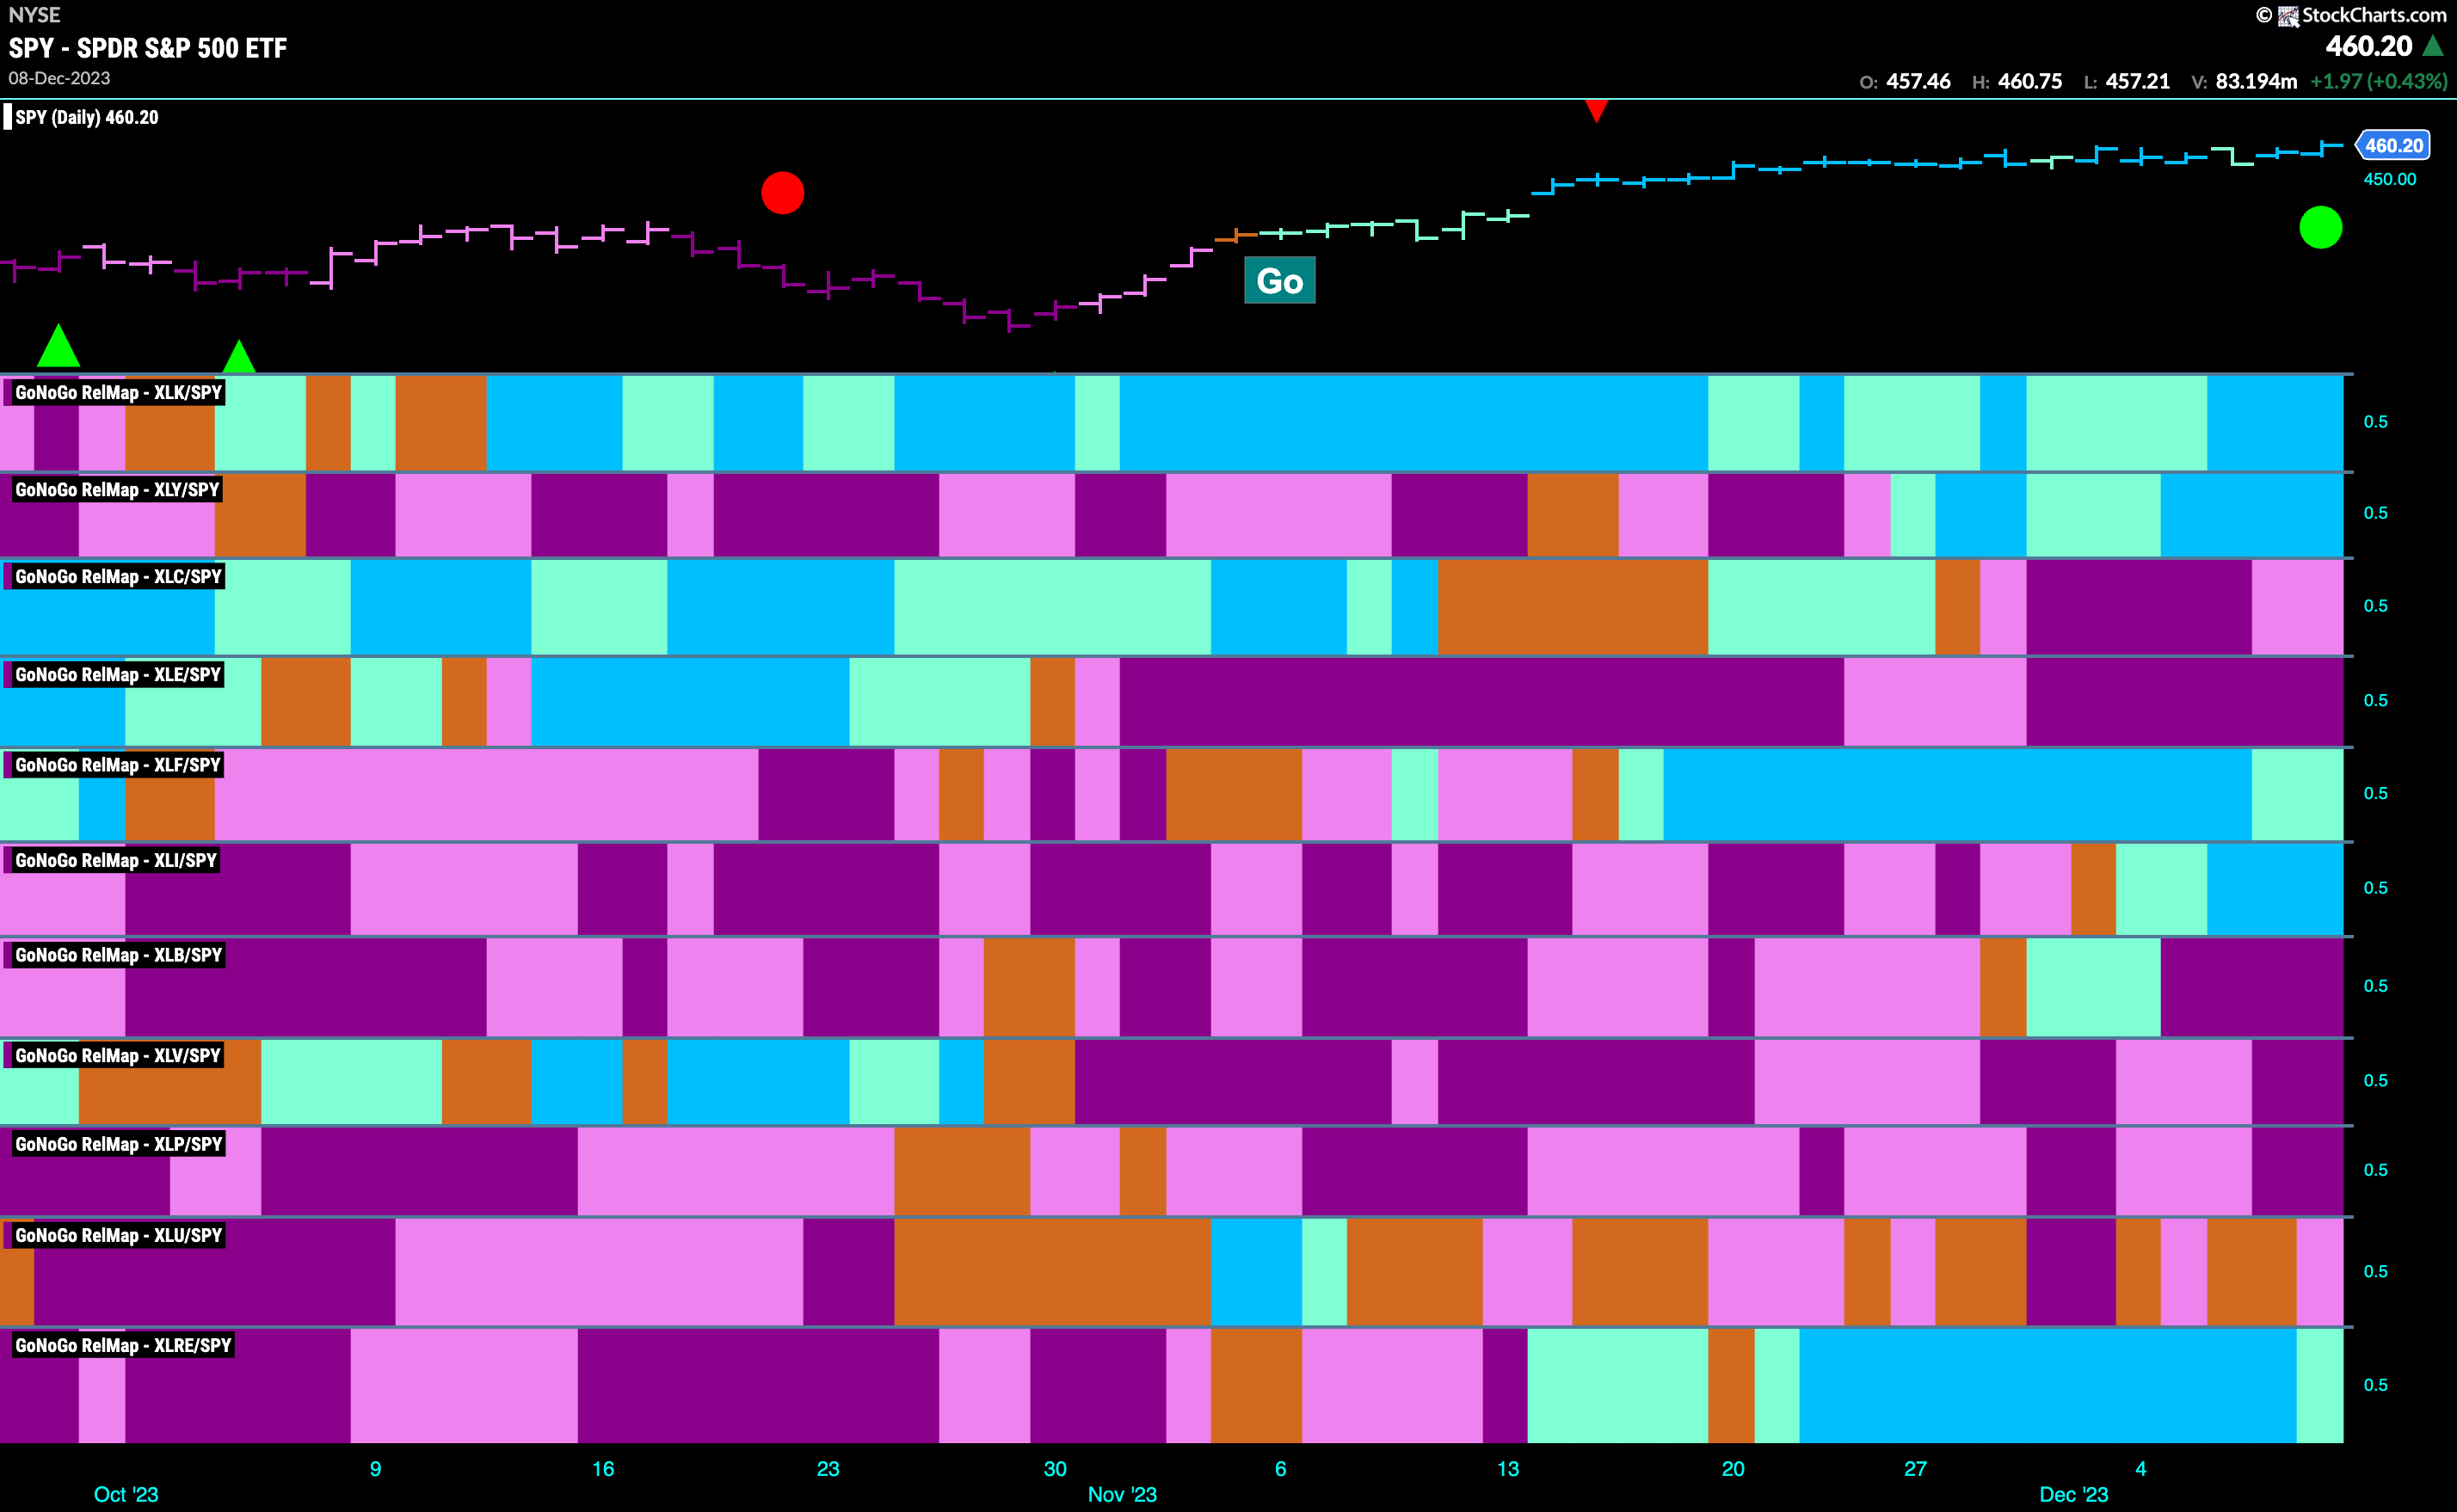
Below is the GoNoGo Sector RelMap. This GoNoGo RelMap applies the GoNoGo Trend to the relative strength ratios of the sectors to the base index. Looking at this map, we can quickly see where the relative outperformance is coming from as well as which sectors are lagging on a relative basis. 5 sectors are outperforming the base index this week. $XLK, $XLY $XLF, $XLI, and $XLRE, are painting “Go” bars.
Heavy Construction Pushes Industrials to Out-Perform
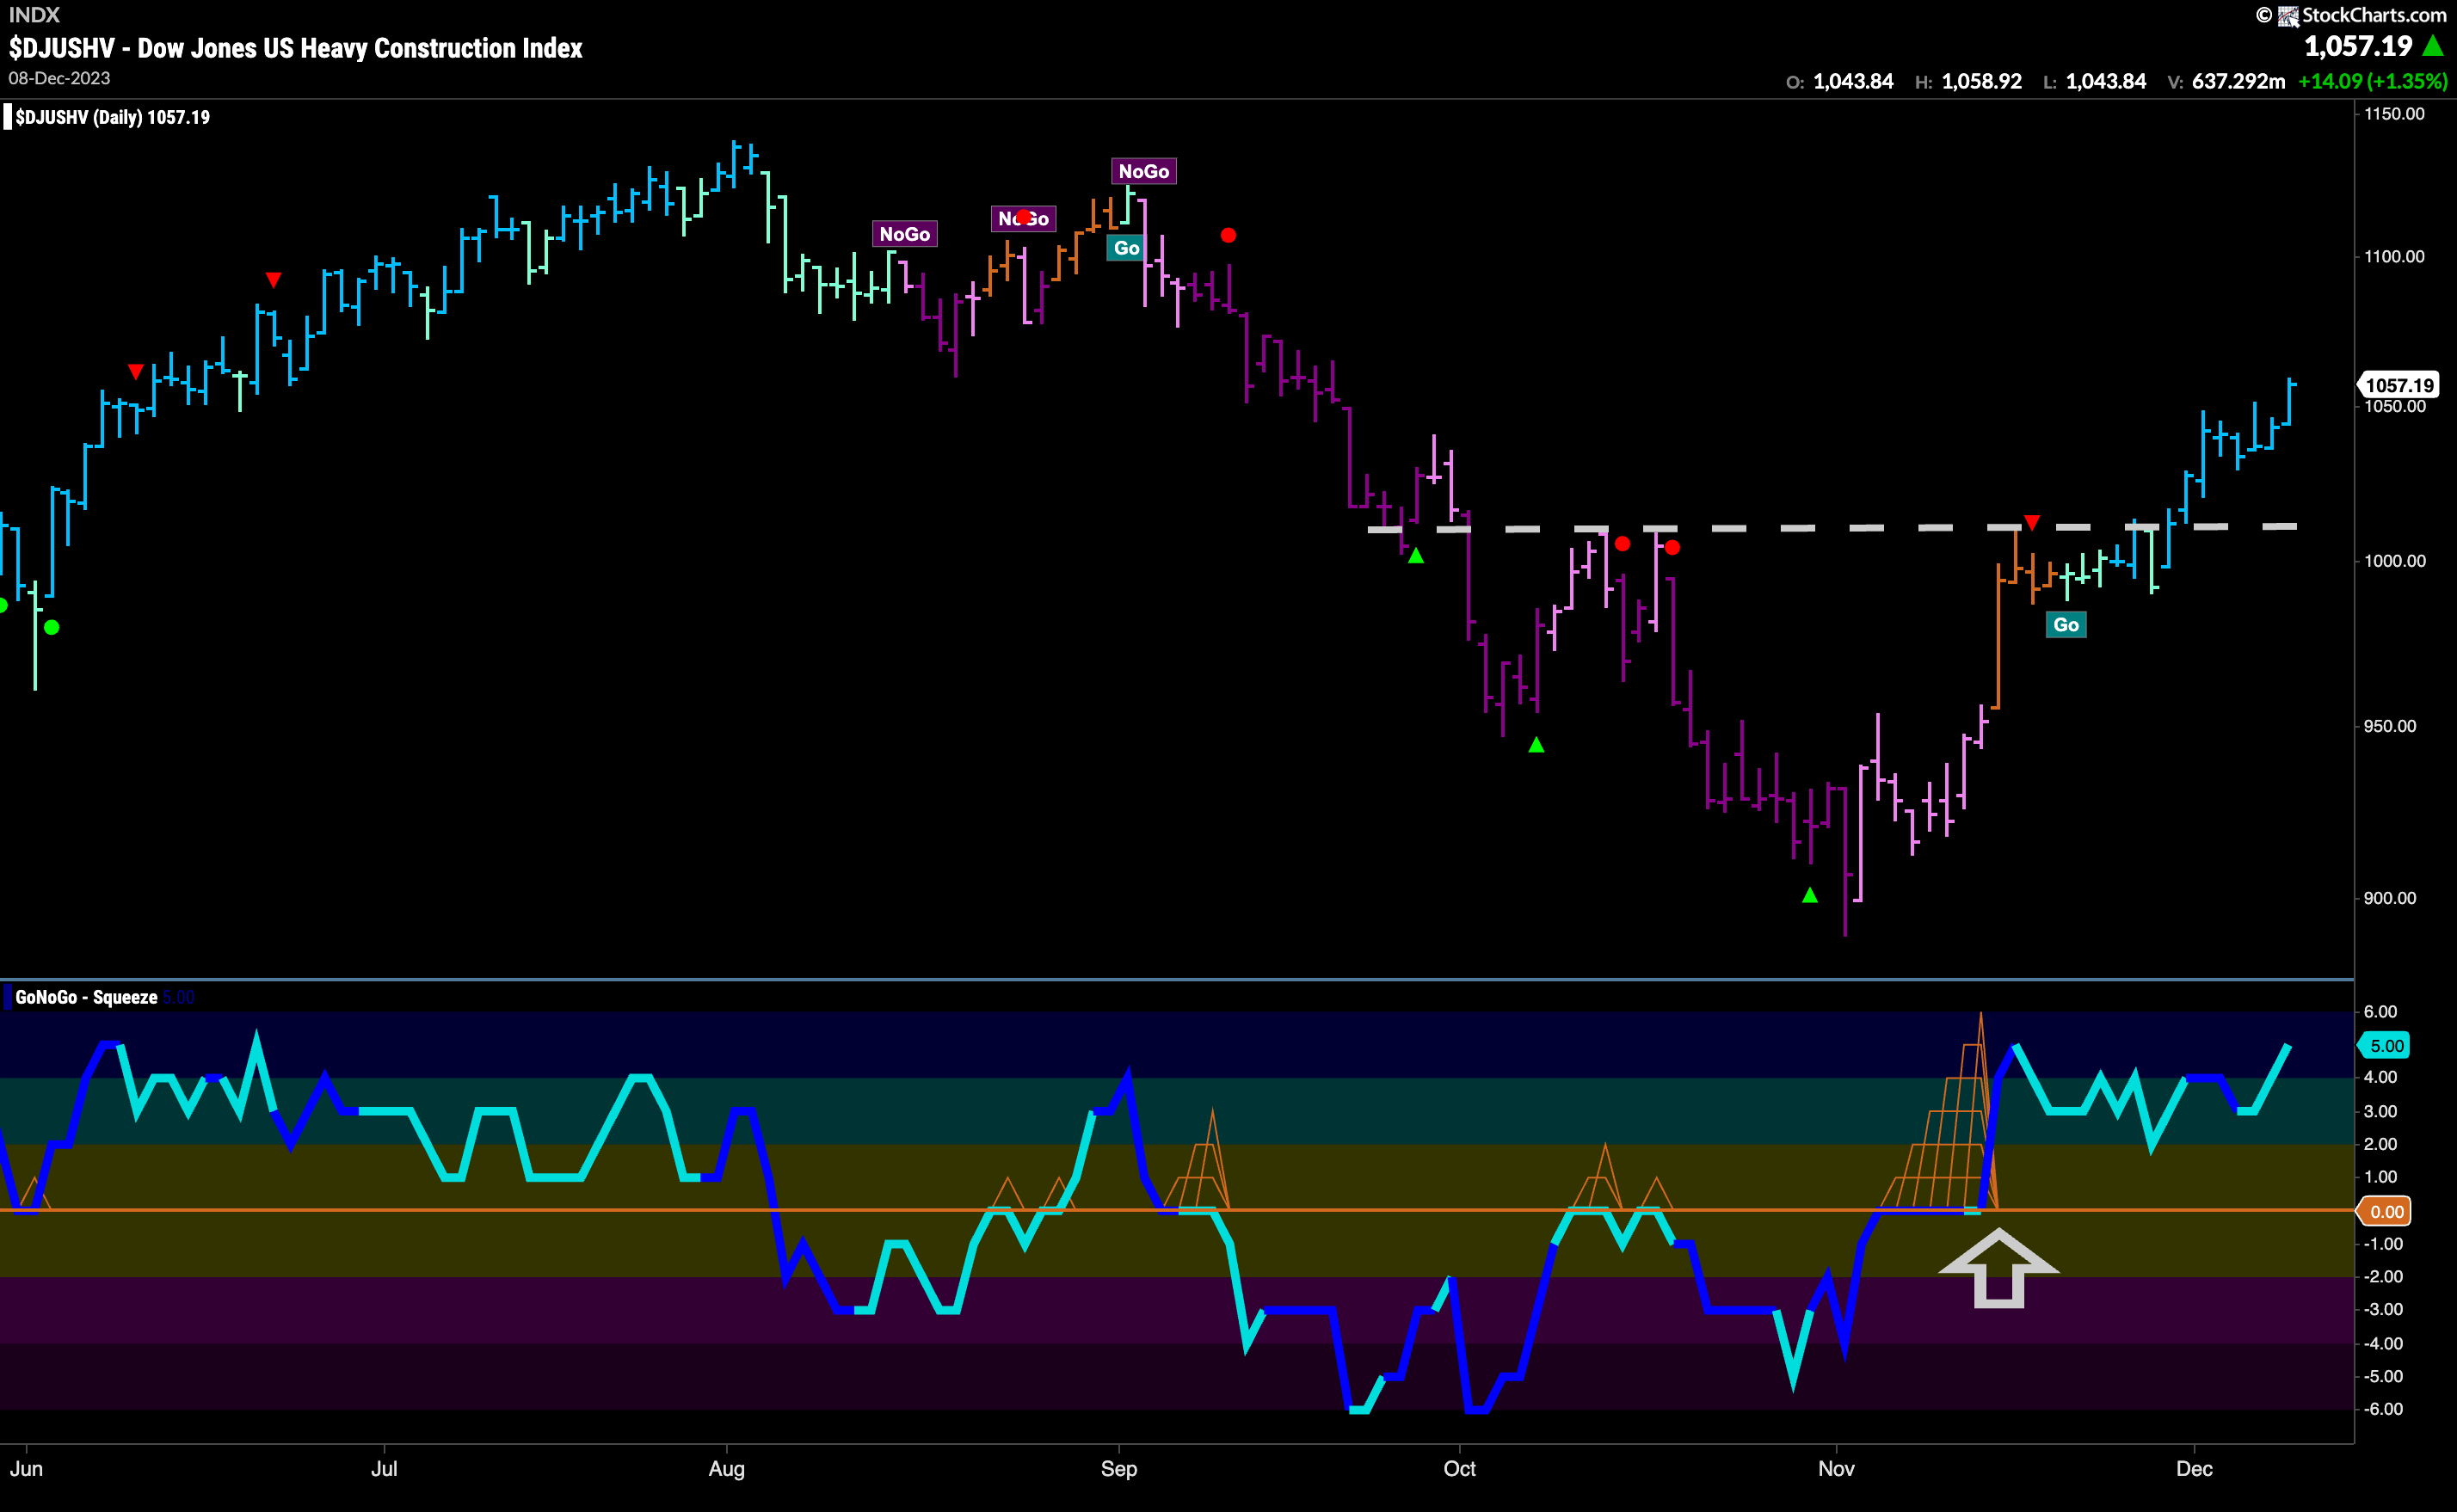
The GoNoGo Sector RelMap above shows that the industrials sector has joined the fray as it outperforms the base index. Diving into the sub group RelMap (not pictured) we saw that one of the industry groups in a relative “Go” trend vs the sector is heavy construction. The chart below shows the pure GoNoGo chart for $DJUSHV. We saw a Max GoNoGo Squeeze broken to the upside as GoNoGo Trend painted a few amber “Go Fish” bars and then followed through with a “Go” trend that was able to break above horizontal resistance. Now, the indicator is painting strong blue “Go” bars as momentum is positive and approaching overbought.
$IESC Breaks Out to New Highs.
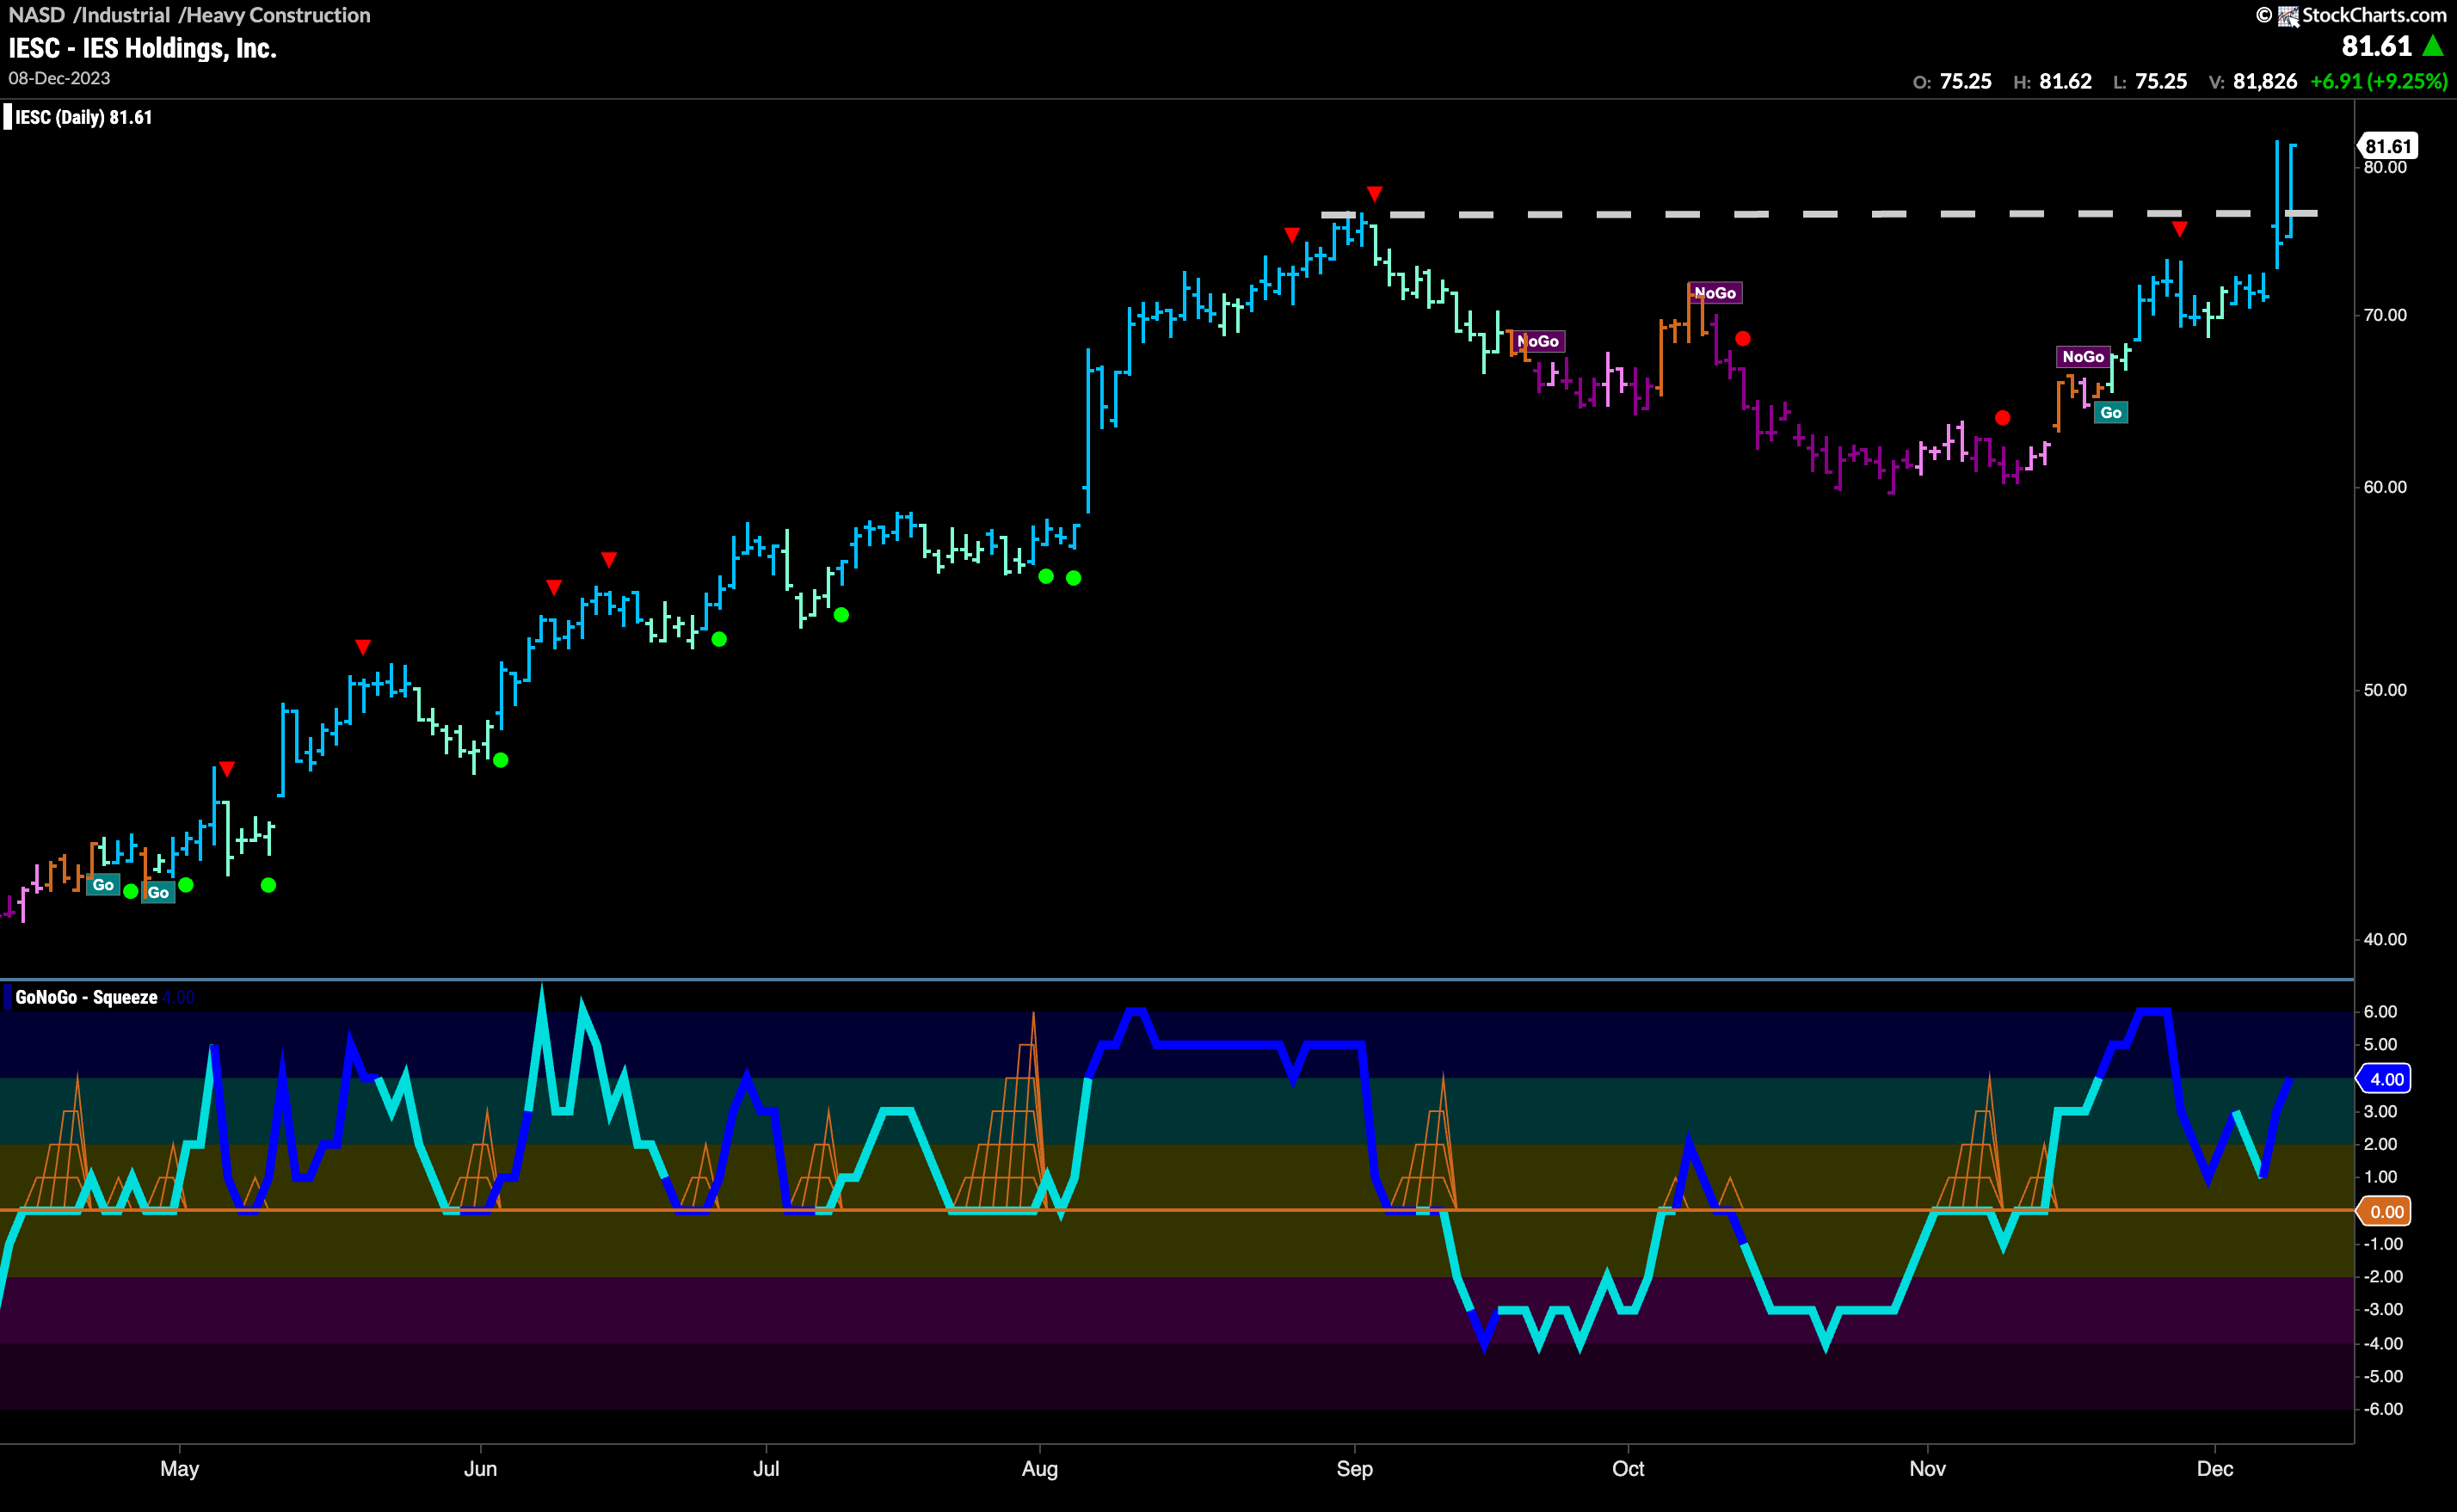
IES Holdings, Inc, saw strong price movement at the end of last week. On an intraday basis, price burst through prior high resistance on Thursday but was unable to close at new highs. Friday’s price bar was a strong confirmation of new highs as it closed at the high for the day and well above resistance. GoNoGo Oscillator reversed course without ever touching zero and is now moving higher on heavy volume.
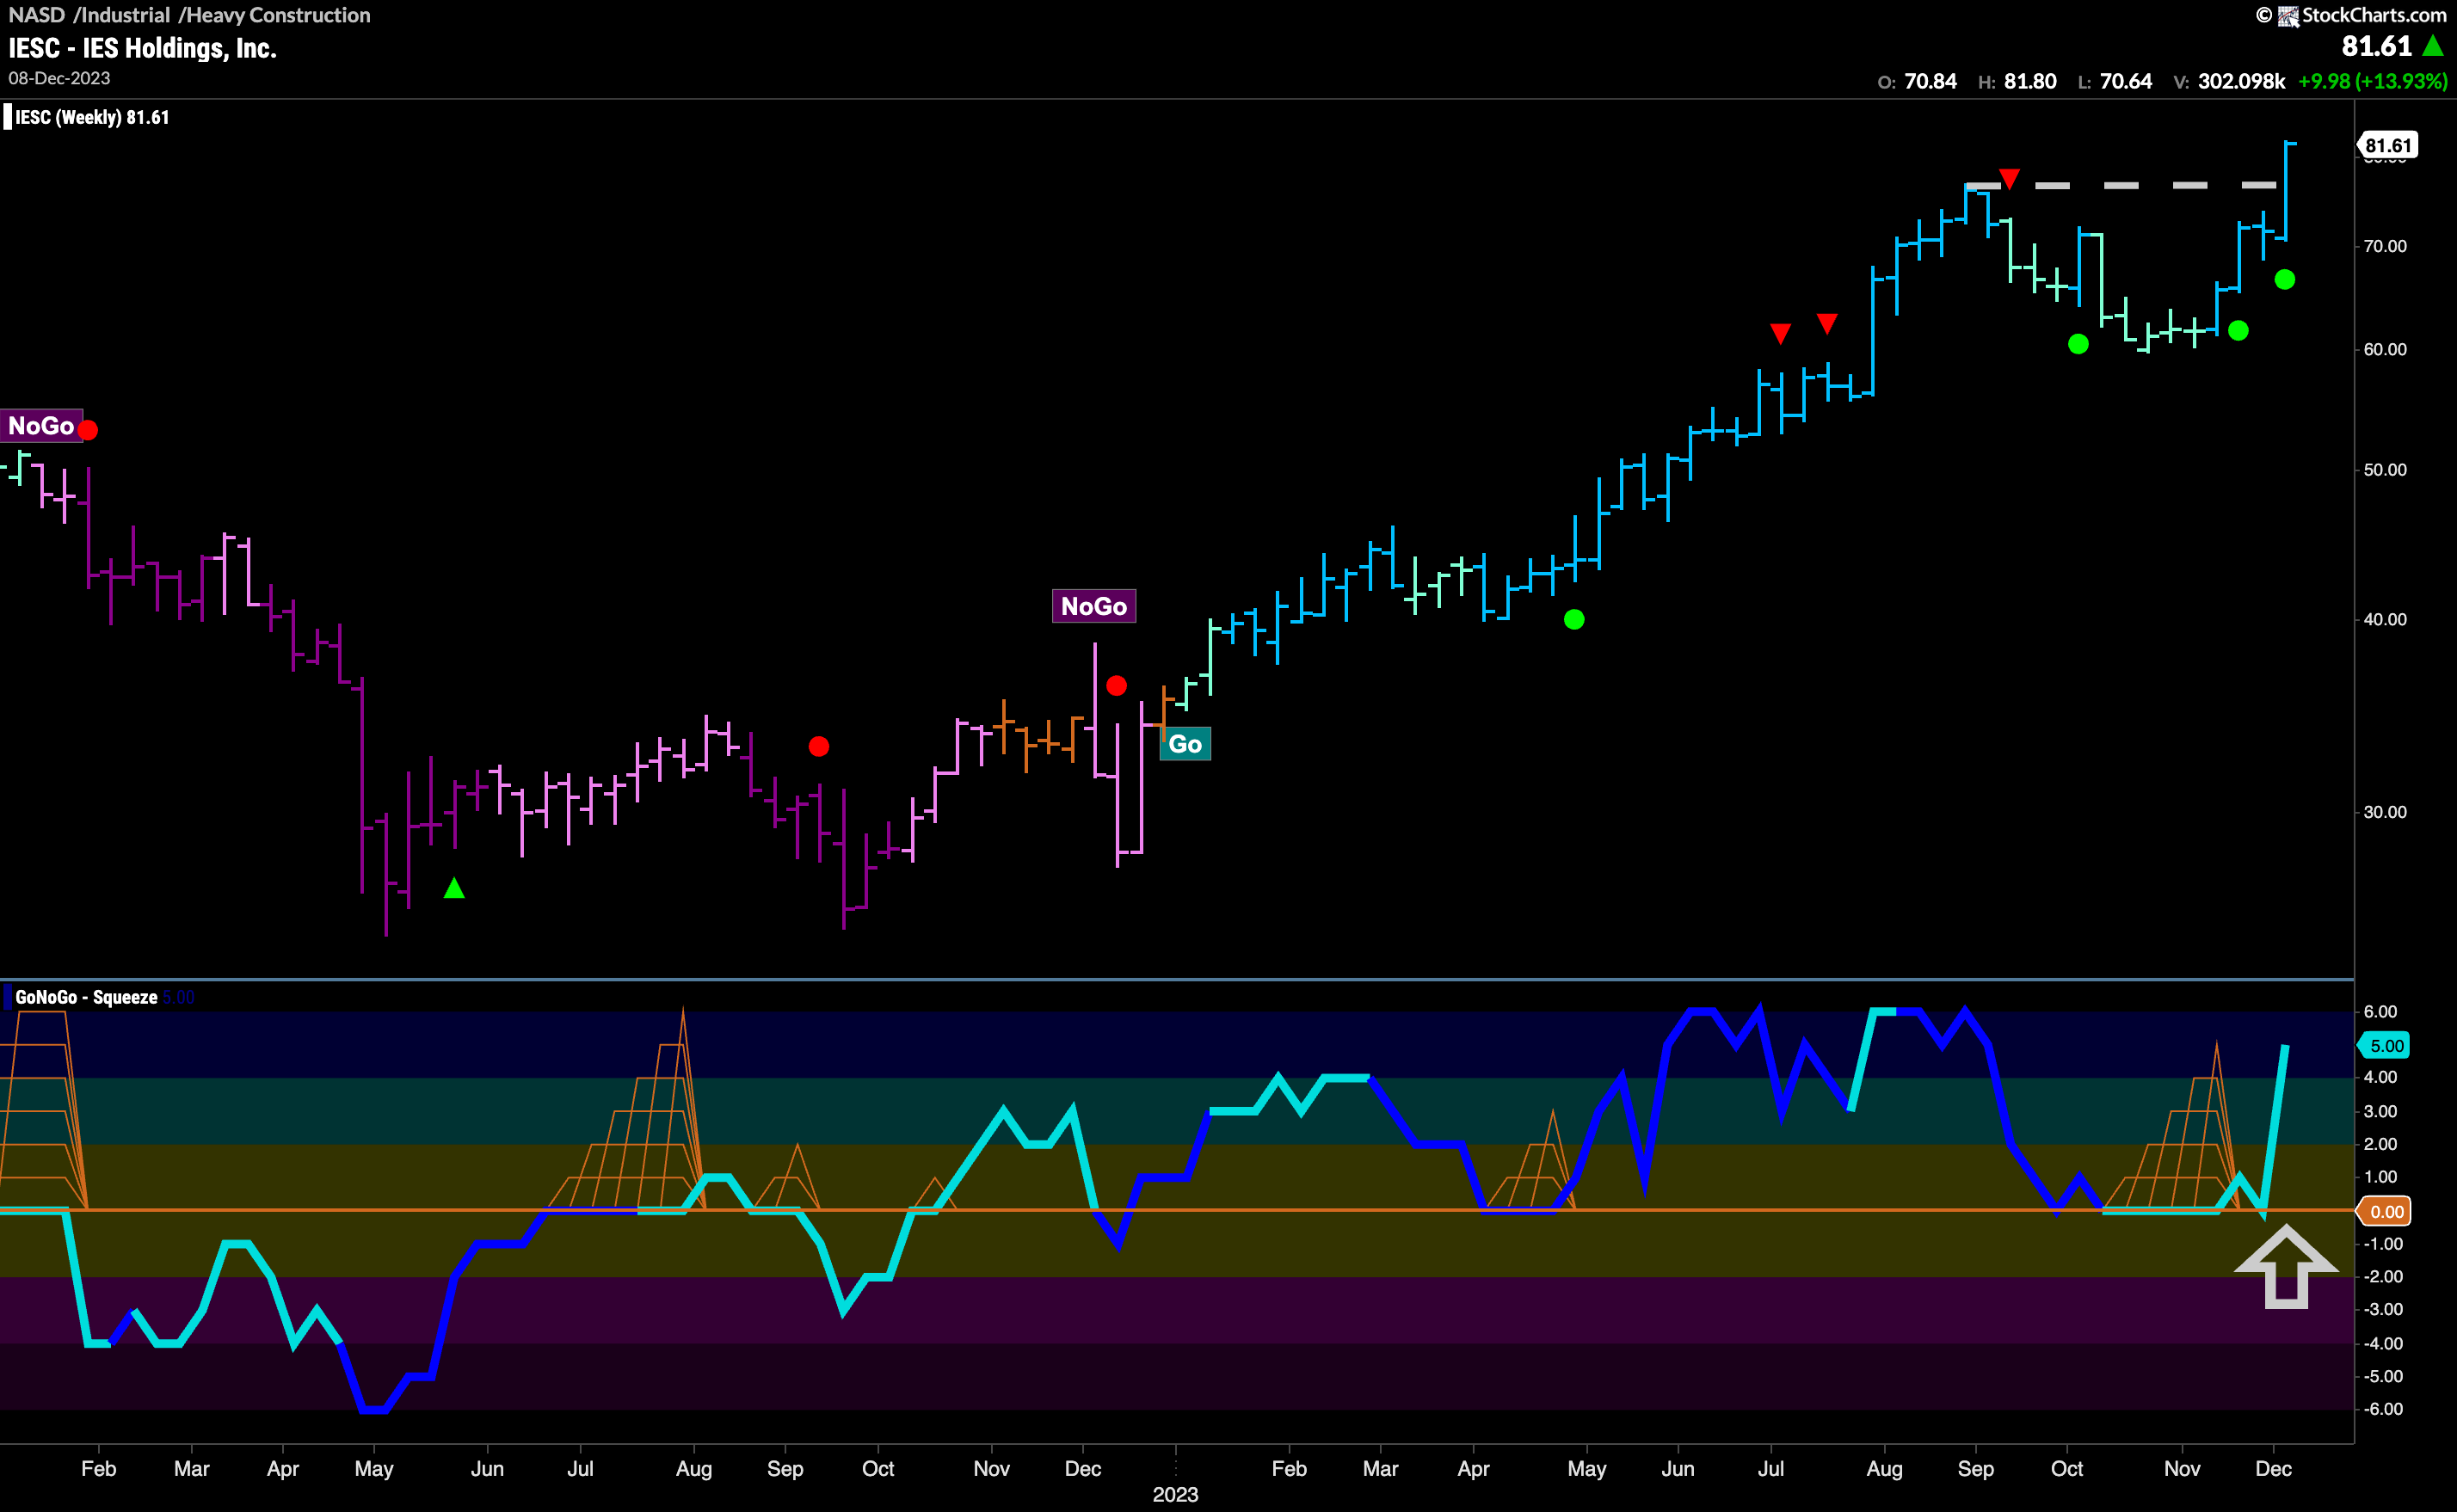
The weekly chart shows what a strong move it was. The September high was followed by a Go Countertrend Correction Icon and price then pulled back for a few months. GoNoGo Oscillator fell to test the zero line from above and we saw a GoNoGo Squeeze build as the oscillator was able to find support at the zero line. This led to a clustering of Go Trend Continuation Icons (green circles) and that resurgent momentum (as the squeeze was broken into positive territory) propelled price to new highs. We will look for price to consolidate at these levels over the next few weeks.
$MTZ in New “Go” Trend
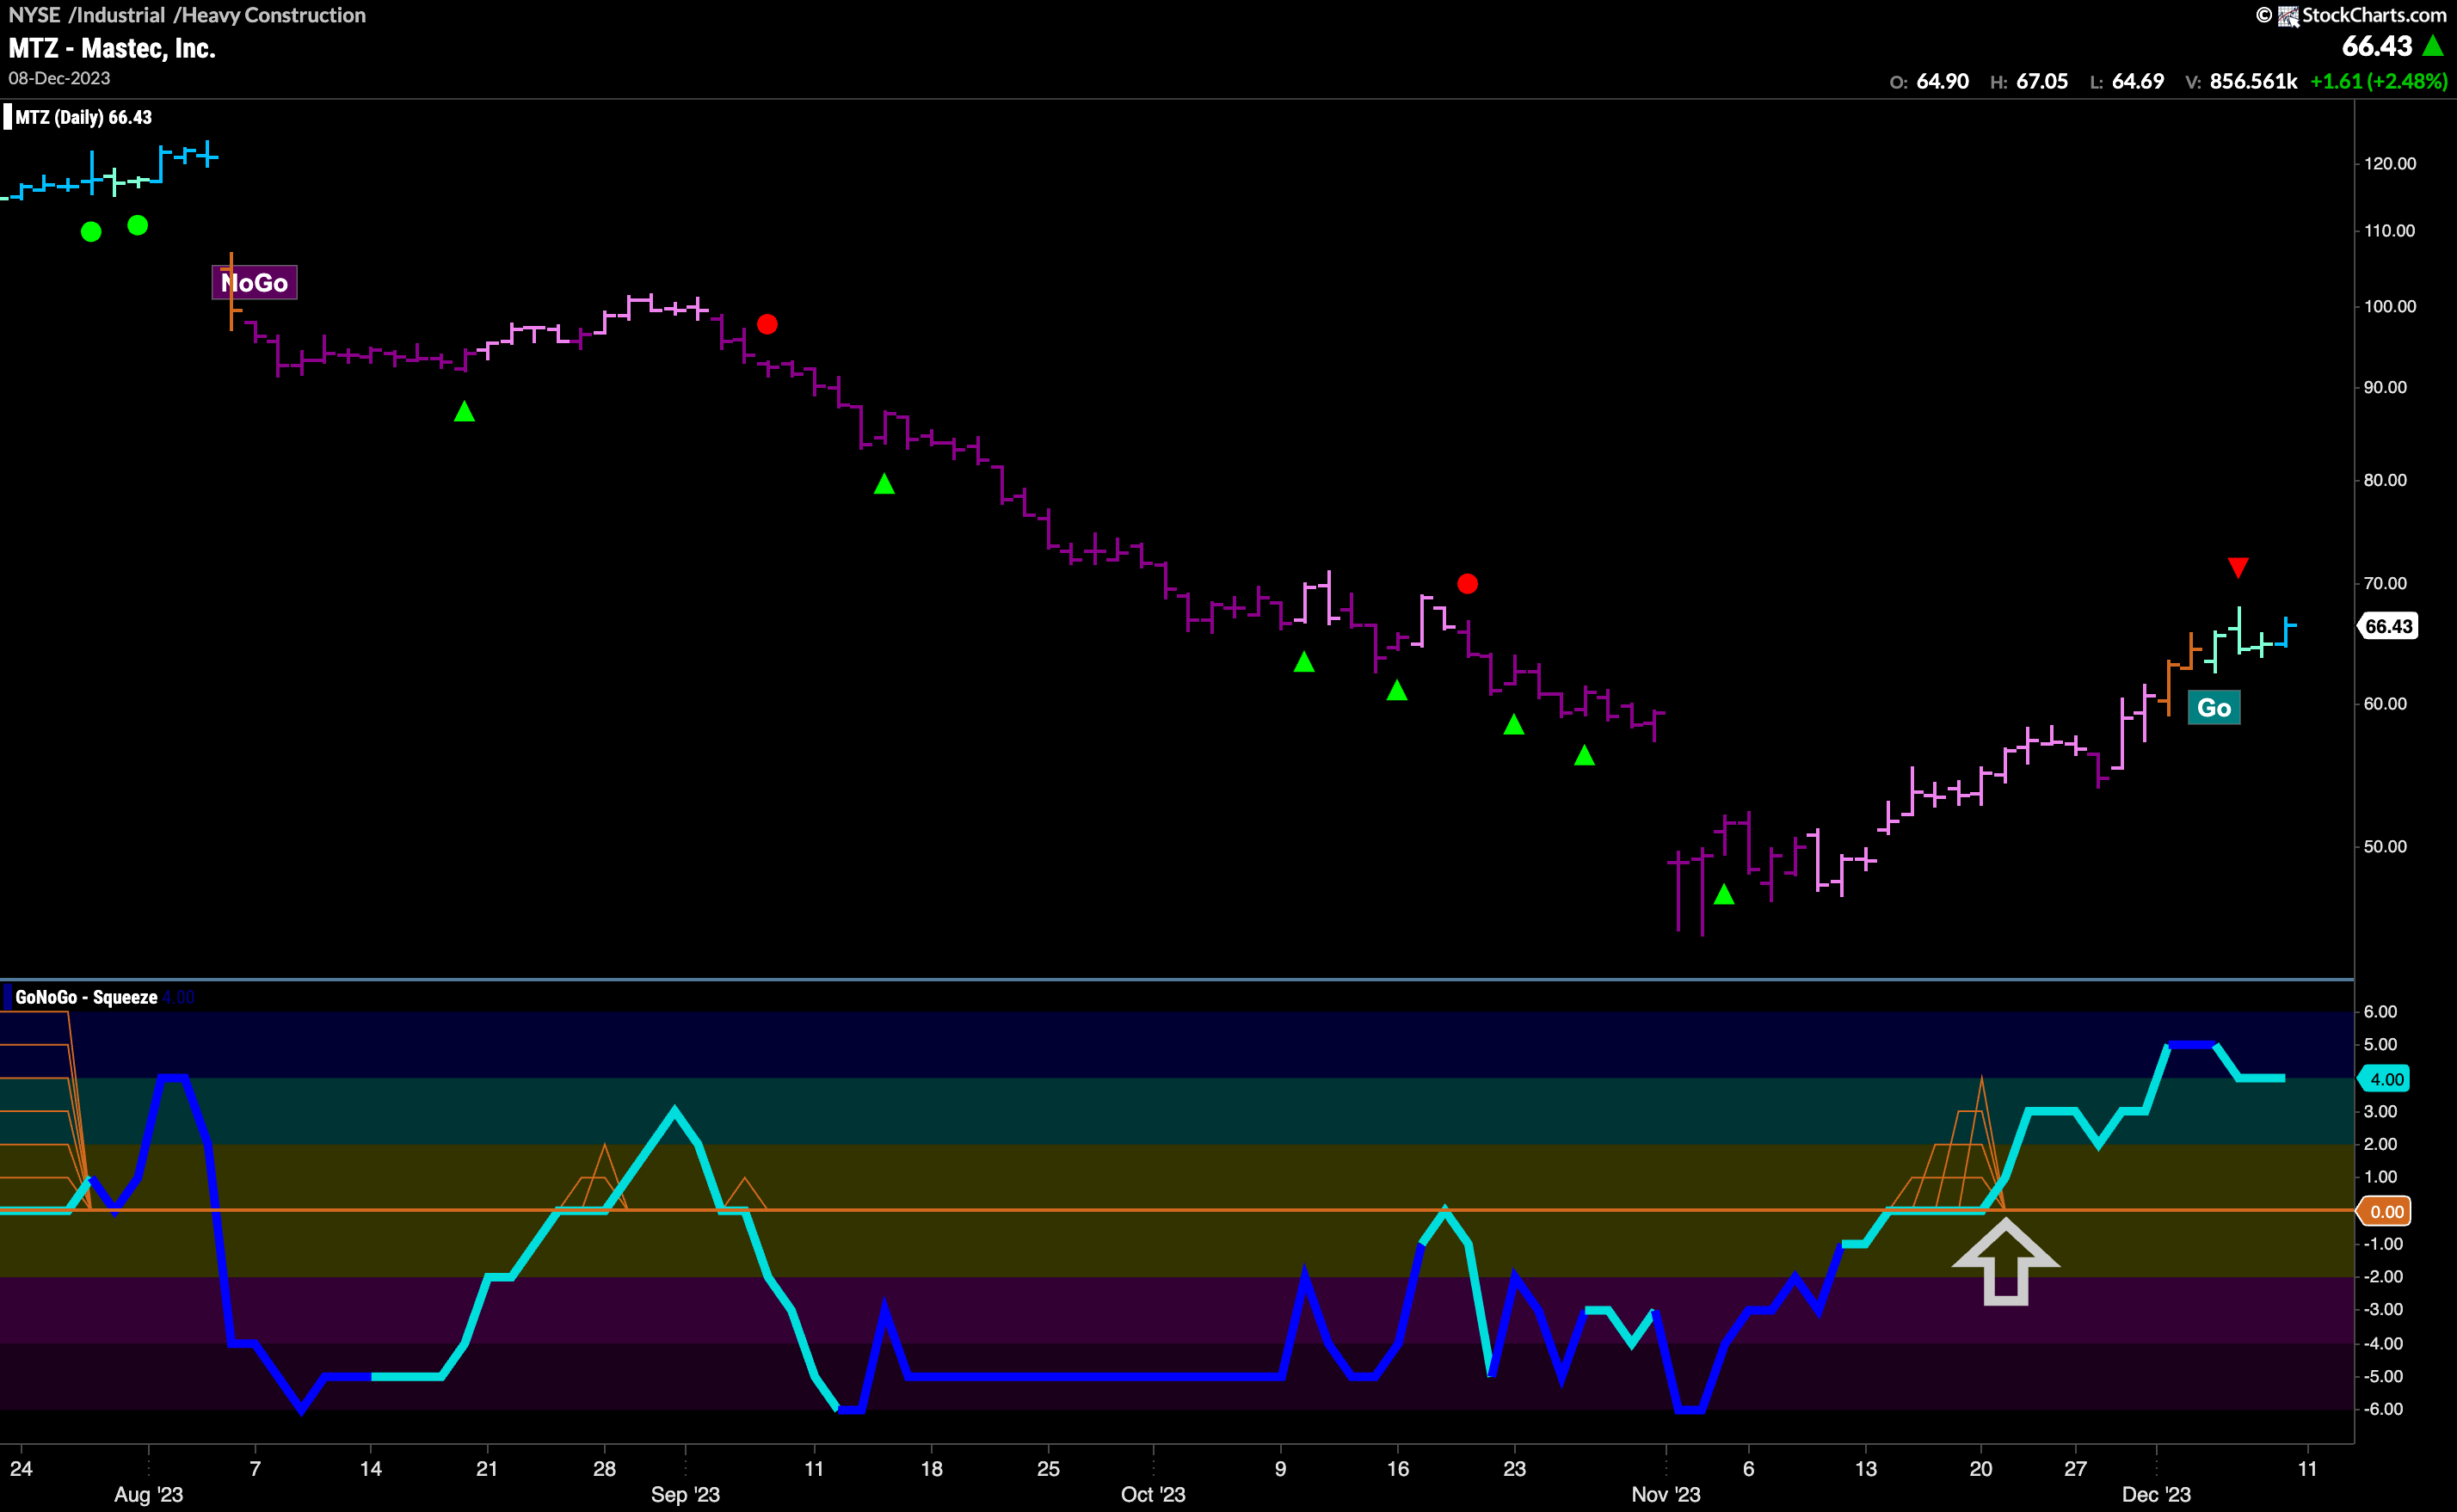
What about a company in the out-performing heavy construction sub group that is just starting to trend higher? Mastec, Inc, suffered through a long and destructive “NoGo” trend that saw an ultimate low in November. Just after those lows, GoNoGo Oscillator rose to test the zero line and broke out of a small GoNoGo Squeeze into positive territory. This told us that momentum was contrary to the “NoGo” trend and indeed GoNoGo Trend followed by rolling through the colors. Weaker pink was replaced by amber, then aqua and finally the indicator is painting a strong blue “Go” bar. With momentum on its side, we will look for the “Go” trend to continue to move up from here.
