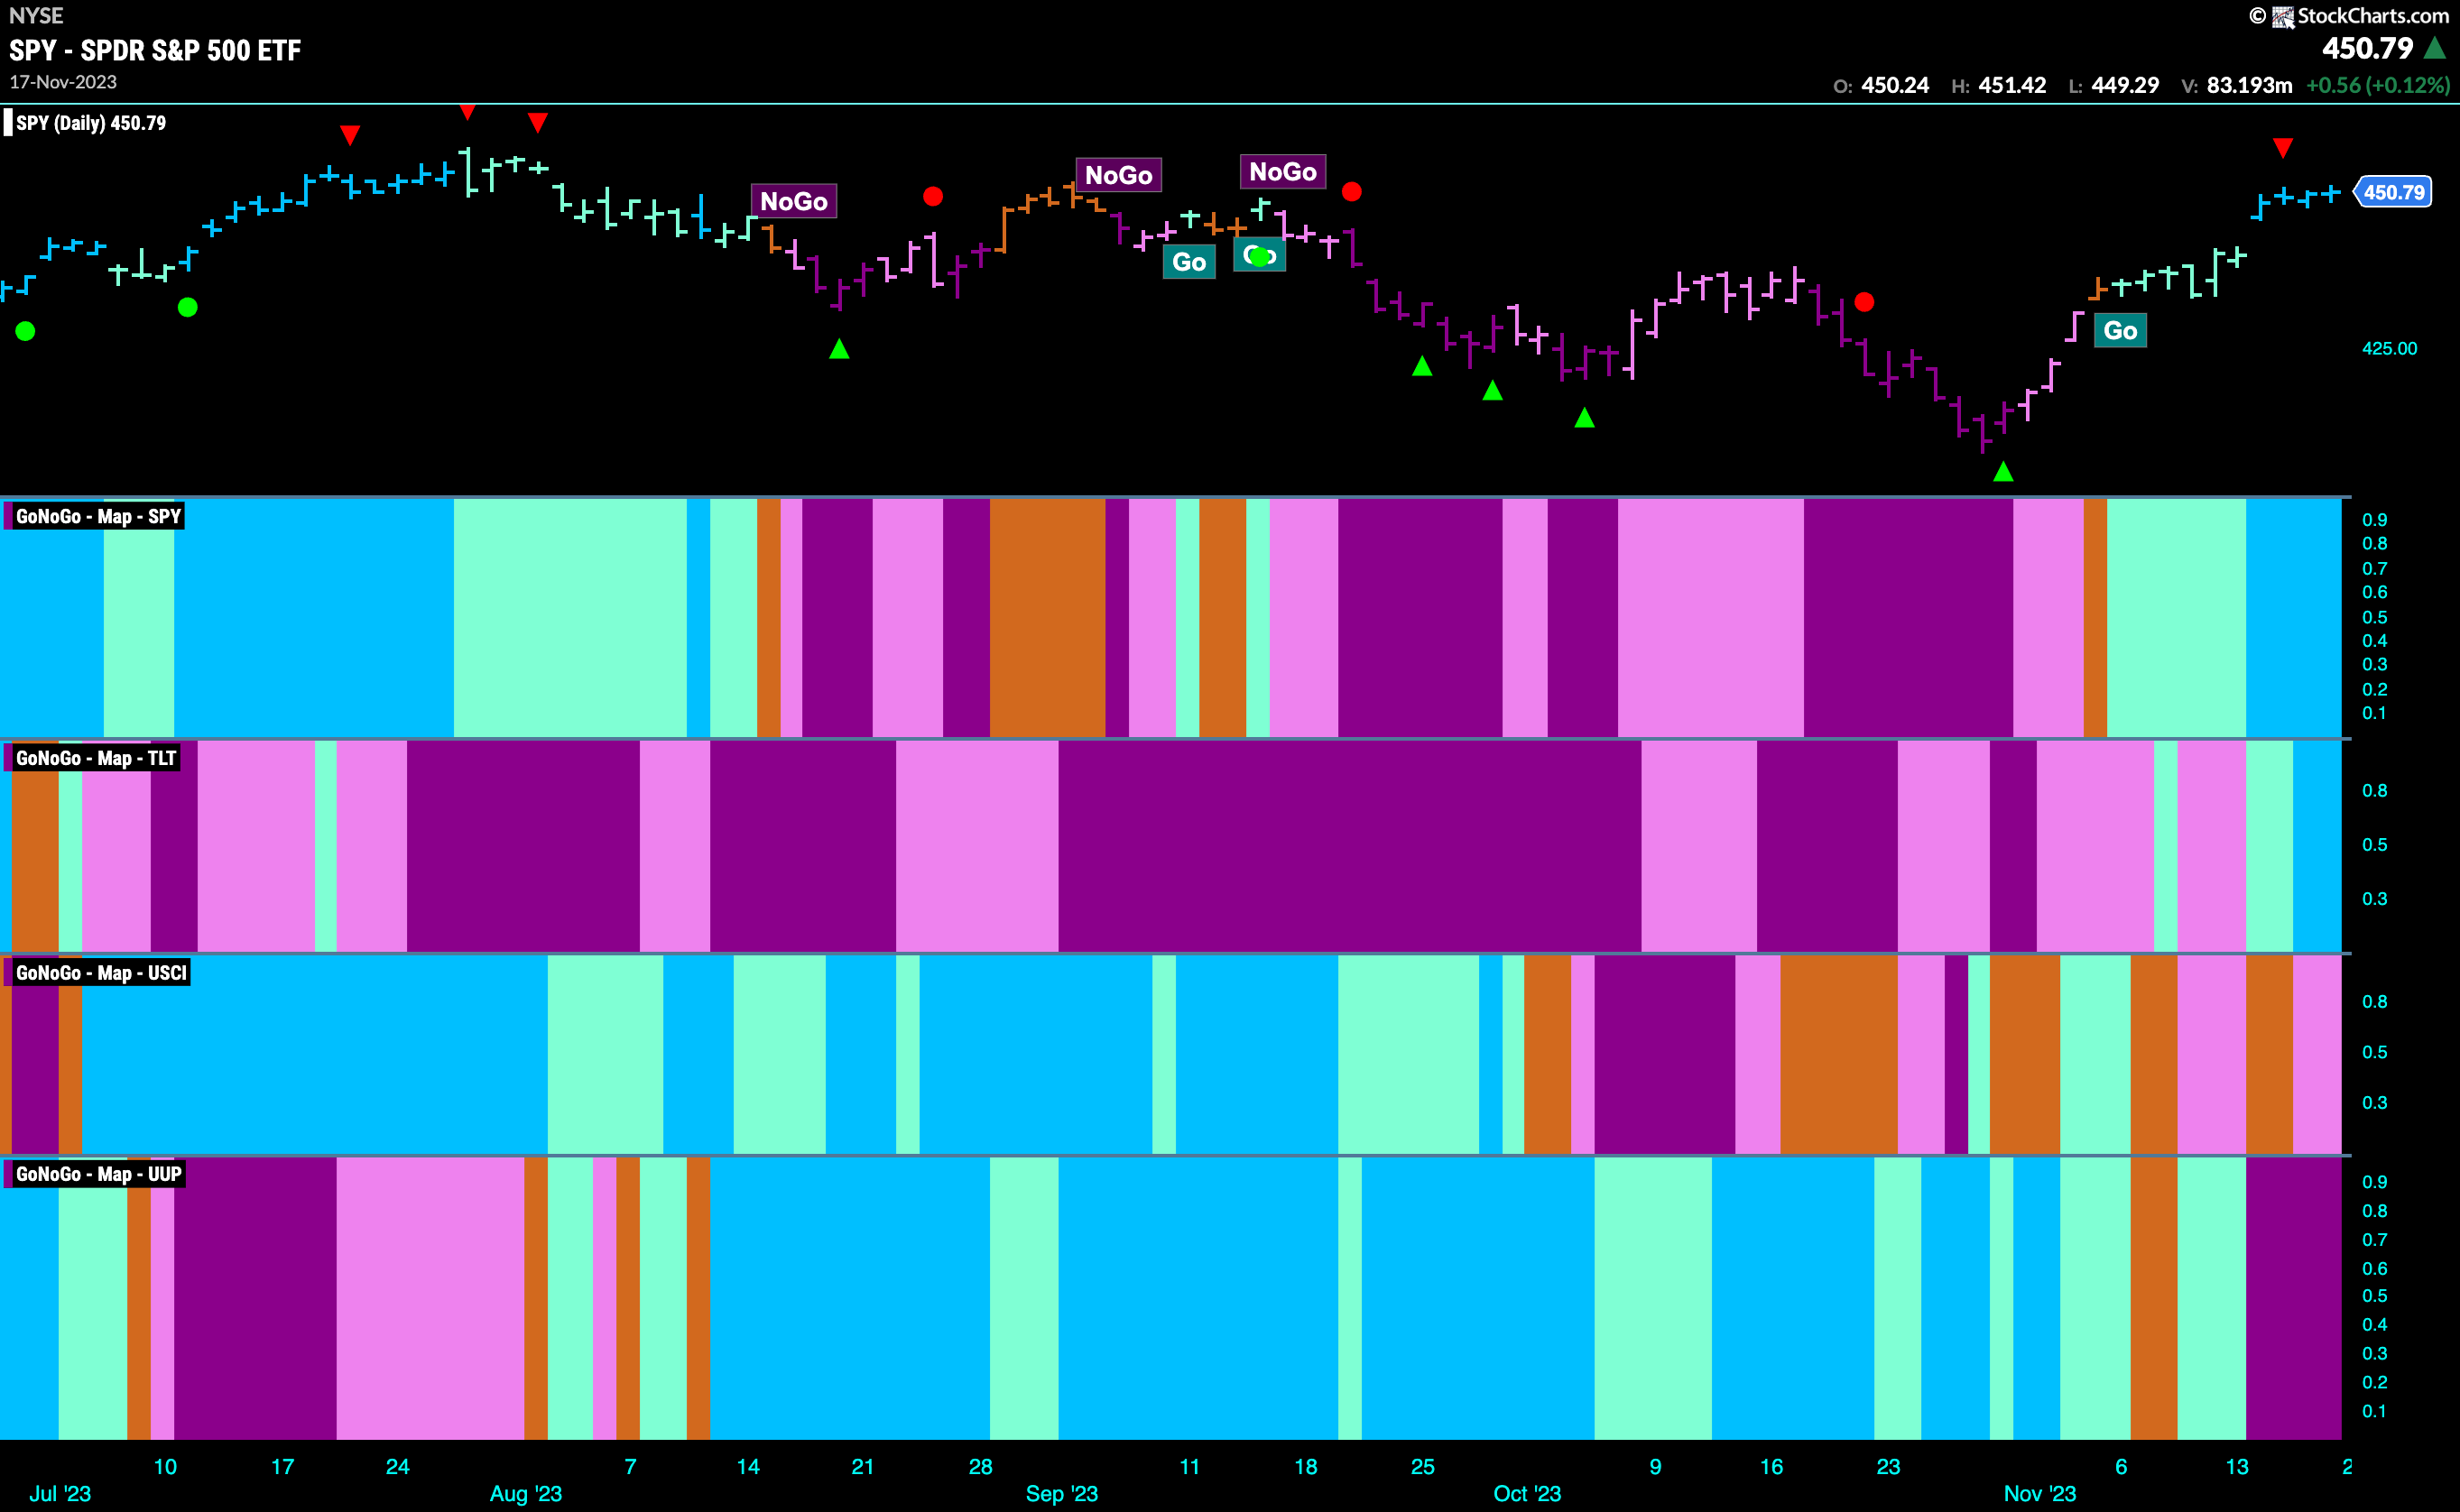
Good morning and welcome to this week’s Flight Path. The strength in equities continued for another week as we saw several strong blue bars and price gapped higher earlier in the week. Treasury bond prices also joined equities in a “Go” trend, ending the week with strong blue bars. Commodities struggled again and finished painting weaker pink bars. The dollar saw the biggest change as its “Go” trend gave way to strong purple “NoGo” bars. We will see how this fall broke through possible support as well when we take a look at some dollar charts later in this note.
“Go” Trend Strengthens for U.S. Equities
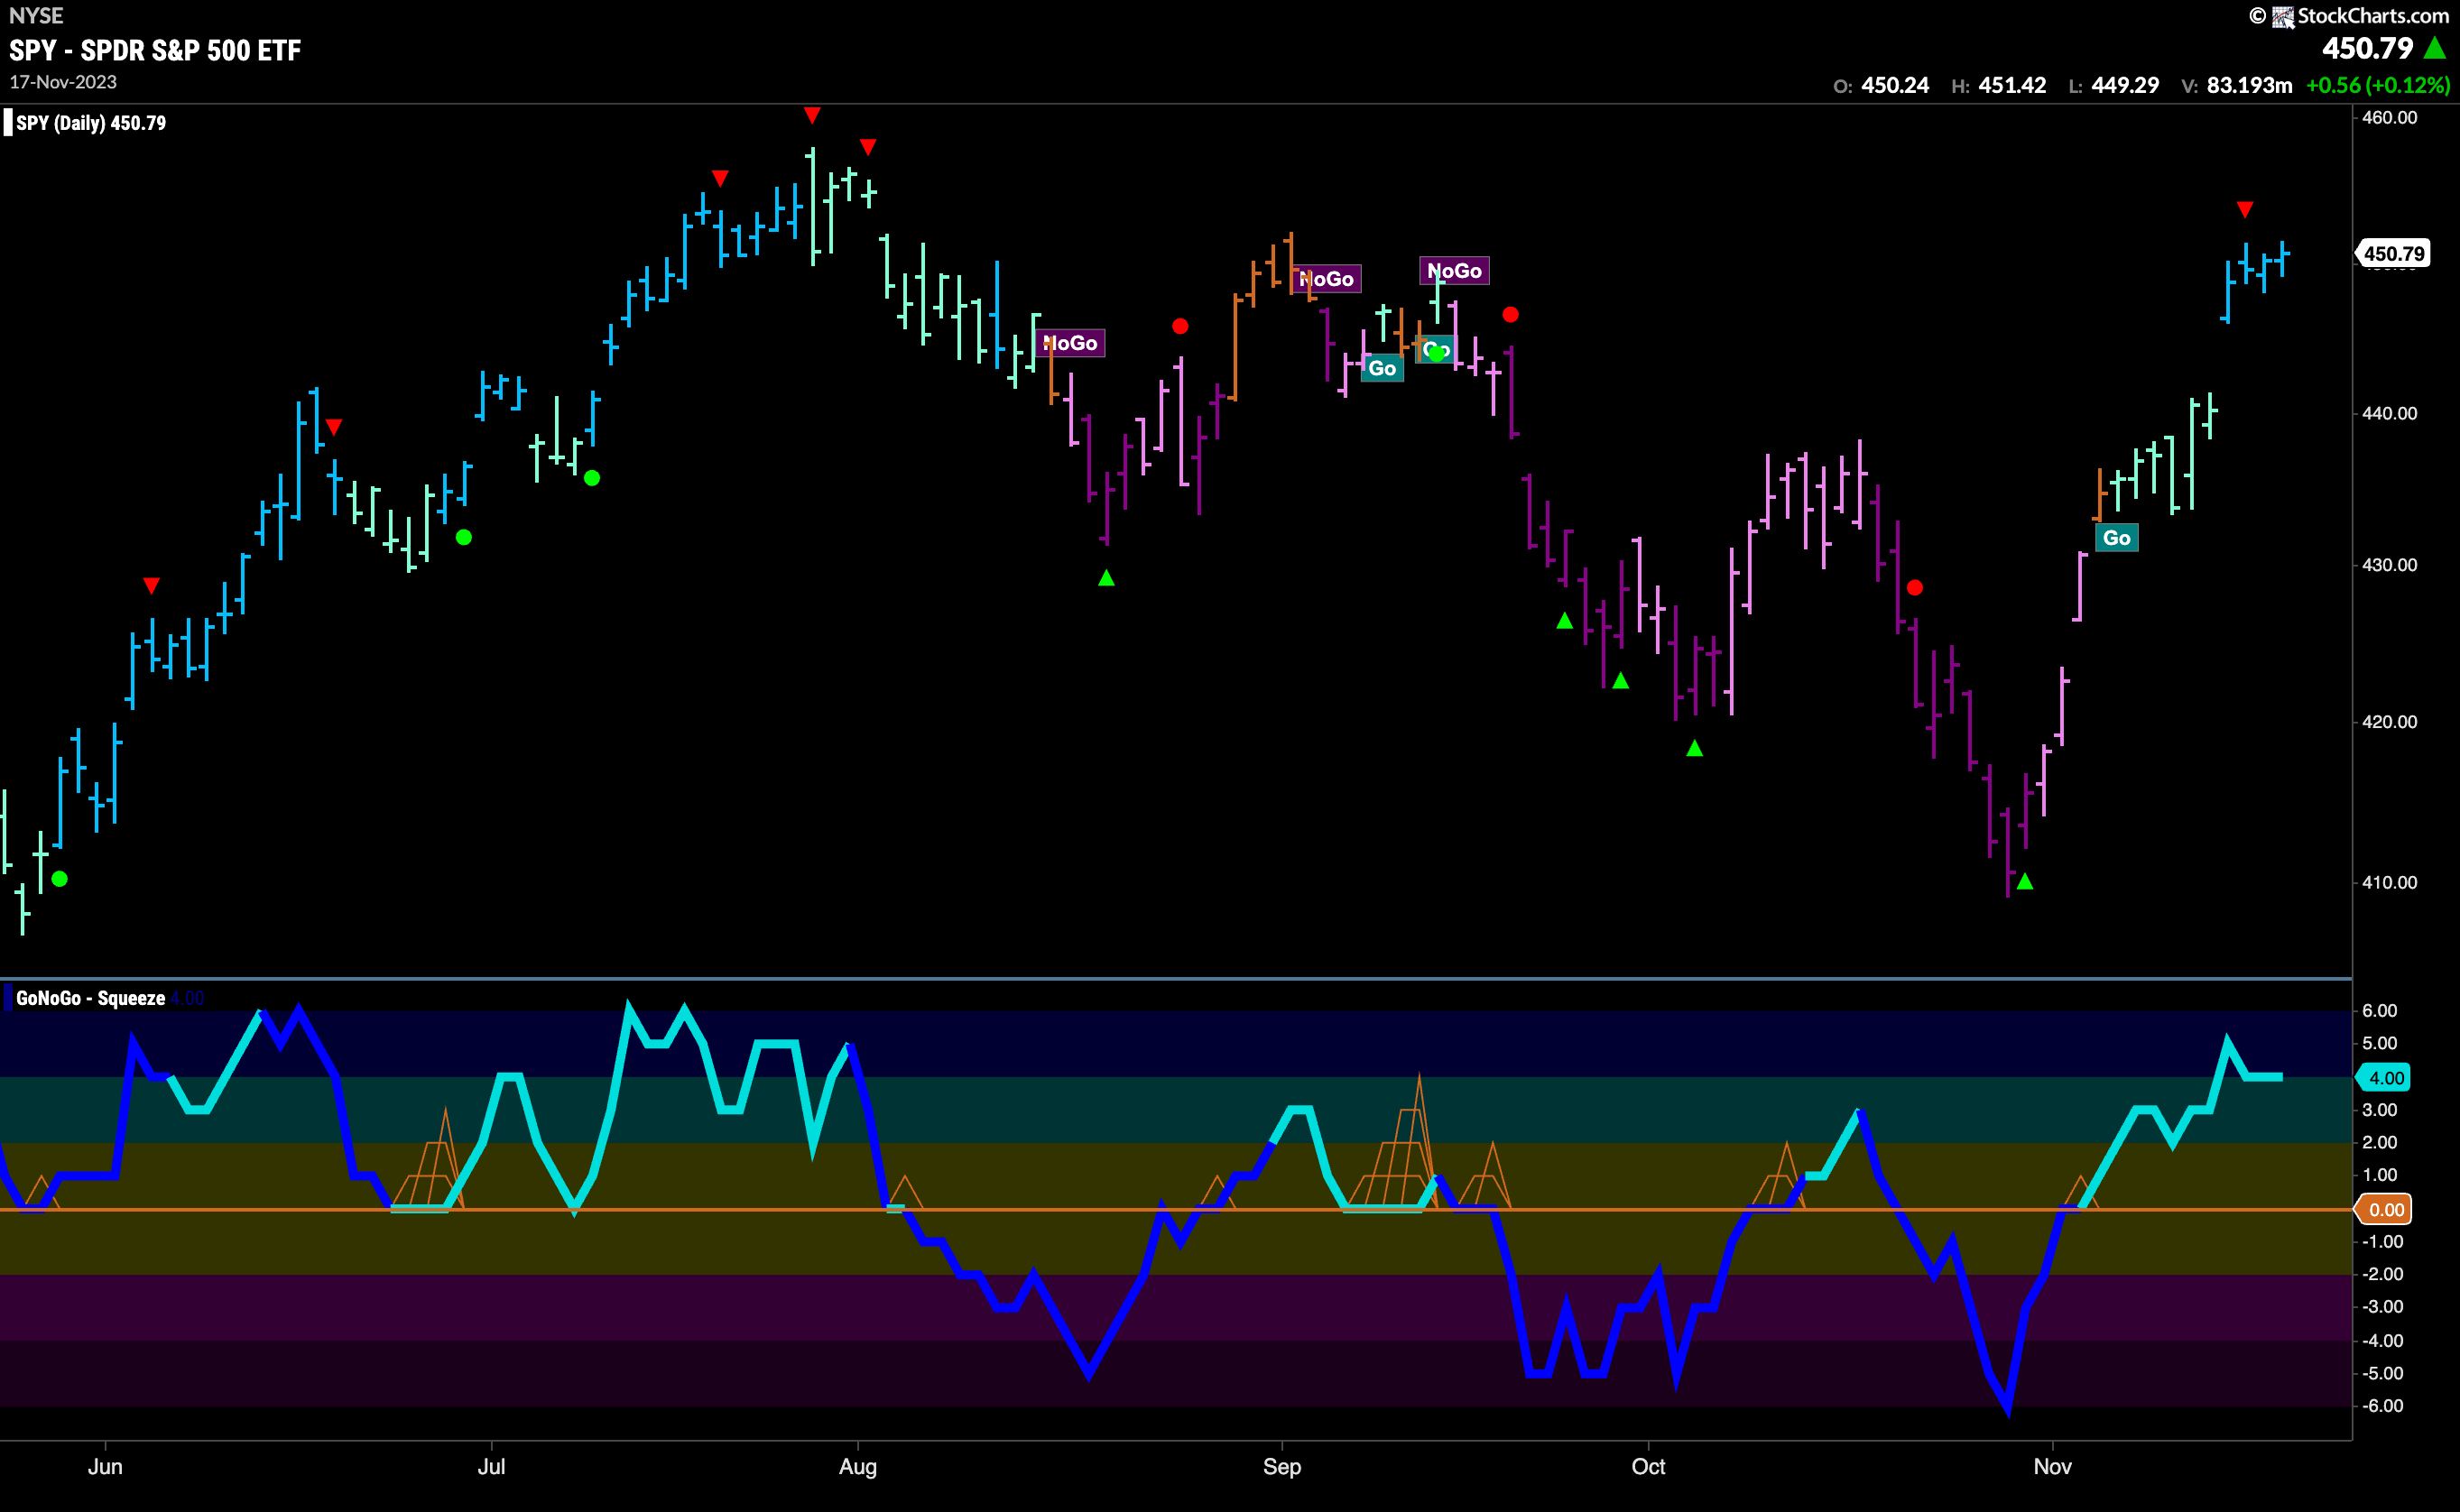
Prices gapped higher this week and have stayed higher as well. We see consecutive strong blue “Go” bars an price edging even higher as the week ended. GoNoGo Oscillator was in positive territory again for the entire week which tells us that momentum was on the side of this new “Go” trend. The oscillator did move from overbought territory to a value of 4 which triggered a Go Countertrend Correction Icon (red arrow) above price which let’s us know that in the short term price may consolidate and struggle to go much higher. However, we also know that when trend is strong price can blow past these short term warnings. We will watch this week to see if the strength can persist.
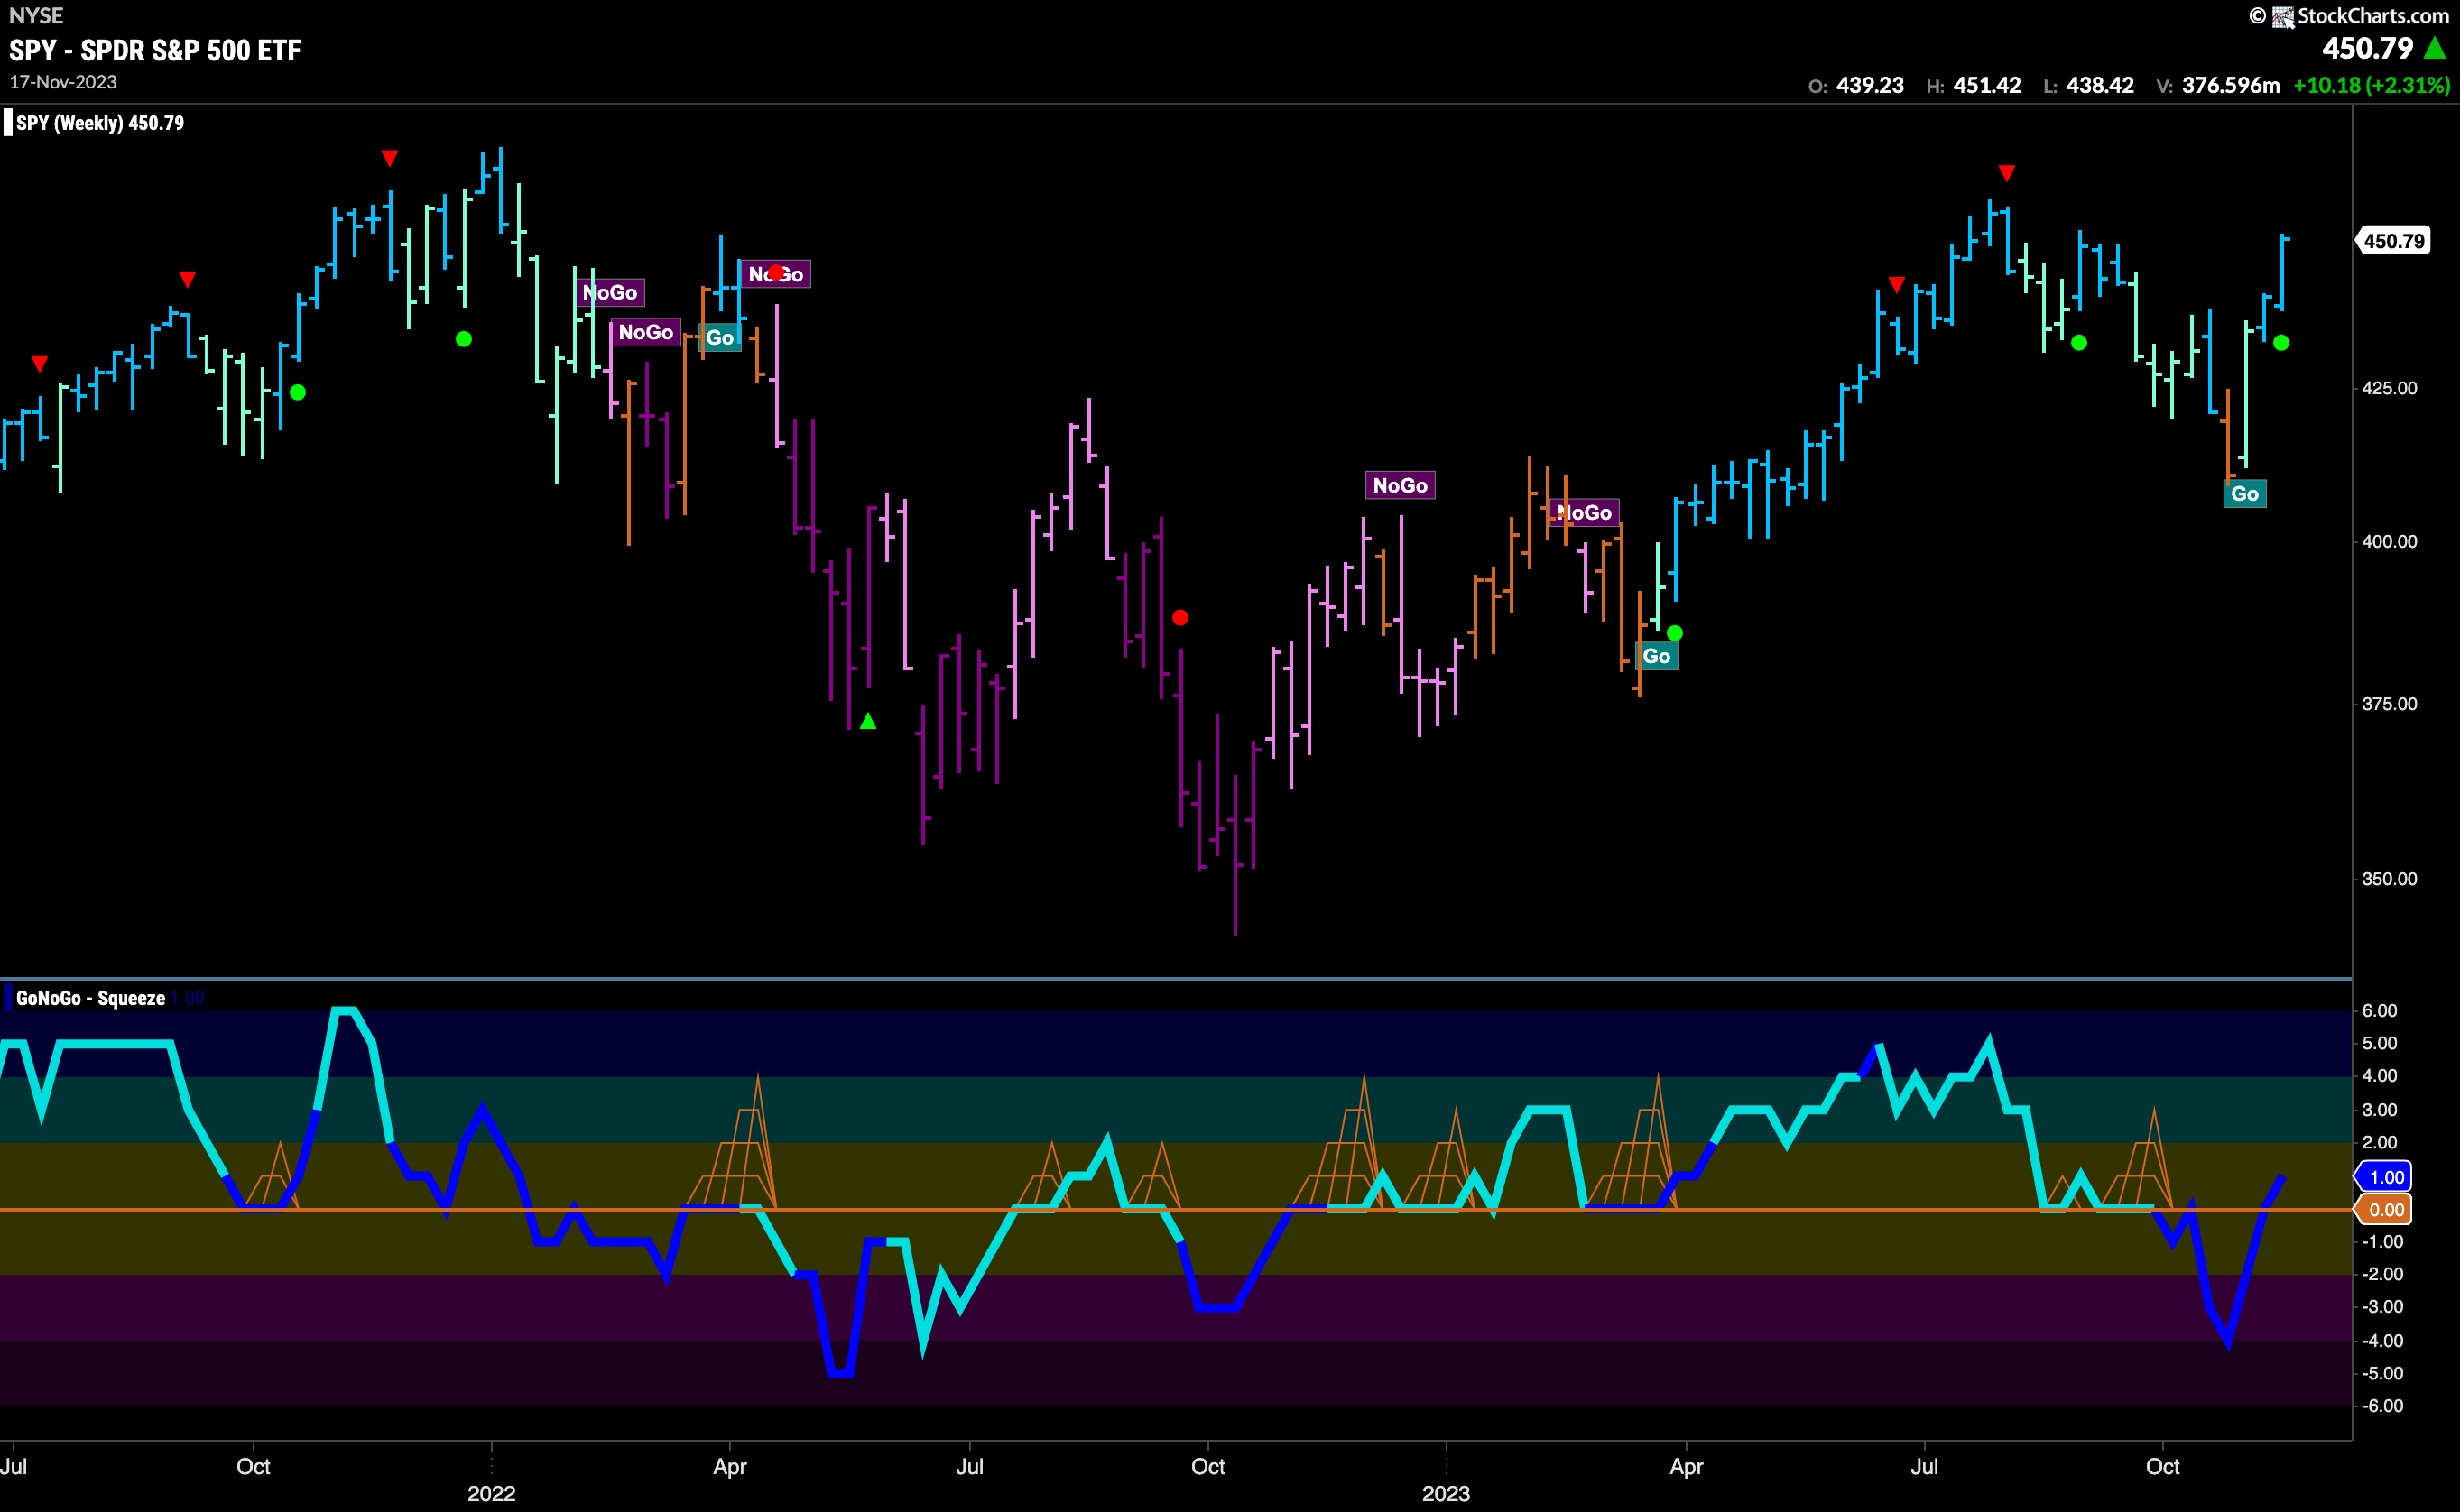
Another very strong weekly bar as we see follow through from the week before. GoNoGo Trend was able to paint a second strong blue “Go” bar. GoNoGo Oscillator moved quickly back from strongly negative territory to sneak its nose back above the zero line and volume was heavy. This strong momentum caused a Go Trend Continuation Icon (green circle) to appear under the price bar which tell us that the trend is likely to continue. We will watch to see if price can make an attempt at a new intermediate high.
Treasury Rates Fall Further
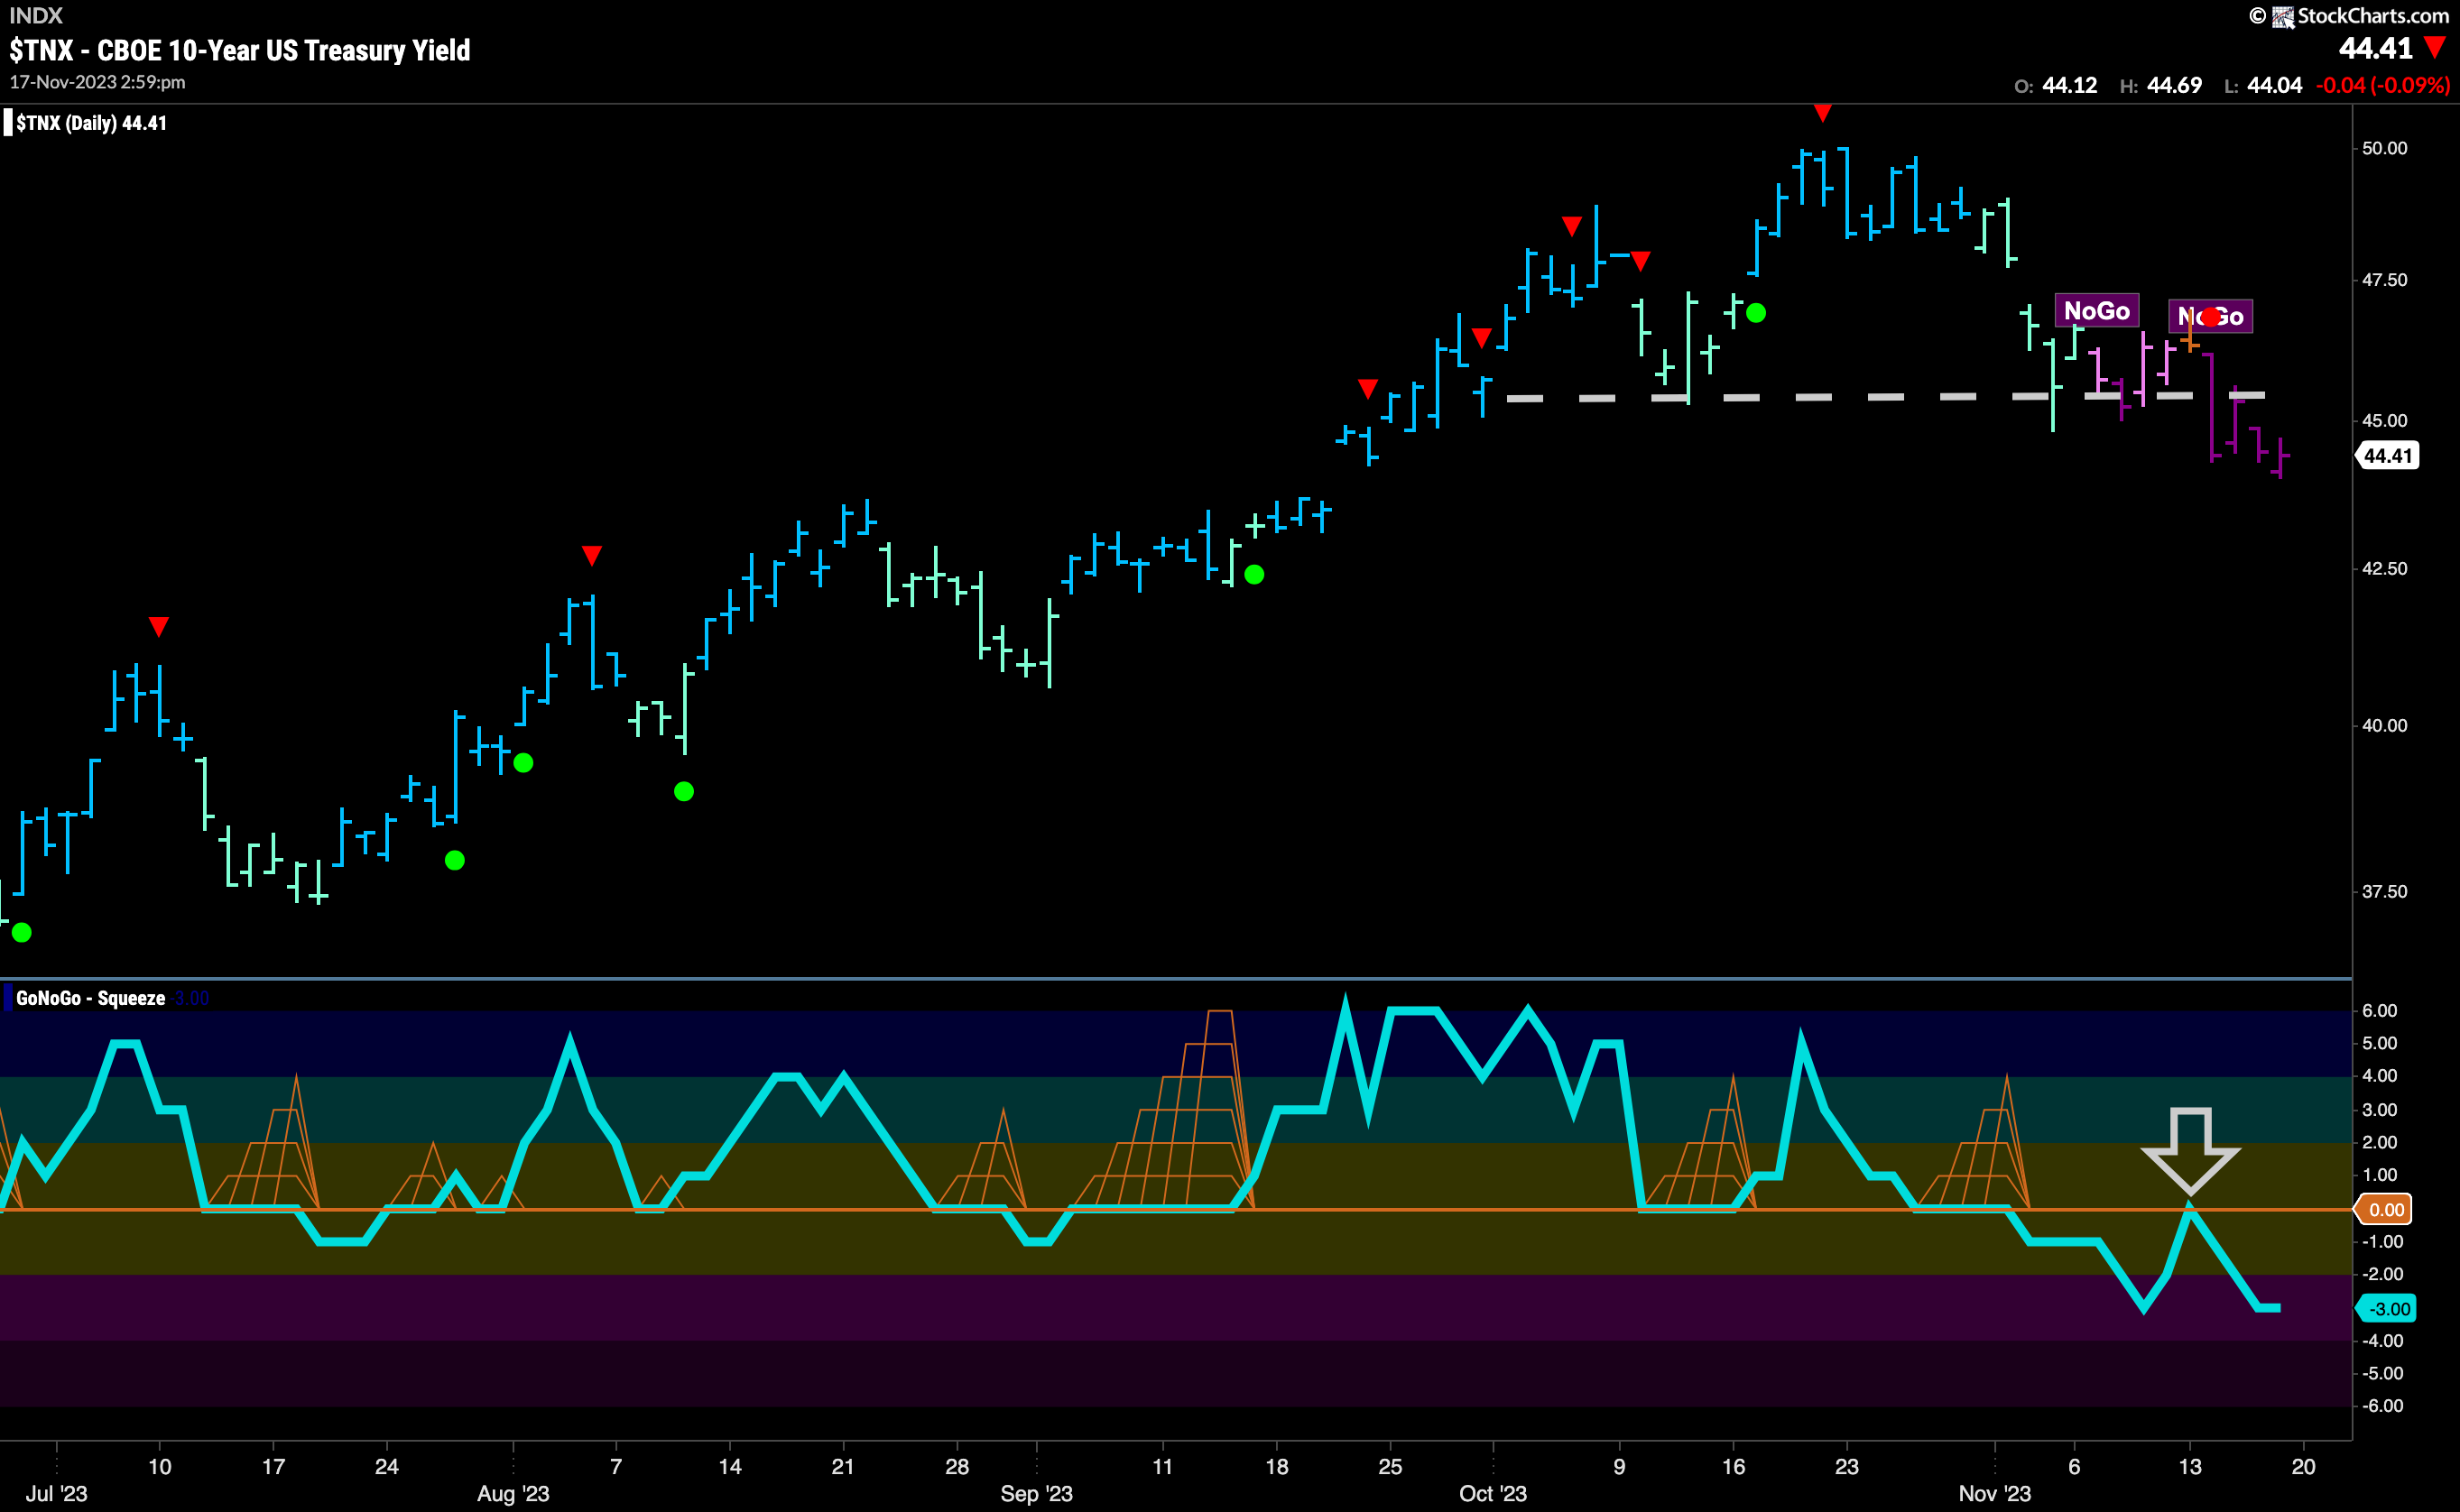
Last week we saw rates enter a “NoGo” trend but we also saw that there was some support in the form of prior lows. This week we saw those lows surpassed. GoNoGo Trend painted a string of strong purple “NoGo” bars and price broke down through support levels making a new intermediate low. This is helping provide some relief for equities. GoNoGo Oscillator got rejected by the zero line as price fell through support and now we have momentum resurgent in the direction of the “NoGo” trend so we will look to see if rates fall further.
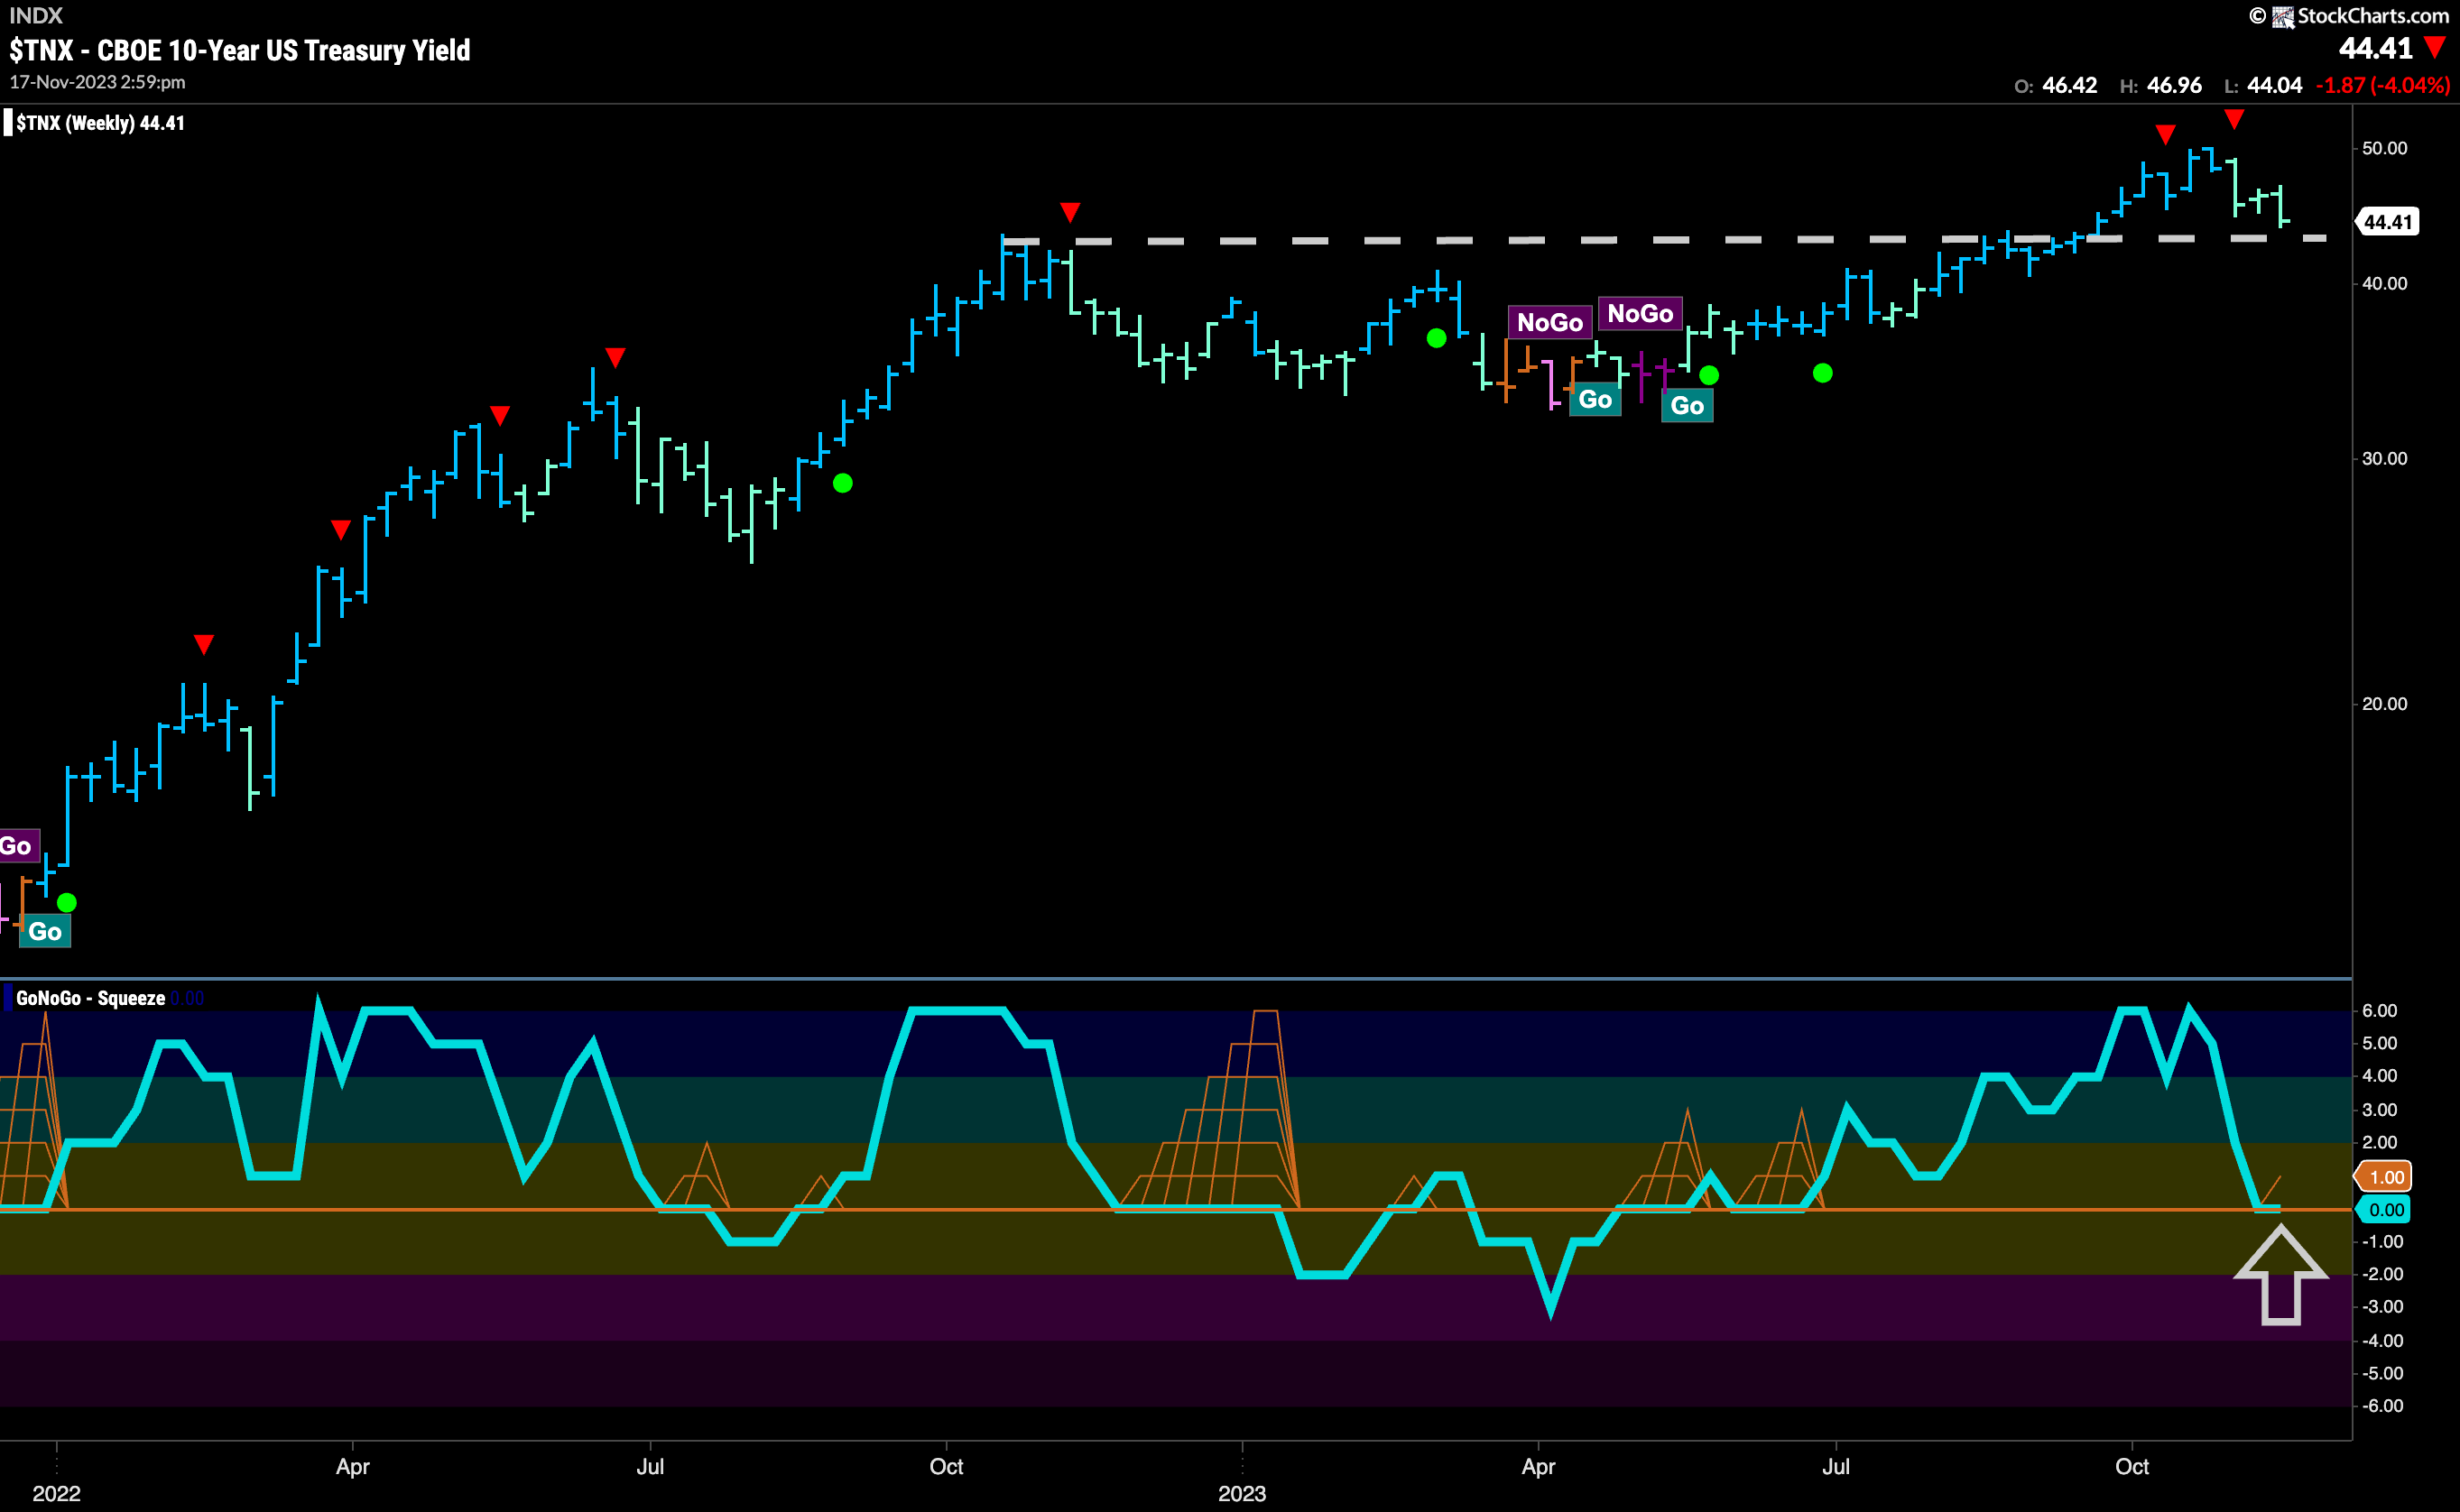
The larger timeframe chart shows us that we continue to test an even more important level for support that comes from a prior high from a year ago. Last week’s price action brought us even closer to that support and so we will watch closely this week. GoNoGo Oscillator has also remained at the zero line and it will need to hold there if the longer term trend in rates is to survive. We will be on the look out for the climbing grid of GoNoGo Squeeze as investors struggle for direction.
Dollar Succumbs to “NoGo”
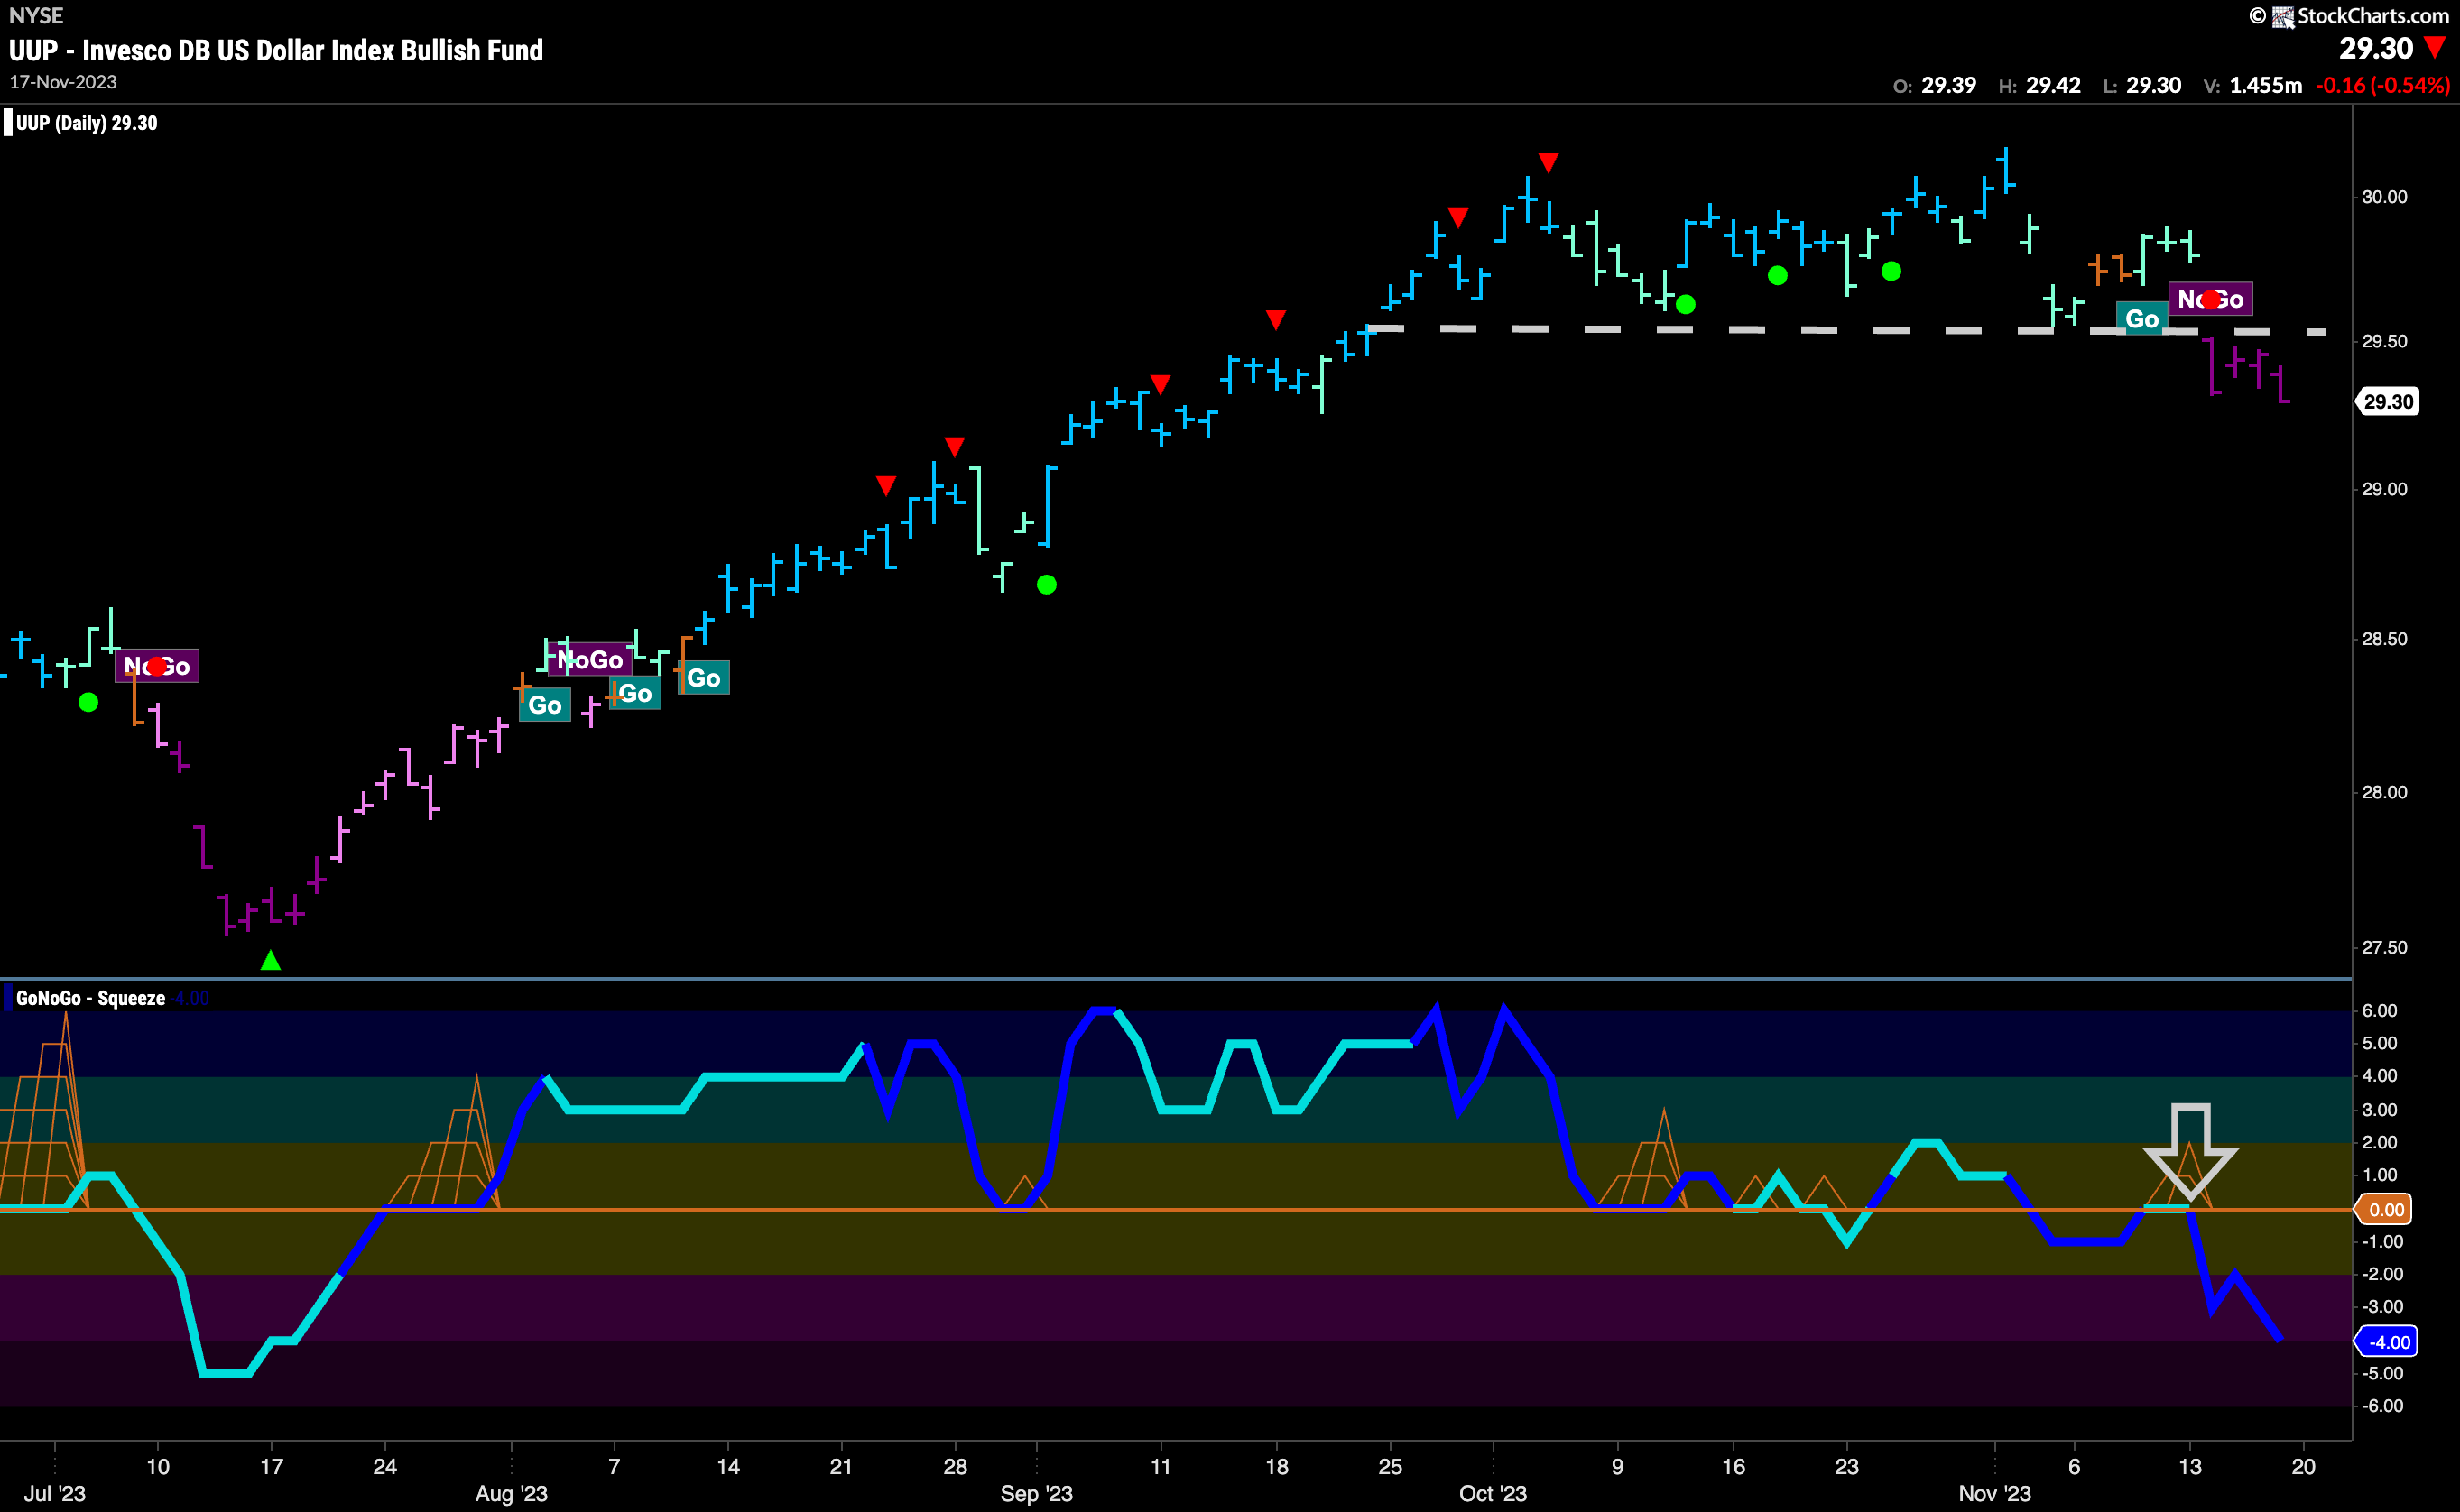
GoNoGo Trend couldn’t hang on to “Go” colors this week. As price gapped lower, it painted the first of a string of strong purple “NoGo” bars and these bars have come below what was horizontal support. Now, we are below support levels and falling. We may re test that level and find it to be resistance going forward. GoNoGo Oscillator hinted at what was to come as it dipped into negative territory and then retested for a few bars before being turned away strongly into negative territory on heavy volume.
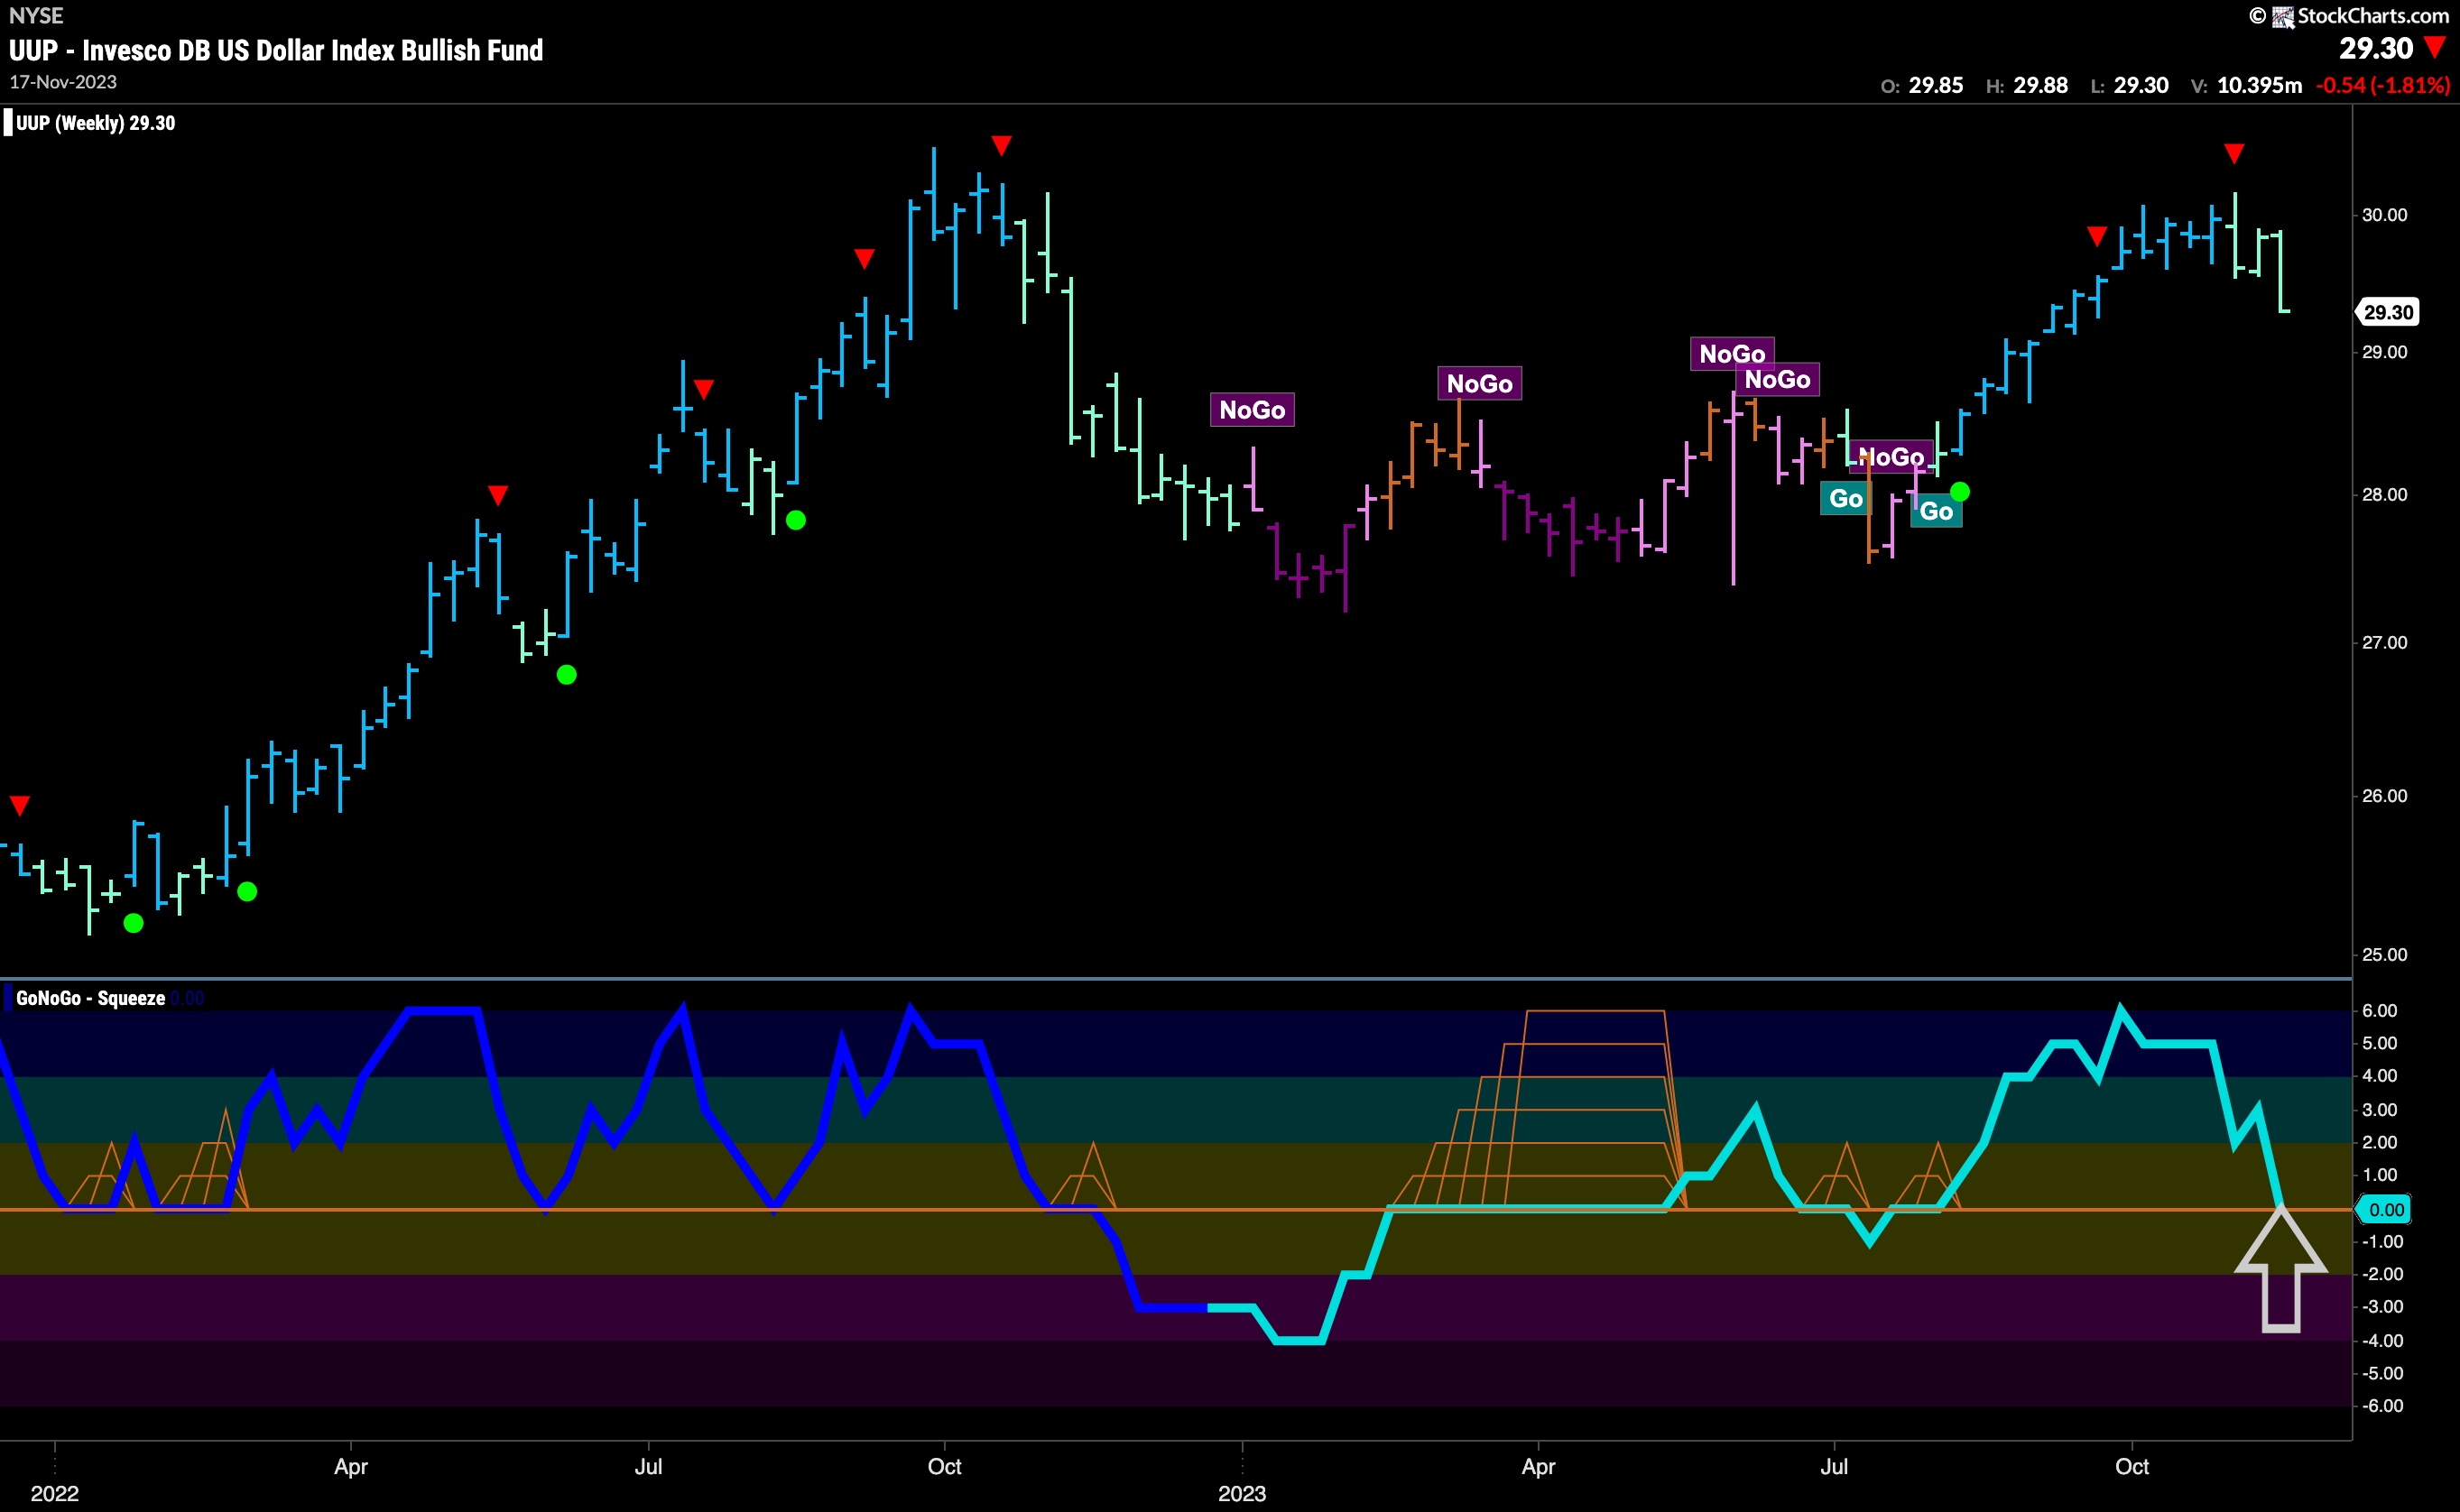
The weekly chart shows the “Go” trend is being tested. A third weaker aqua bar was painted last week and GoNoGo Oscillator has fallen to test the zero line from above. It will be critical to see what happens here. GoNoGo Oscillator must hold the zero line for the “Go” trend to have the best chance of remaining in place on this longer timeframe. Should it fall back into negative territory we would likely see further price movement lower.
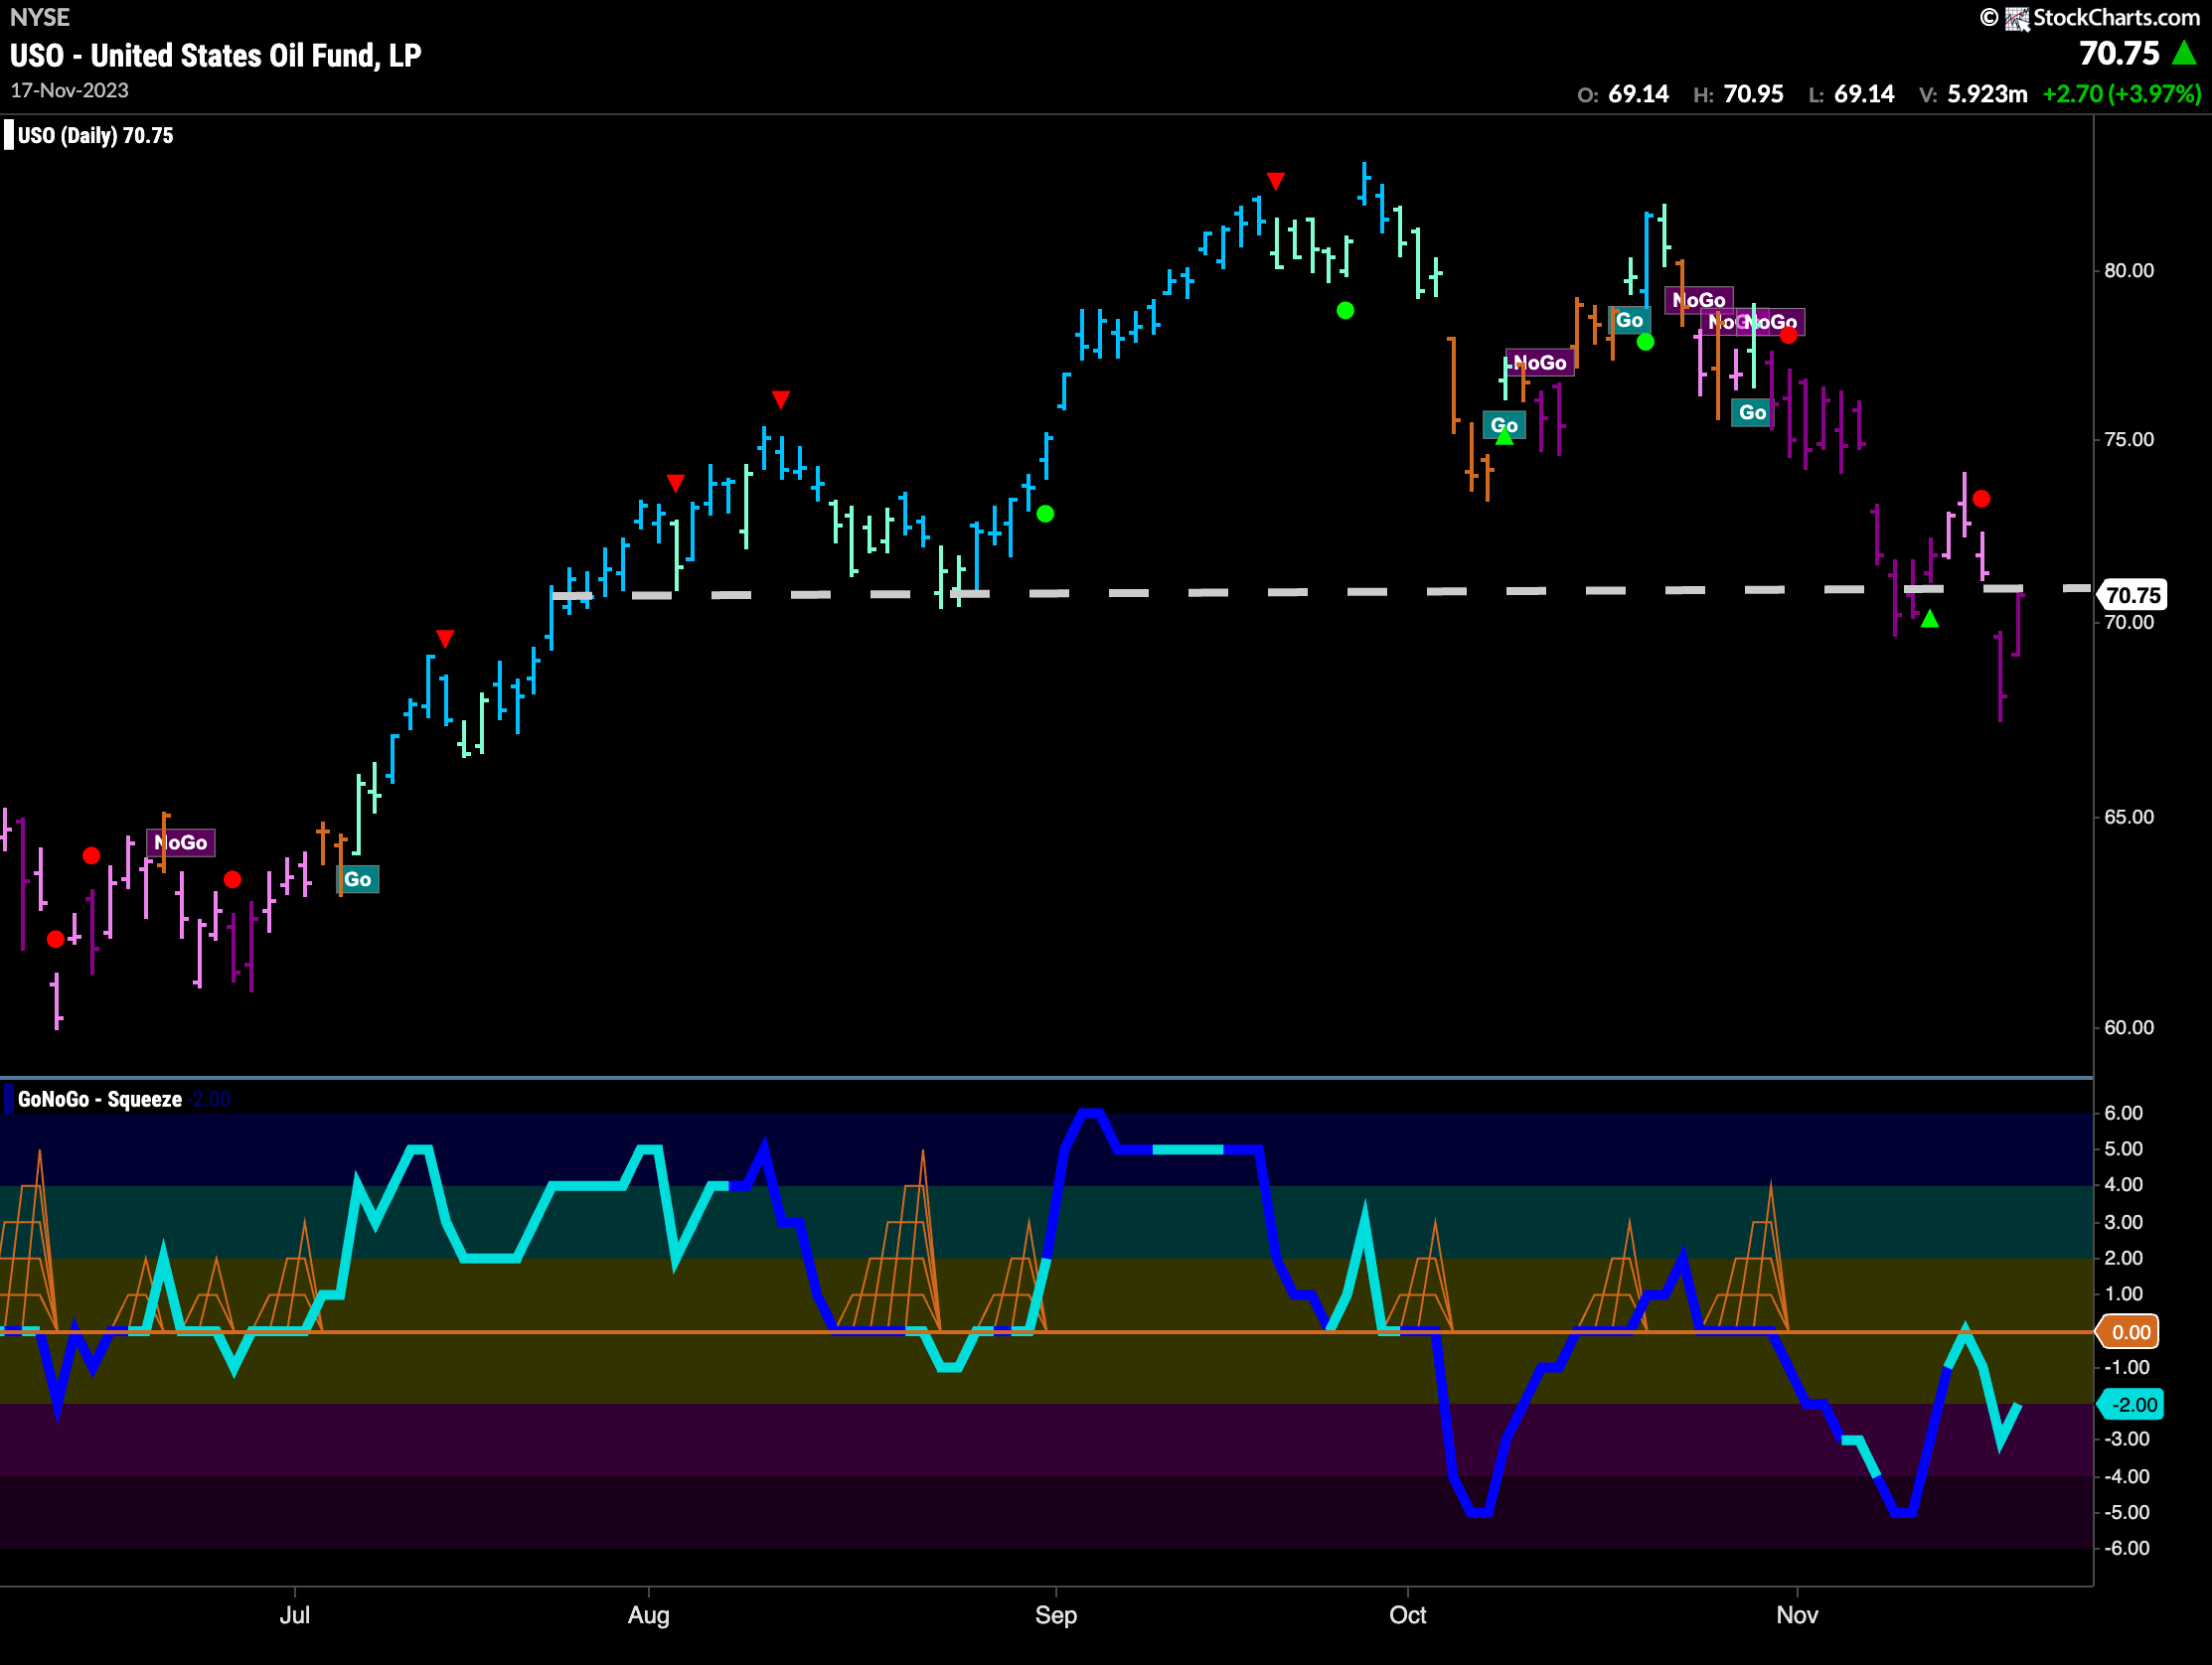
Oil Makes Another New Low
GoNoGo Trend painted more “NoGo” bar this week and the trend strengthened as price fell to new lows below horizontal support. Price is now retesting the horizontal level and we will likely see it act as resistance going forward. GoNoGo Oscillator has been rejected clearly by the zero line and is now in negative territory but not oversold.
Gold Hangs on To “Go” Trend
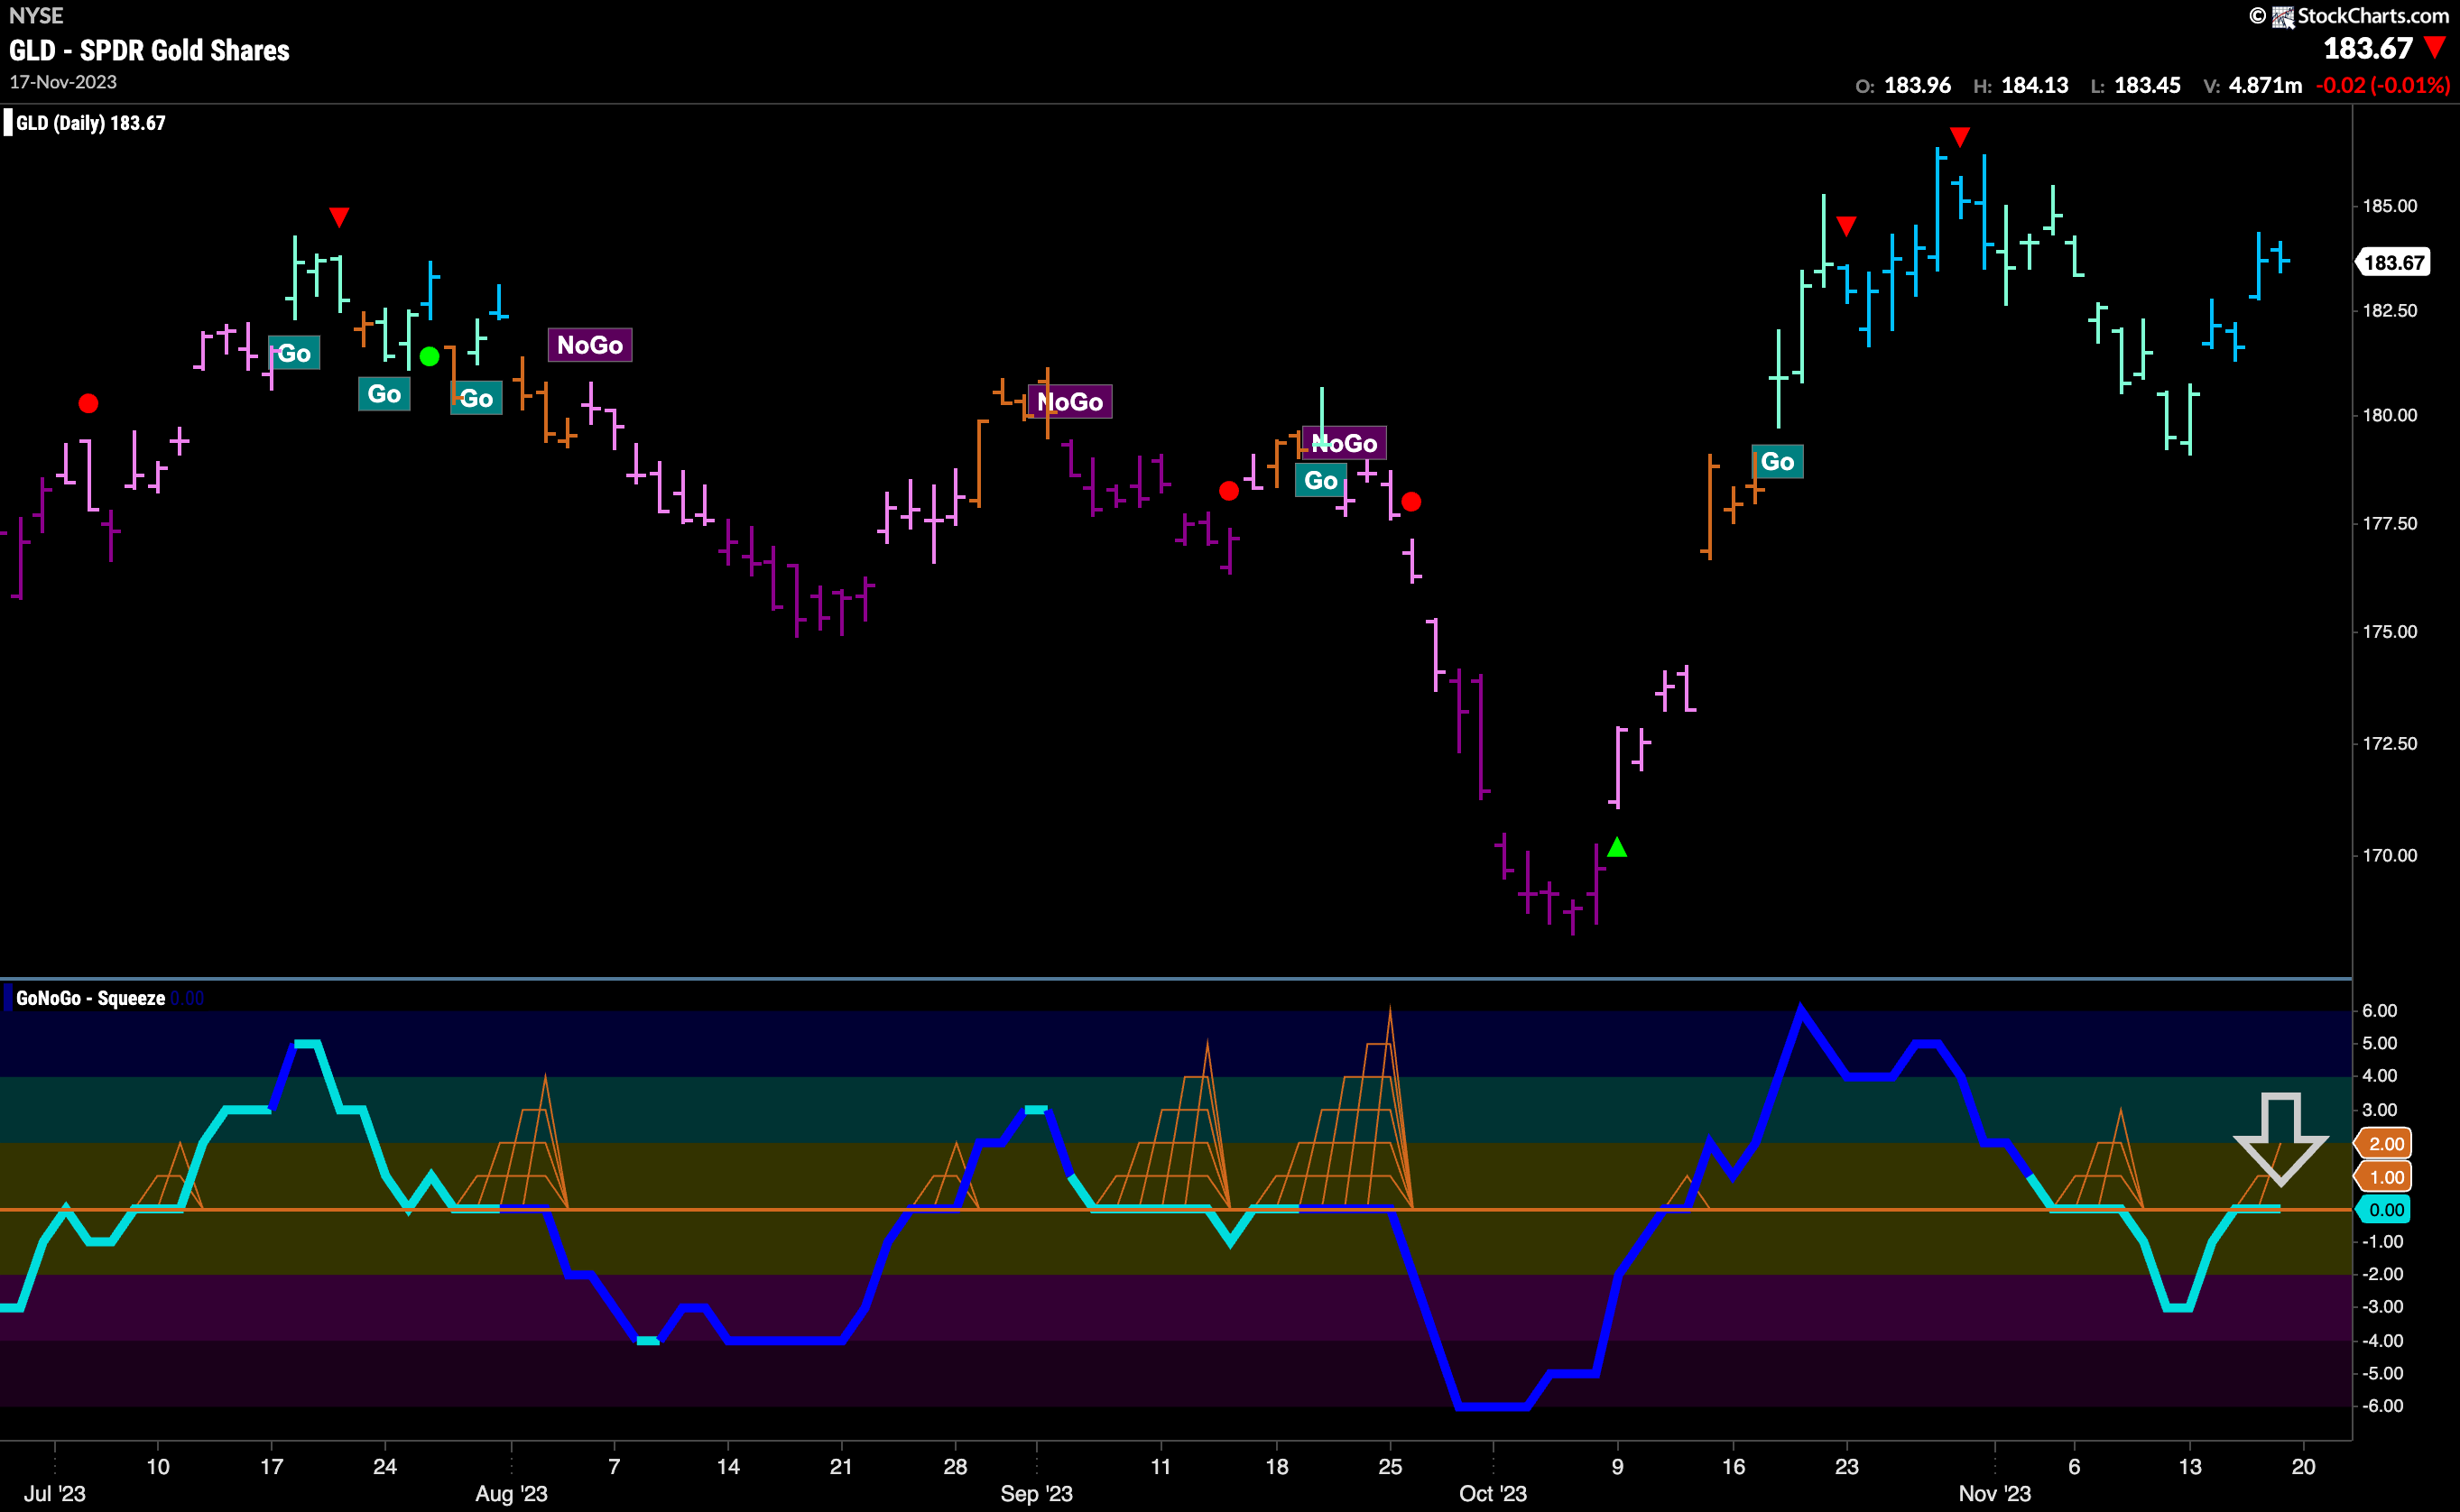
The “Go” trend survived this week as the indicator painted a string of strong blue “Go” bars and price rallied sharply from the recent low. This was enough to pull the oscillator back to the zero line in the lower panel. We will need to see GoNoGo Oscillator regain positive territory for it to confirm the “Go” trend in price. If it does this then look for price to mount an attack on the recent high. If the Oscillator falls back again into negative territory this would be a concern for the “Go” trend.
Sector RelMap
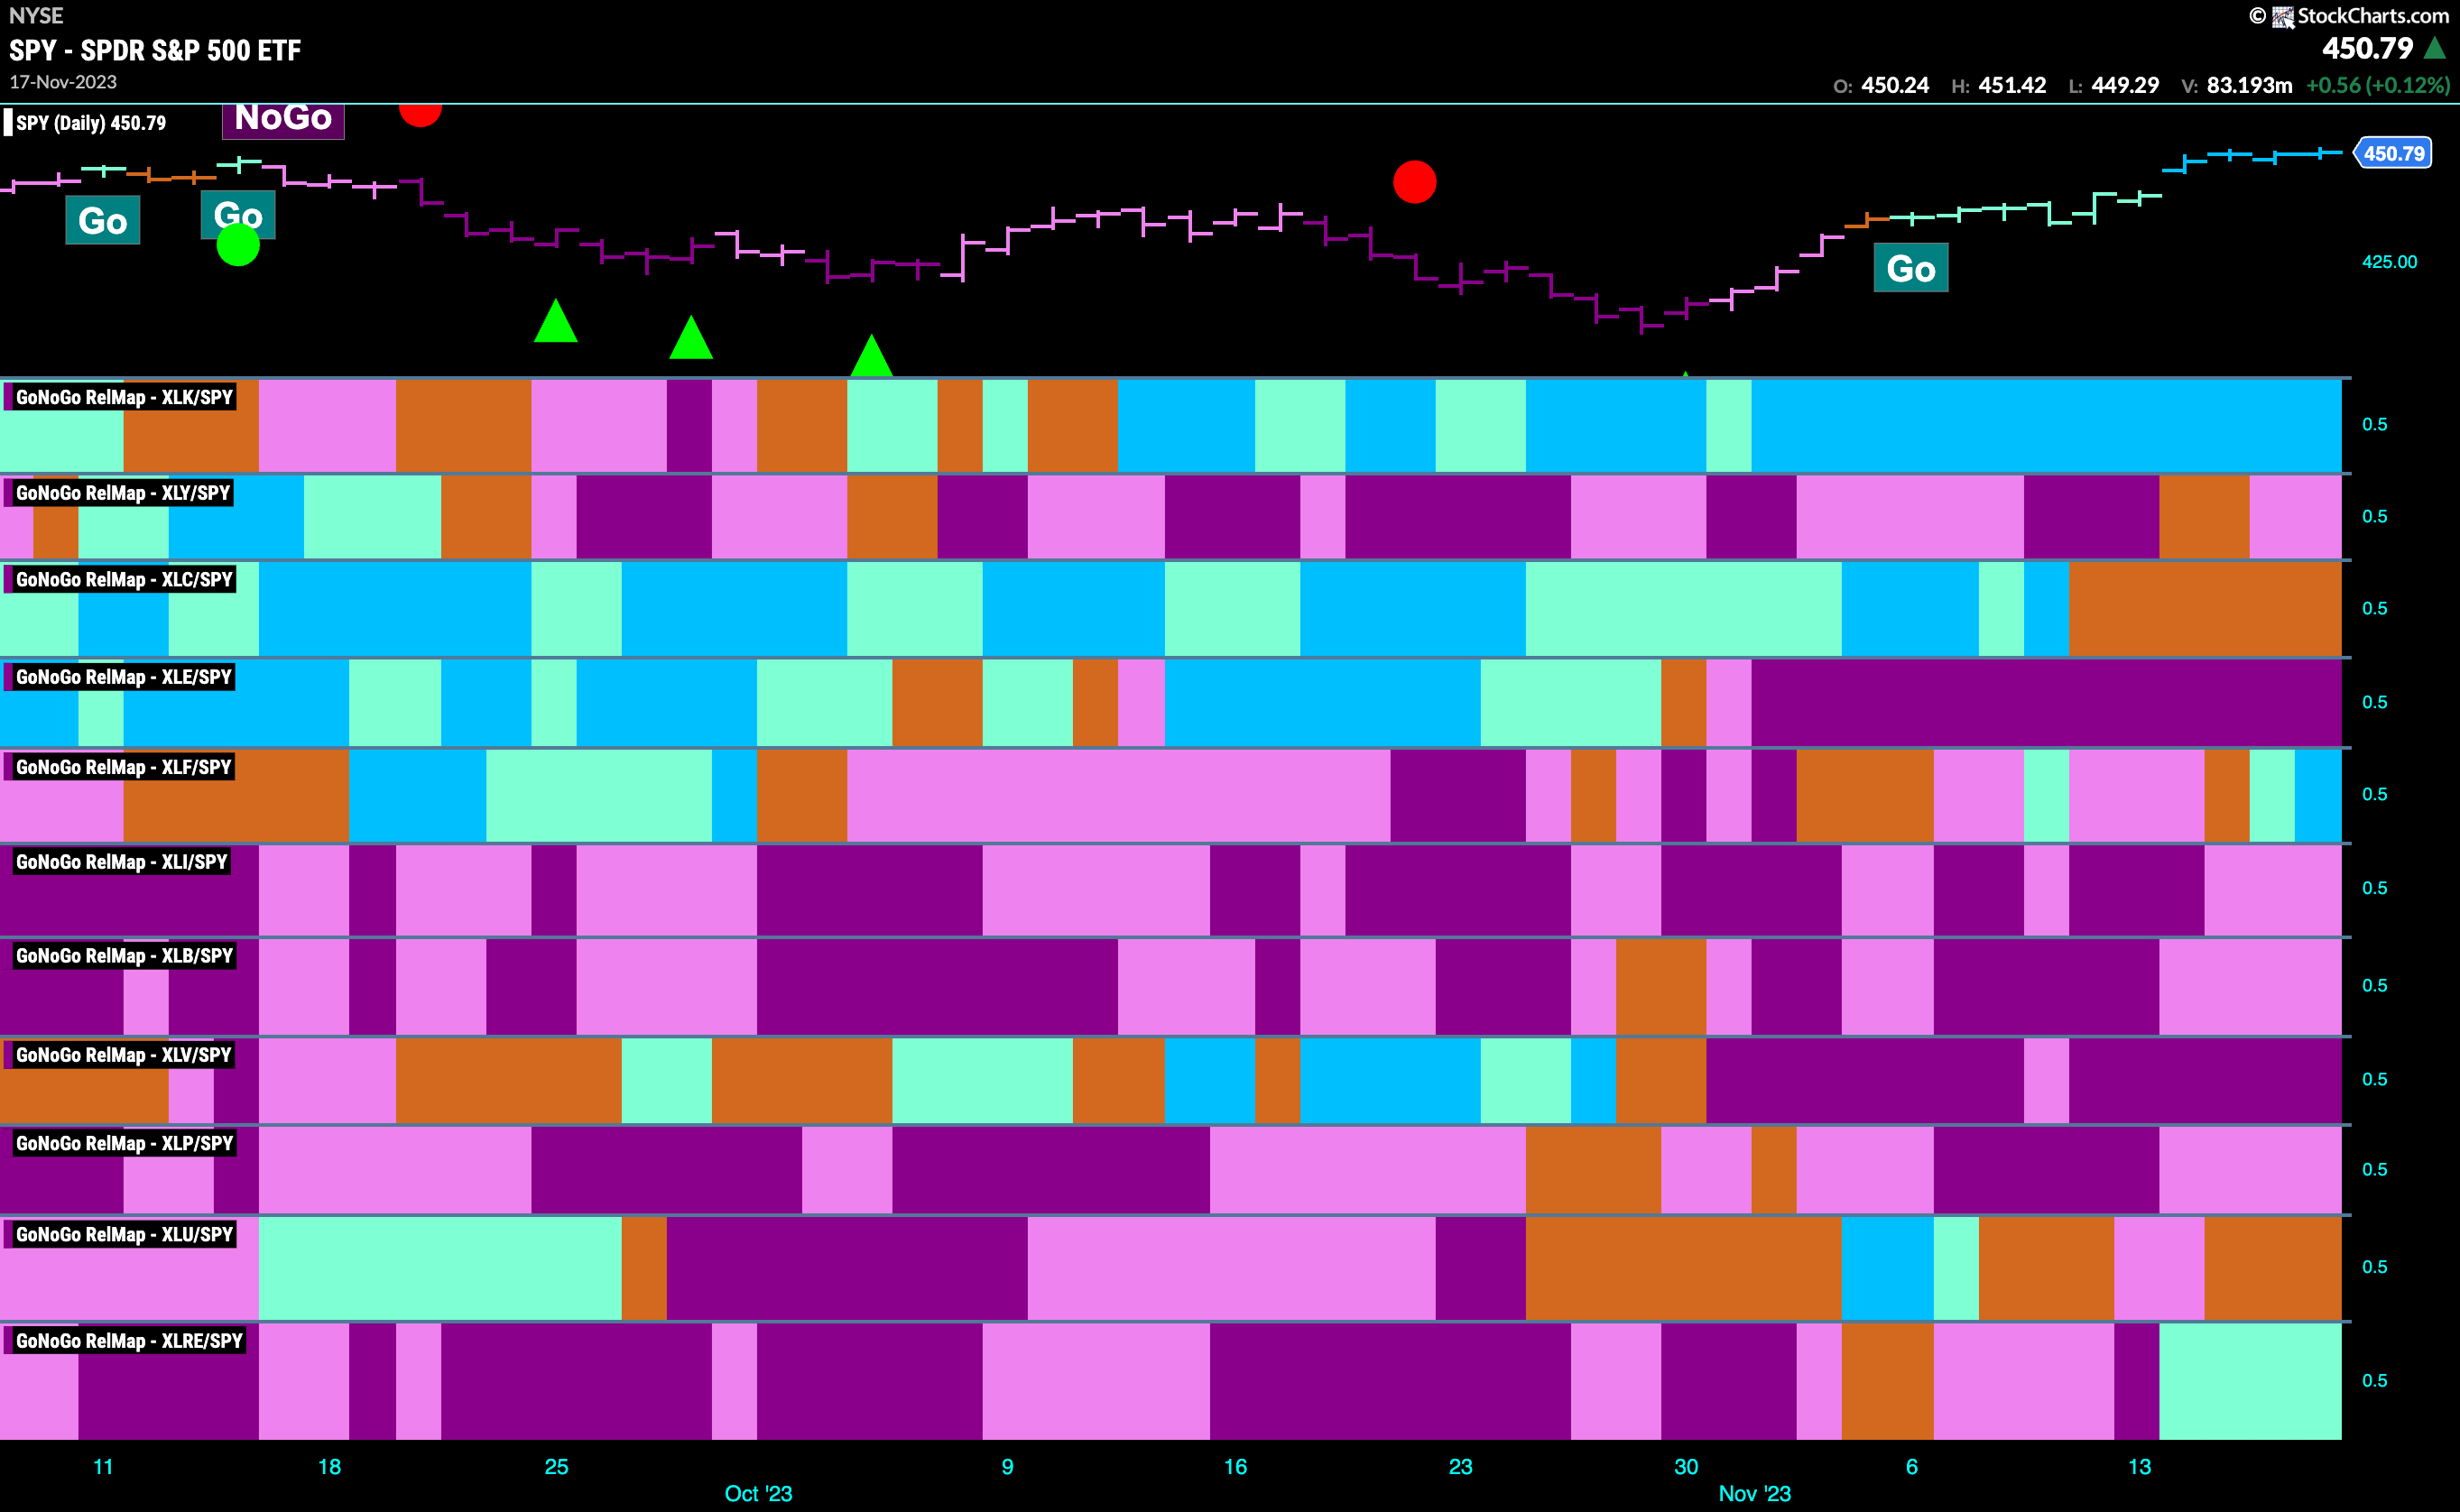
Below is the GoNoGo Sector RelMap. This GoNoGo RelMap applies the GoNoGo Trend to the relative strength ratios of the sectors to the base index. Looking at this map, we can quickly see where the relative outperformance is coming from as well as which sectors are lagging on a relative basis. 2 sectors are outperforming the base index this week. $XLK, $XLF, and $XLRE, are painting “Go” bars.
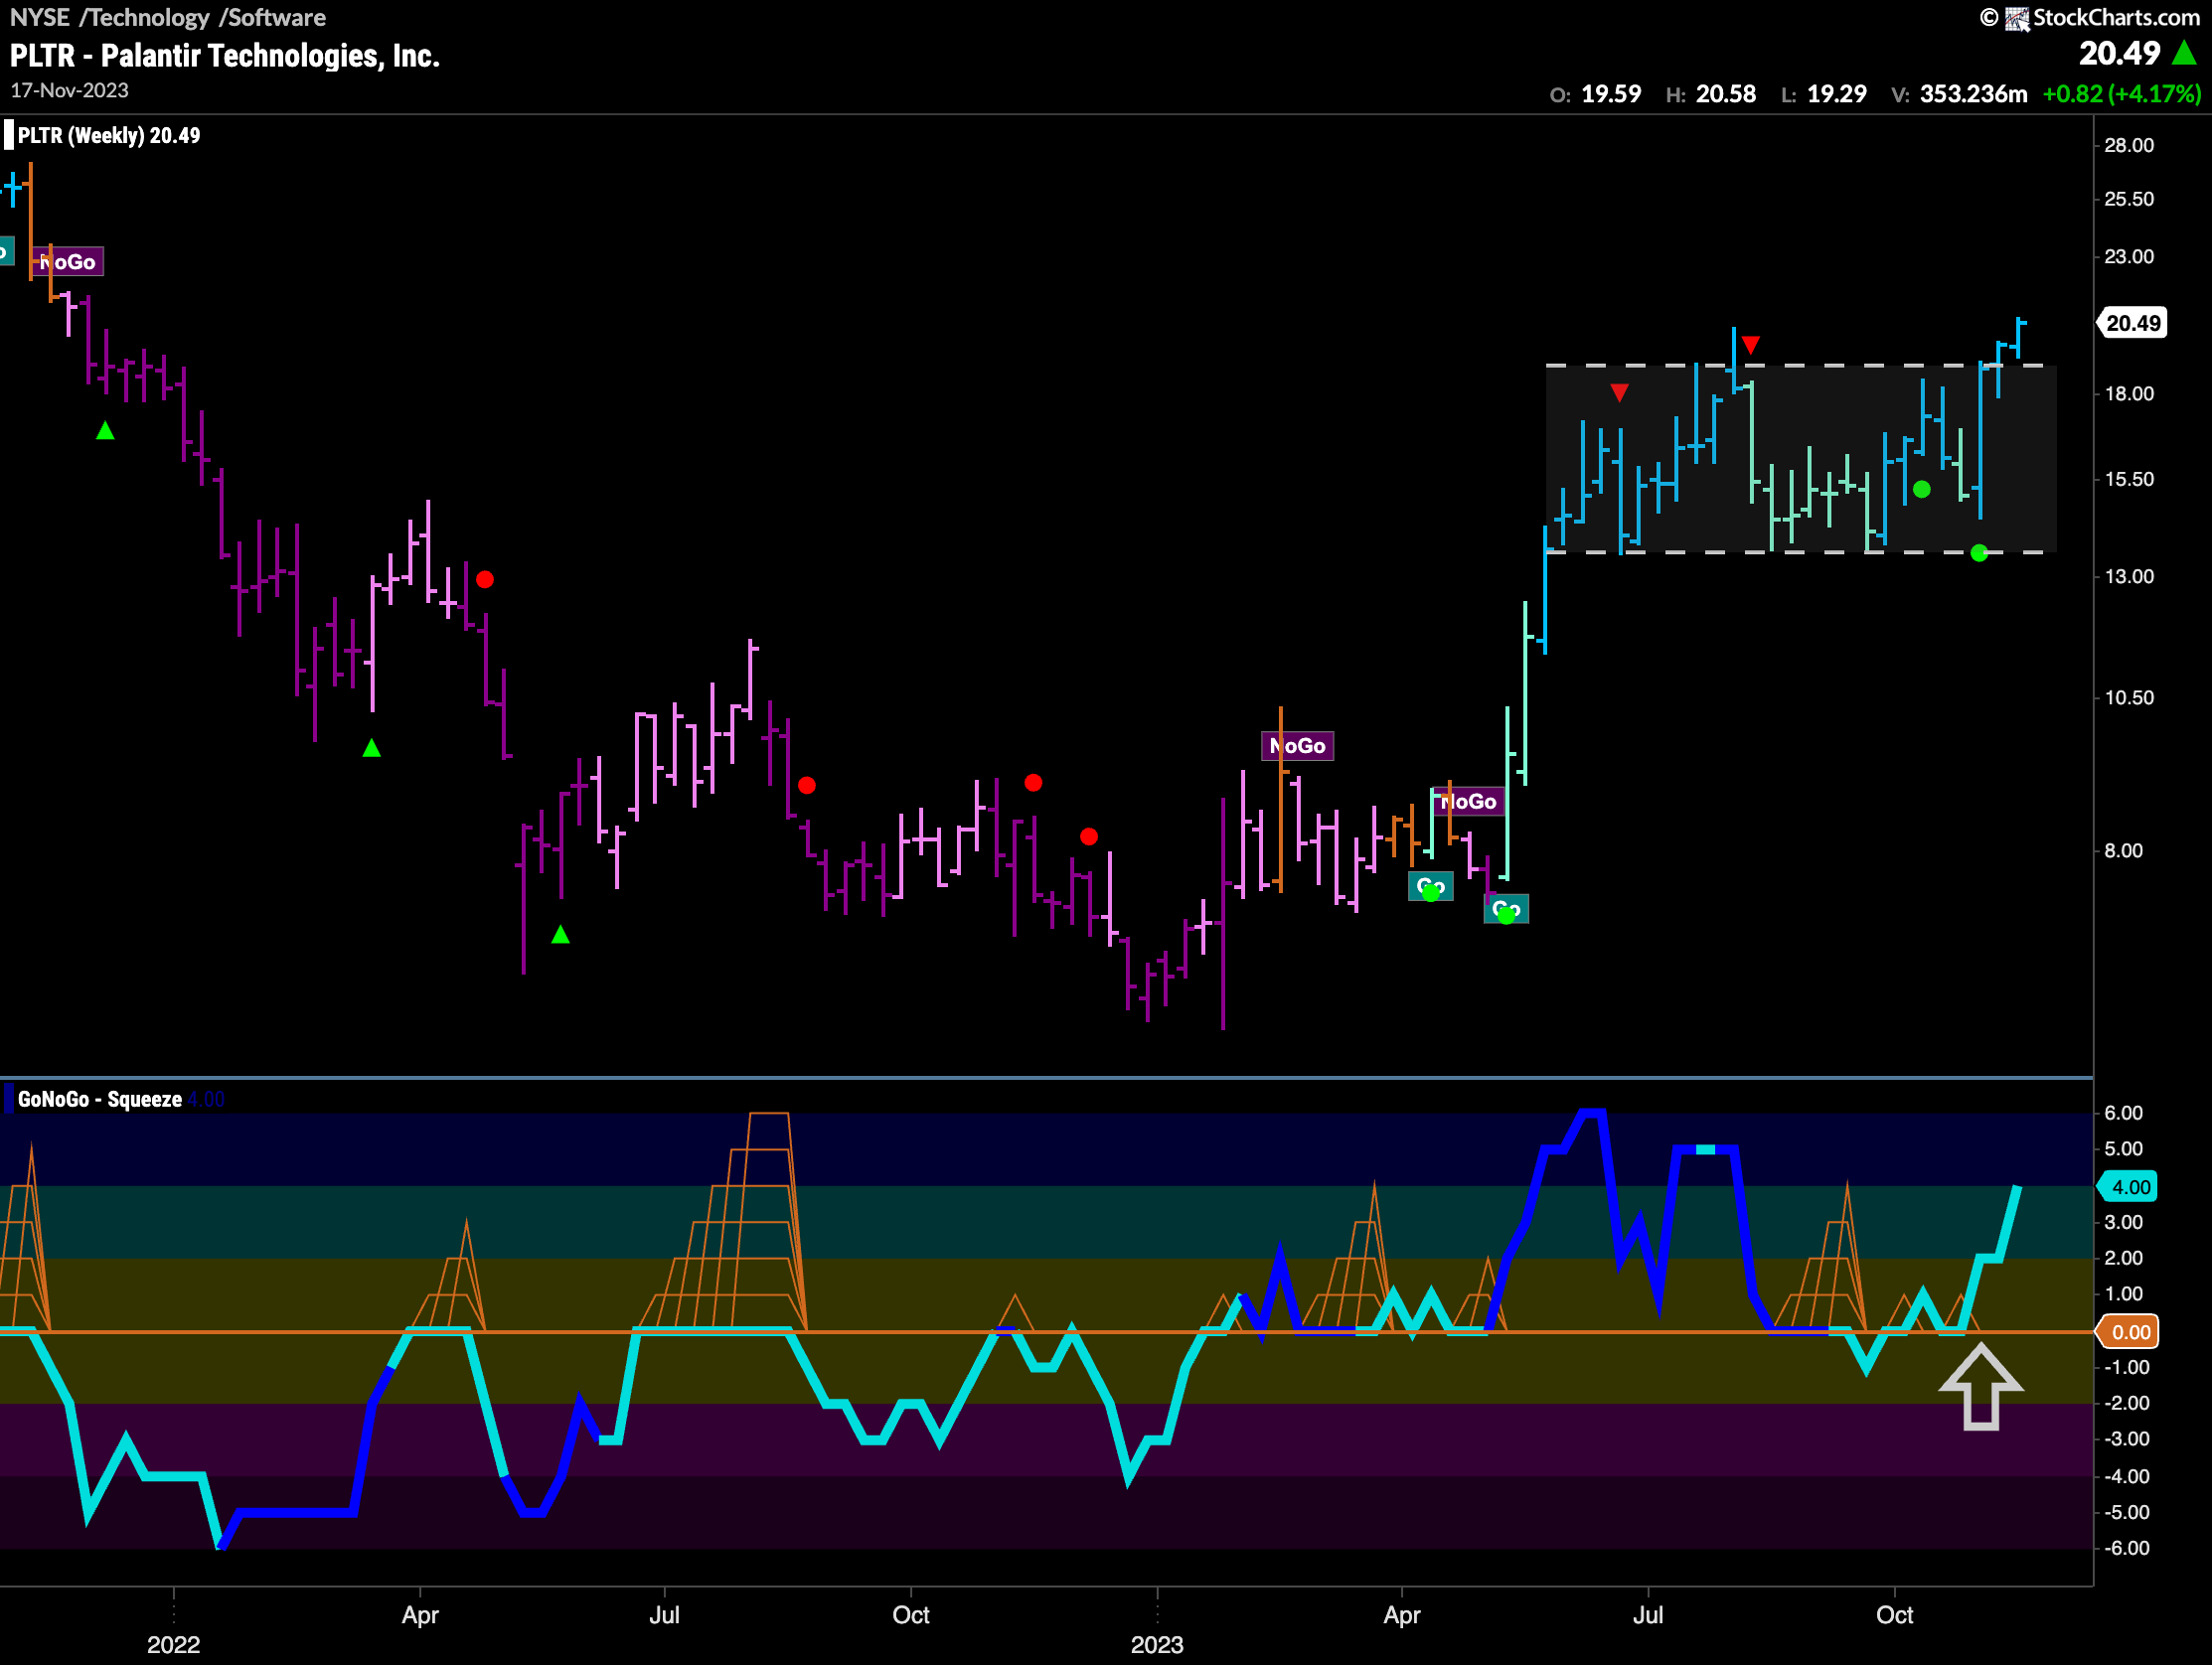
Palantir Technologies, Inc, Looks for new Highs
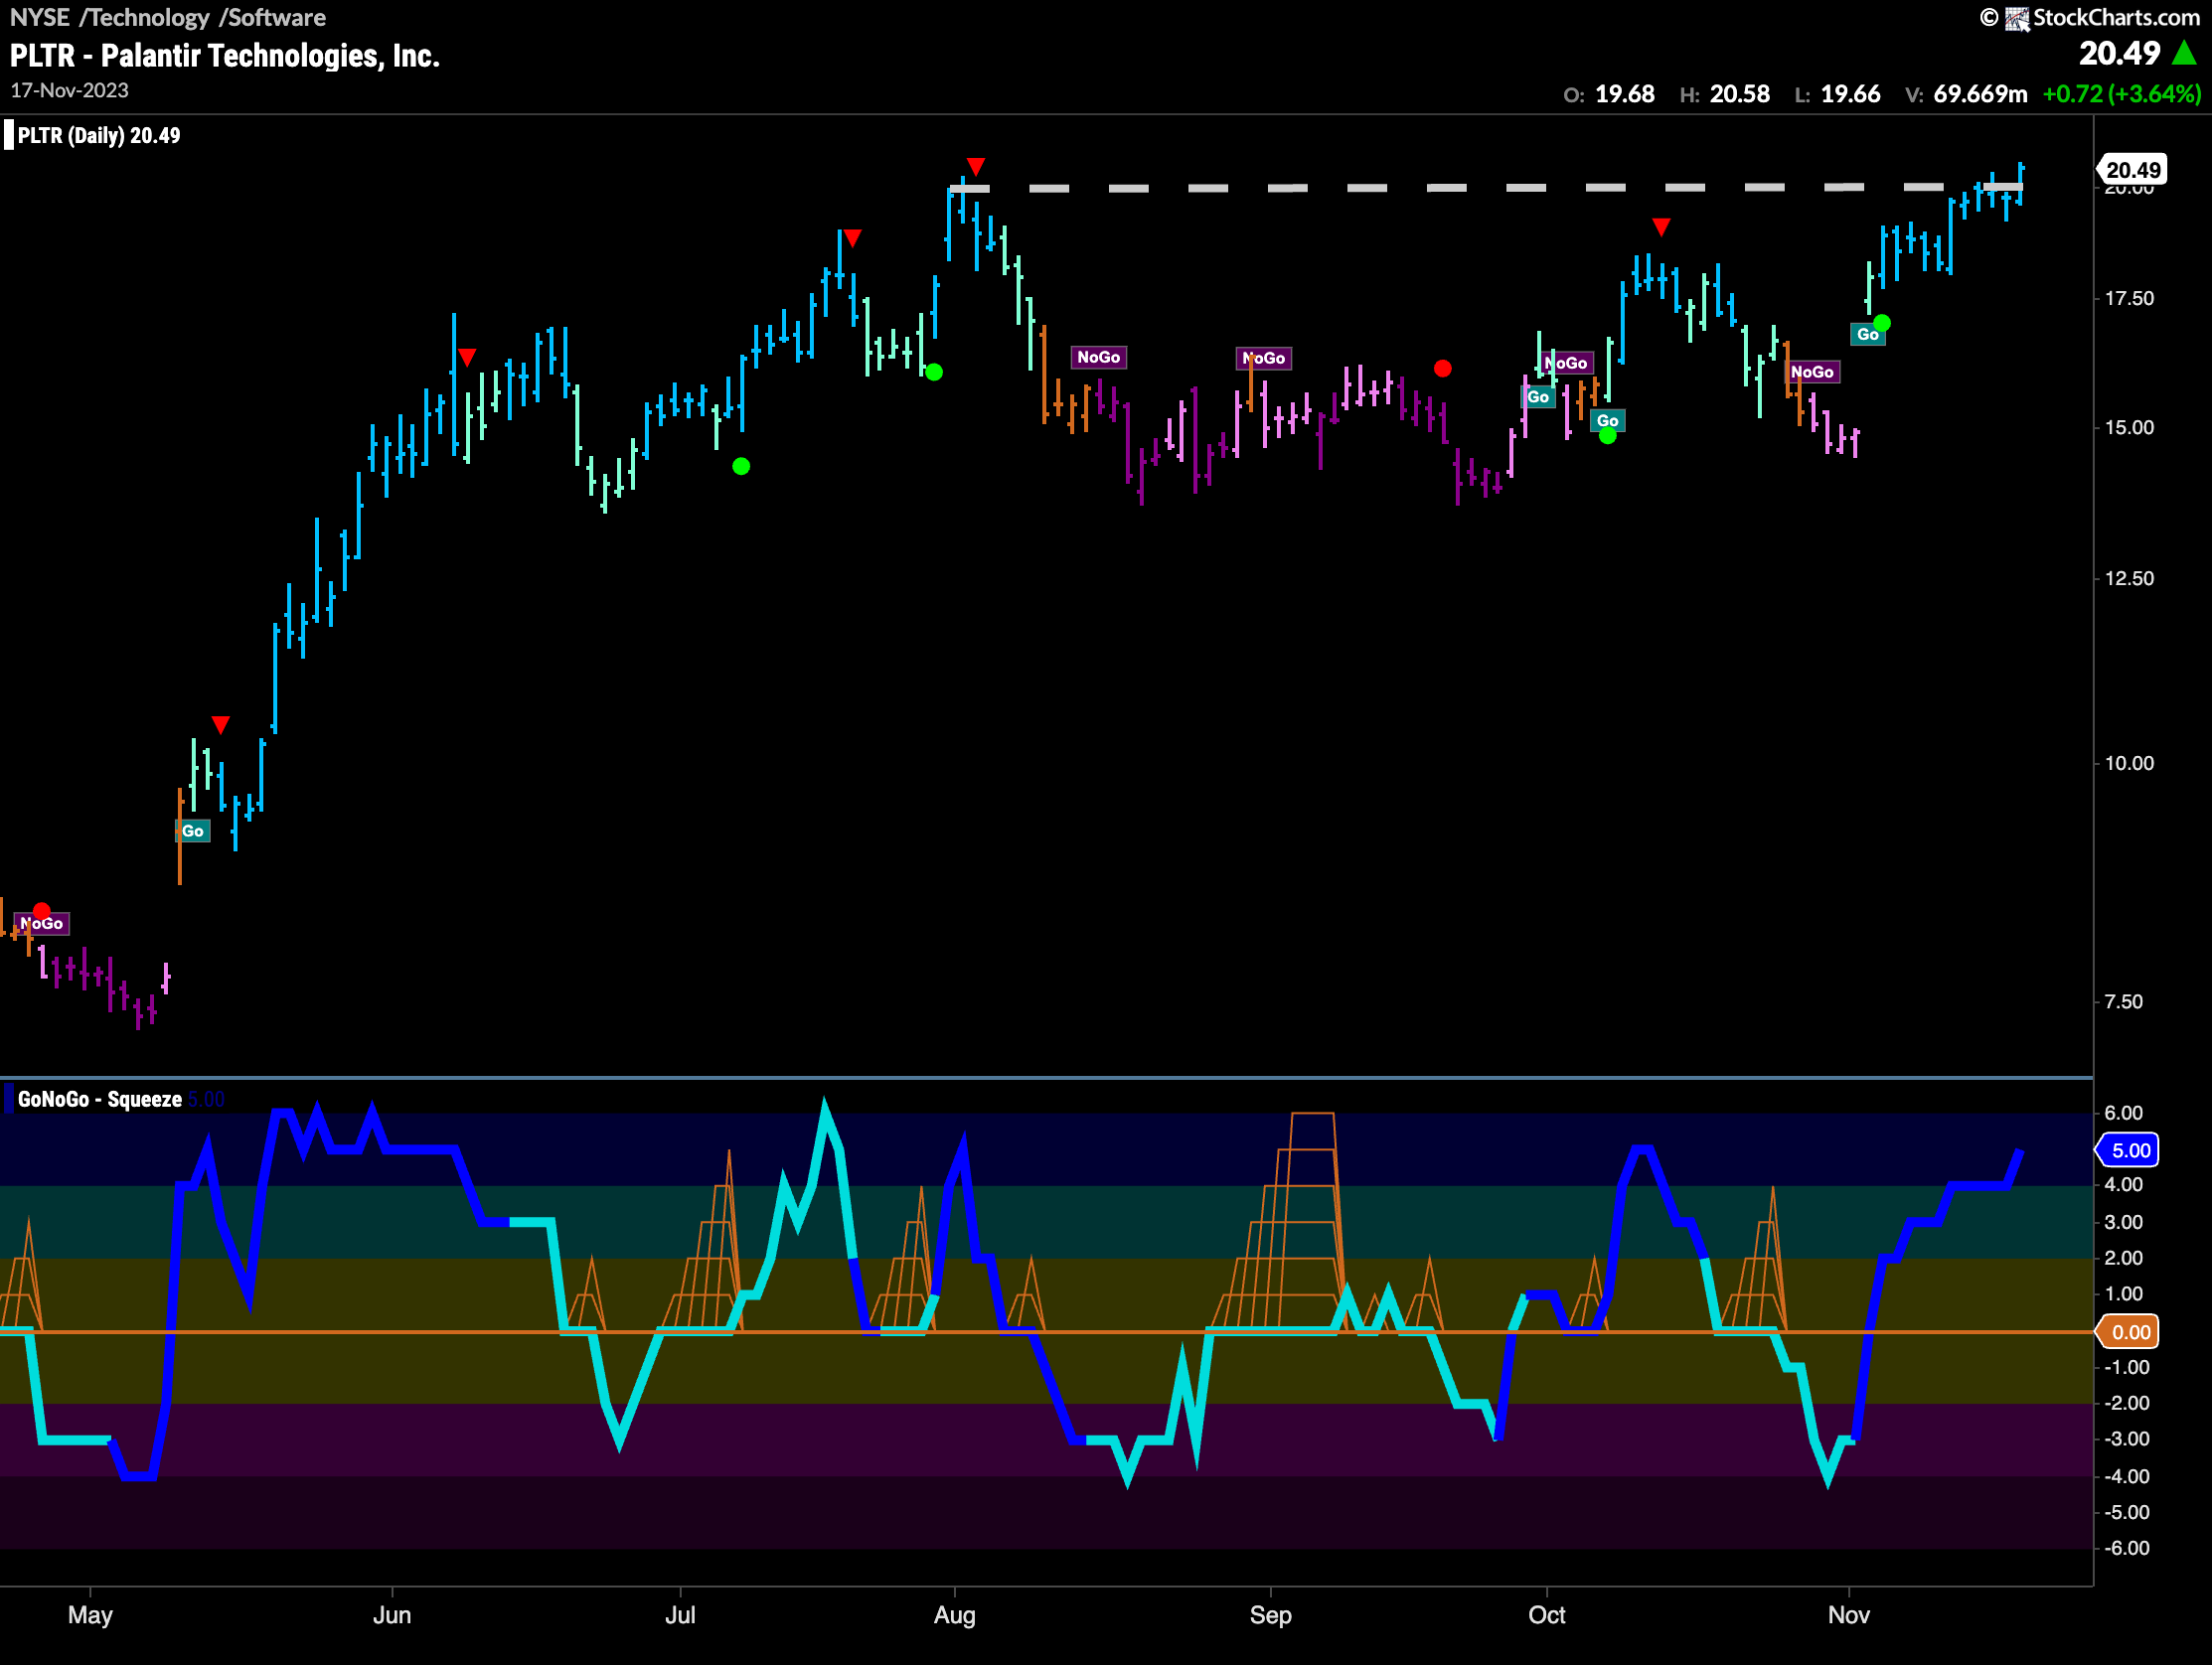
Technology continues to be the leader as we saw from the above GoNoGo Sector RelMap. $PLTR is testing resistance that comes from a prior high on the daily chart we see below. With a long run of consecutive strong blue “Go” bars it is threatening to make a new high. GoNoGo Oscillator broke into positive territory about a week ago and we can see that volume has been heavy for this stock.
The weekly chart shows that we may well be breaking out of a sideways channel to the upside. This could be a strong setup for higher prices as we have consolidated in that range for several months. As price found support several times at the lower bound of the channel we can see that GoNoGo Oscillator also found support at the zero line. This clustering of Go Trend Continuation Icons (green circles) is a favorite set up of ours at GoNoGo Charts as it shows repeated pushes by momentum in the direction of the underlying trend. We will look for price to consolidate above the upper bound and kick on higher.
What About Real Estate?
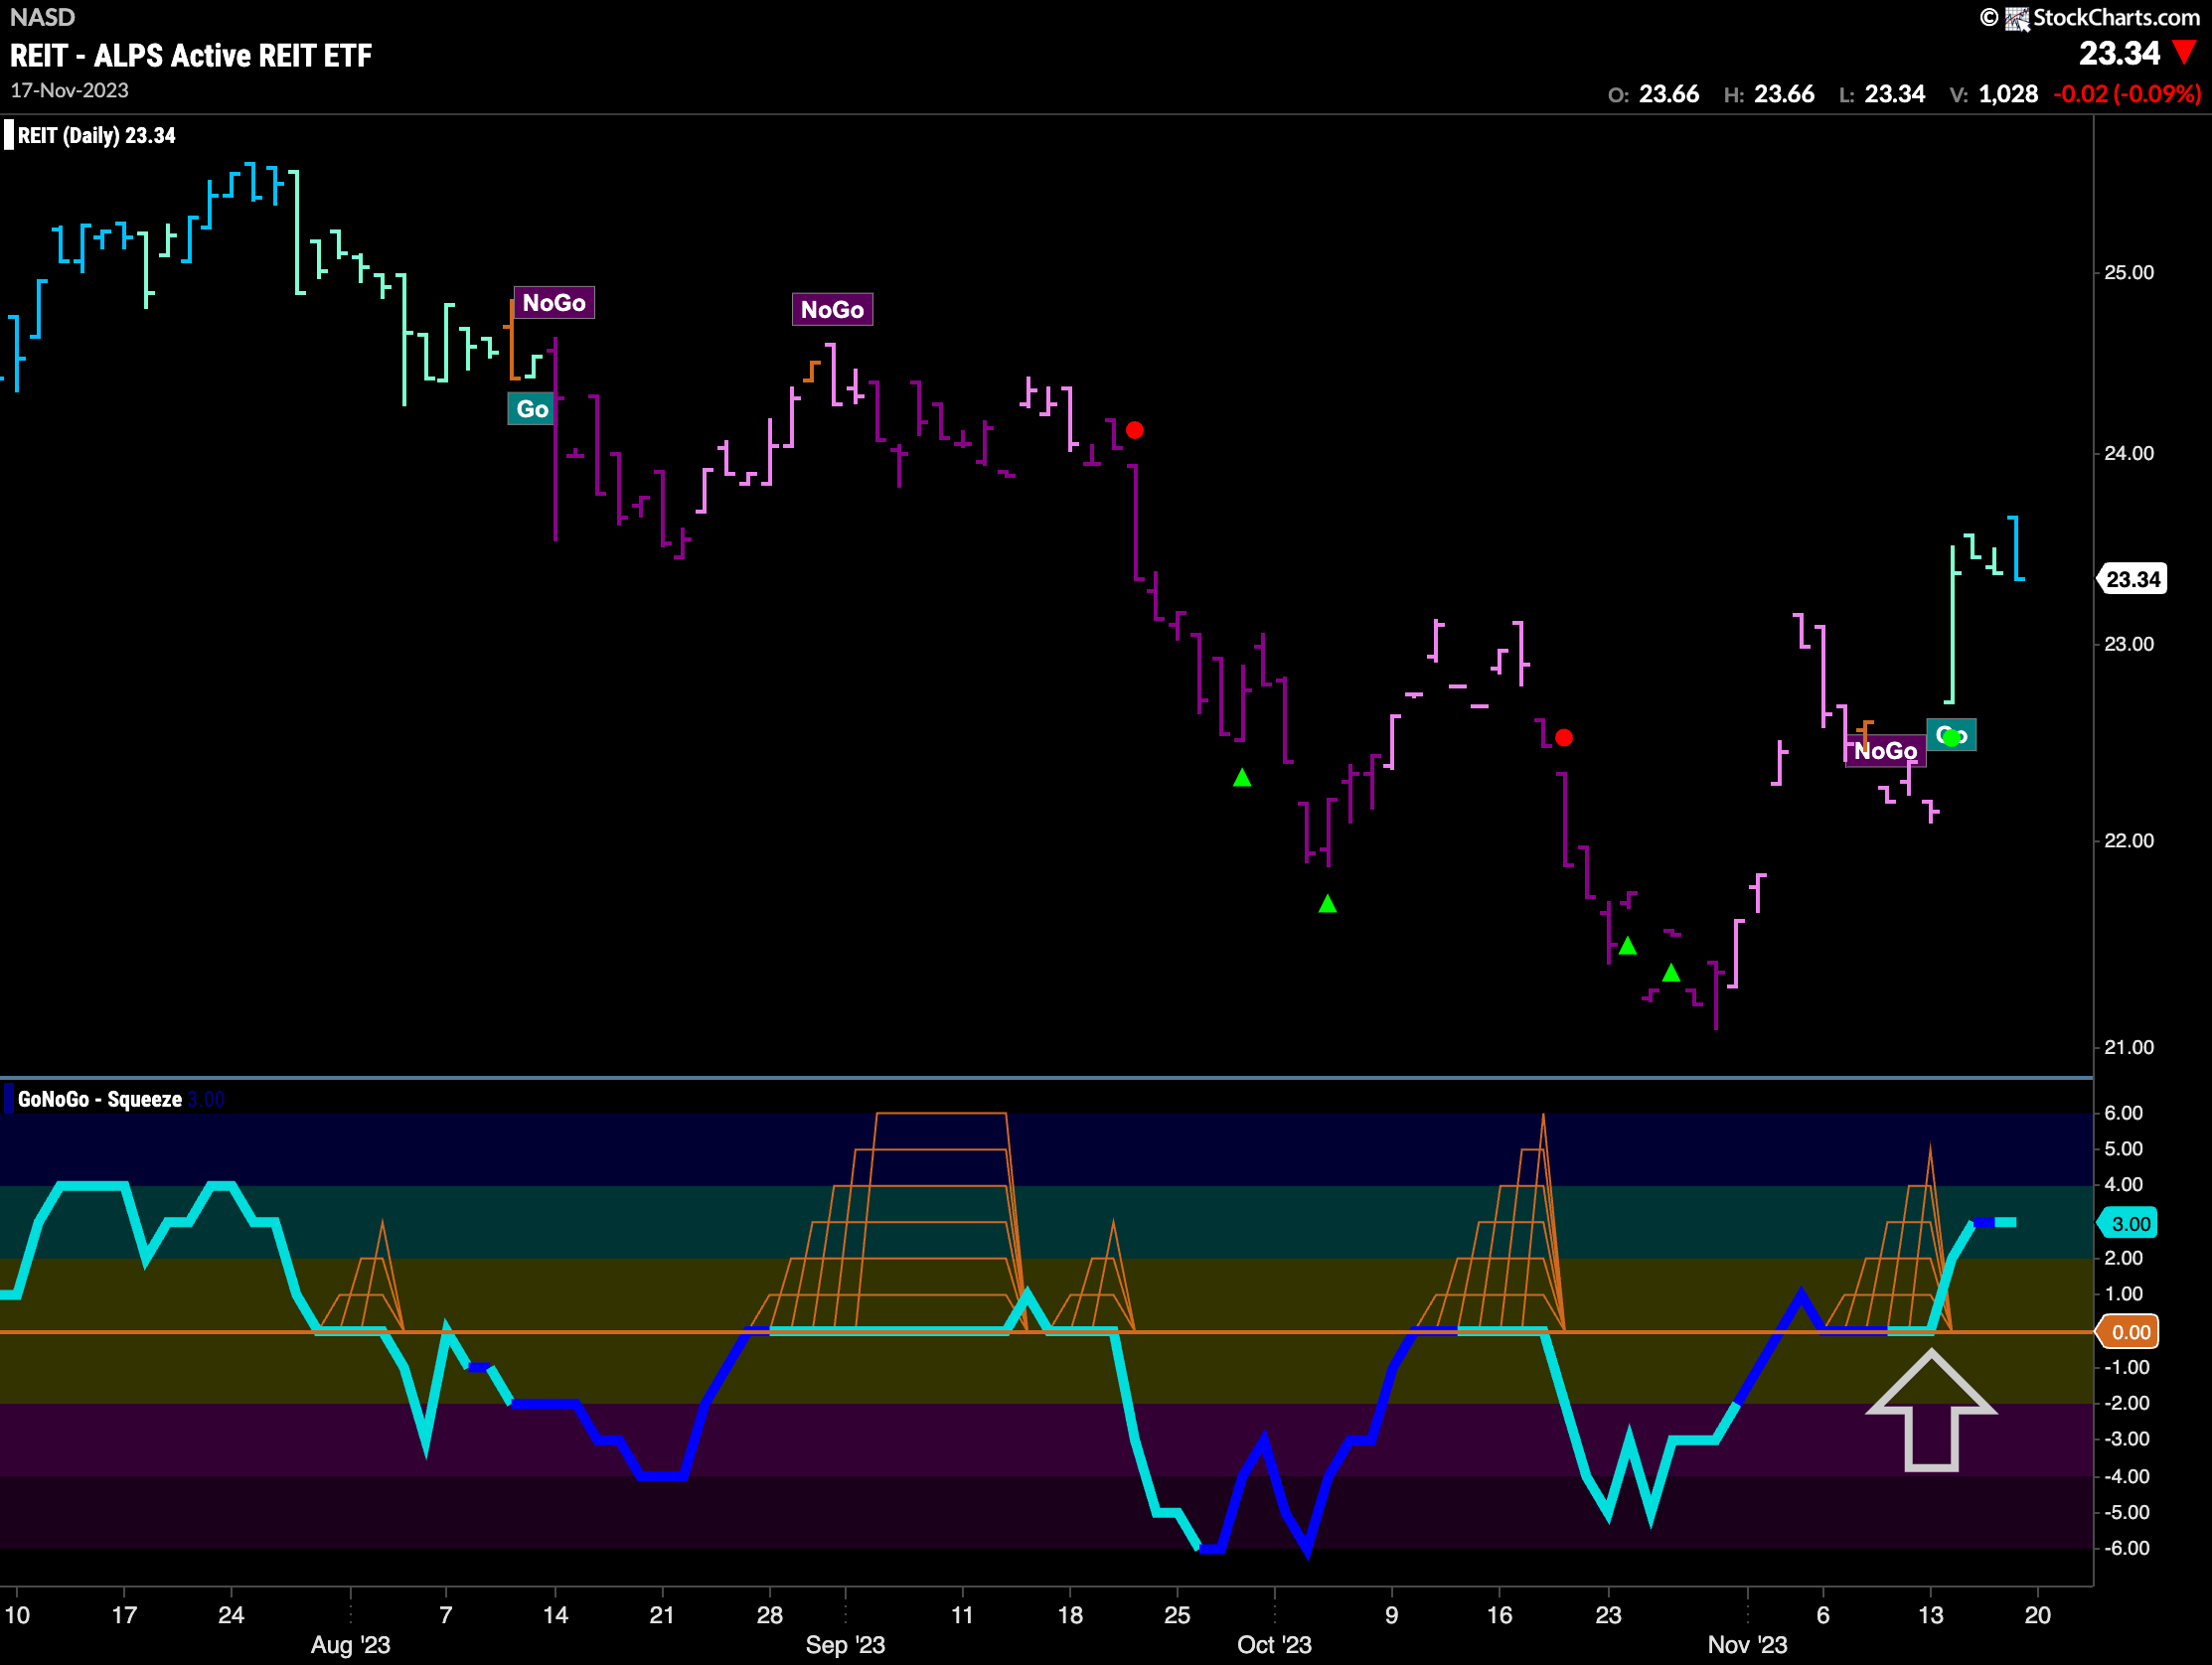
A new entry to the leadership race we saw on the GoNoGo Sector RelMap was the Real Estate index. Below is the chart of $REIT with daily prices. We can see that after several months of lower lows and lower highs and a strong “NoGo” trend, we have a changing technical environment. GoNoGo Trend has painted almost a weaker of “Go” colors as price makes its first higher high, after a first higher low. GoNoGo Oscillator seems to be supporting this move as it has found support at the zero line breaking out of a GoNoGo Squeeze into positive territory. With momentum surging in the direction of the “Go” trend we will look for higher prices still.
