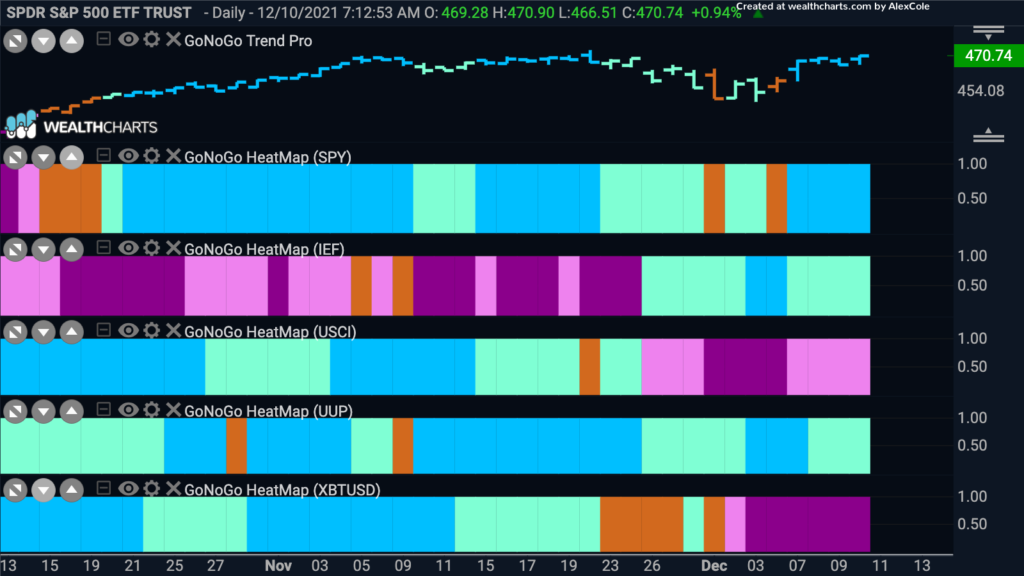
Good morning and welcome to this week’s Flight Path. We are now well into December and equities have recovered from the violent drop that followed Thanksgiving. The S&P 500 is up on the month and testing all time highs. The “Go” trend in the dollar persists and we have seen this in conjunction with commodities rolling over into a “NoGo”. Commodities historically struggle with a strong dollar as generally speaking commodities are priced in greenbacks. Bitcoin remains in a “NoGo” as price tries to find a floor between 45,000 and 50,000.
Sector Strength
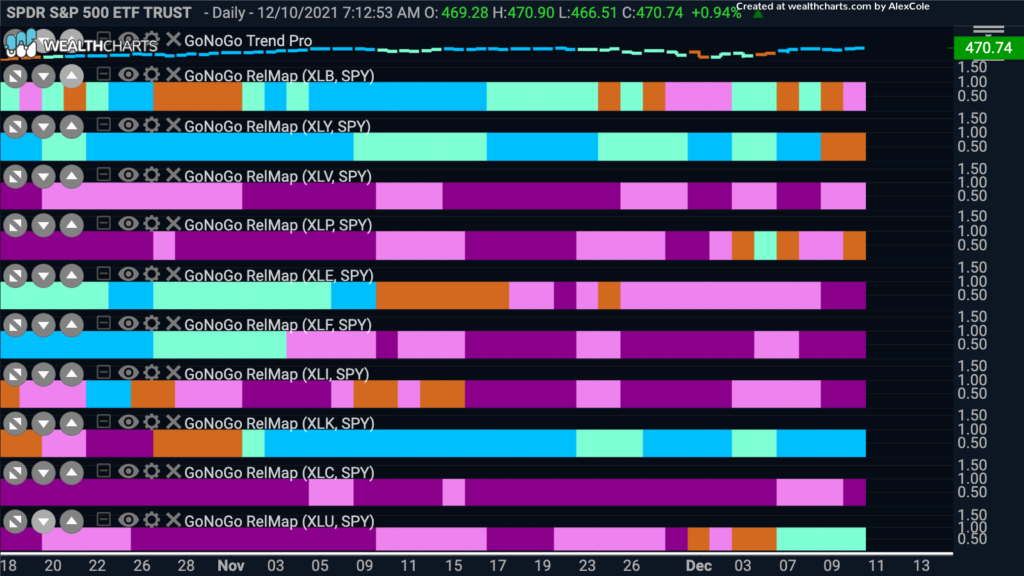
Below is a GoNoGo Sector RelMap. The chart applies the GoNoGo Trend to the relative ratio of each sector ETF to the base ETF, the $SPY. We saw from the GoNoGo Asset Map above that large cap equities in the U.S. have resumed their “Go” trend and are threatening all time highs. Where is the leadership coming from? What does the internal breadth look like from a sector perspective? Below we can see that only two of the sectors are in “Go” trends on a relative basis. Technology has been outperforming for over a month but this week it is utilities that are in a new “Go” trend. Discretionary, which had been strong for some time, paints a string of amber “Go Fish” bars.
$SPY Spies New High?
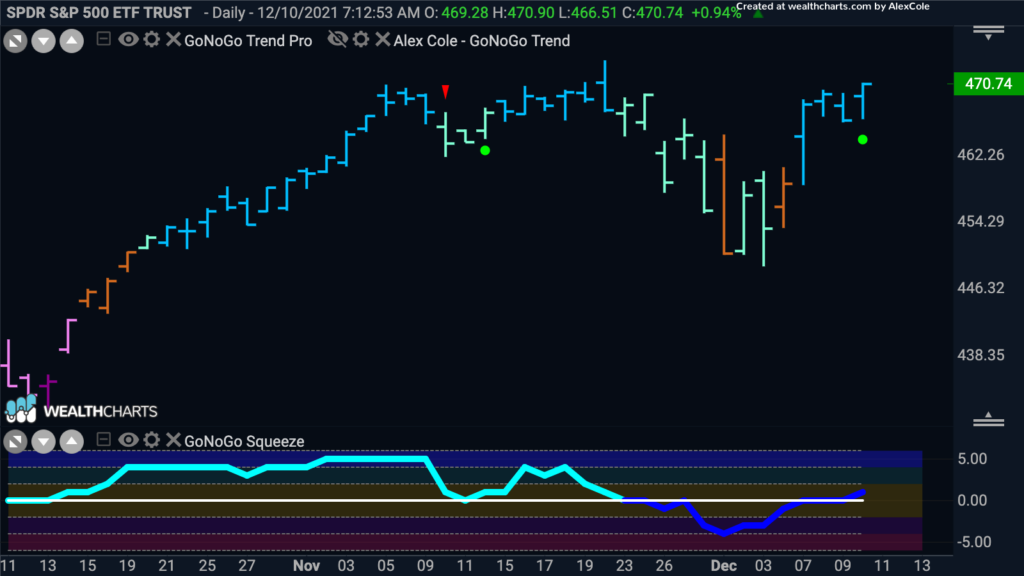
As mentioned, S&P 500 index has recovered well from the volatility of the past few weeks. We saw GoNoGo Oscillator fail to hold the zero line toward the end of November and this led to a strong correction in price. However, on heavy volume, GoNoGo Oscillator has regained positive territory after testing the zero line from below for a few bars. This has triggered a new Go Trend Continuation icon (green circle) to appear under the price bar indicating that momentum has returned in the direction of the “Go” trend.
Dollar at Inflection Point
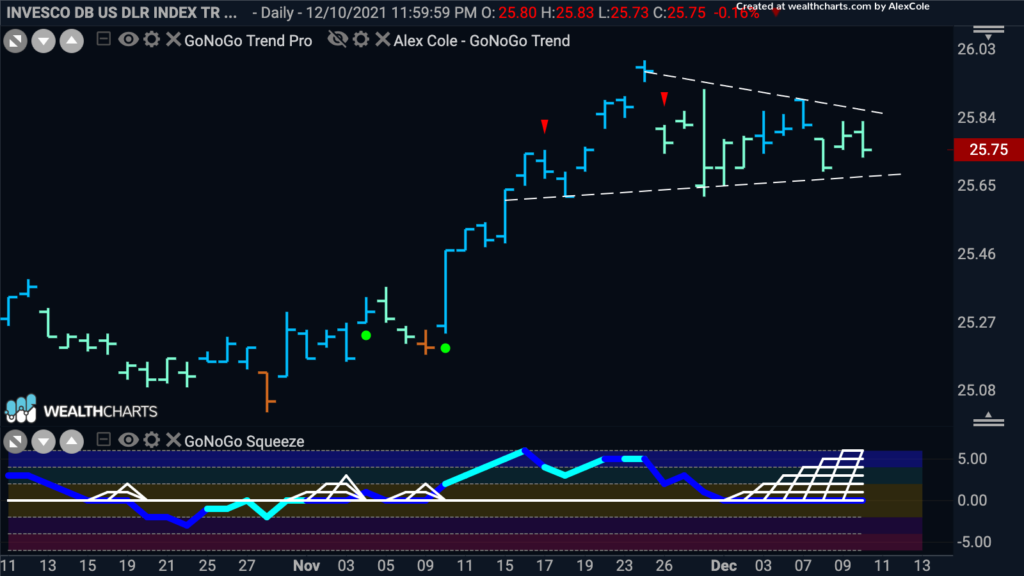
The U.S. dollar has been in a persistent “Go” trend now for several months and after another strong leg higher we are seeing consolidation sideways. The GoNoGo Chart below shows prices of $UUP and we see that this sideways movement has caused the GoNoGo Oscillator to fall to and ride the zero line. A max GoNoGo Squeeze is visible, as the climbing grid climbs for each session the oscillator remains at zero. This reduced volatility can act as a coiled spring. We will watch for the oscillator to break out of the squeeze. If it can move into positive territory that would be a signal that momentum is still in the direction of the “Go” trend. A break out of the squeeze to the downside would threaten the trend. Significant dollar moves can impact other assets.
Time to Find a Use for Utilities?
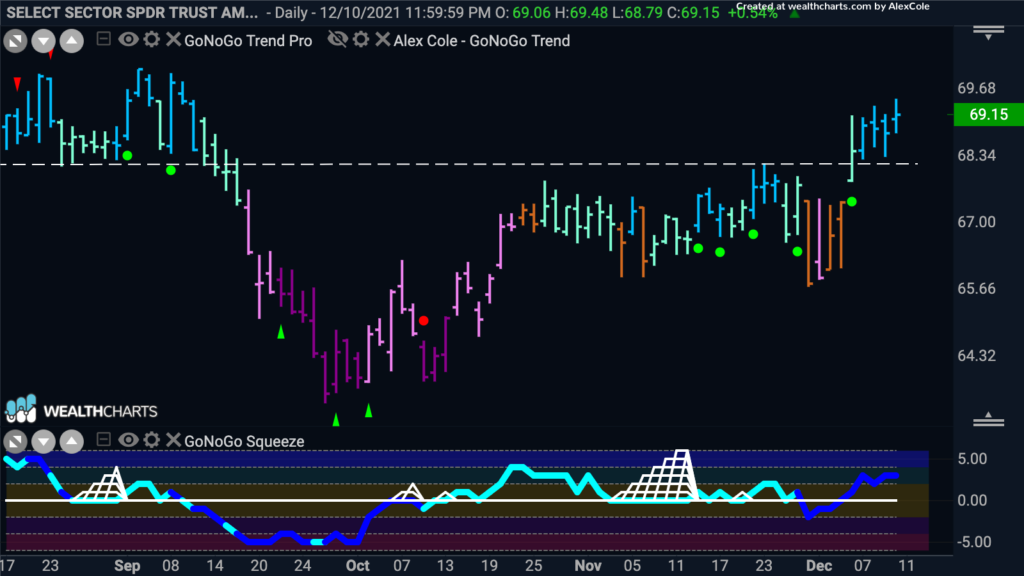
Below we see the GoNoGo Chart of $XLU. We can see that the GoNoGo Trend is a strong “Go” painting bright blue bars. Price is also above pattern resistance. This resistance used to be support earlier in the chart and we know this to be the concept of polarity. GoNoGo Oscillator broke above the zero line on heavy volume as price broke out causing another Go Trend Continuation icon to appear under the price bar.
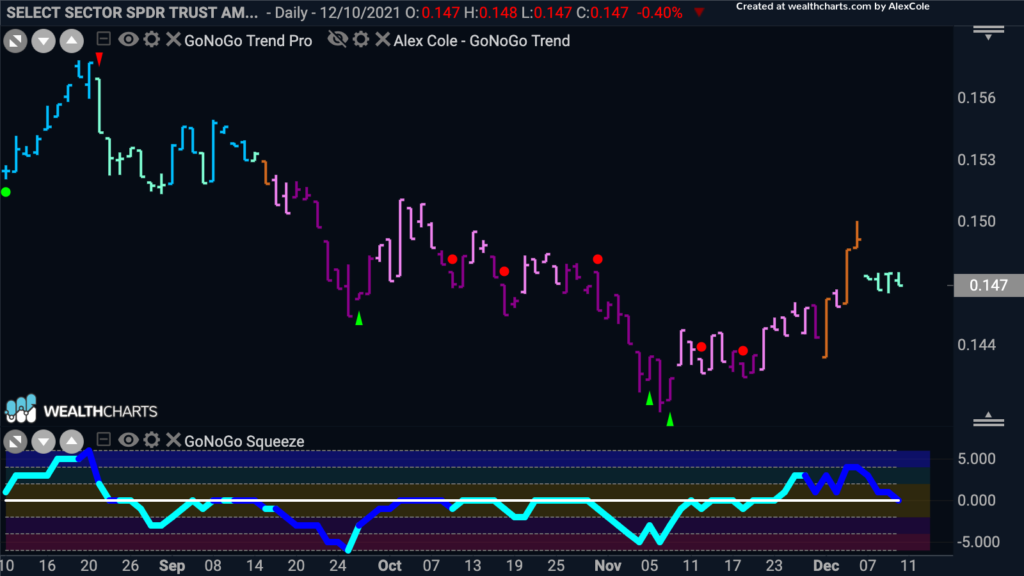
Let’s turn to a relative GoNoGo Chart. Below we are looking at the ratio of $XLU/$SPY with the GoNoGo Trend and Oscillator applied. We can see that the utilities sector has moved into a relative “Go” trend . GoNoGo Oscillator broke the resistance at the zero line toward the end of November which told us that the “NoGo” was in trouble. This led to GoNoGo Trend painting amber “Go Fish” bars and then aqua “Go” bars. GoNoGo Oscillator is at the zero line where we will look to see if it can find support as it should if this new “Go” trend is to persist.
Can NRG Capitalize on Sector Strength?
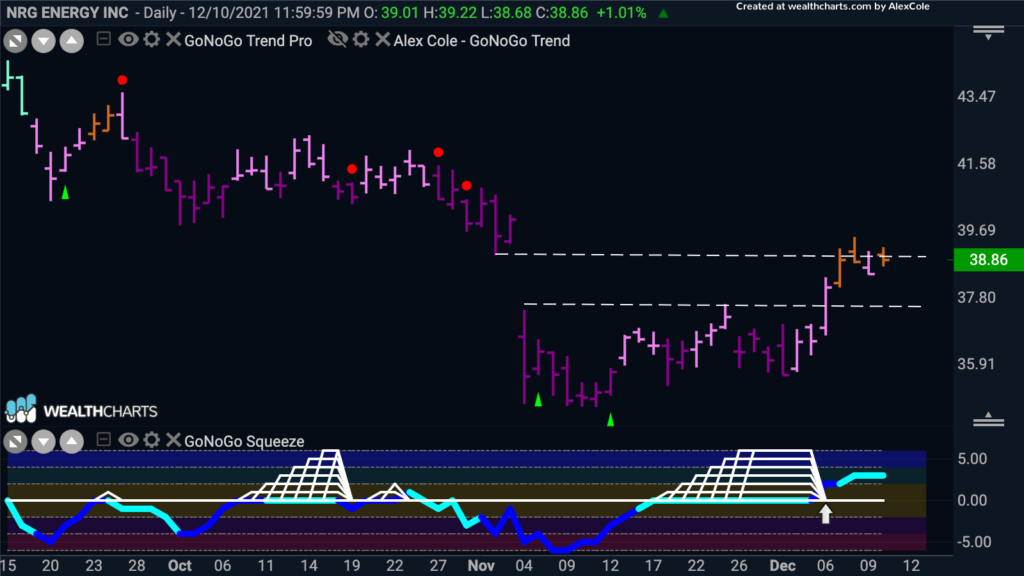
$NRG owns and operates power generating facilities in the U.S. Below is the daily GoNoGo Chart. We can see that unlike the sector, it is not yet in a “Go” trend. However, there are bullish indications. We see that after falling to an ultimate low in early November after the gap down, price has made a higher low and even filled the gap. This comes after GoNoGo Oscillator breaks out of a max GoNoGo Squeeze having been riding the zero line for some time. This could give price the impetus it needs to move into a “Go” trend and consolidate above the highs from the gap.
FirstEnergy Looks Strong on Long Term Chart
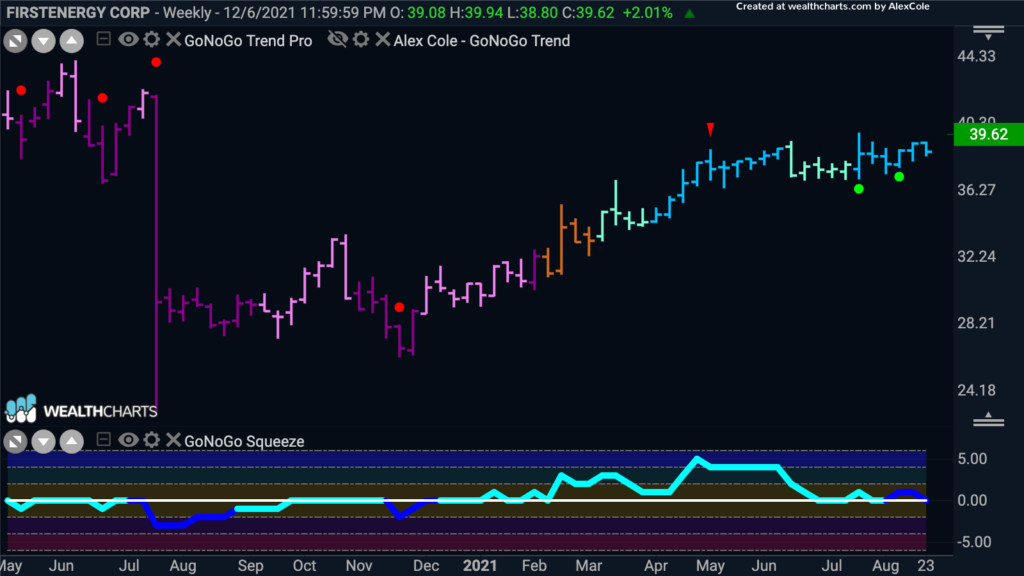
First Energy is a public utilities holding company and the below weekly GoNoGo Chart shows that it has been in a strong “Go” trend since Q1 of 2021. GoNoGo Oscillator is currently finding support at the zero line and we have seen Go Trend Continuation icons appear under weekly price bars in the last few months. If this trend is strong, we will expect support to be strong at zero and if GoNoGo Oscillator rallies back into positive territory we are likely to see a new high on the weekly chart.
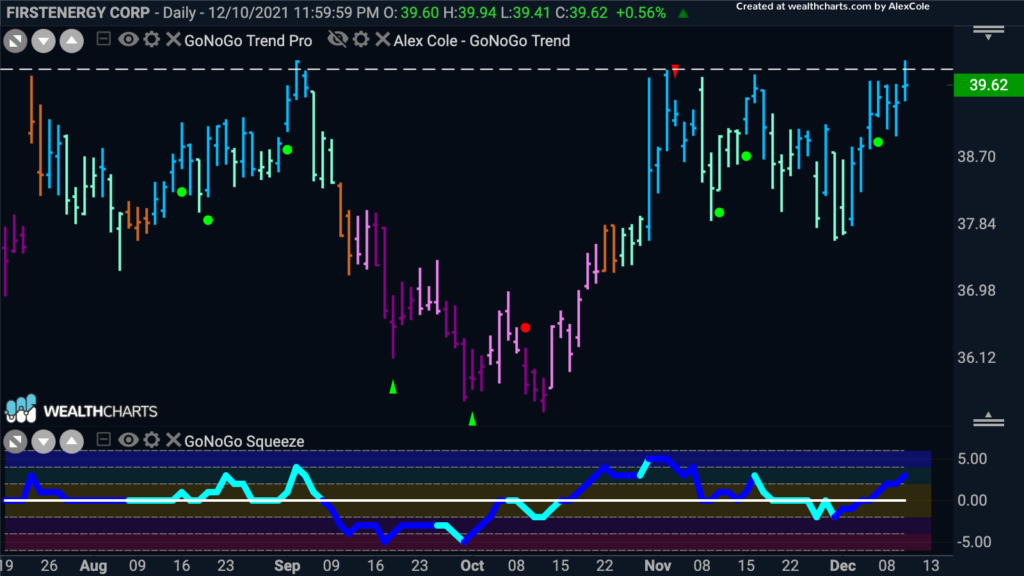
Given that the weekly “Go” trend is in place, we can look to the daily GoNoGo Chart for $FE for an opportunity. We can see that the trend is a strong “Go” with the indicator painting bright blue bars. GoNoGo Oscillator has broken into positive territory on heavy volume which caused a Go Trend Continuation icon to appear under price a few bars ago. Price is at resistance from prior highs, and it will be important to get above these levels if price is to make more gains.
Technology Tough to Beat
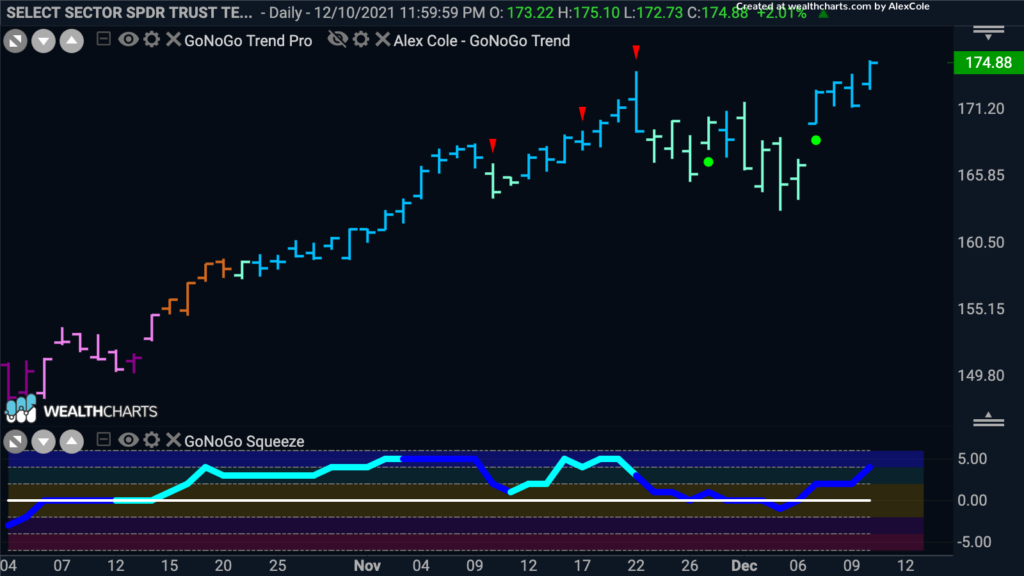
The chart below shows the daily GoNoGo Chart of $XLK, the technology sector SPDR. The GoNoGo Sector RelMap we looked at earlier in this note told us that it continues to outperform and we can see the strength of its performance in this chart. During the volatility we have seen over the last few weeks in the markets the “Go” trend persisted, weakening to aqua bars but not being broken. At the same time, GoNoGo Oscillator was able to largely find support at the zero line before rallying back into positive territory early last week. December 7th saw a fresh Go Trend Continuation icon appear under the price bar and was duly followed by a new high. The relative out-performance is obvious even in a pure GoNoGo Chart of the sector.
Microsoft Sees Go Trend Continuation
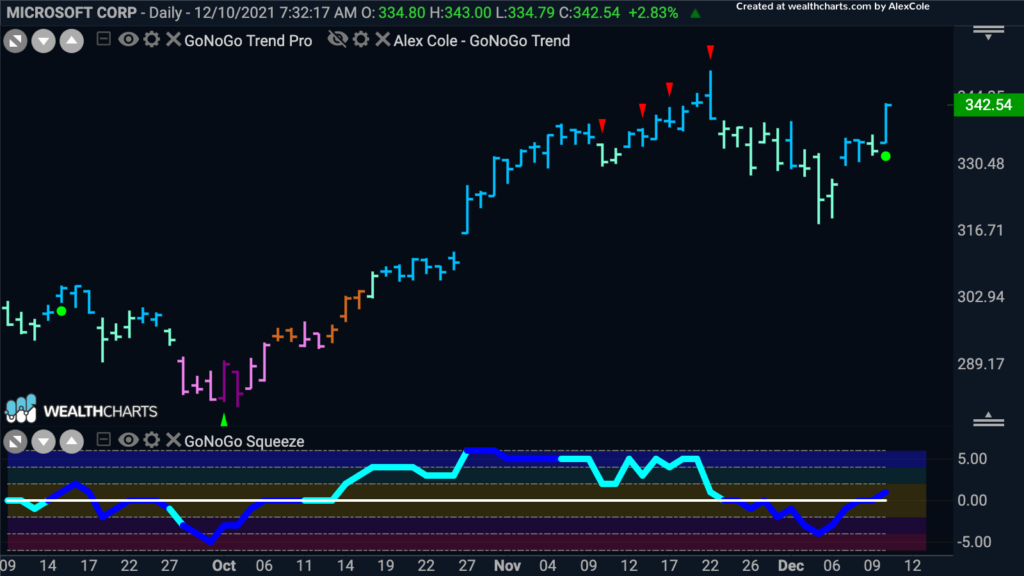
As one of the biggest names in the technology sector, we can expect Microsoft to enjoy the same strength. The GoNoGo Chart below shows that the “Go” trend in price persisted through the prior week’s volatility. The current bar is a strong blue “Go” bar. When GoNoGo Oscillator broke below the zero line on heavy volume we were concerned and an investor might have lightened his position before the correction worsened. Now, GoNoGo Oscillator has broken back into positive territory and we see a resurgence in momentum in the direction of the “Go” trend as a Go Trend Continuation icon appears under the price bar. We will look for price to make an attack on prior highs.
