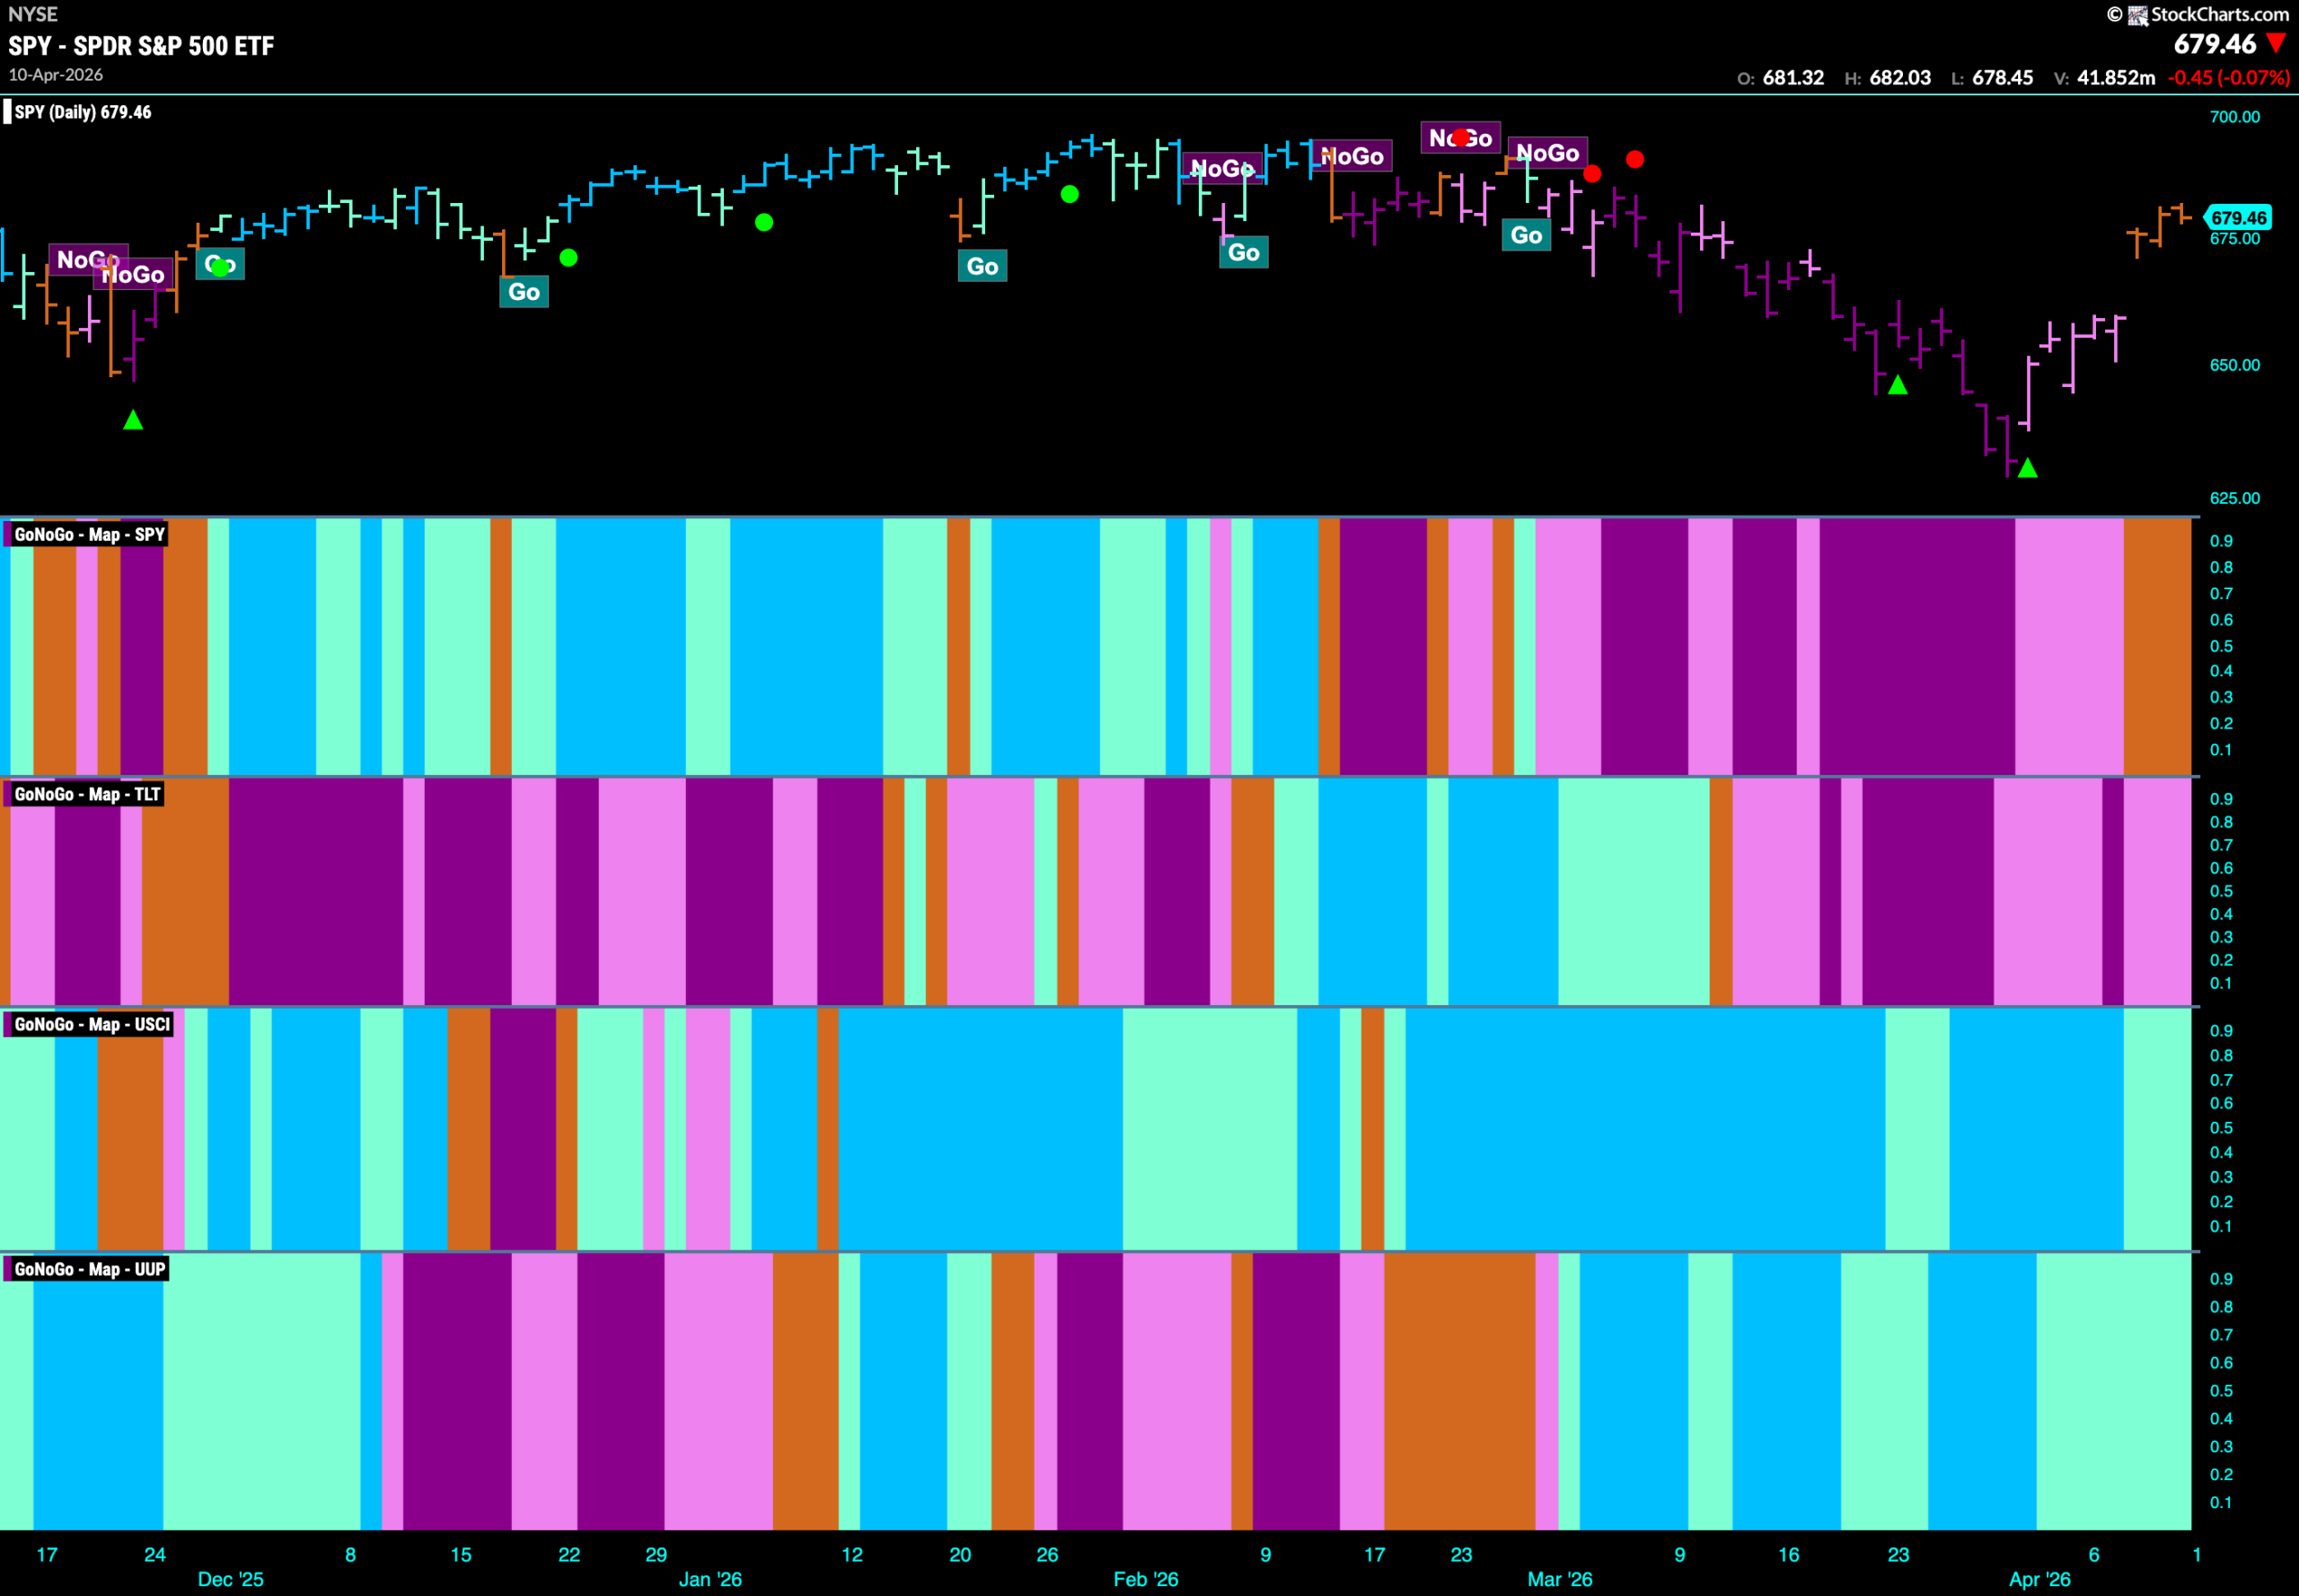
Good morning and welcome to this week’s Flight Path. The equity trend saw the “NoGo” give way to several amber “Go Fish” bars as the market displayed uncertainty. Treasury bond prices remained in a “NoGo” trend but the indicator painted weaker pink bars again this week. GoNoGo Trend showed that U.S. commodities remained in a “Go” trend however we saw weakness this week was the indicator painted paler aqua bars. The dollar remained in a “Go” trend as well but GoNoGo Trend painted weakness with aqua bars here as well.
$SPY Gaps Higher, Paints “Go Fish” Bars
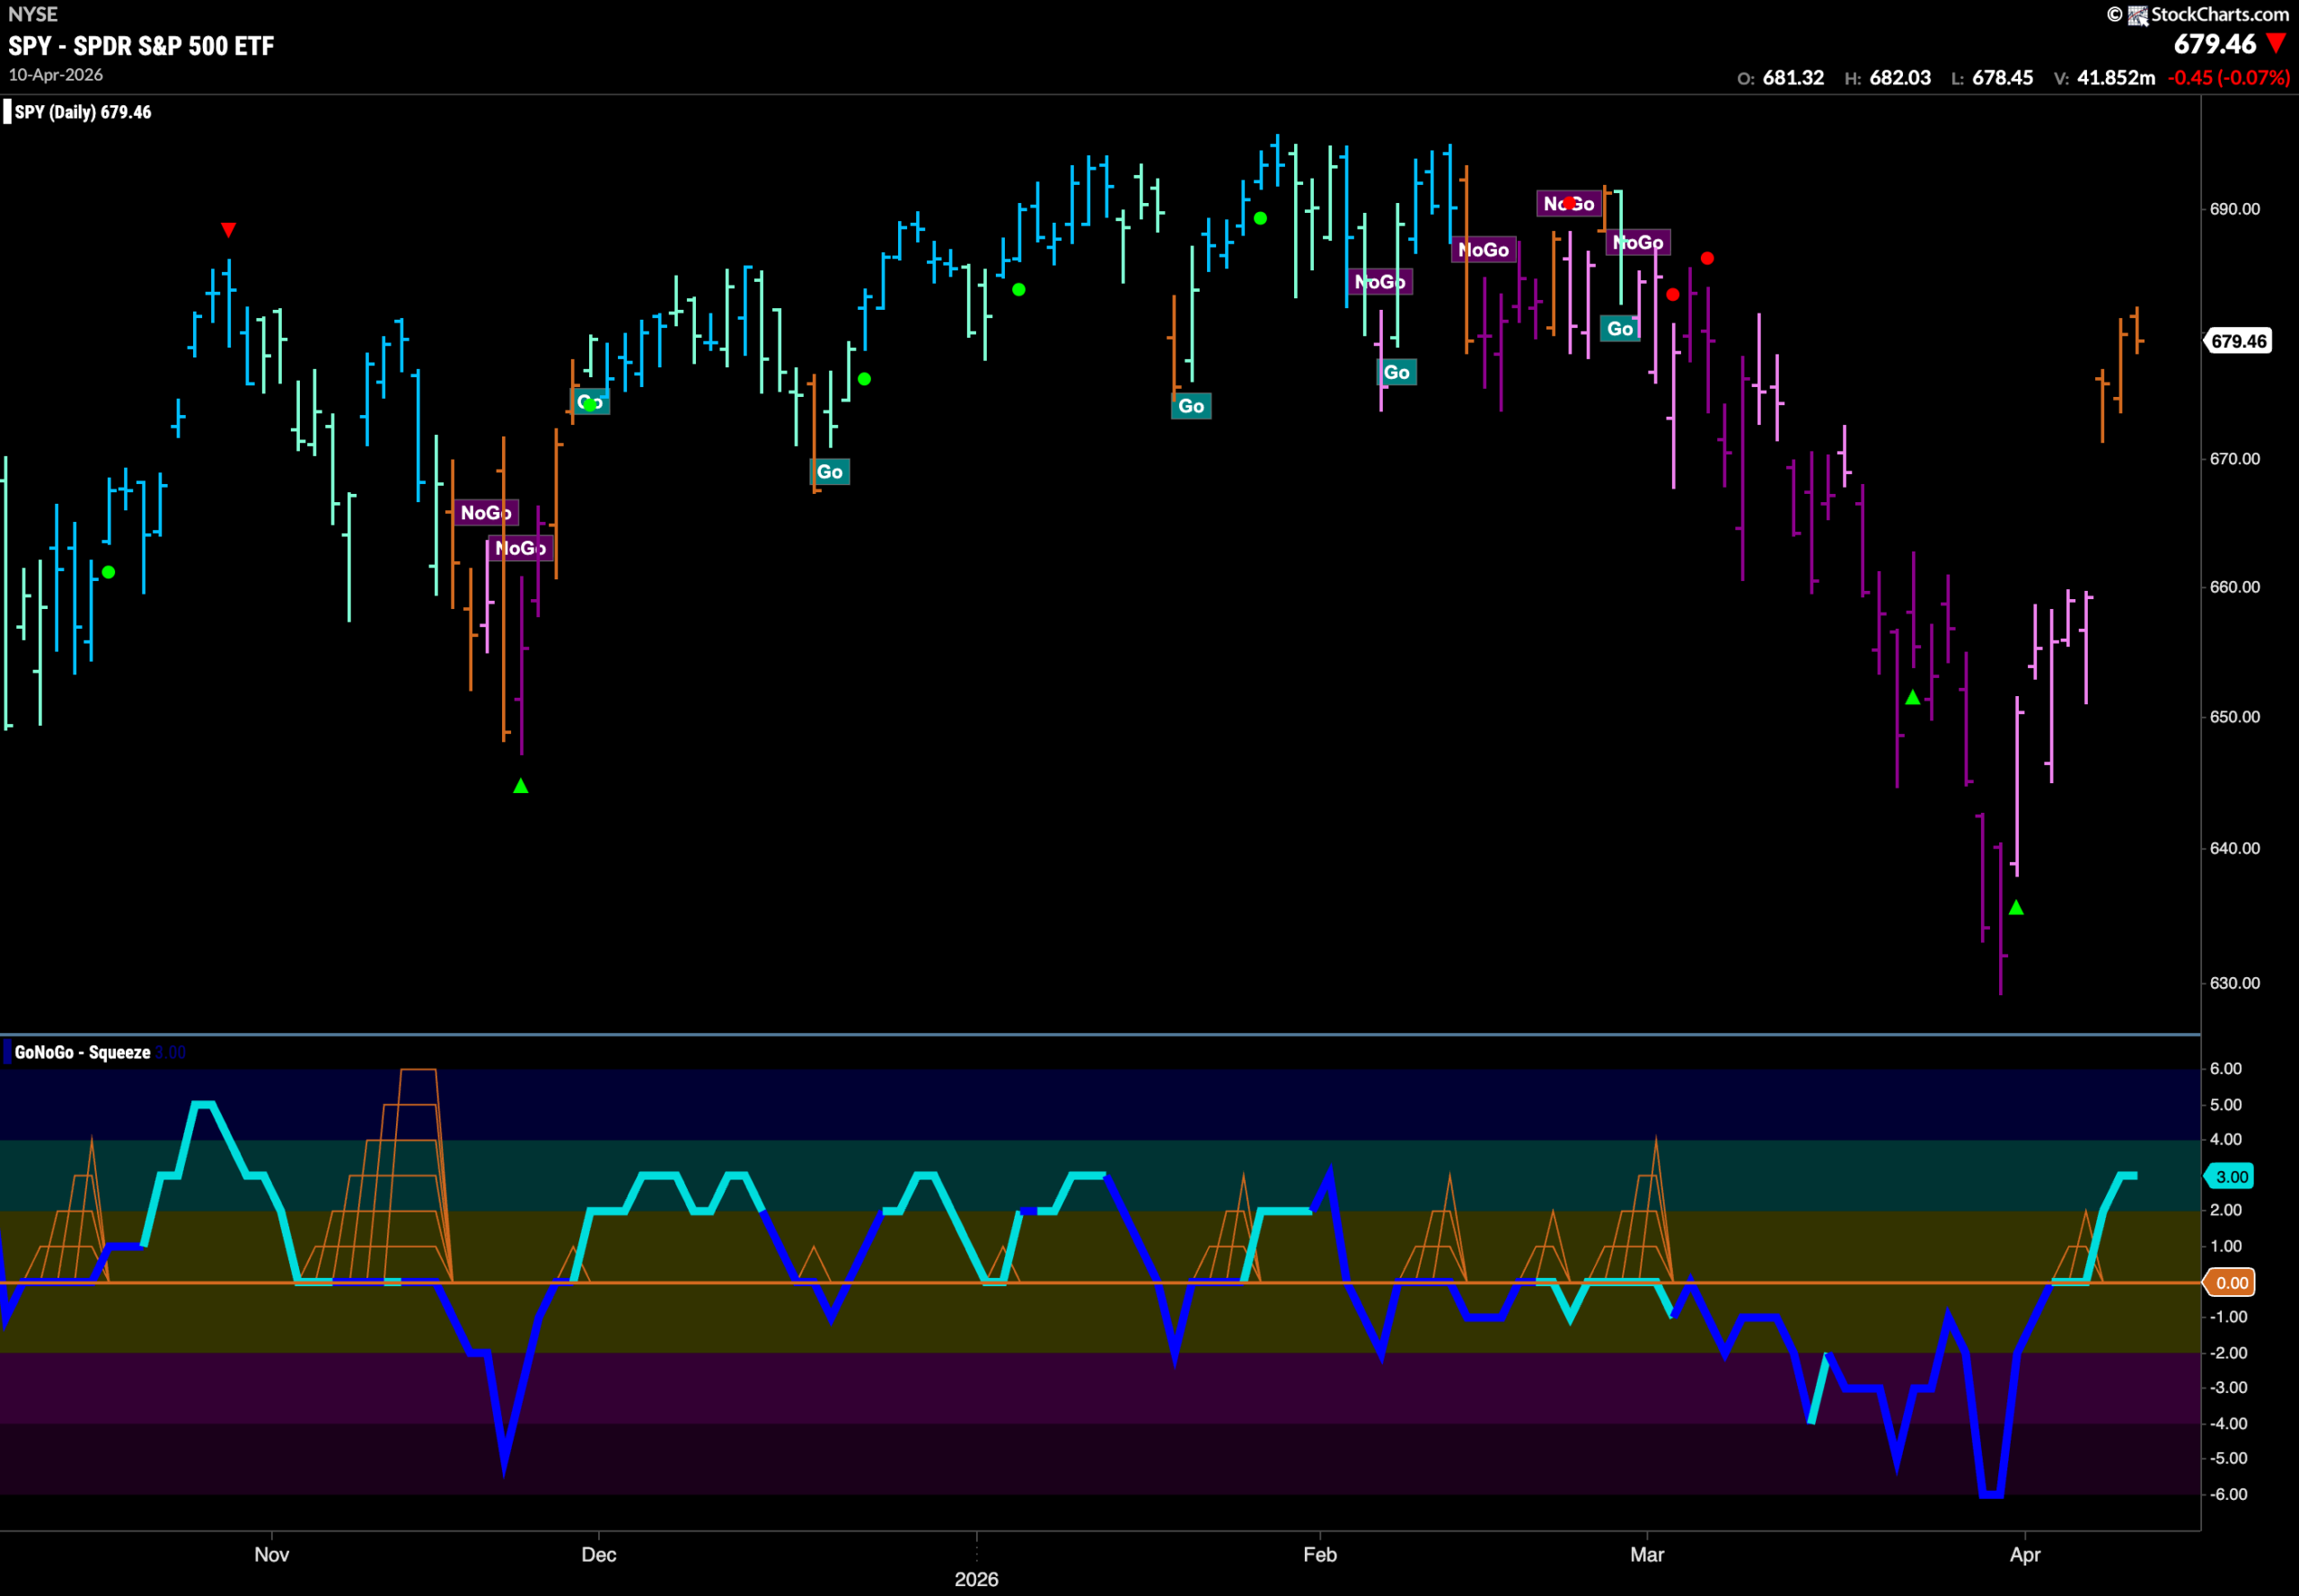
The GoNoGo chart below shows that the “NoGo” relented this week and as price gapped higher we see GoNoGo trend painting amber “Go Fish” bars as the market tries to make up its mind regarding future direction. With some way to go before threatening new highs, we will watch to see if this is a relief rally or something more constructive. GoNoGo Oscillator is in positive territory so for now the momentum is confirming the higher prices.
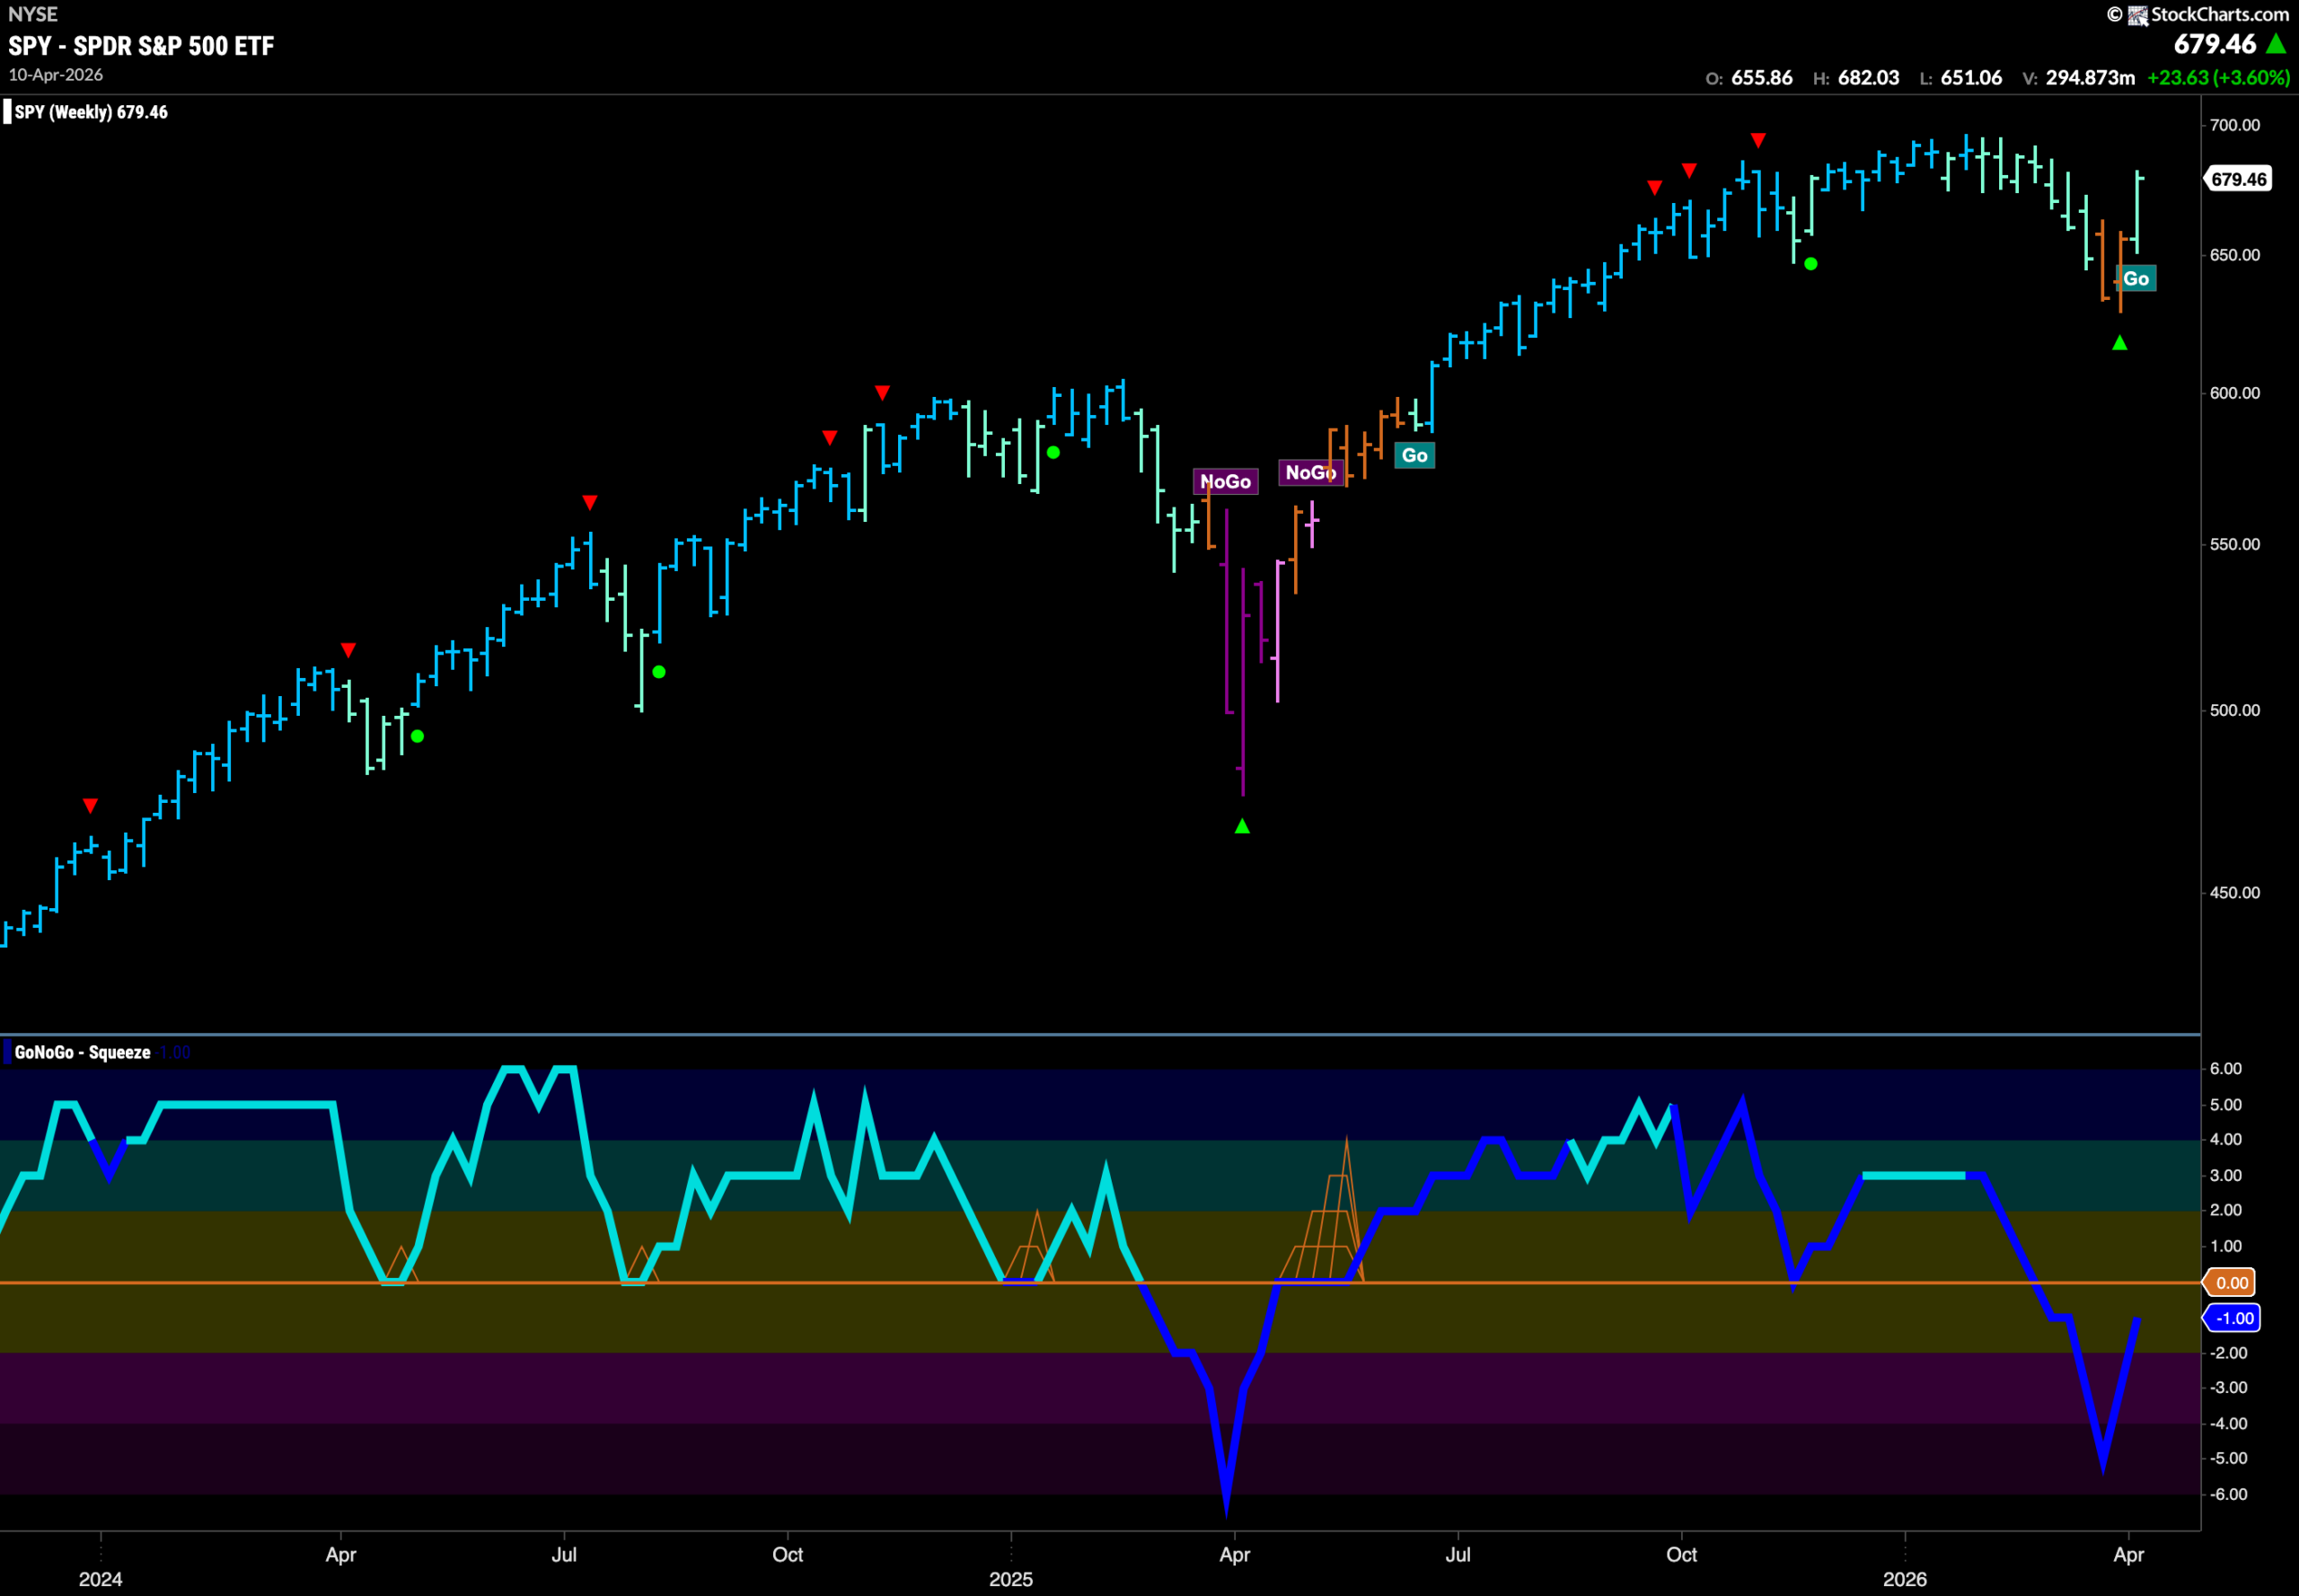
The weekly chart shows that the “Go” trend has returned on the larger time frame. We see that after two amber “Go Fish” bars GoNoGo trend is painting an aqua bar. When we look at the oscillator panel below we can see that momentum is still in negative territory and this tells us that it is out of line with the “Go” bar painted above.
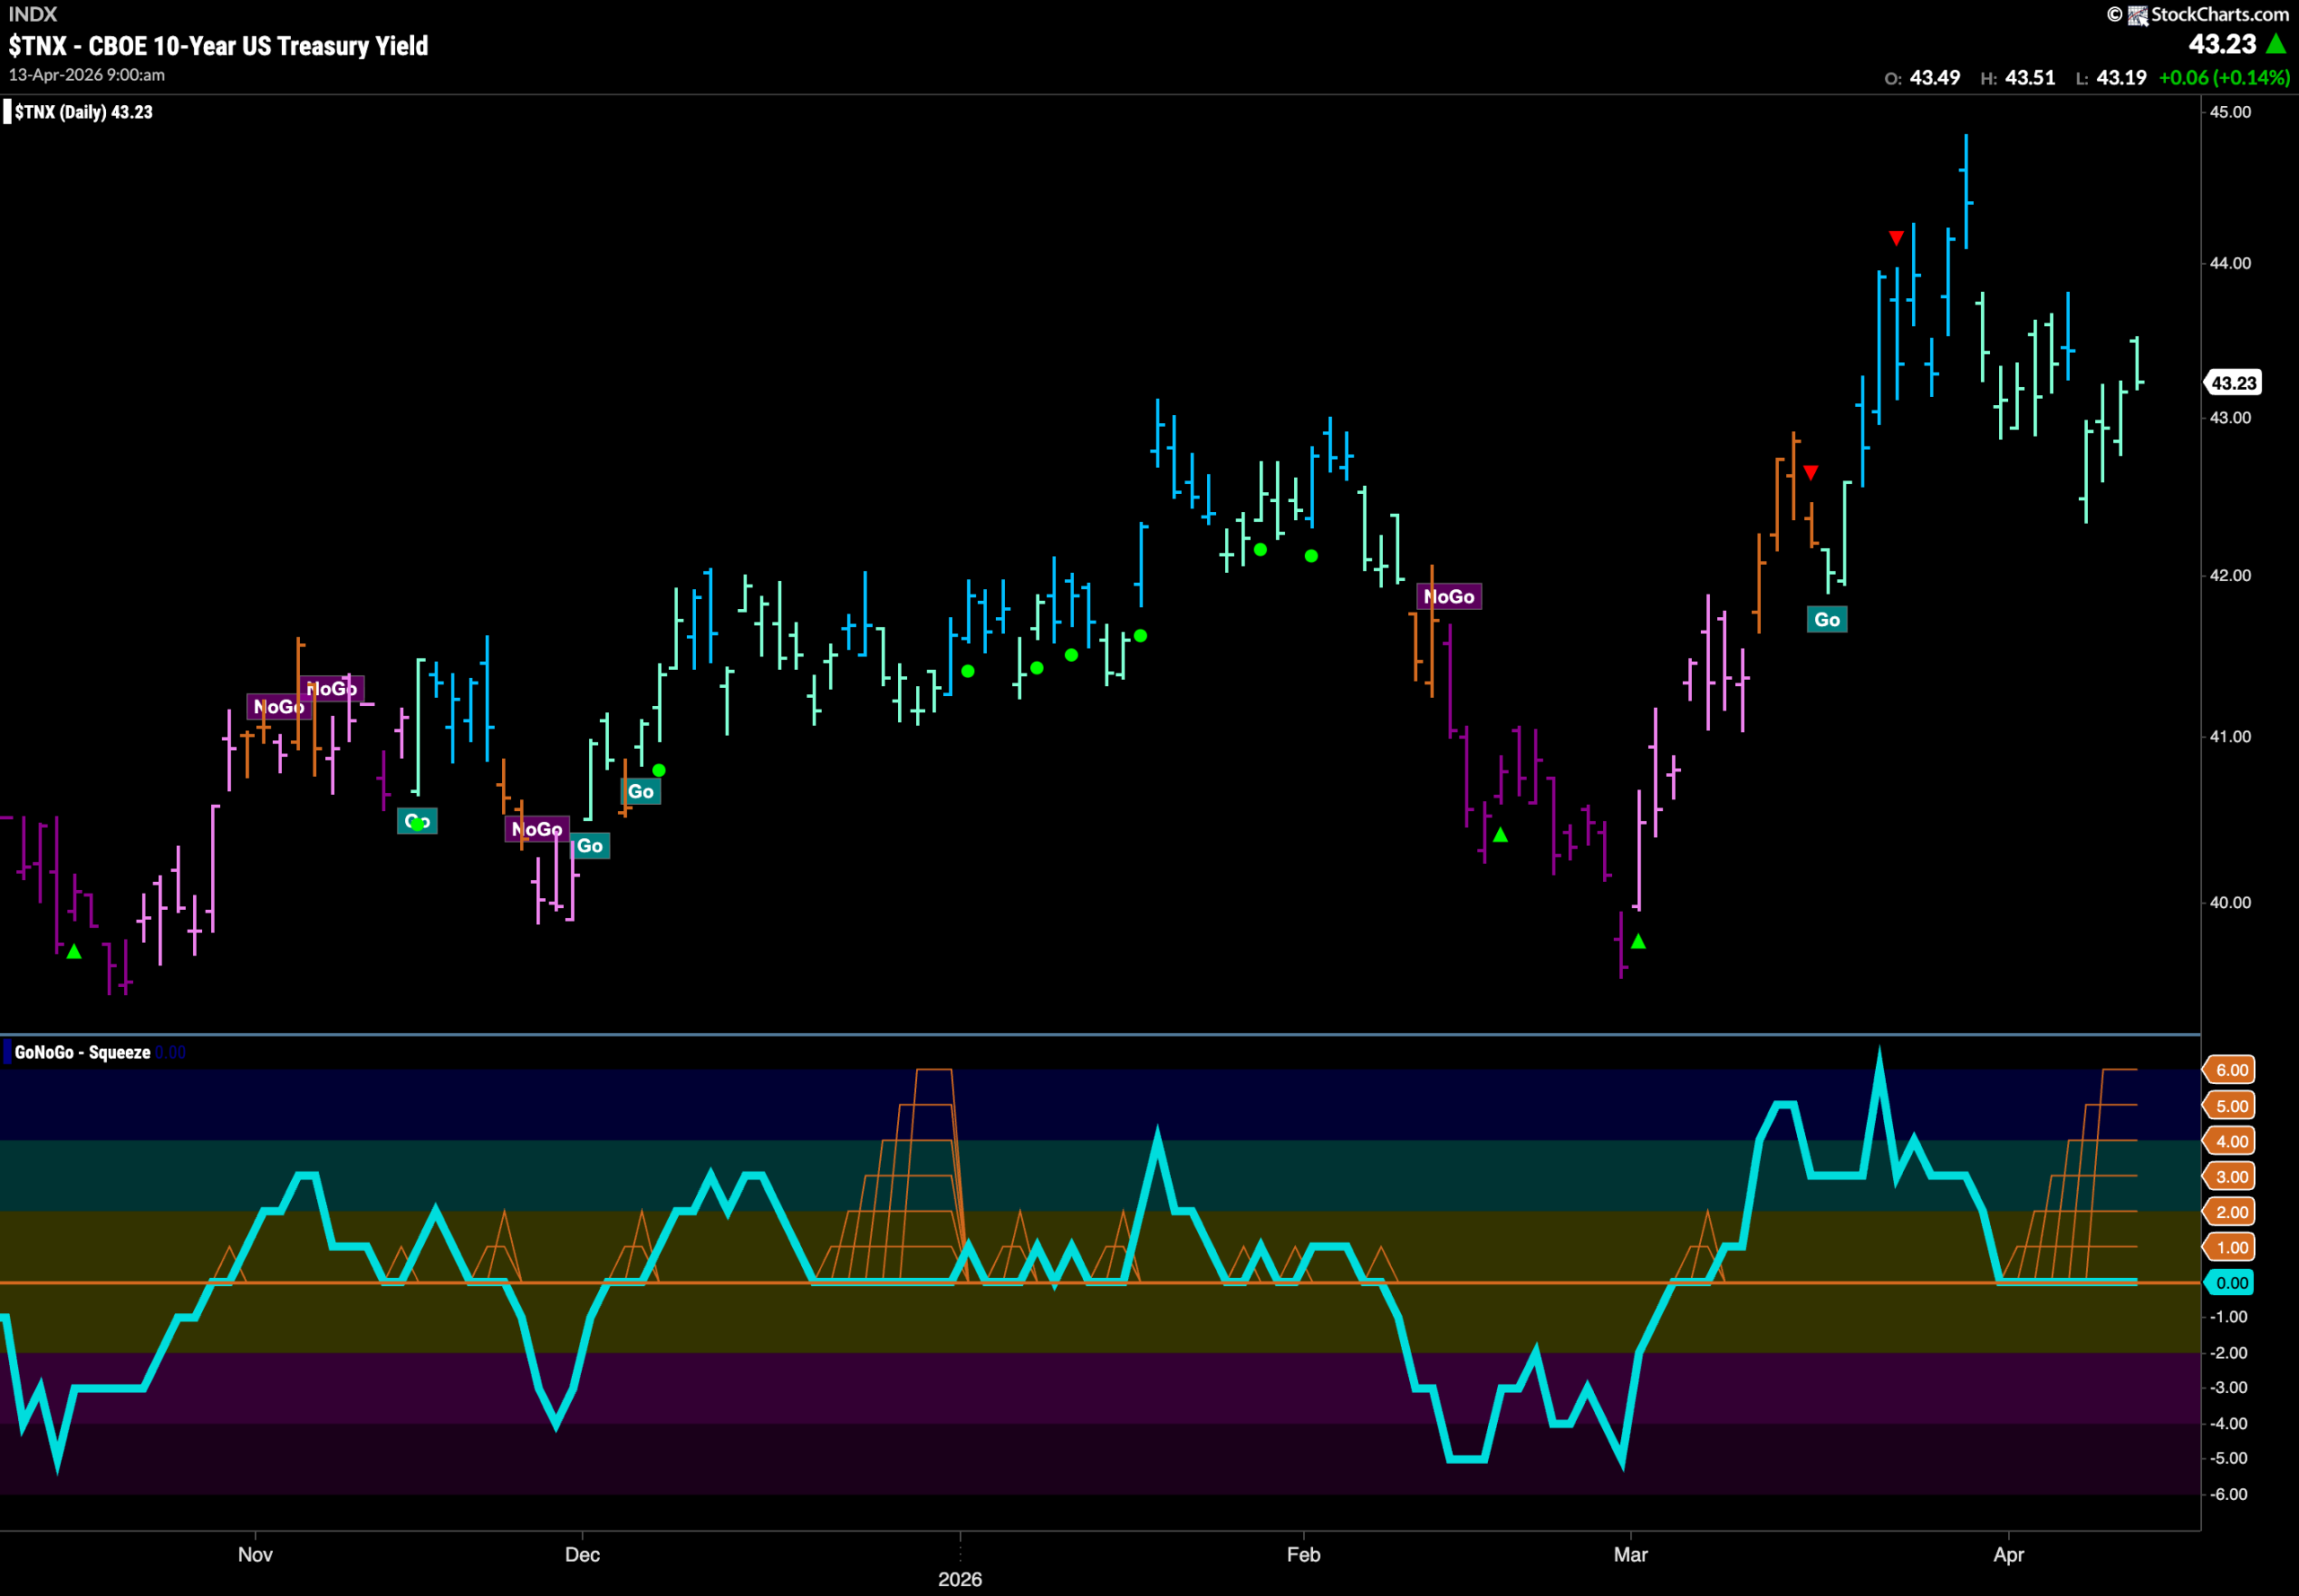
Treasury Rates Remain in Weak “Go” Trend
GoNoGo Trend shows that the “Go” trend remains in place but we see weaker aqua bars again for most of the week as rates look to have set a lower low. GoNoGo Oscillator is riding the zero line and we see a Max GoNoGo Squeeze reflecting the virtual tug of war at this level. We will watch closely to see in which direction the Squeeze is broken. Should the Oscillator break out of the Squeeze back into positive territory that would indicate a likely move higher for rates.
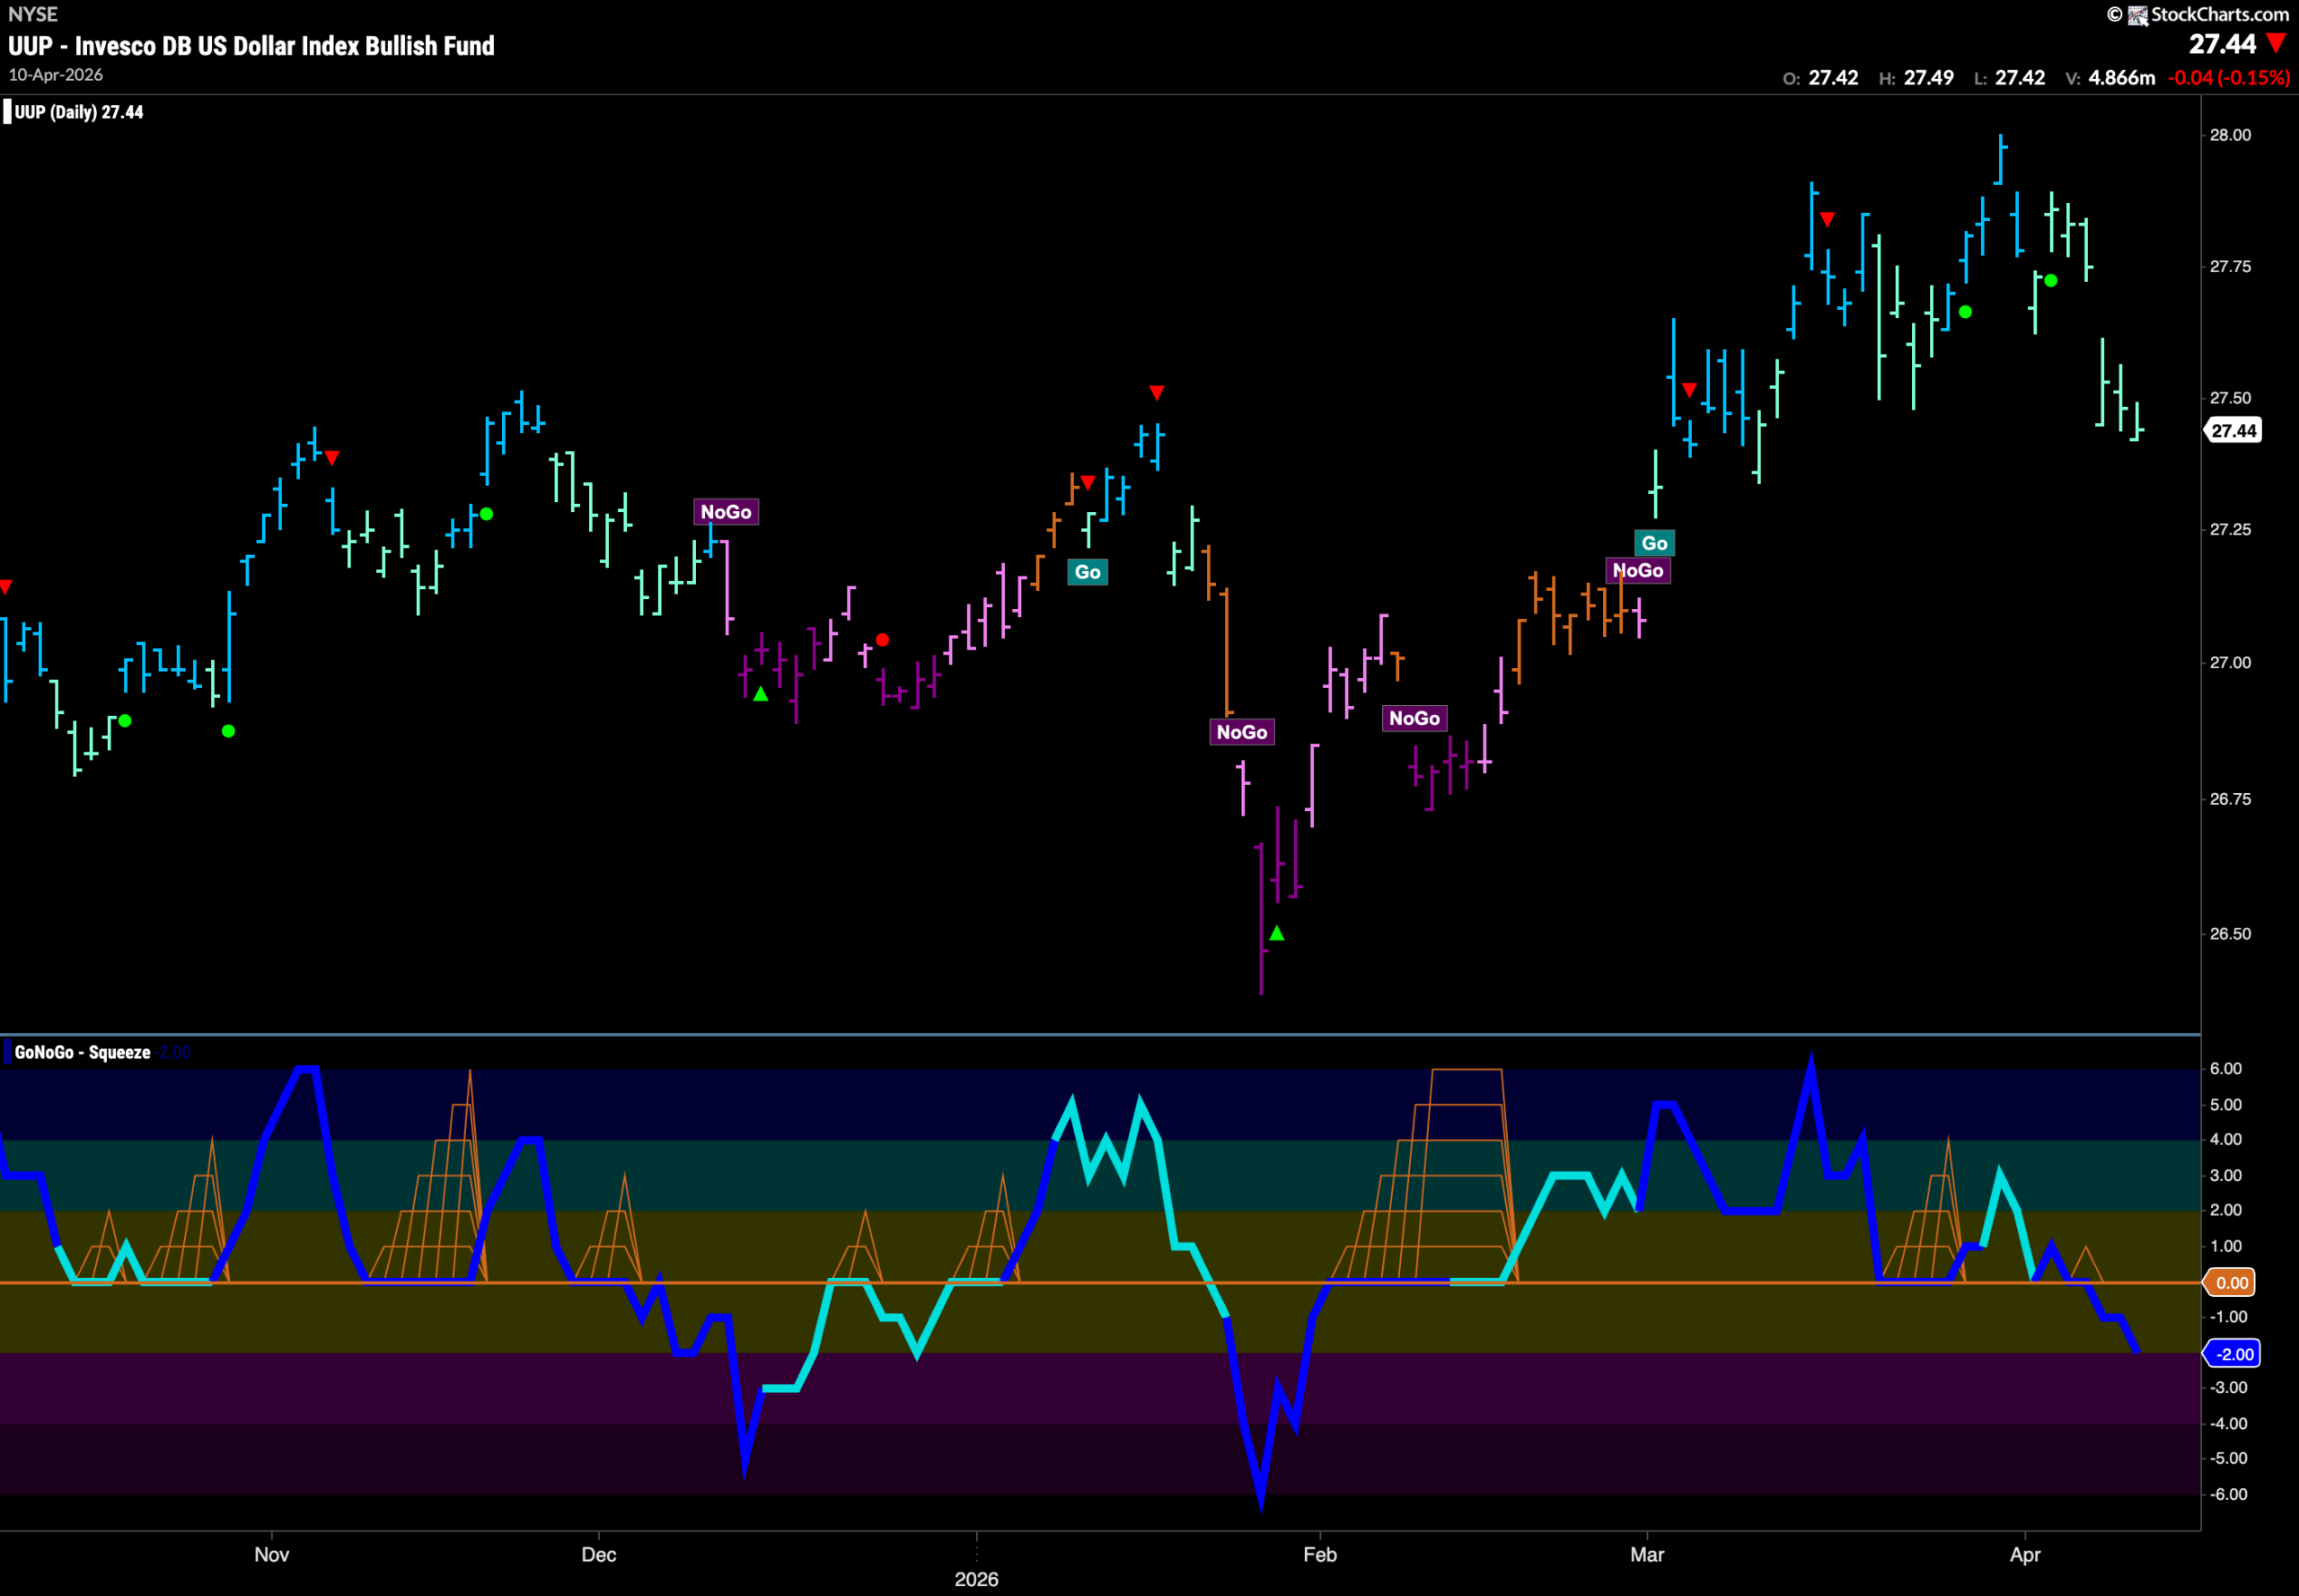
Dollar ($UUP) Shows Continued Weakness in “Go” Trend
The chart below shows that the dollar remained in a “Go” trend again this week however we have seen nothing but paler aqua bars as the greenback has fallen from its most recent high. We now see GoNoGo Oscillator falling through the zero line and into negative territory at a value of -2. With some support likely from prior highs early this year, we will watch to see if the “Go” Trend can survive another week.
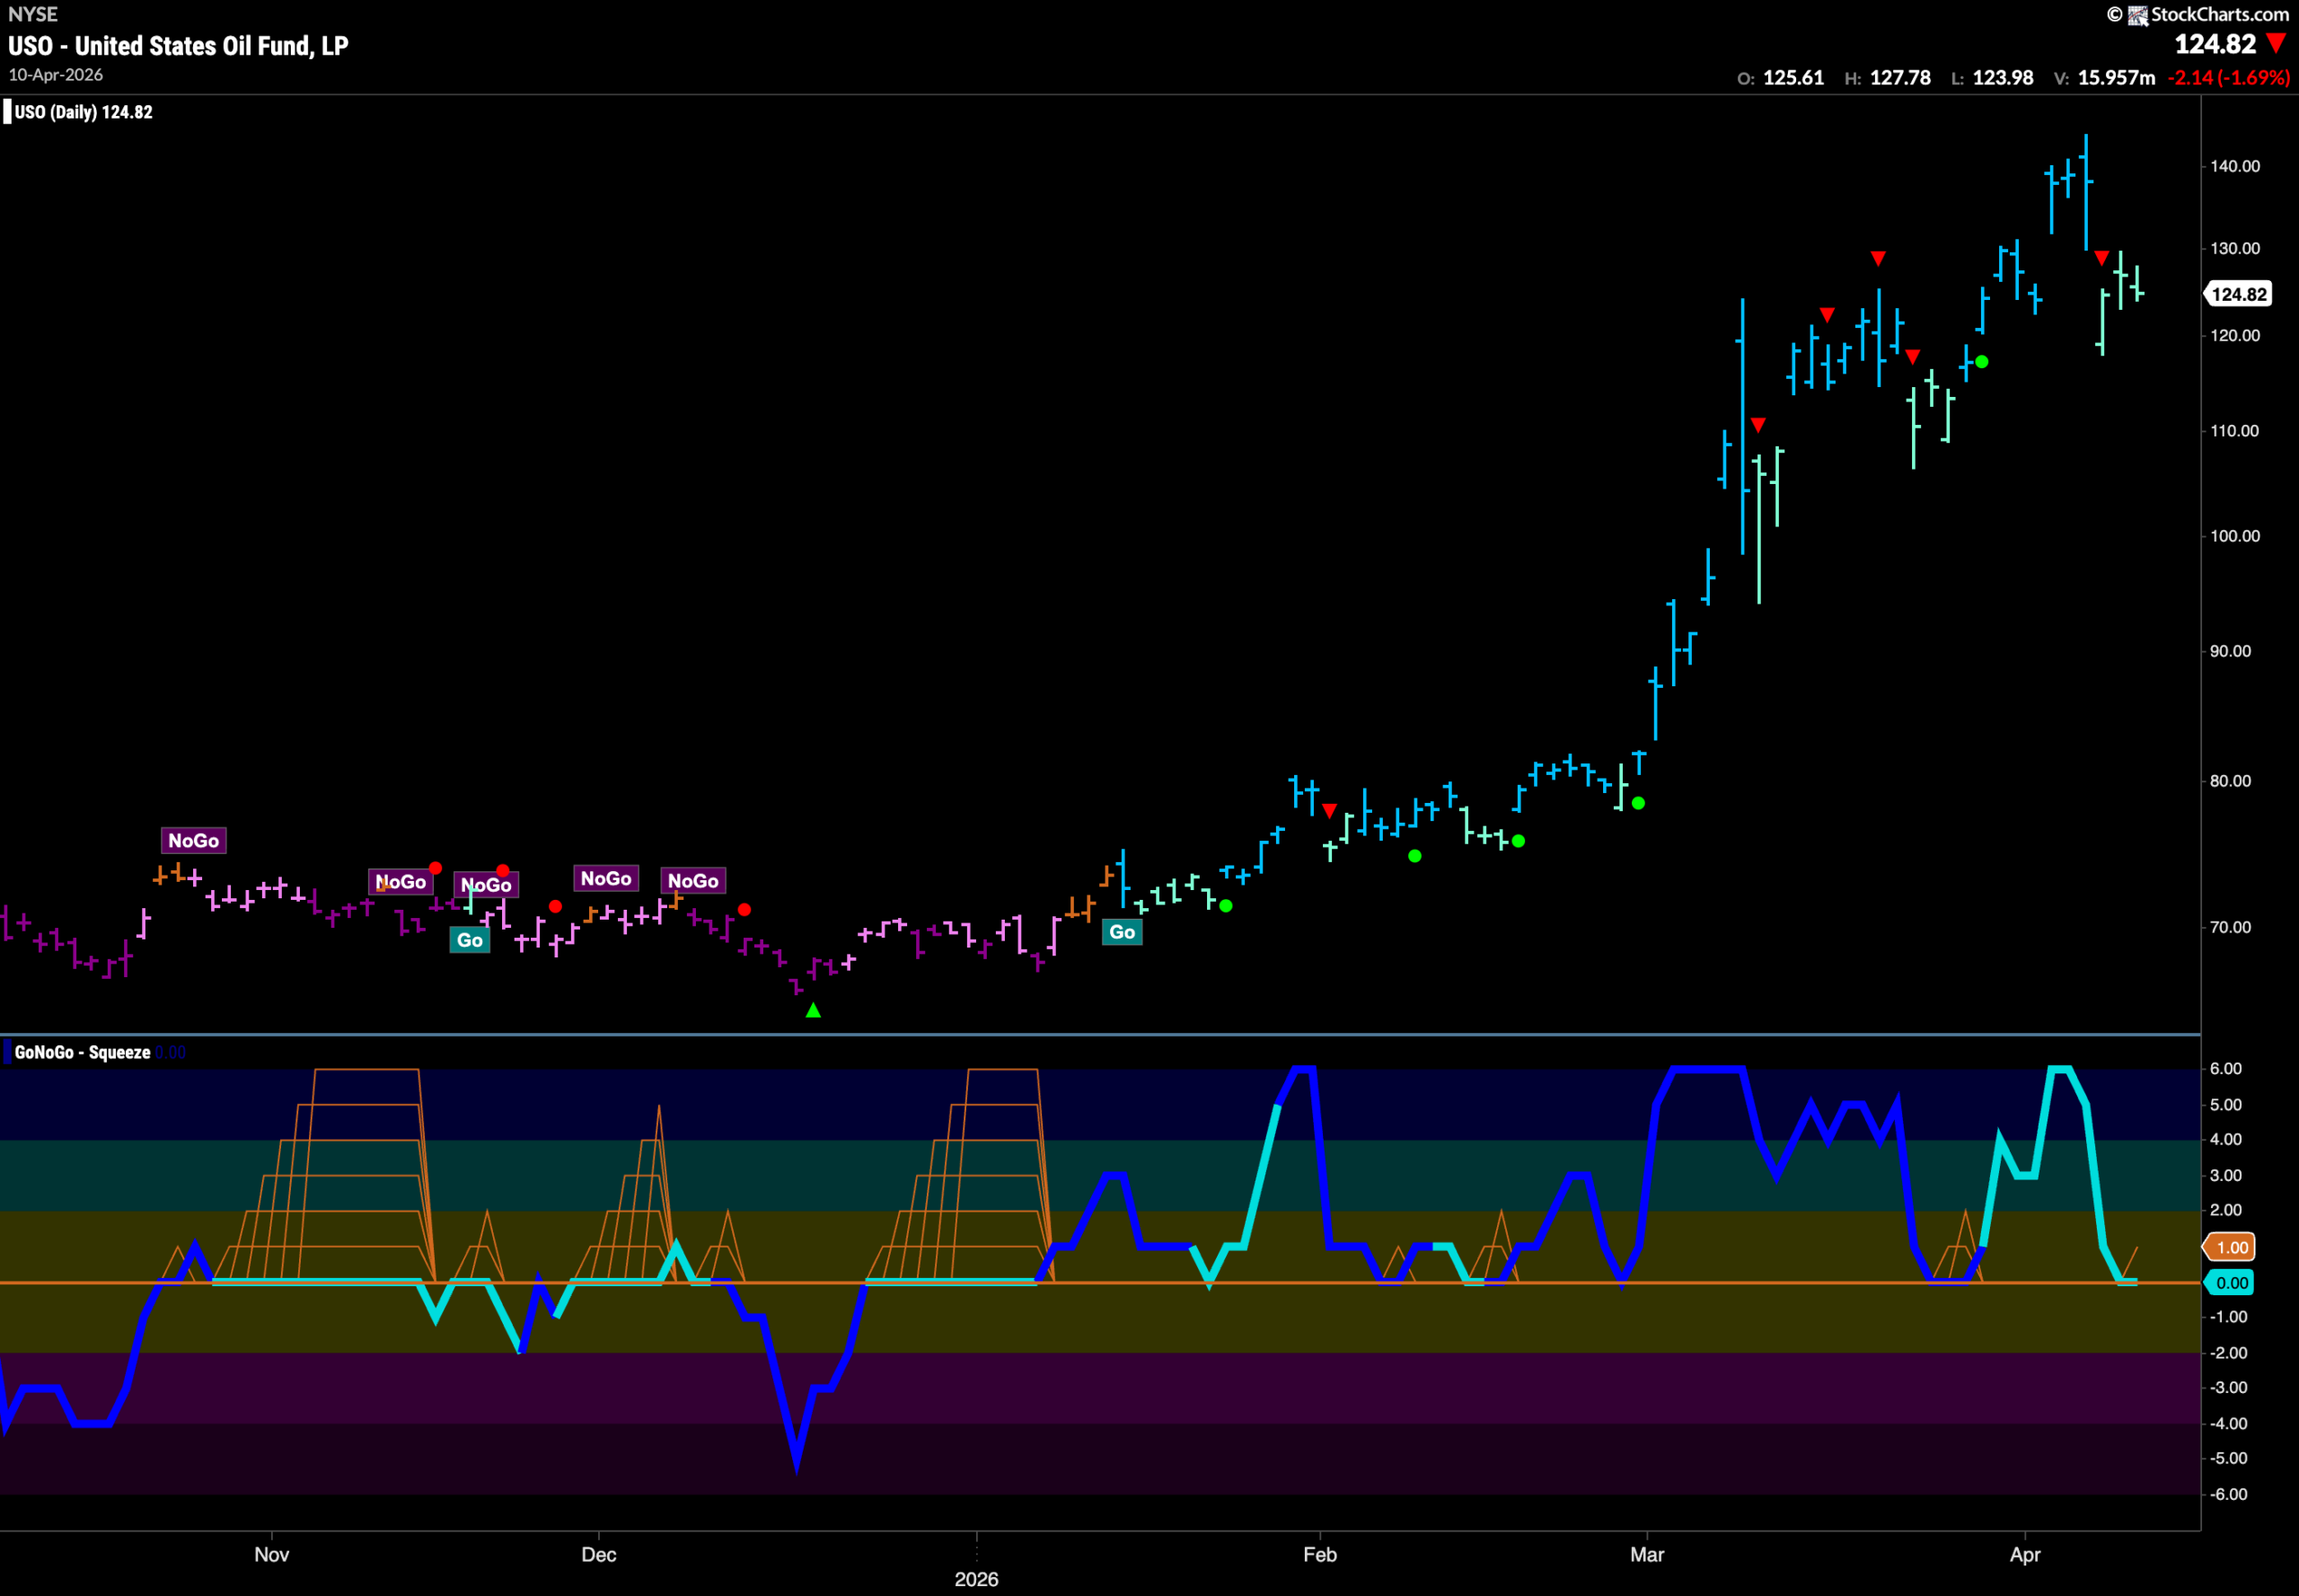
Oil ($USO) Falls From Higher High
GoNoGo Trend shows that the “Go” trend continues for another week as price sets another higher high. Following that high, we see a Go Countertrend Correction Icon (red arrow) and price has fallen with the indicator painting weaker aqua bars. GoNoGo Oscillator has fallen from an overbought extreme to test the zero line from above. We will watch to see if it finds support at this level and if it does we can expect the trend to continue.
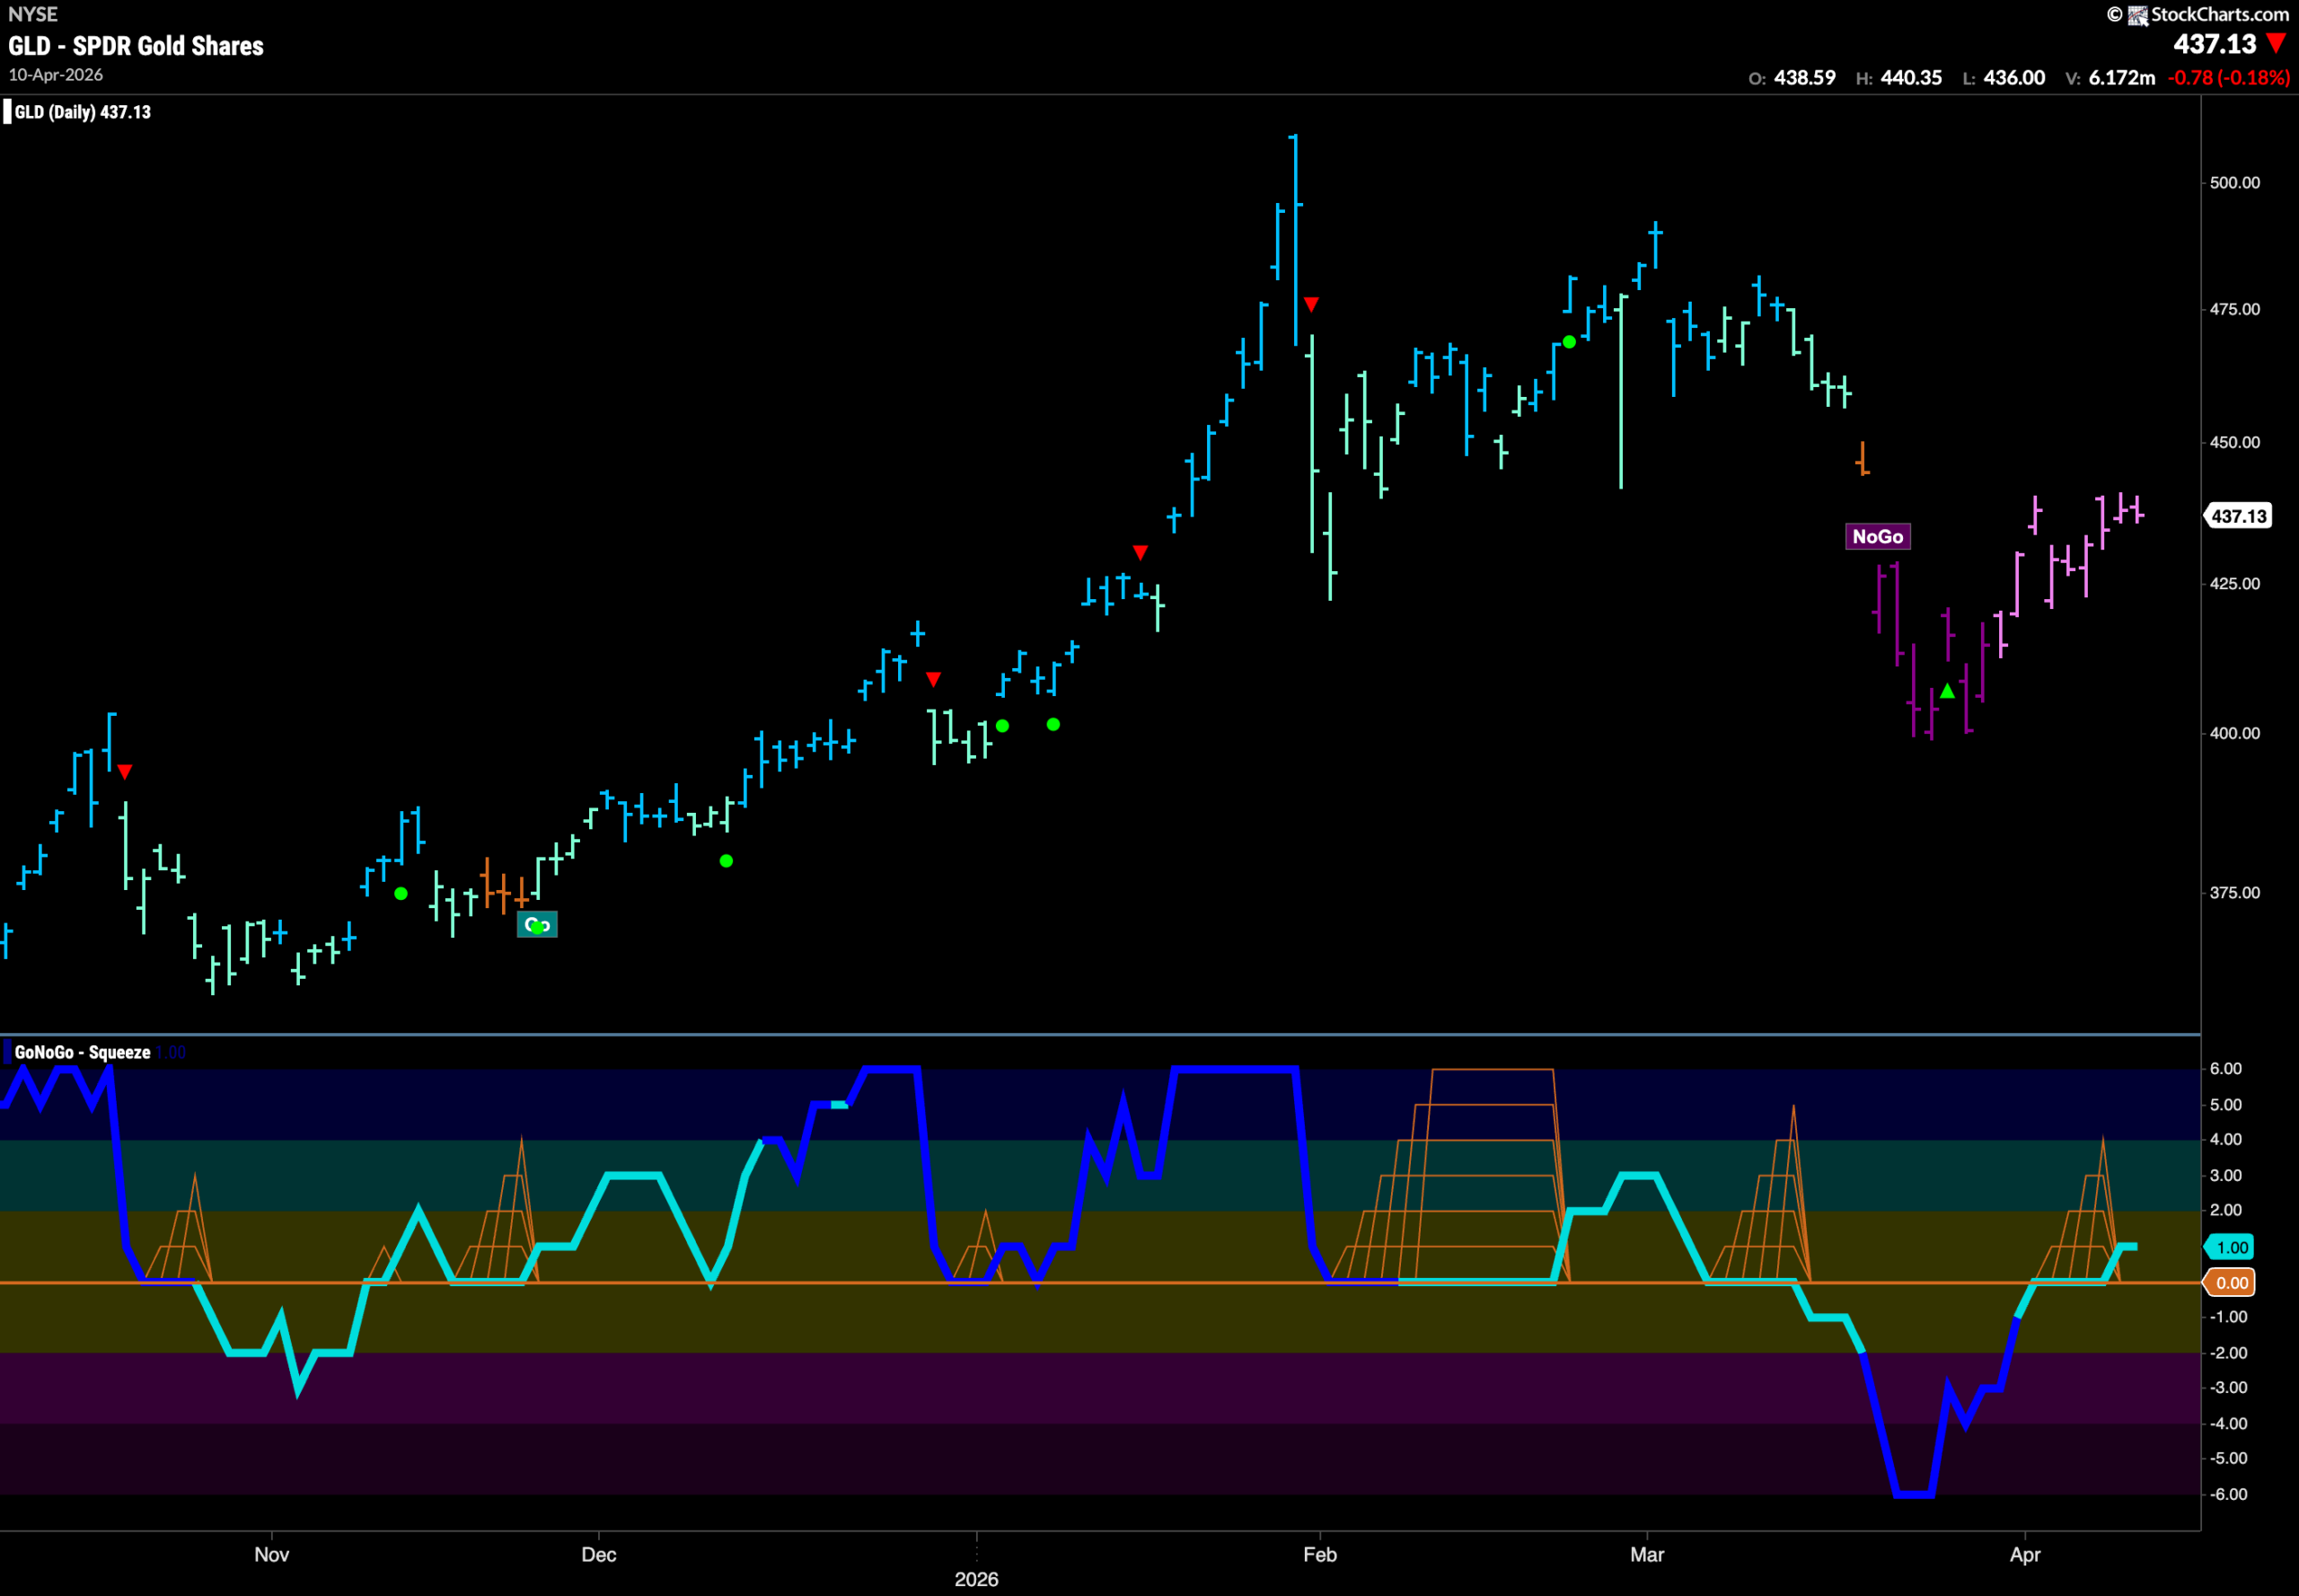
Gold ($GLD) Continues to Climb from Low
Gold remains in the “NoGo” Trend but we have seen price climb from the low and on a string of weaker pink bars. We now see price entering the gap that began the “NoGo” and so we will watch to see if this gap will act as resistance. If it fails to climb through the gap, then we will likely see the “NoGo” trend continue and price face downward pressure. GoNoGo Oscillator has crept into positive territory and we will watch to see if it can stay there this week.
Sector RelMap
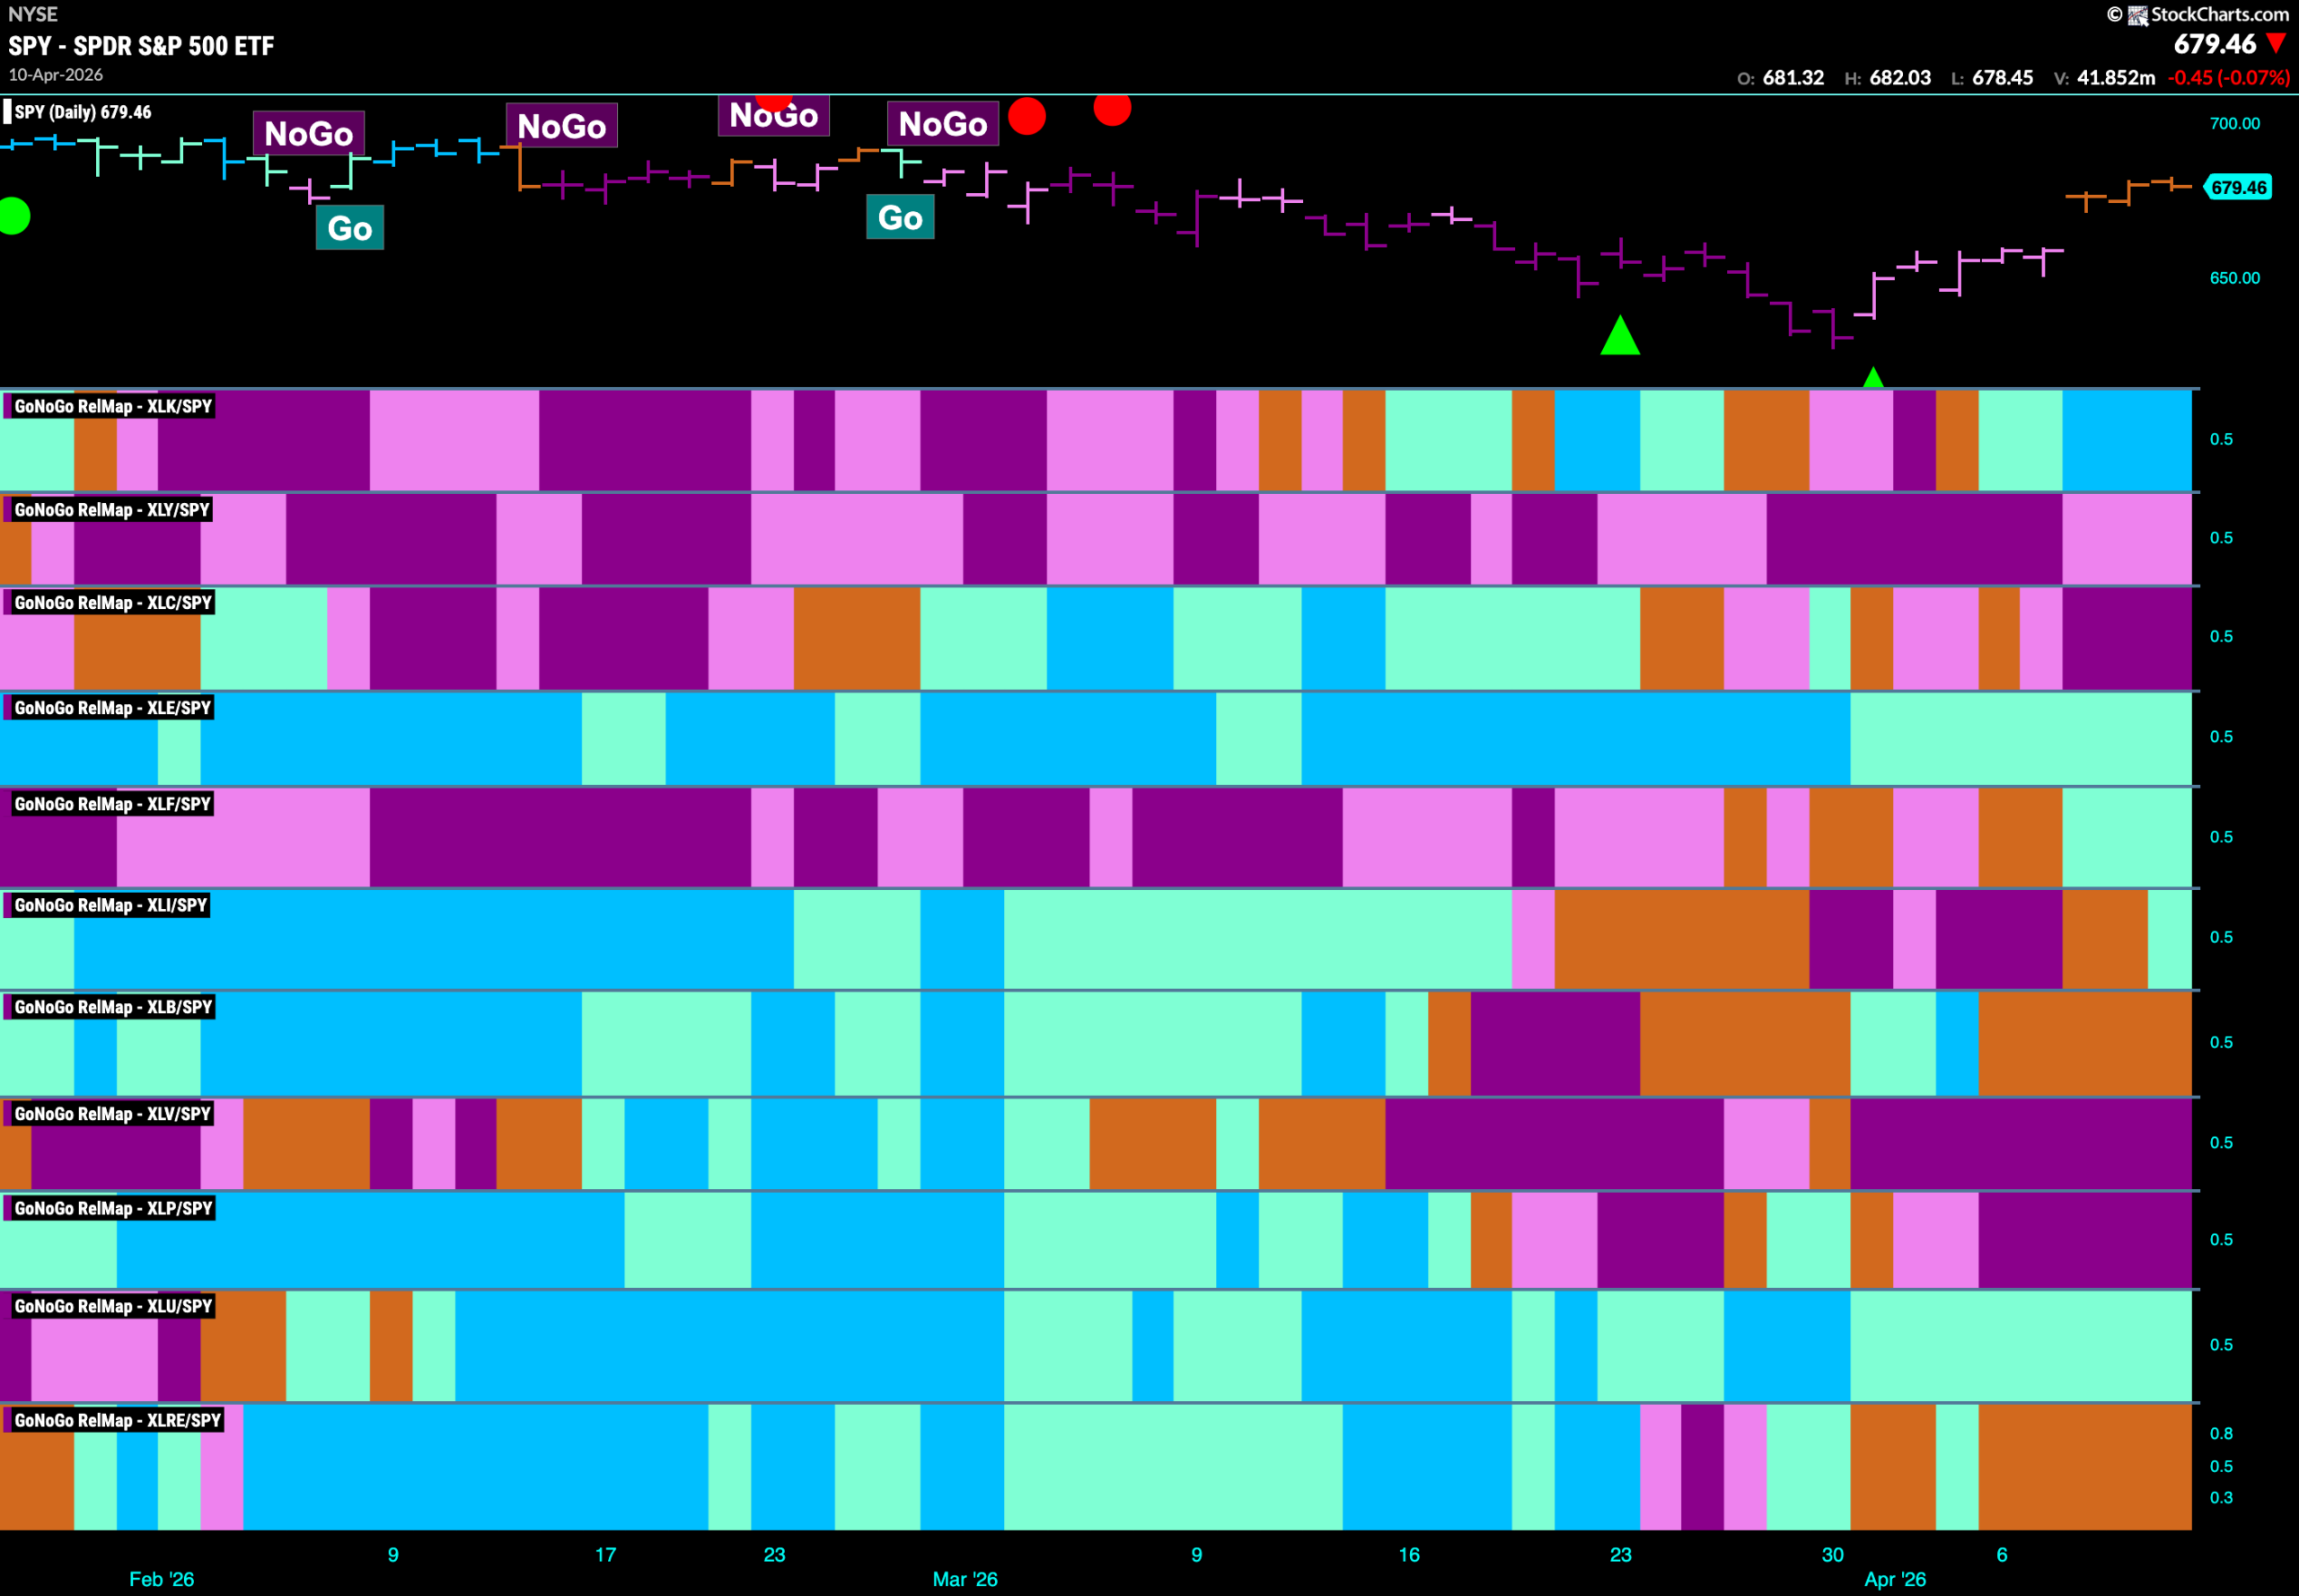
Below is the GoNoGo Sector RelMap. This GoNoGo RelMap applies the GoNoGo Trend to the relative strength ratios of the sectors to the base index. With this view we can get a sense of the relative out performance and relative underperformance of the sectors. 5 sectors are in relative “Go” trends. $XLK, $XLE, $XLF, $XLI, and $XLU are painting relative “Go” bars.
Technology Sub-Group RelMap
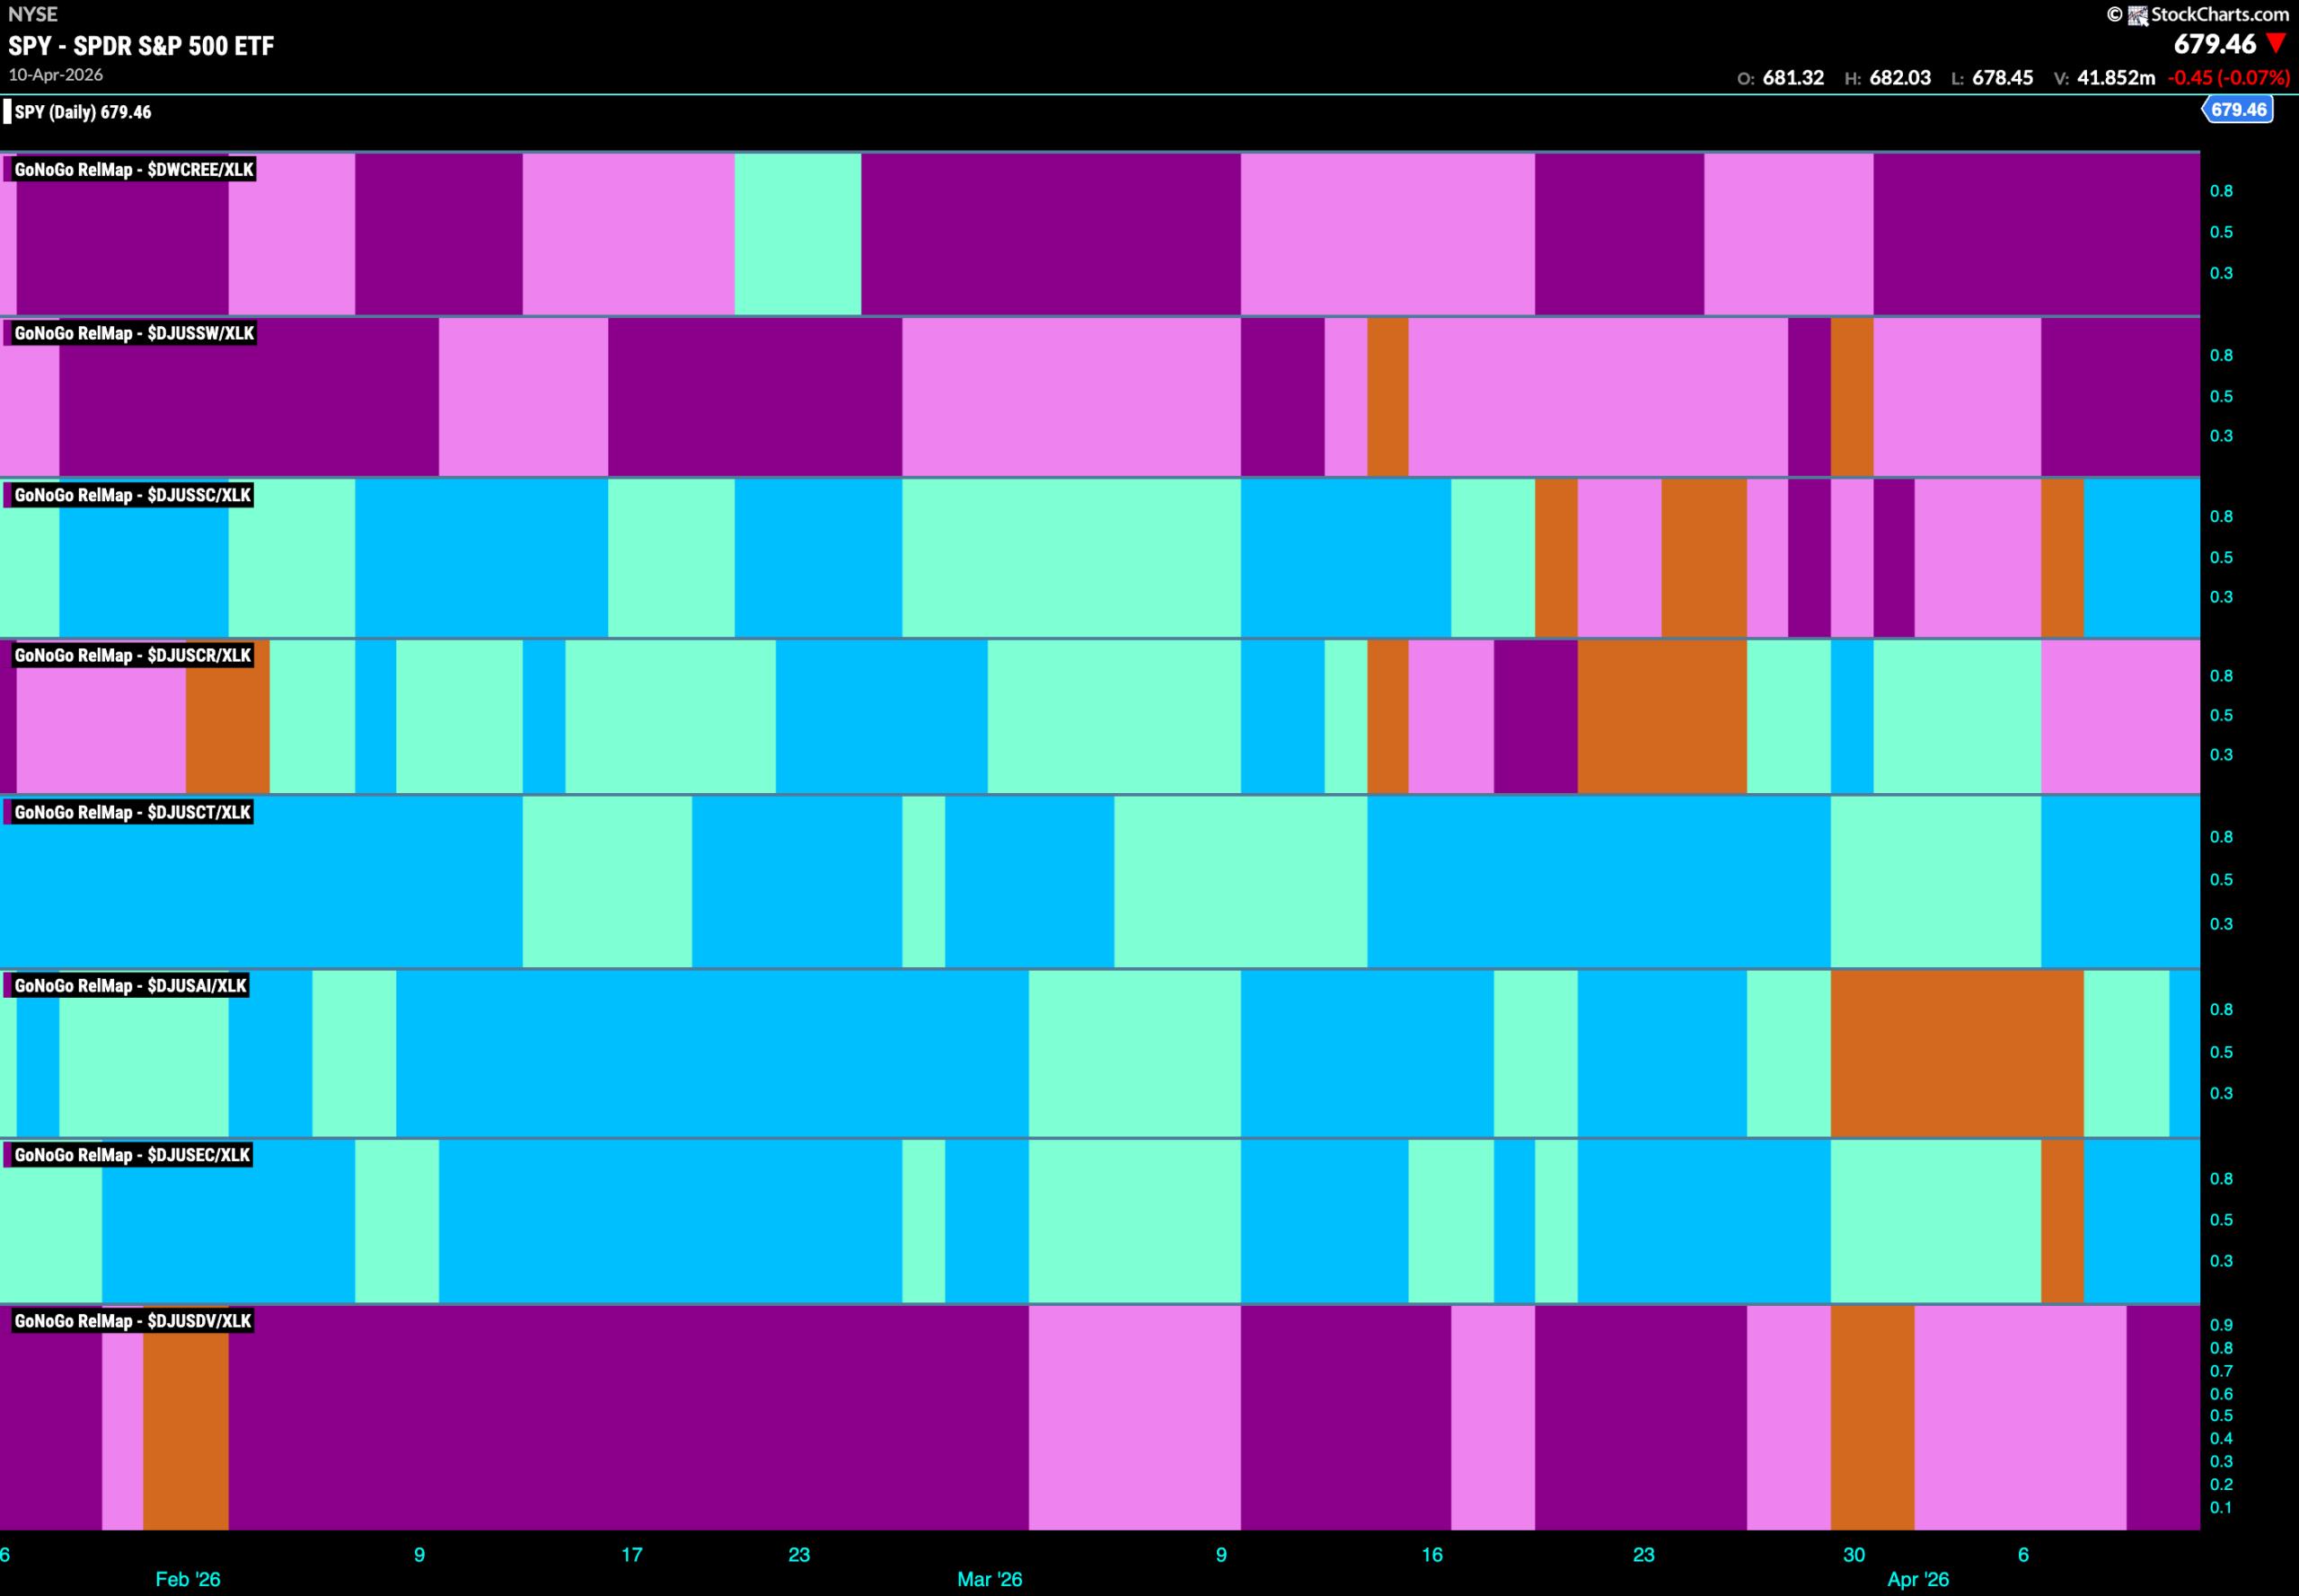
The chart below shows a relative trend breakdown of the sub groups within the technology sector this week. The Sub-Group RelMap plots the GoNoGo Trend of each sub index to the $XLK. We saw in the above GoNoGo Sector RelMap that $XLK is a new out-performer and paints strong relative “Go” bars. When we look at the below RelMap we can see that the semiconductors index in the third panel is again painting strong “Go” bars on a relative basis.
$SNDK Looks To Break Out of Channel
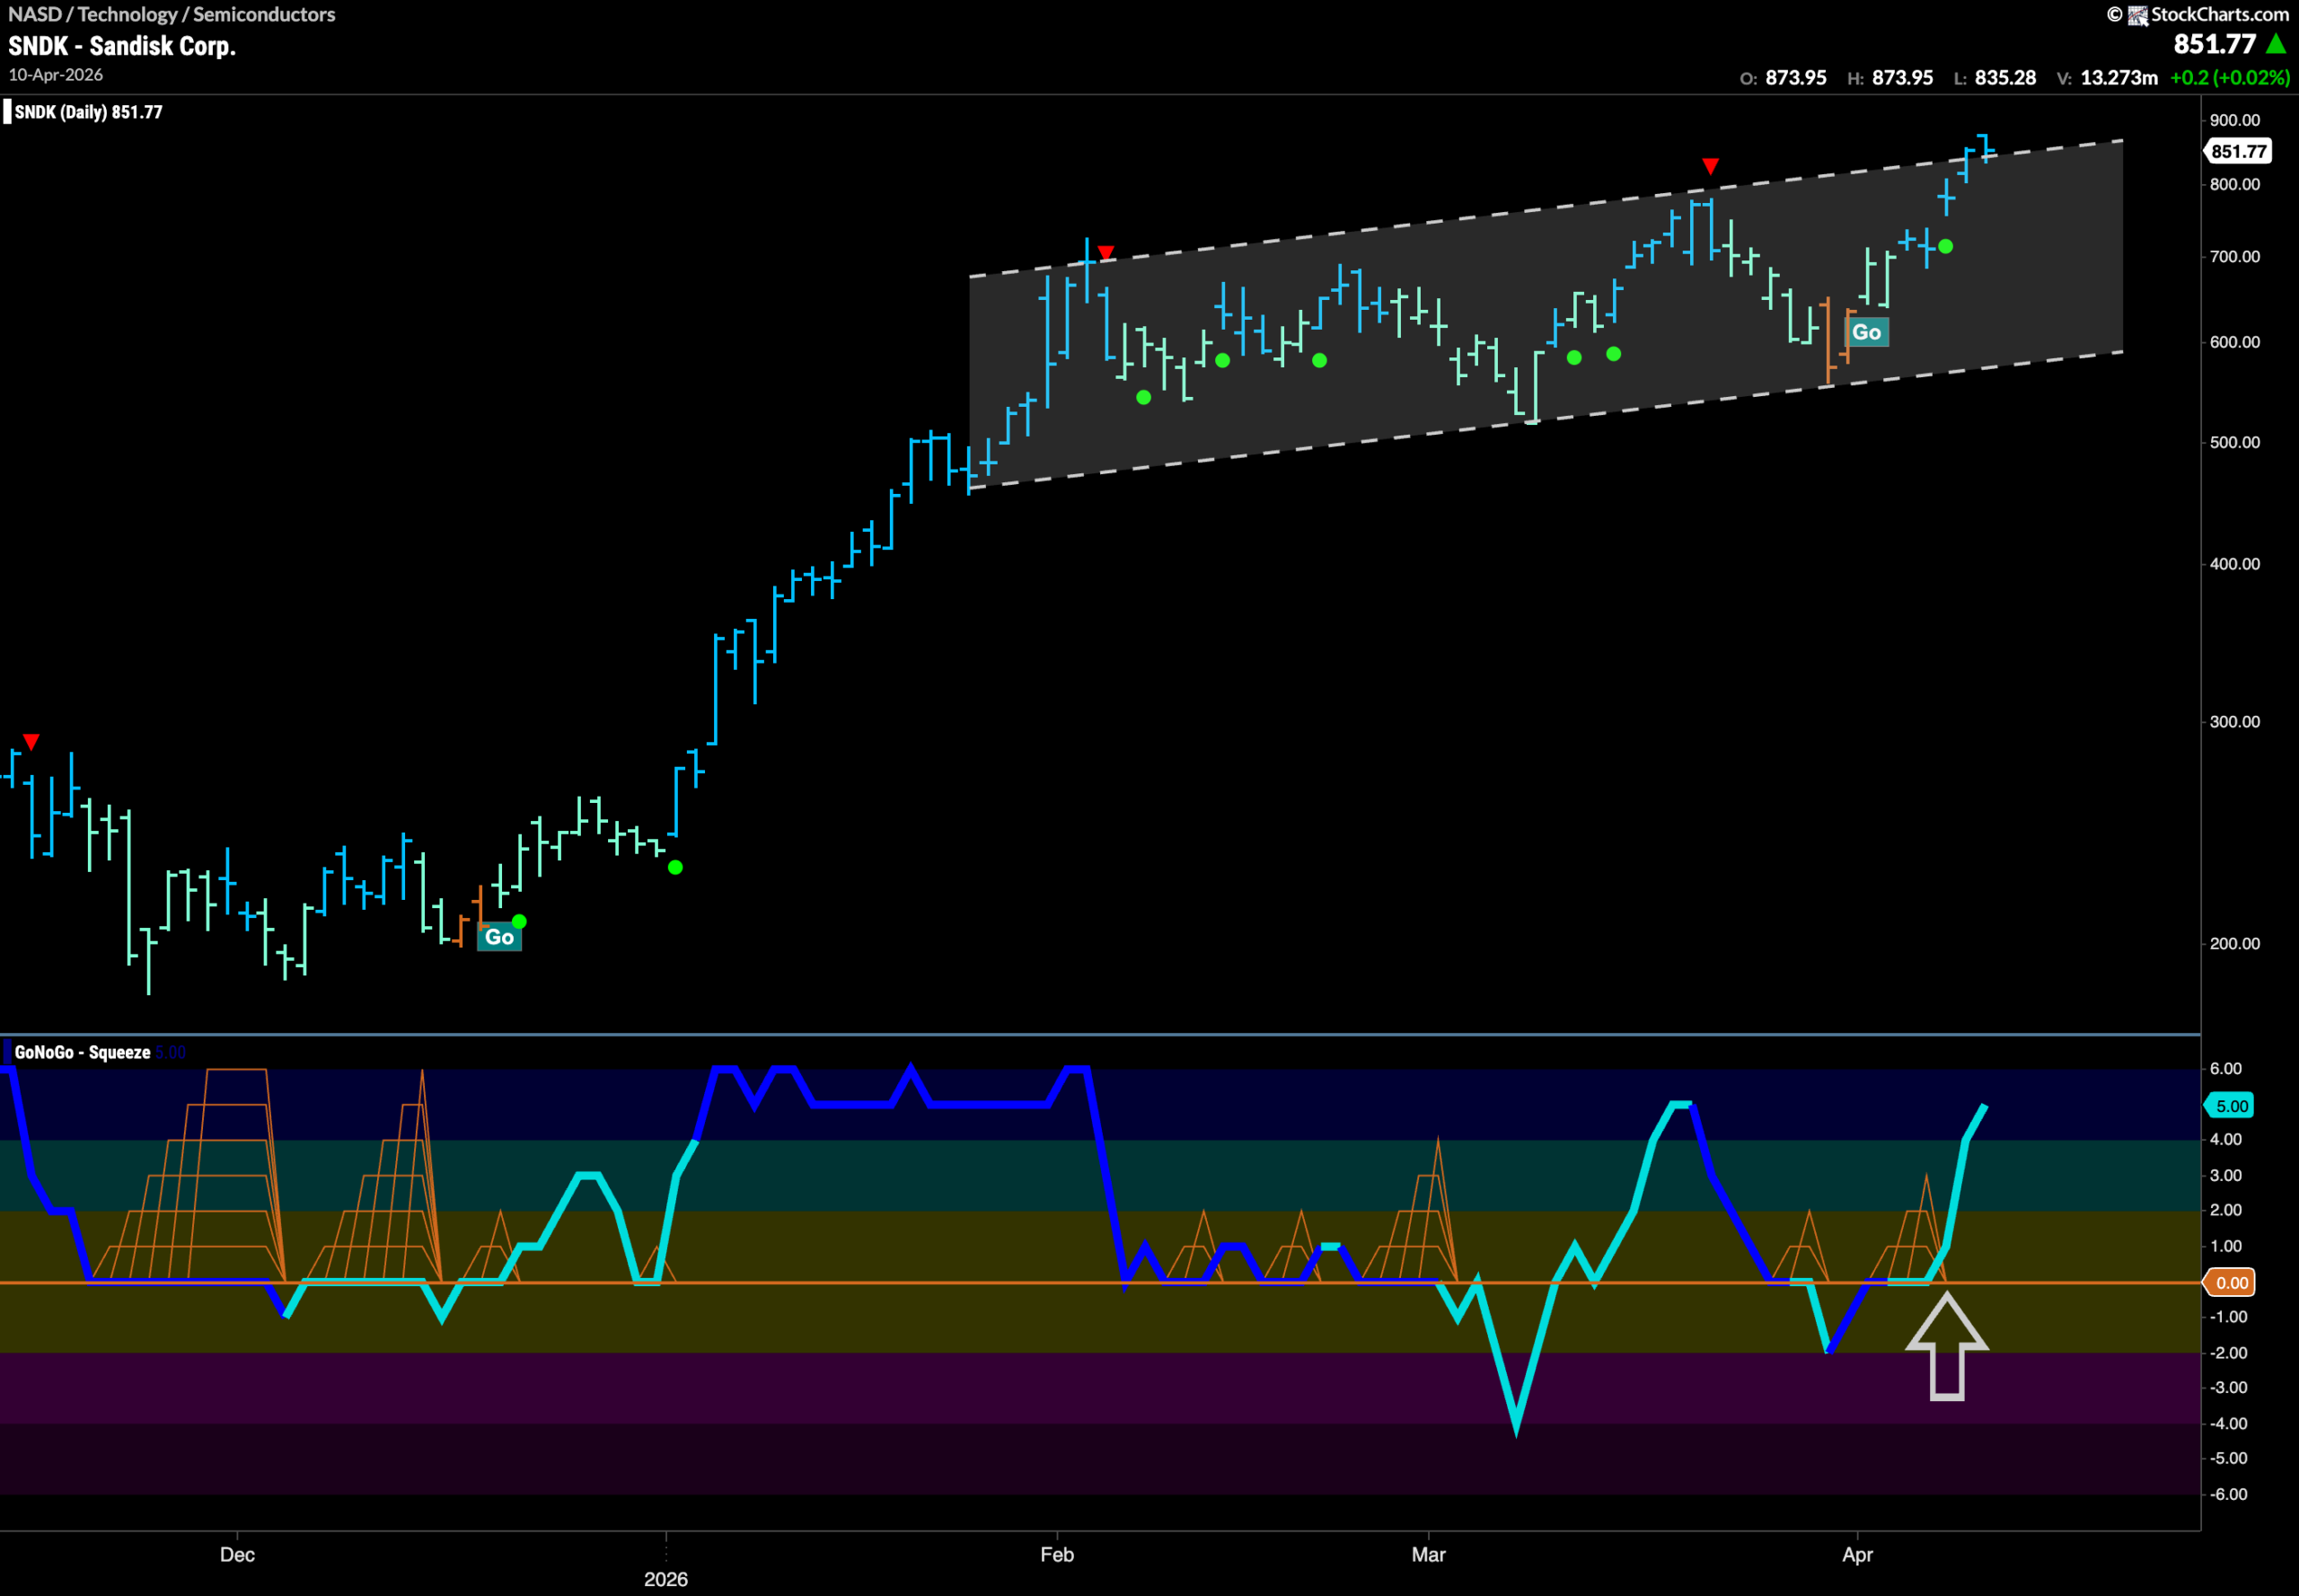
GoNoGo Trend shows that $SNDK has been in a “Go” trend for several months. Recently, we see that price action has settled into an upward sloping channel making gradually higher highs and higher lows. Now, we see price challenging the upper bound of that price channel with GoNoGo Trend painting strong blue bars. GoNoGo Oscillator, having rallied back into positive territory is showing the renewed enthusiasm as it races through positive territory and into overbought levels. We will look to see if price can consolidate at these higher levels and break out to new higher highs.
$SKYT Looks For Trend Change?
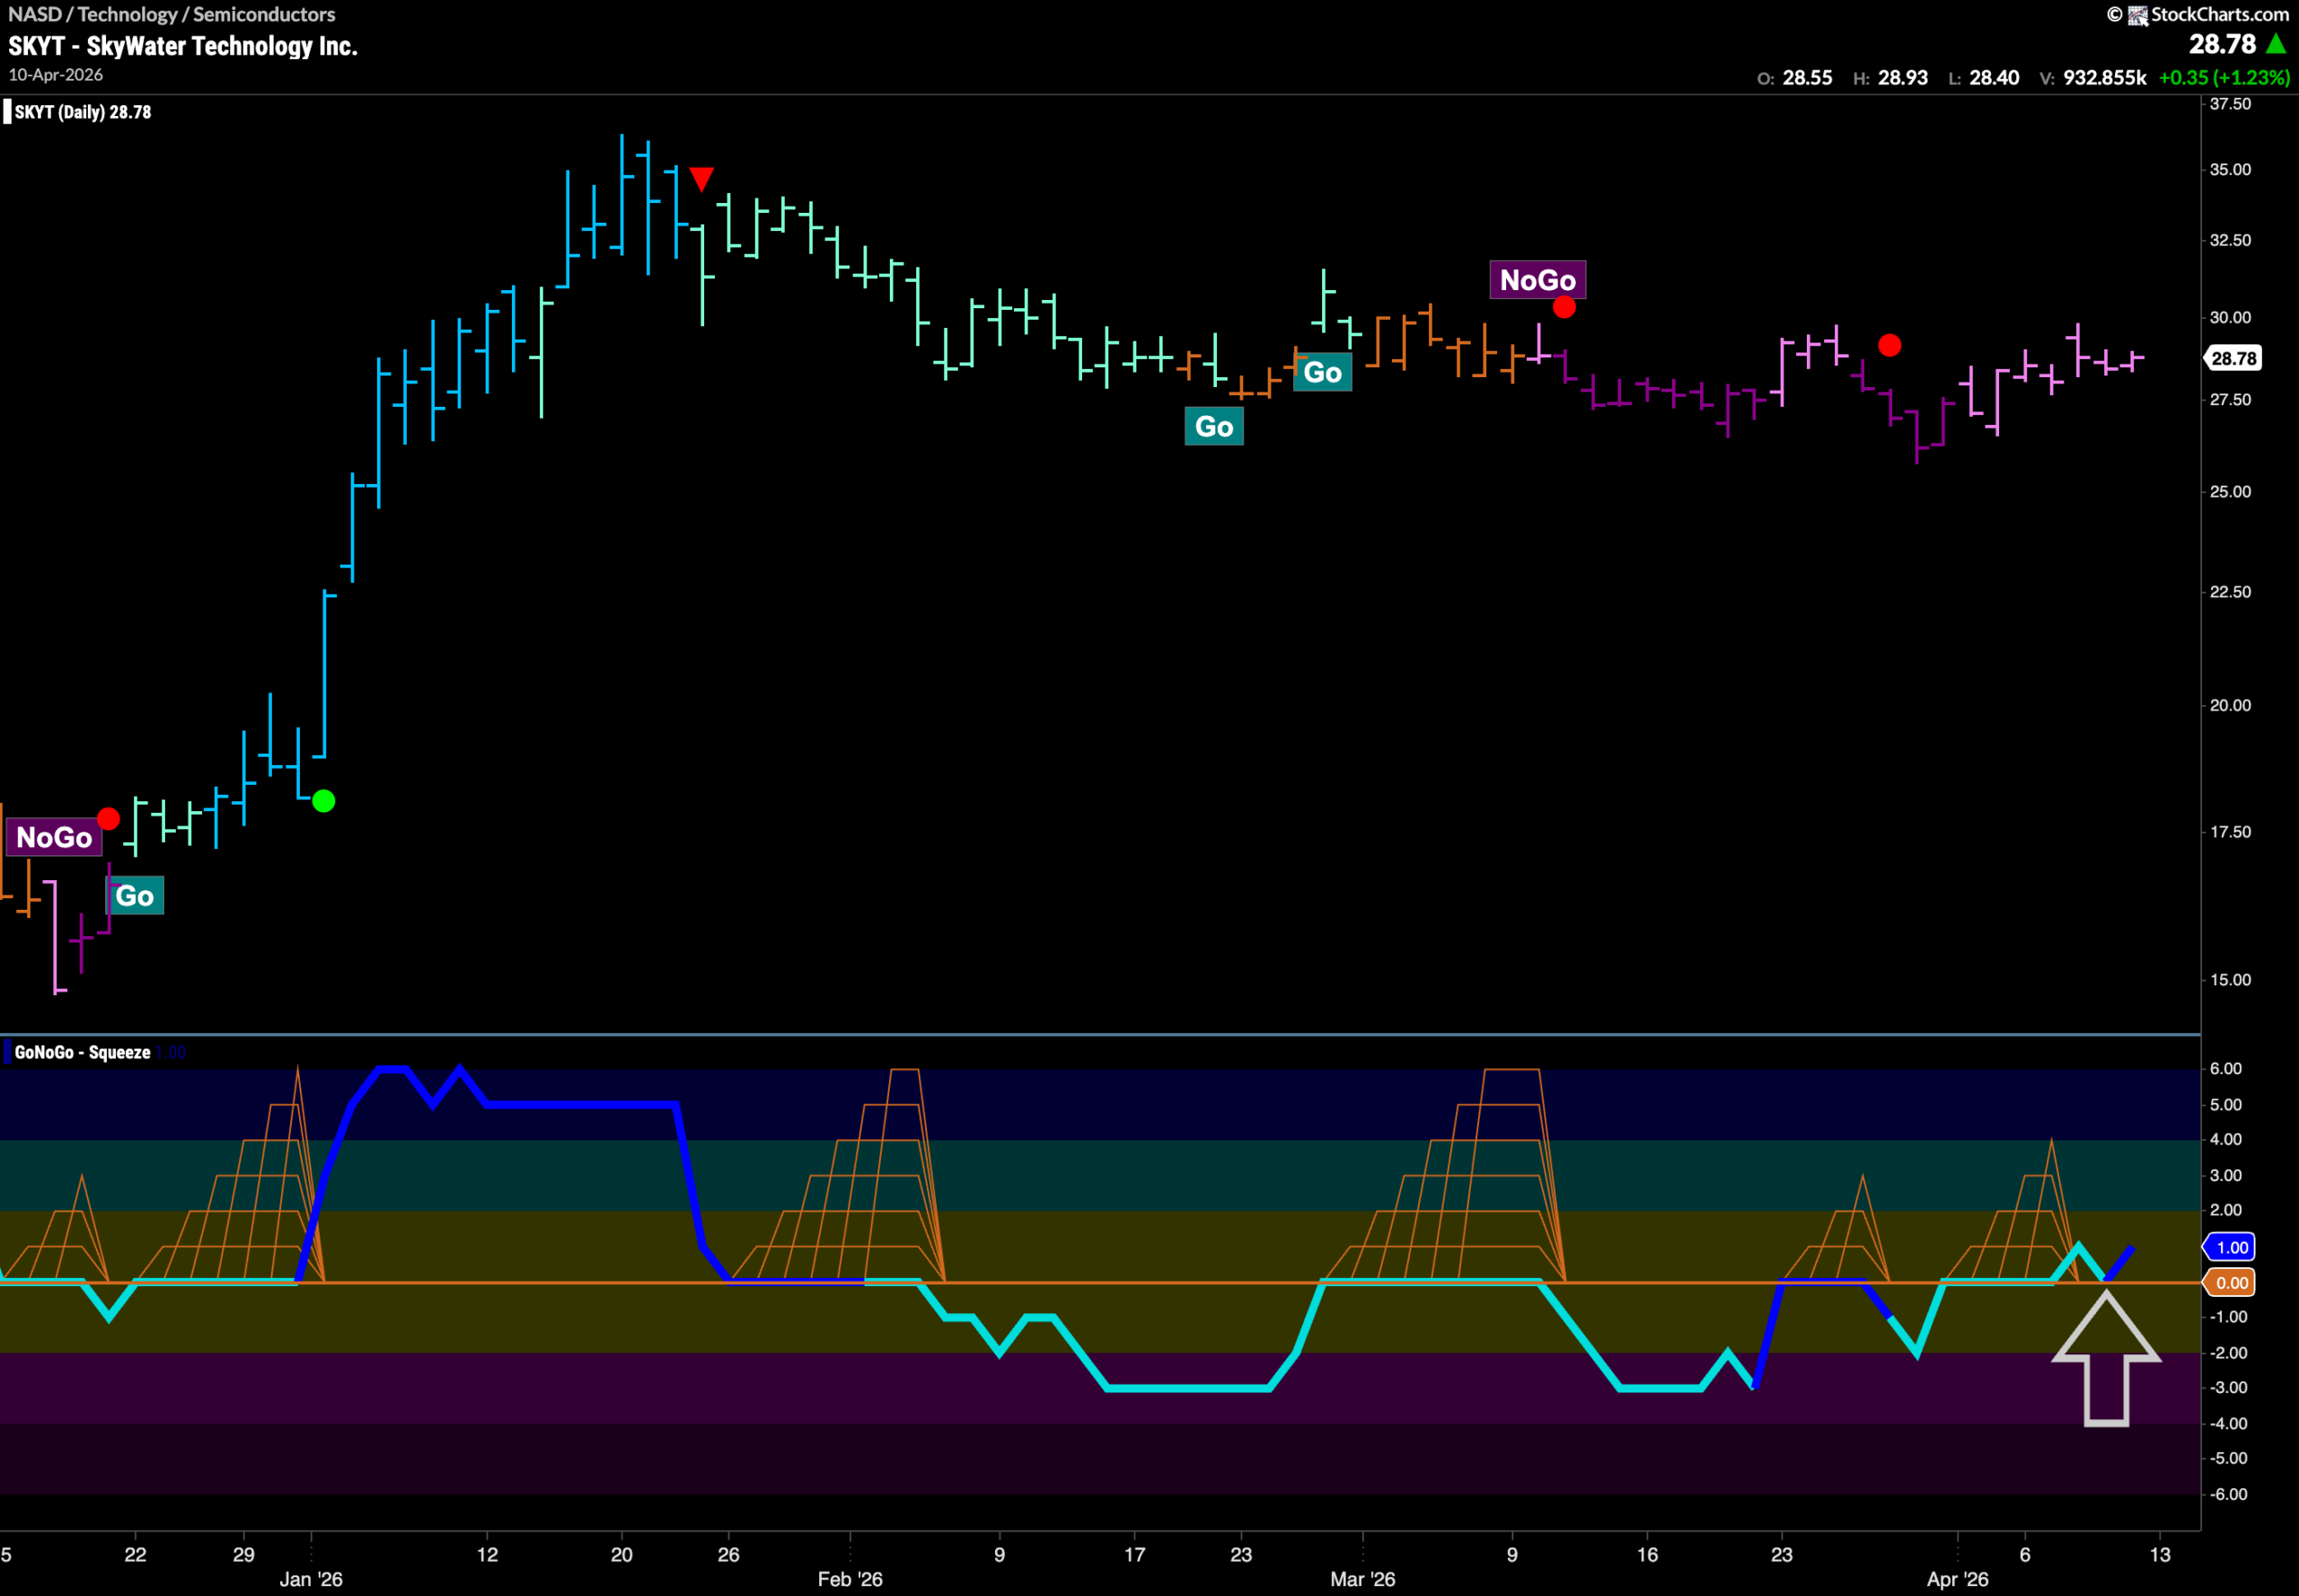
$SKYT has been meandering slightly lower for several months after falling out of a “Go” trend into a “NoGo” correction. During this time, GoNoGo Oscillator remained at or below the zero line showing little signs of positive momentum. Now, with GoNoGo Trend showing weaker pink bars, we see that GoNoGo Oscillator has found its way back into positive territory and has already quickly retested that level. Should GoNoGo Oscillator remain in positive territory we would expect pressure on price to look for a new “Go” trend in the price panel above.