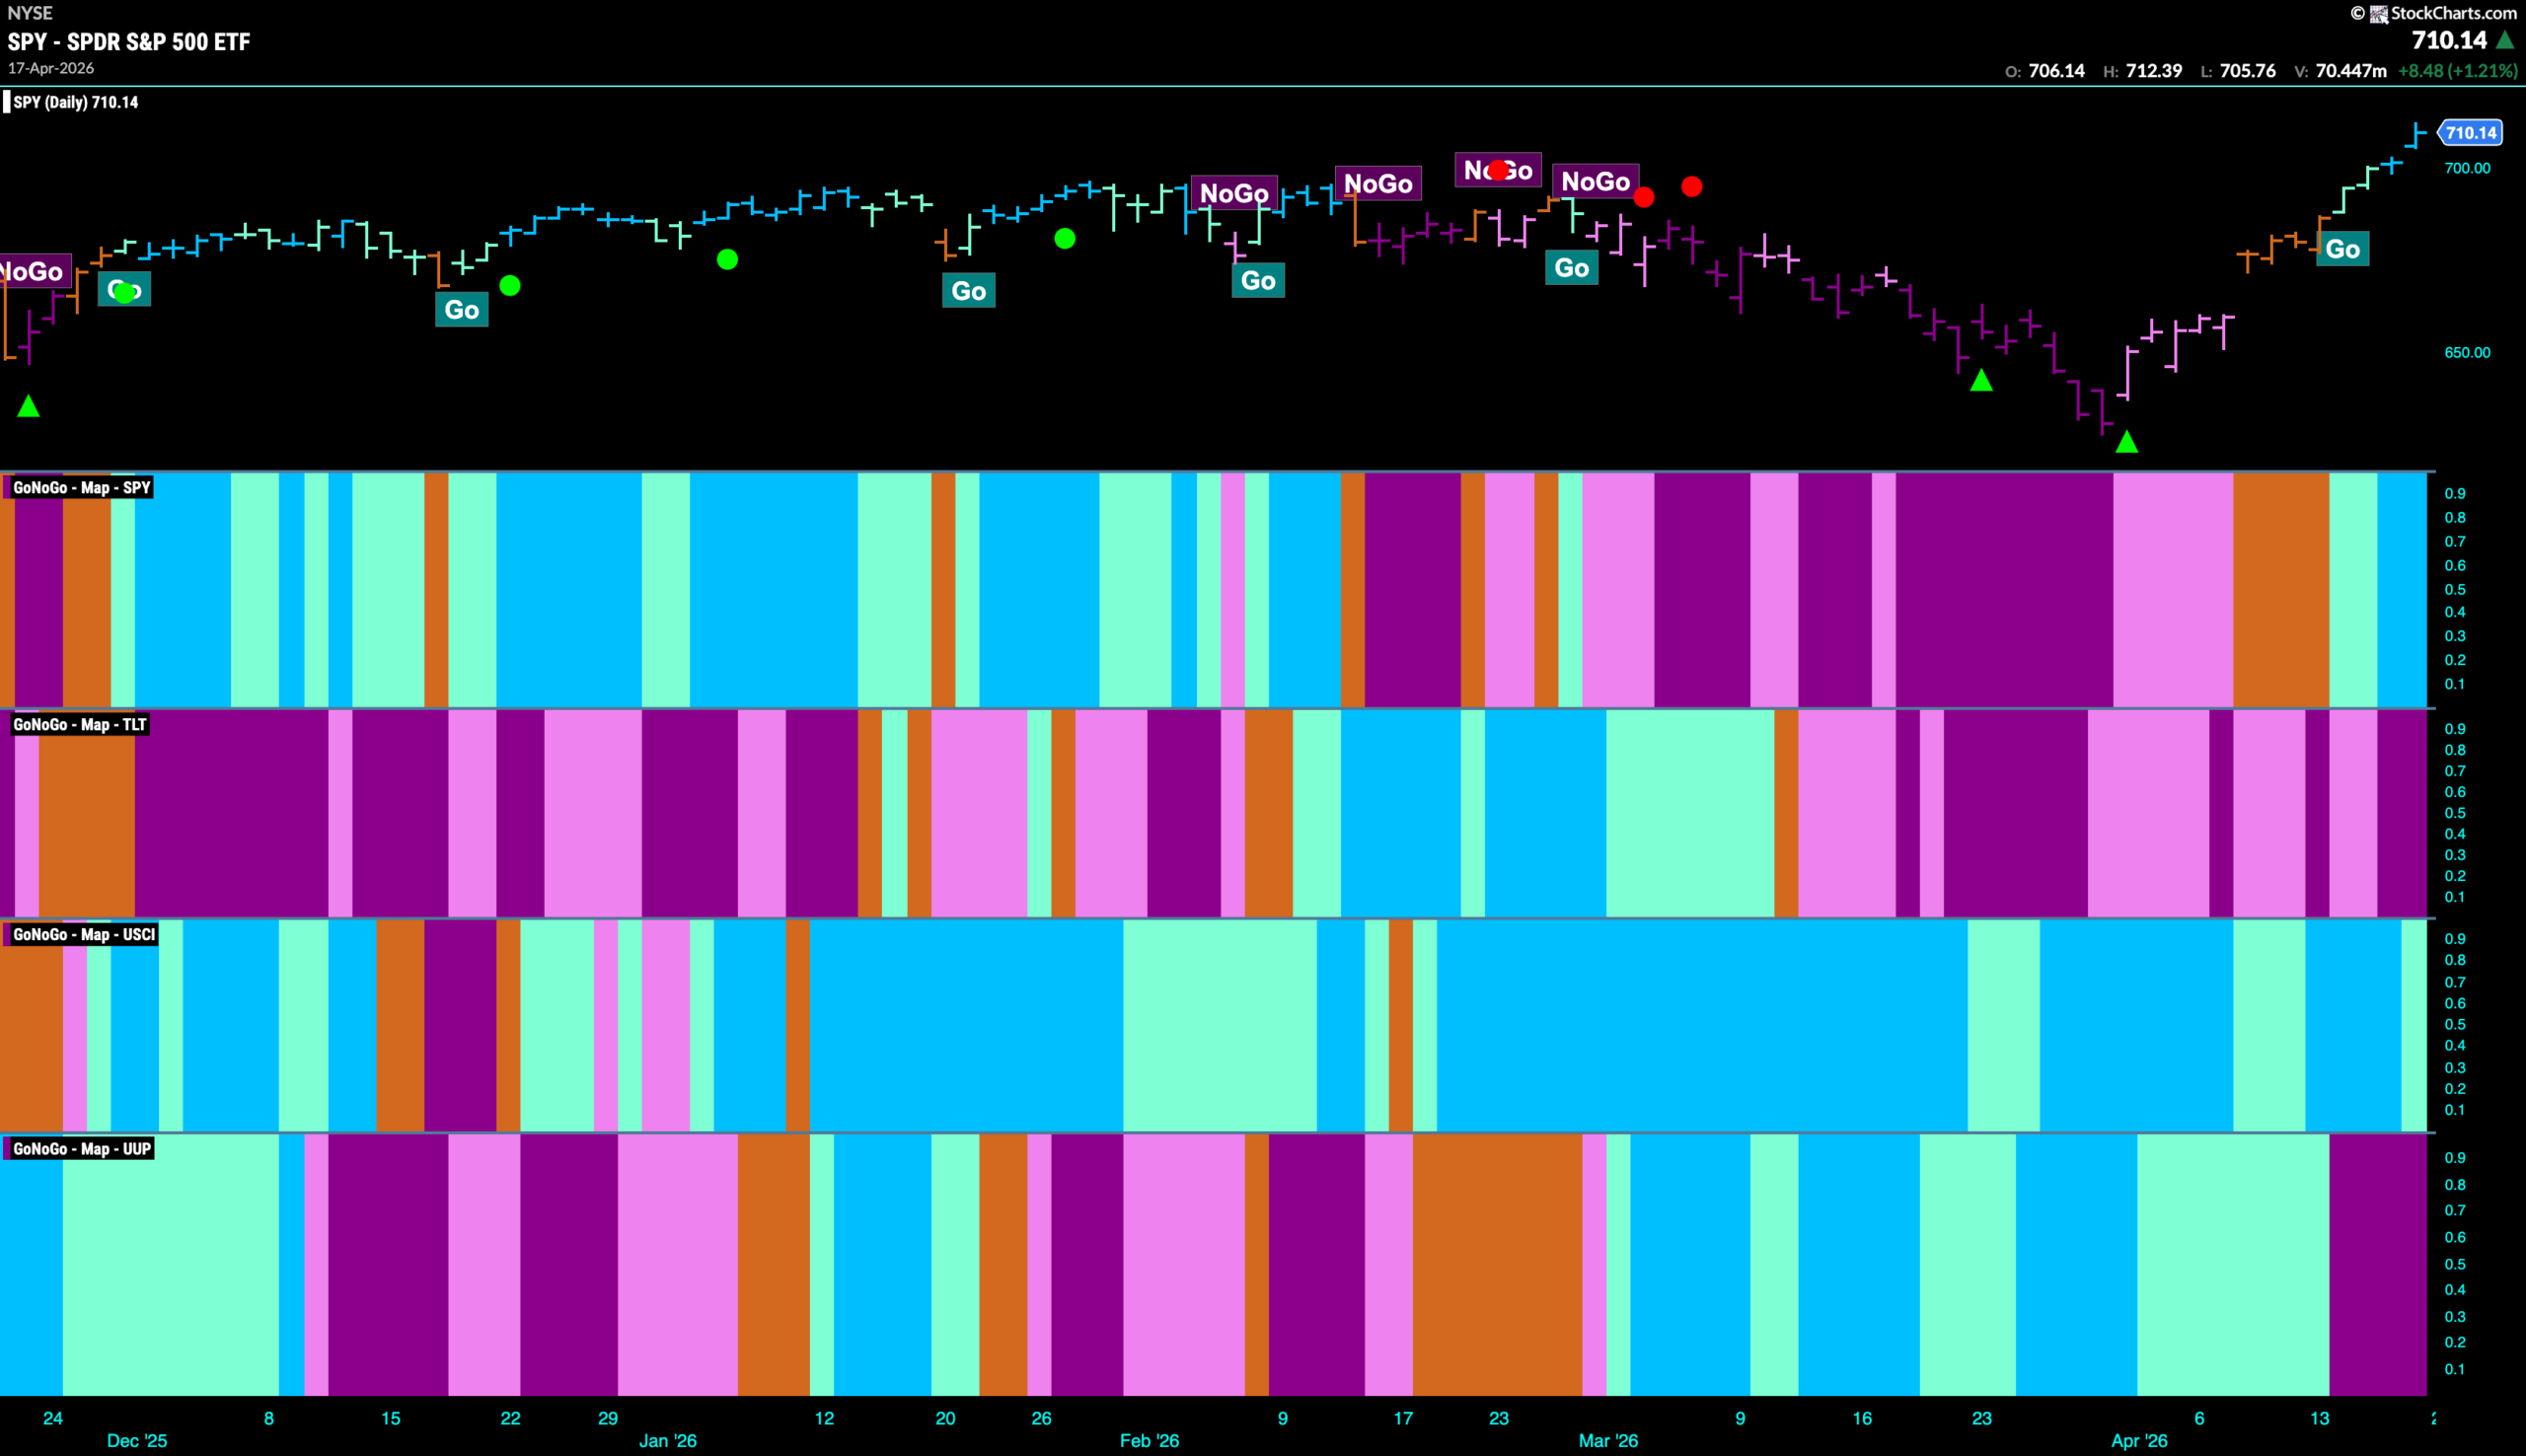
Good morning and welcome to this week’s Flight Path. The equity trend the trend change this week as after several amber “Go Fish” bars of uncertainty we saw the indicator paint “Go” bars. First aqua then strong blue bars as price hit new highs. Treasury bond prices remained in a “NoGo” trend and we saw strength return with purple bars. U.S. commodities painted “Go” bars again this week but in the last session we saw a weaker aqua bar. The dollar saw a swift trend change this week as GoNoGo Trend painted strong purple bars immediately following weak aqua bars.
$SPY Off to the Races With New Highs
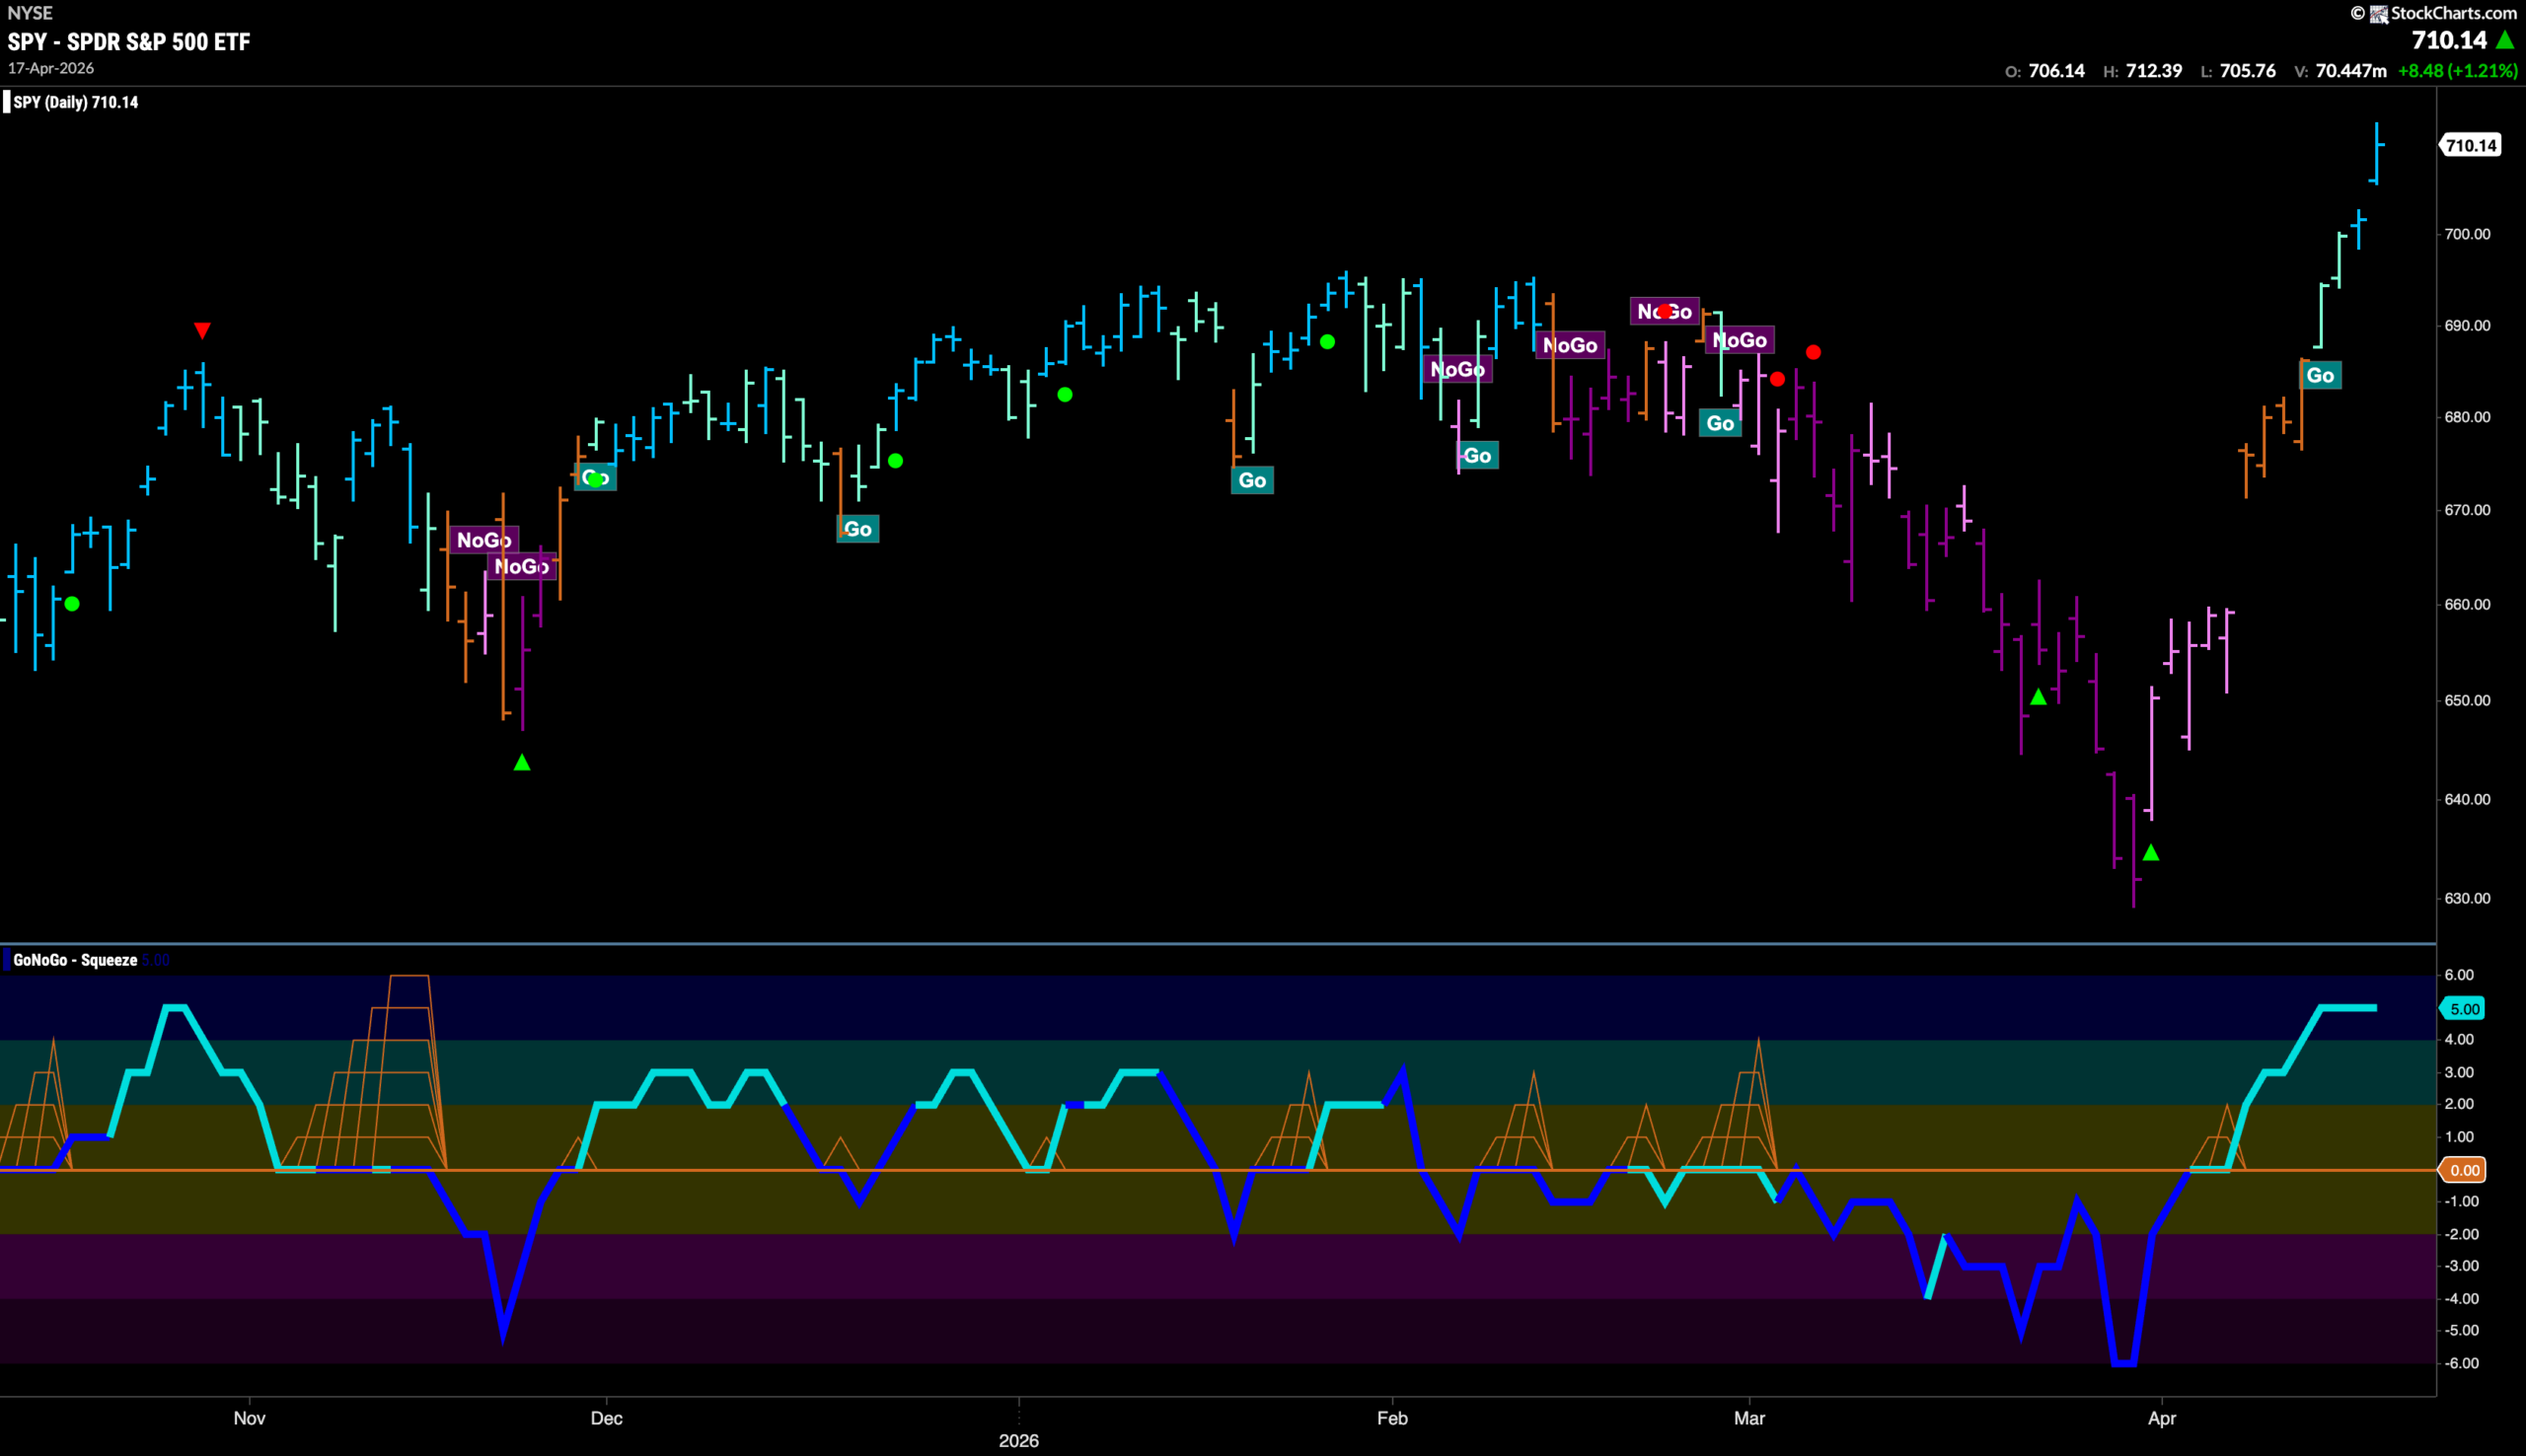
The GoNoGo chart below shows that the uncertainty we saw in the market last week gave way to a “Go” trend. Price rose the whole week as GoNoGo Trend moved through first aqua bars then into strong blue “Go” bars as price hit new highs. GoNoGo Oscillator is now resting in overbought territory at a value of 5. We will watch to see if price takes a pause if momentum wanes. Should the oscillator fall to the zero line we would expect it to look for support at that level as it tries to consolidate these new price gains.
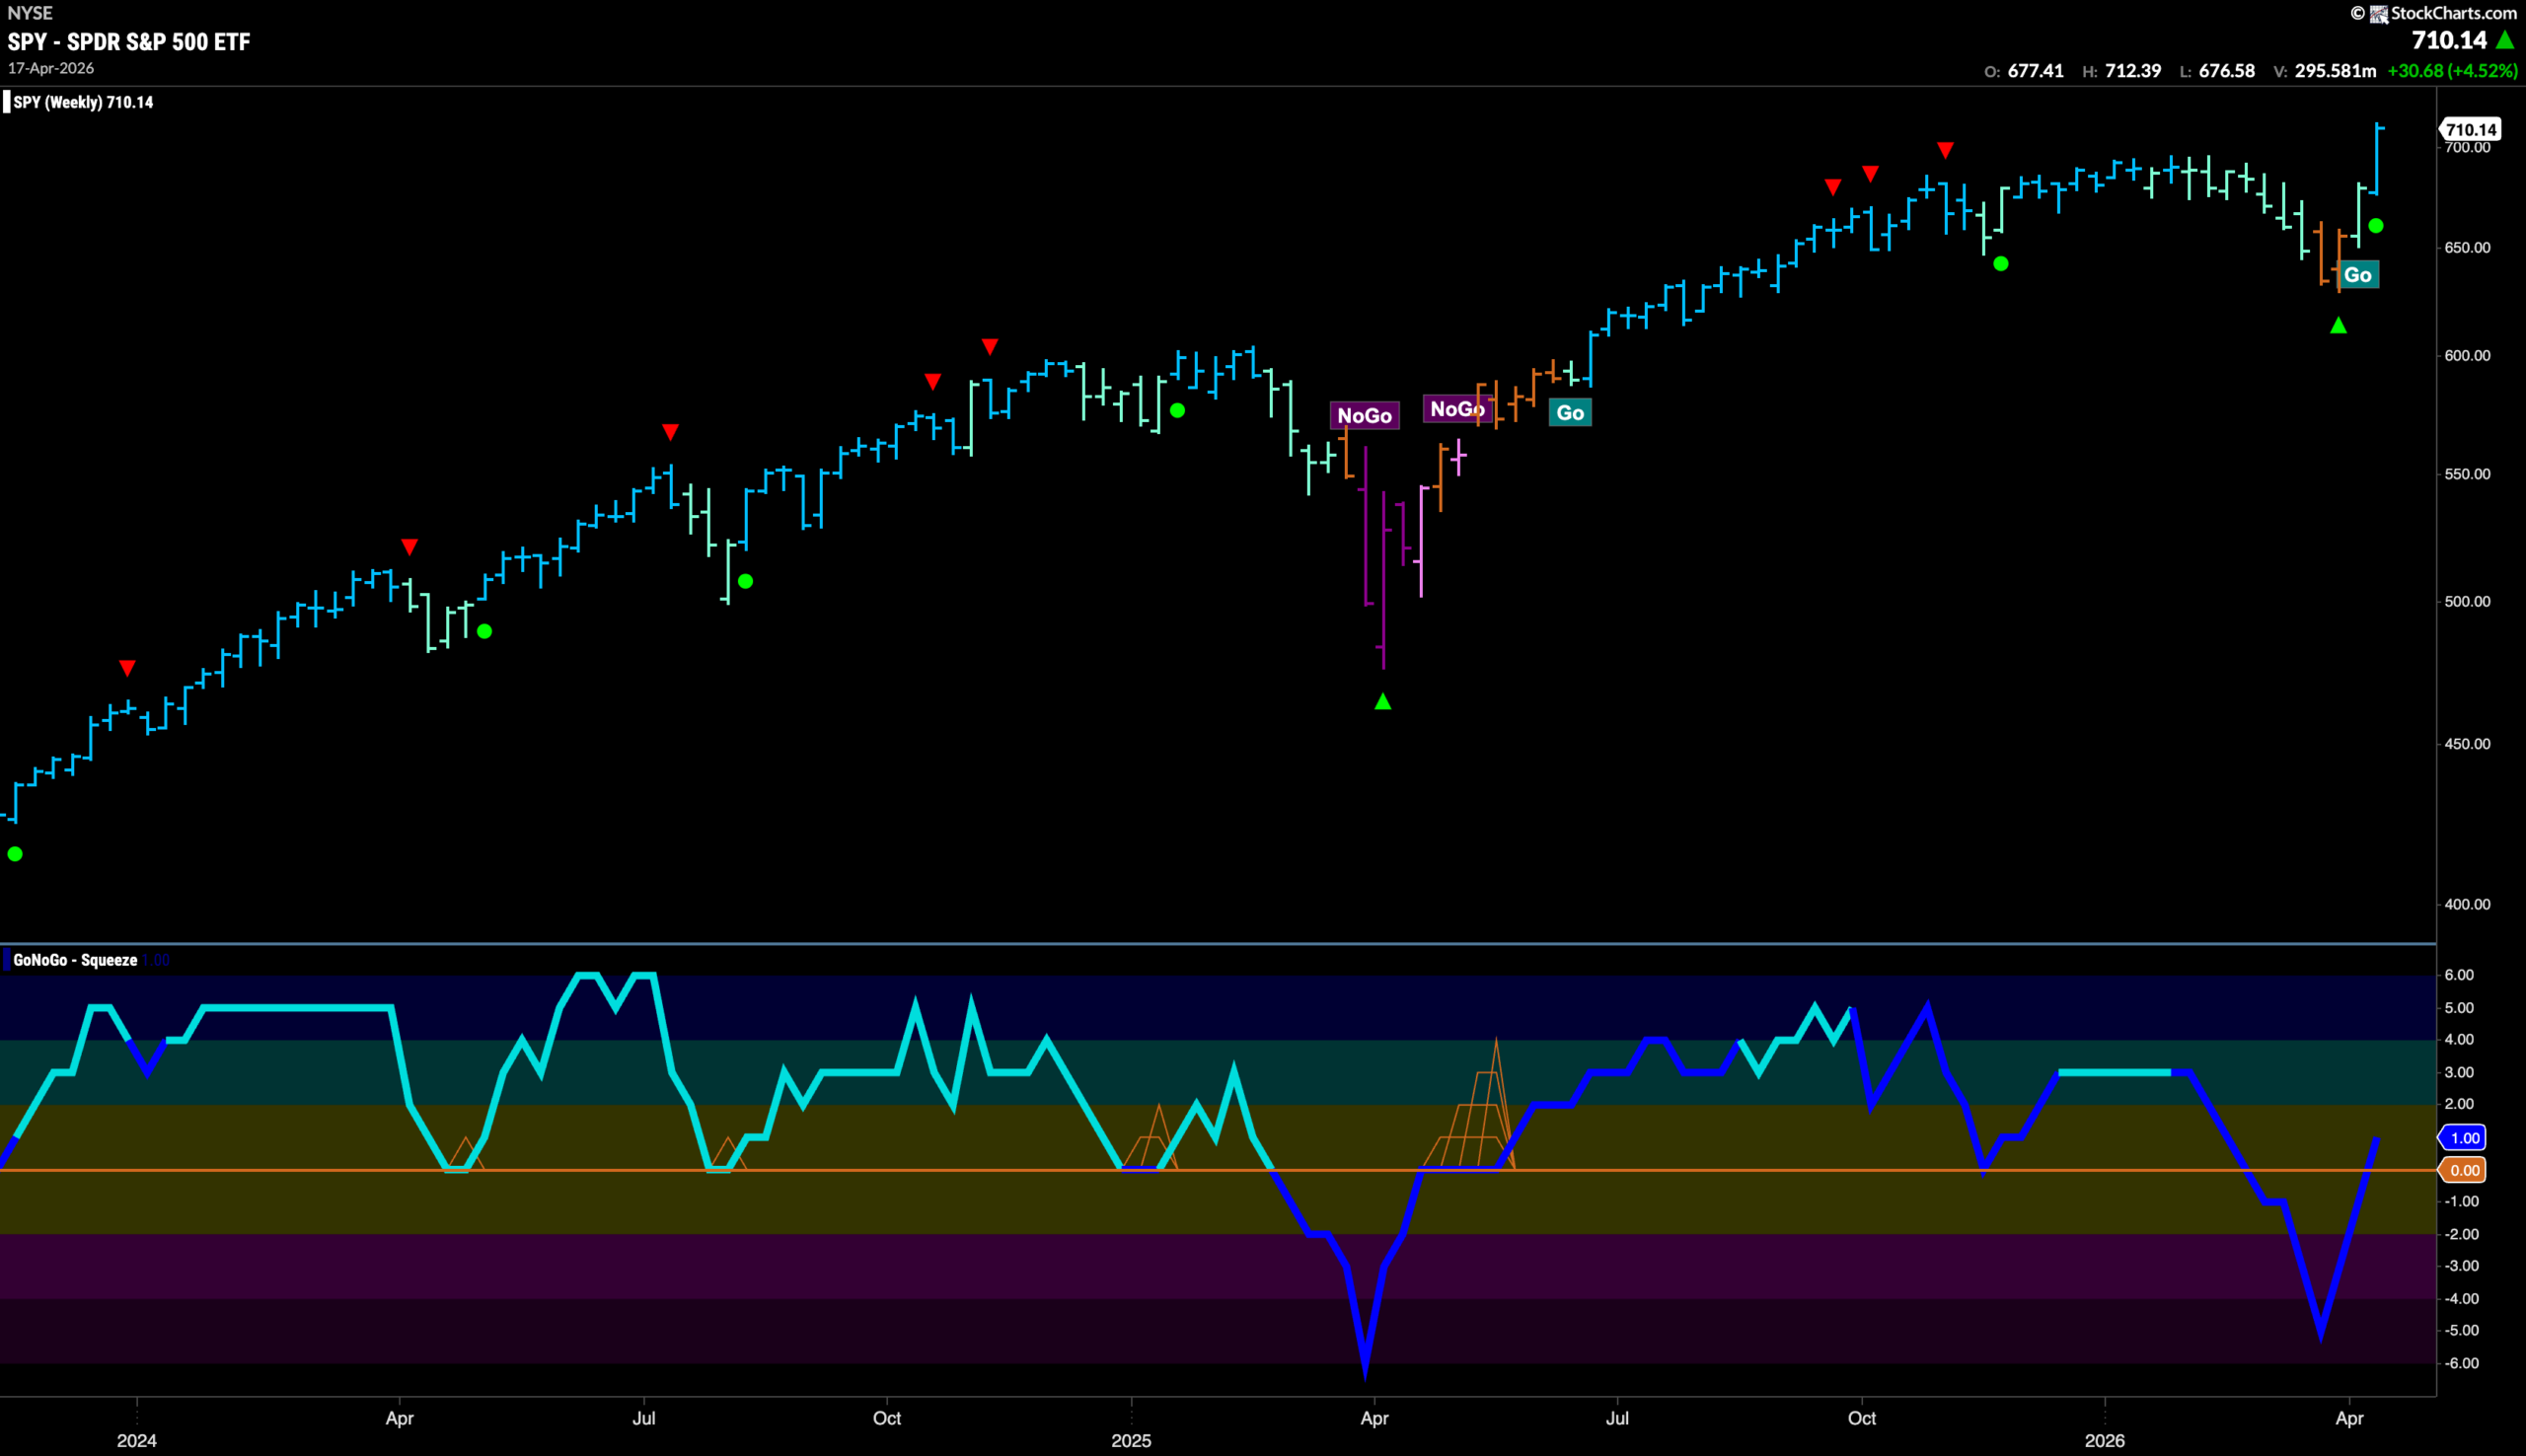
The weekly chart shows that the “Go” trend strengthened on a very strong bar last week. A first bright blue “Go” bar has seen price eclipse prior highs and we will watch to see if the coming weeks see further gains. If we look to the oscillator panel we see that it found support at zero on heavy volume. This has triggered a Trend Continuation Icon (green circle) telling us that momentum is resurgent in the direction of the trend.
Treasury Rates Remain in Weak “Go” Trend
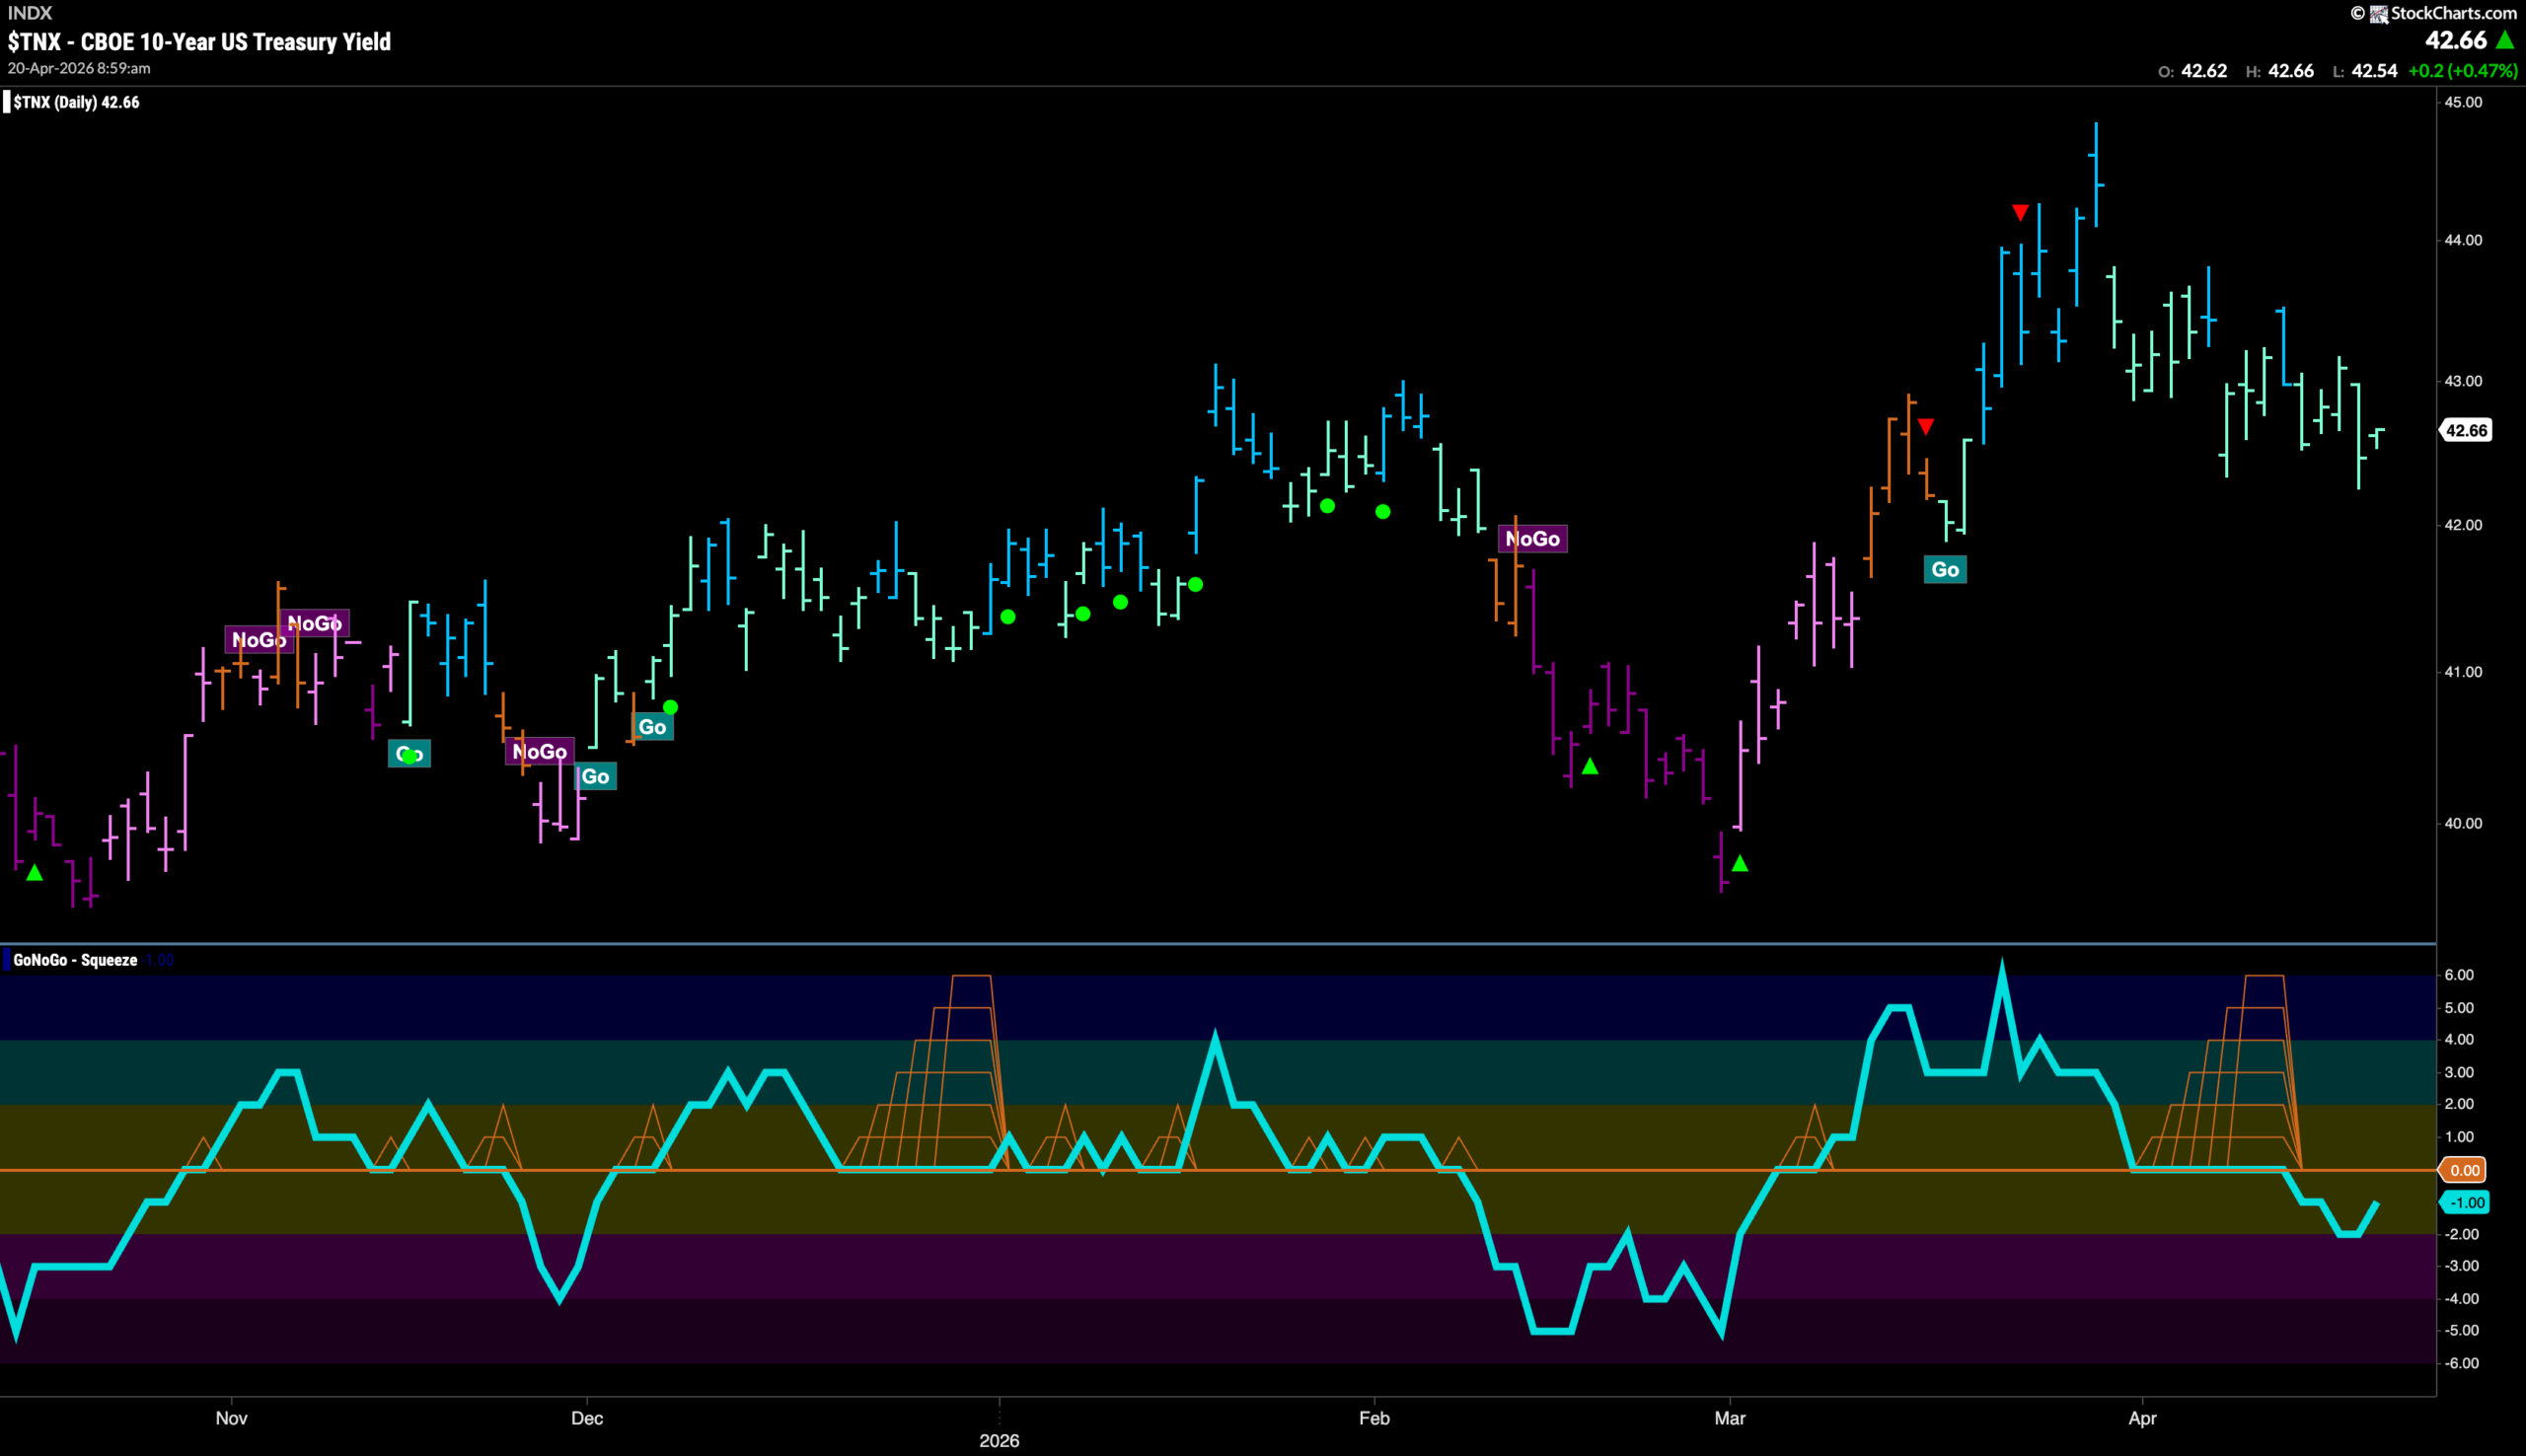
GoNoGo Trend shows that the “Go” trend remains in place but again this week we see weaker aqua bars as price continues its slide from the recent high. If we turn our attention to the oscillator panel we can see that it has broken out of a Max GoNoGo Squeeze into negative territory and is now at a value of -1. Momentum is therefore out of step with the “Go” trend and we will watch to see if this leads to a trend change in the price panel above.
Dollar ($UUP) Sees Trend Change to “NoGo”
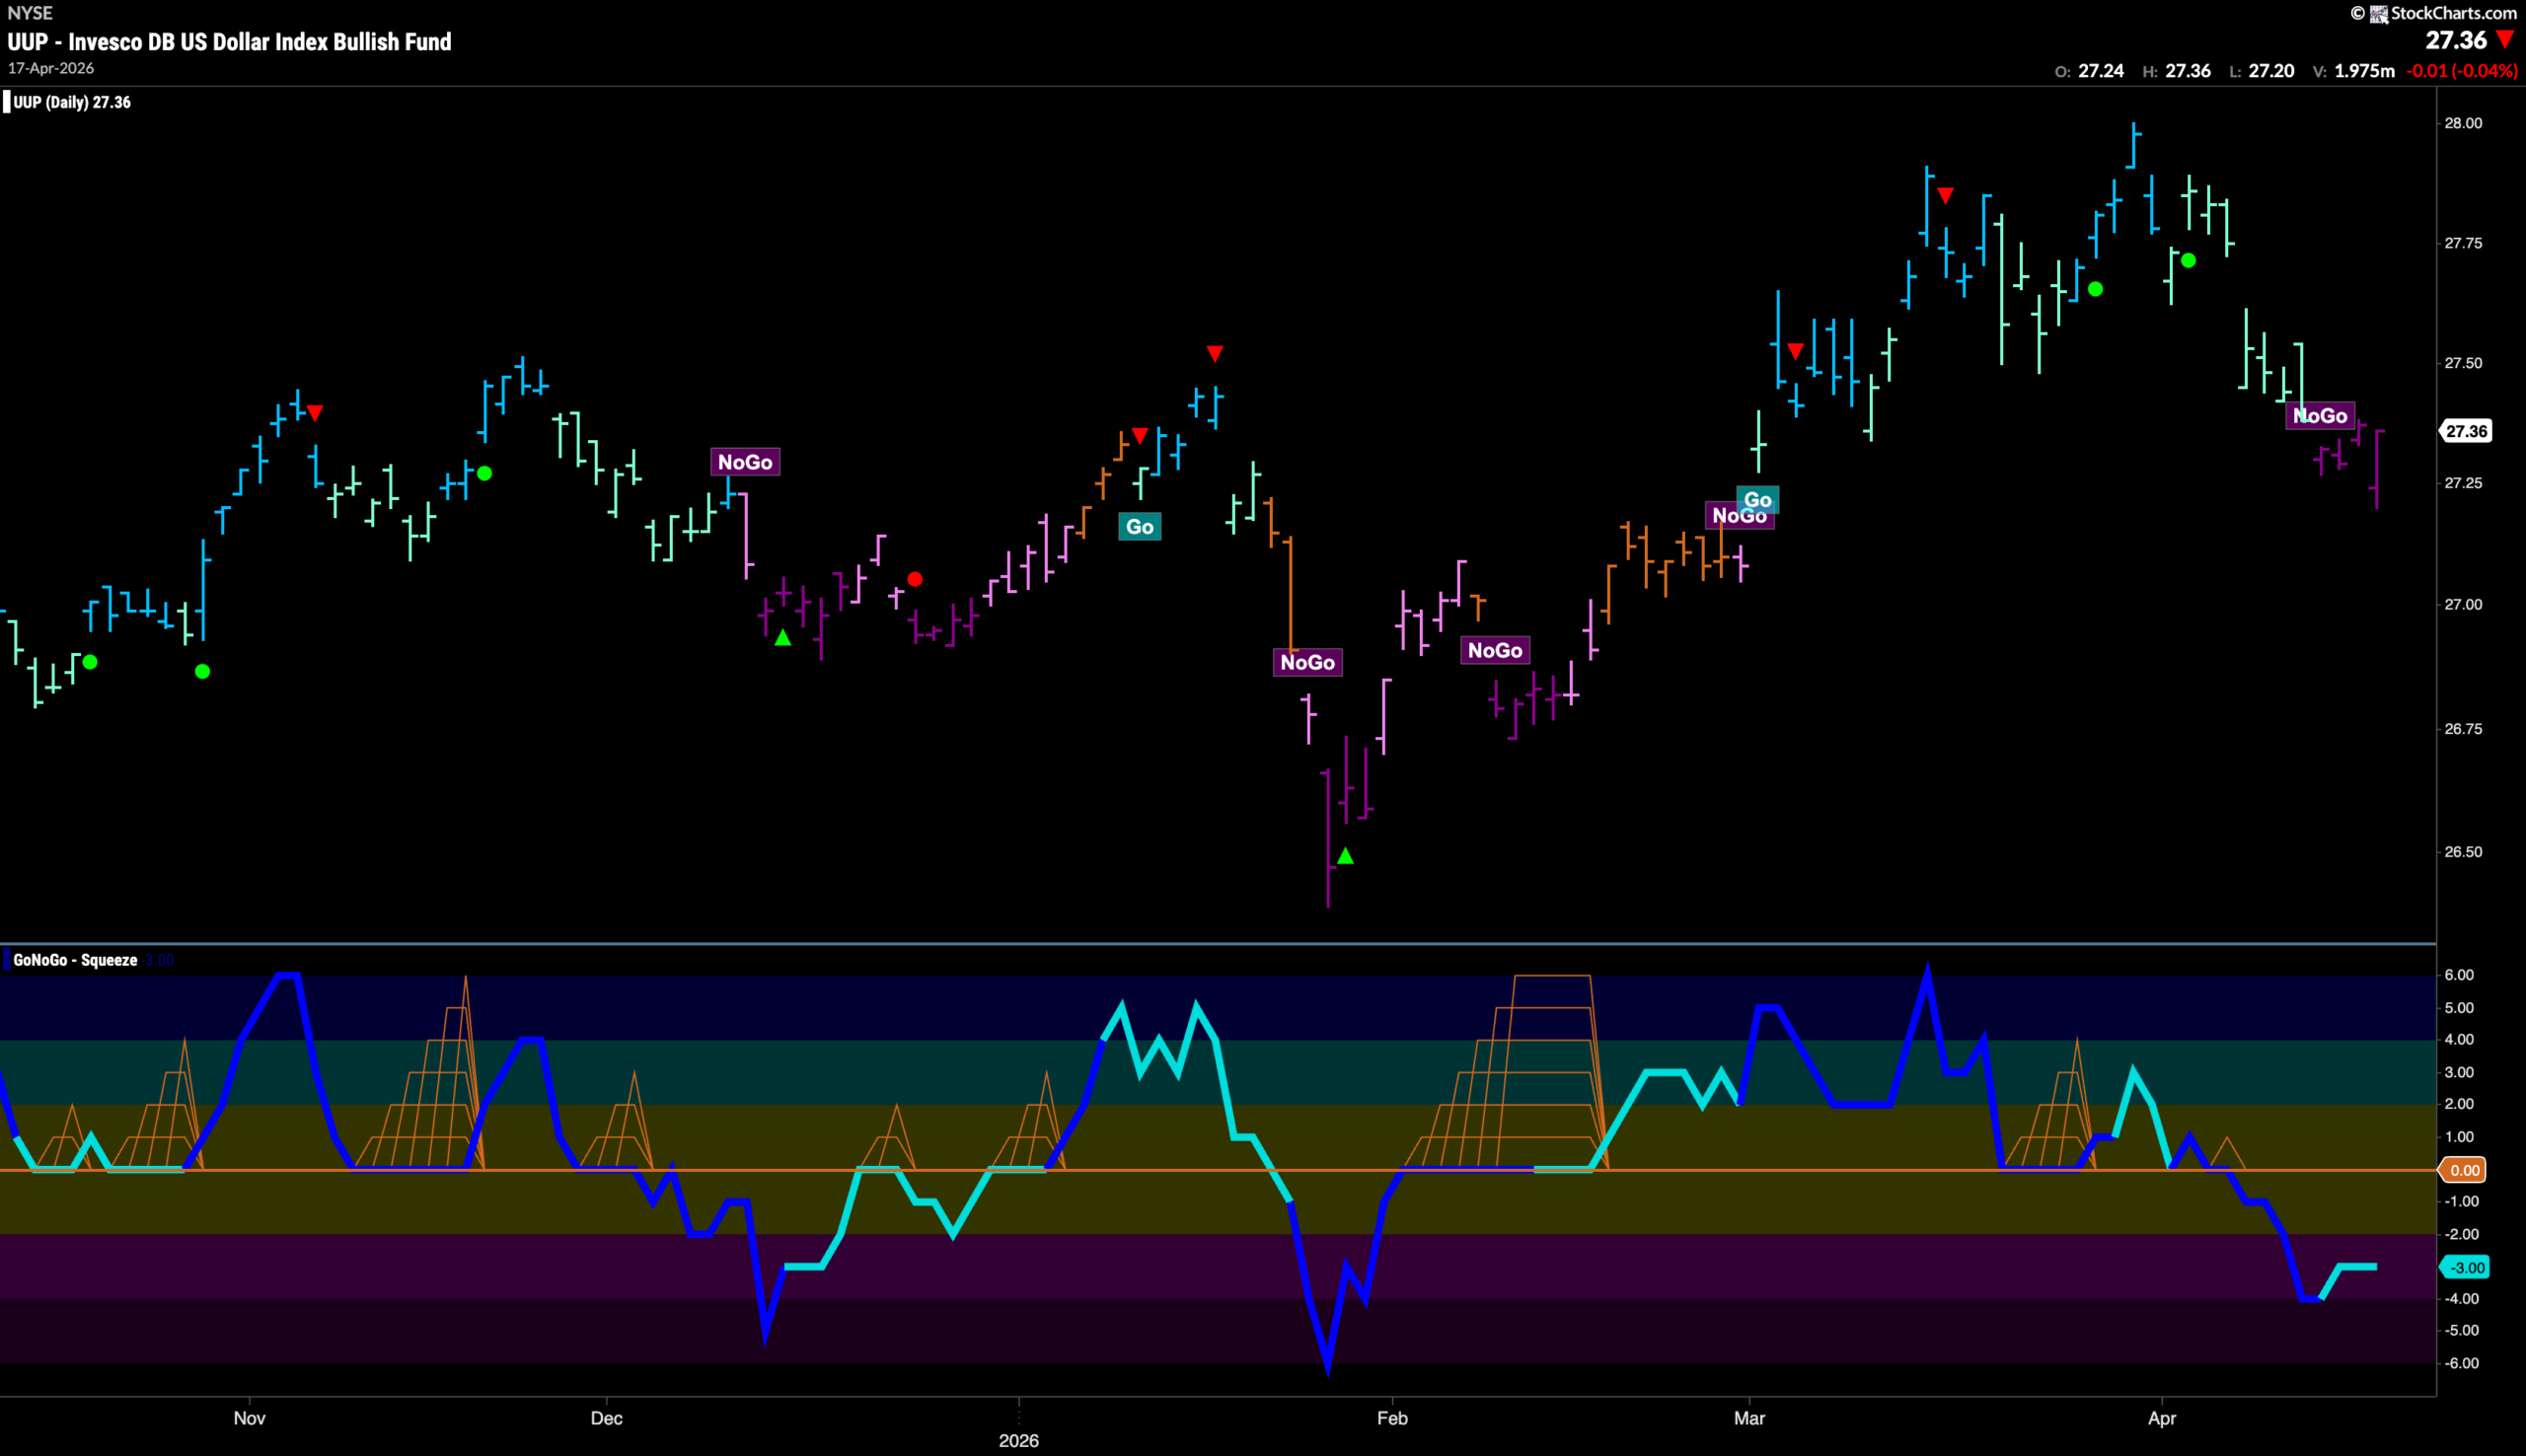
The chart below shows that the dollar saw a trend change this past week after a prolonged period of weaker aqua bars following the last higher high. GoNoGo Trend painted strong purple “NoGo” bars as the bears took control. Looking at the oscillator panel we see that GoNoGo Oscillator is in negative territory but not oversold at a value of -3. With momentum in line with the “NoGo” we will watch to see if that puts further downside pressure on price.
Oil ($USO) Falls Further from High
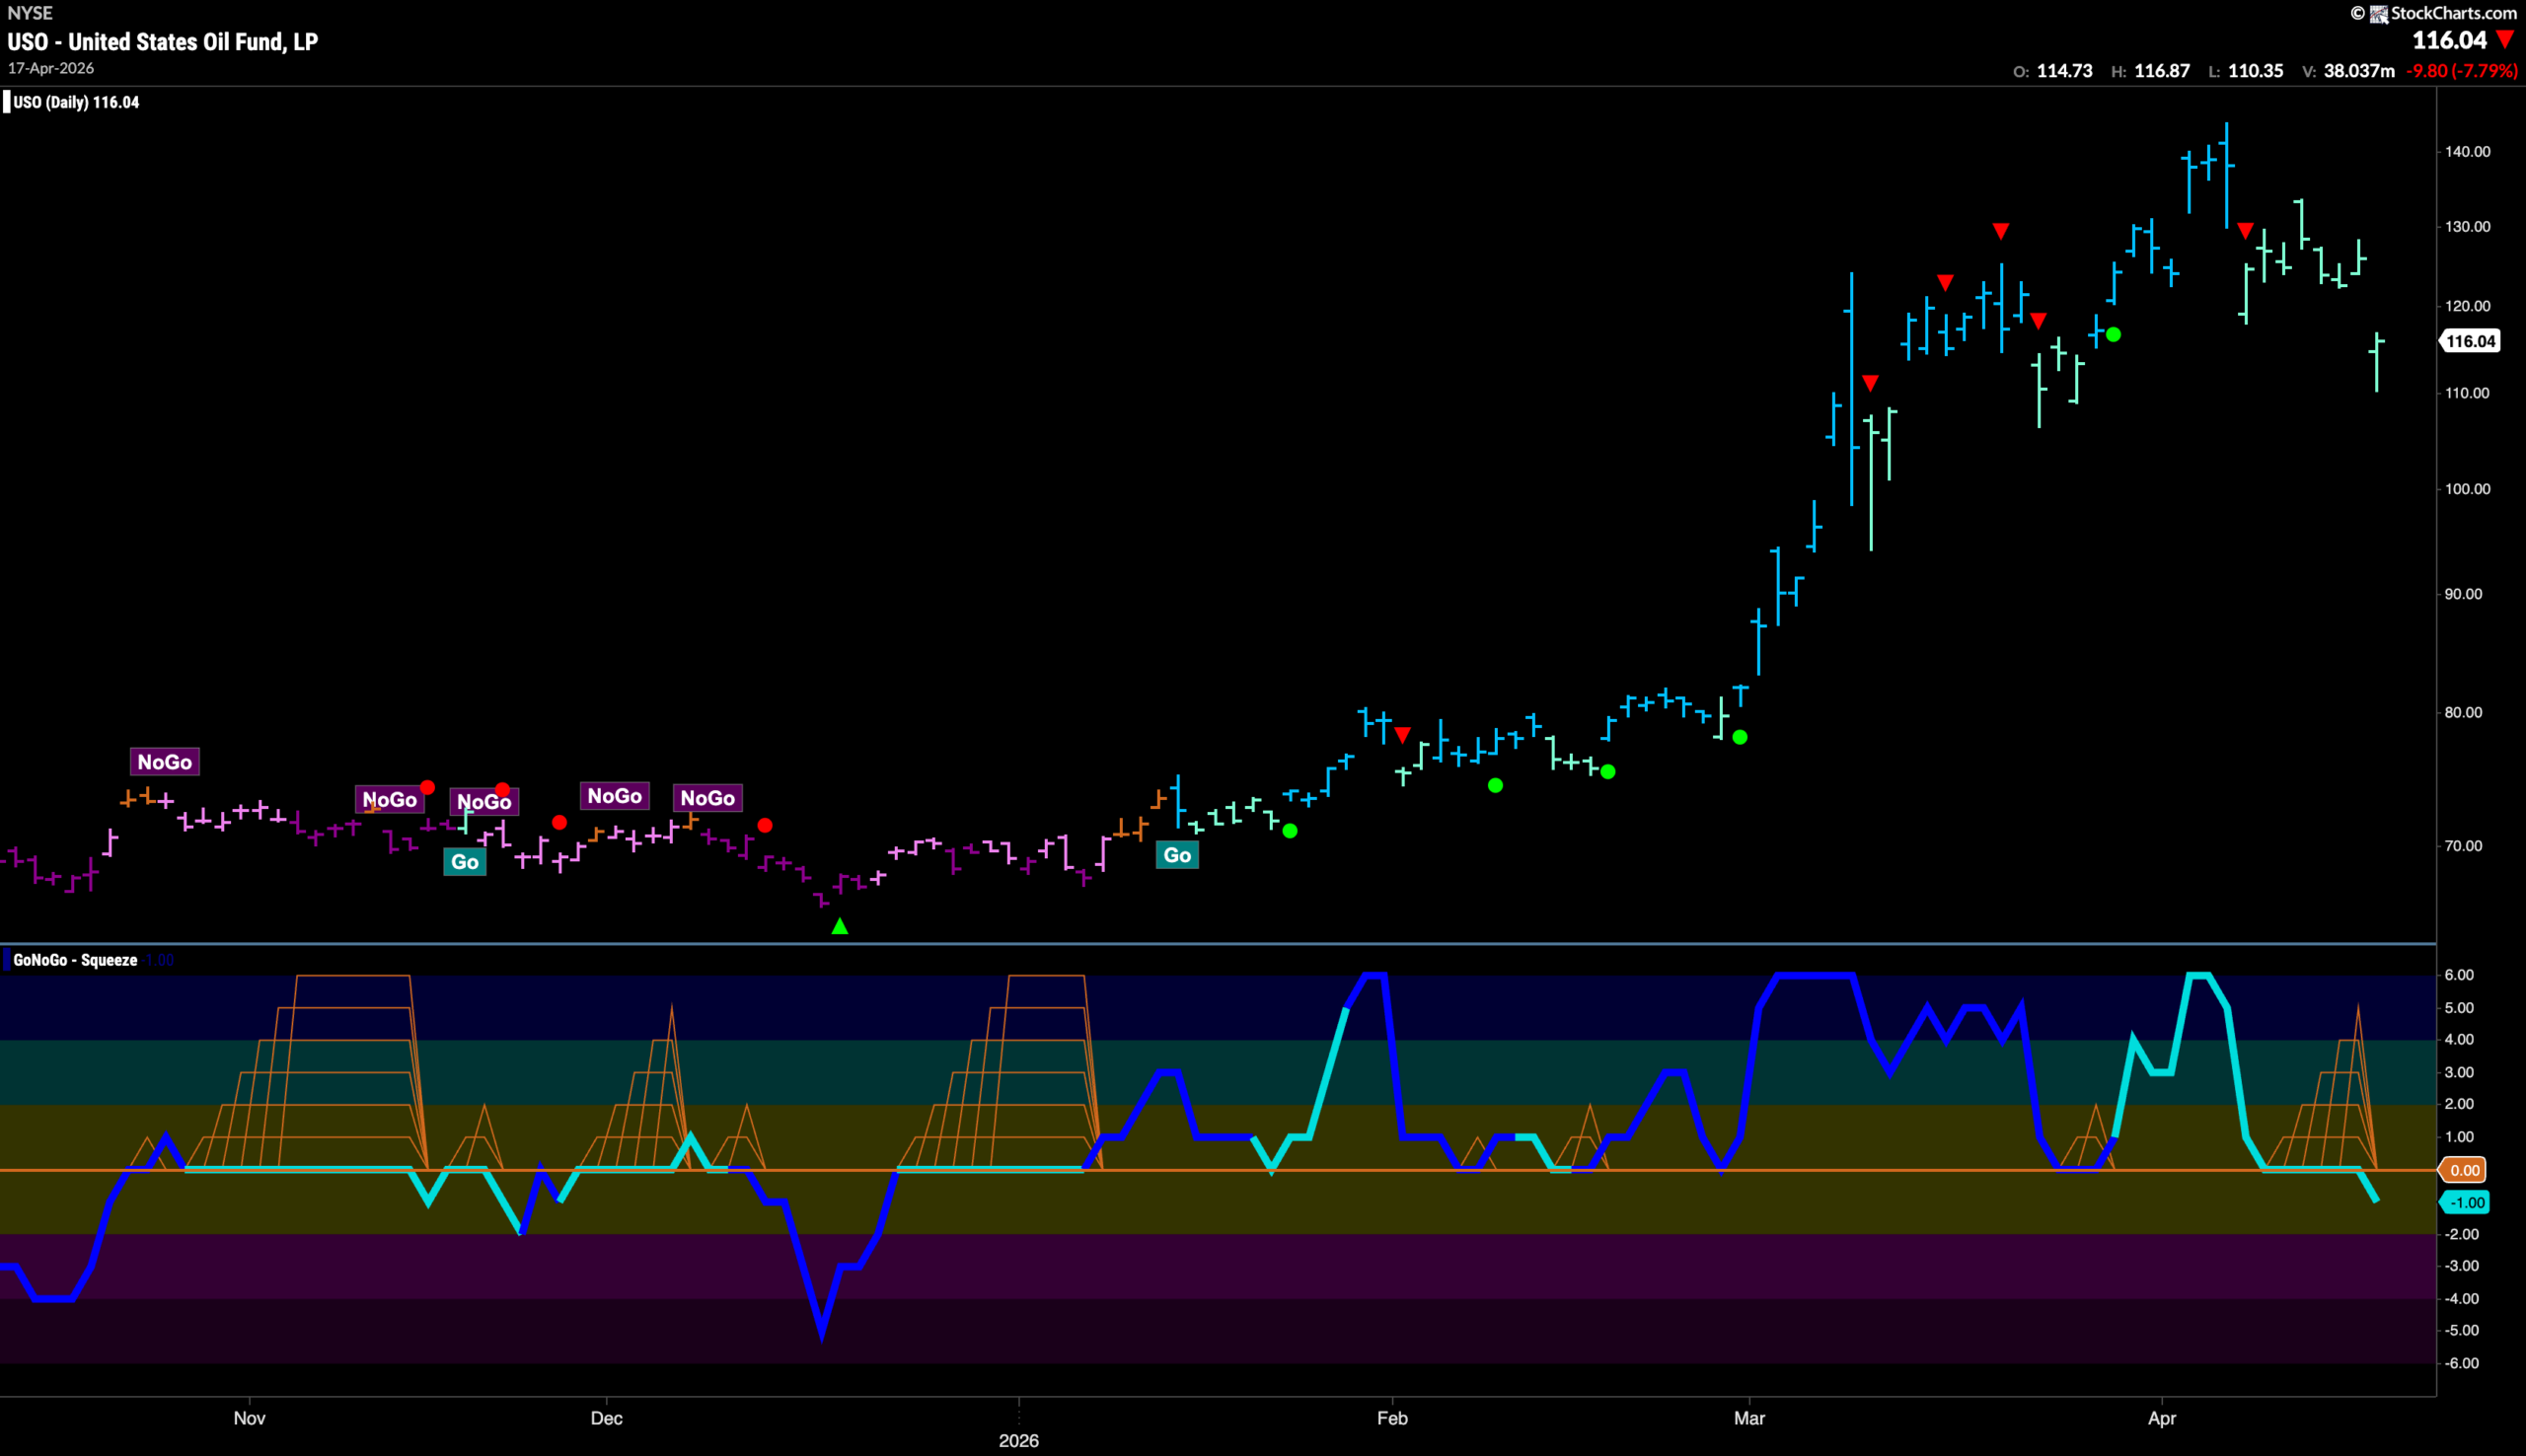
GoNoGo Trend shows that the “Go” trend continues for another week albeit demonstrating weakness with aqua bars. This comes after a Go Countertrend Correction Icon (red arrow) signaled waning momentum in the “Go” trend. Now, we see price has gapped lower as GoNoGo Oscillator breaks out of a GoNoGo Squeeze into negative territory. We will watch to see if oil can maintain its “Go” trend this week.
Gold ($GLD) Paints “NoGo” Weakness
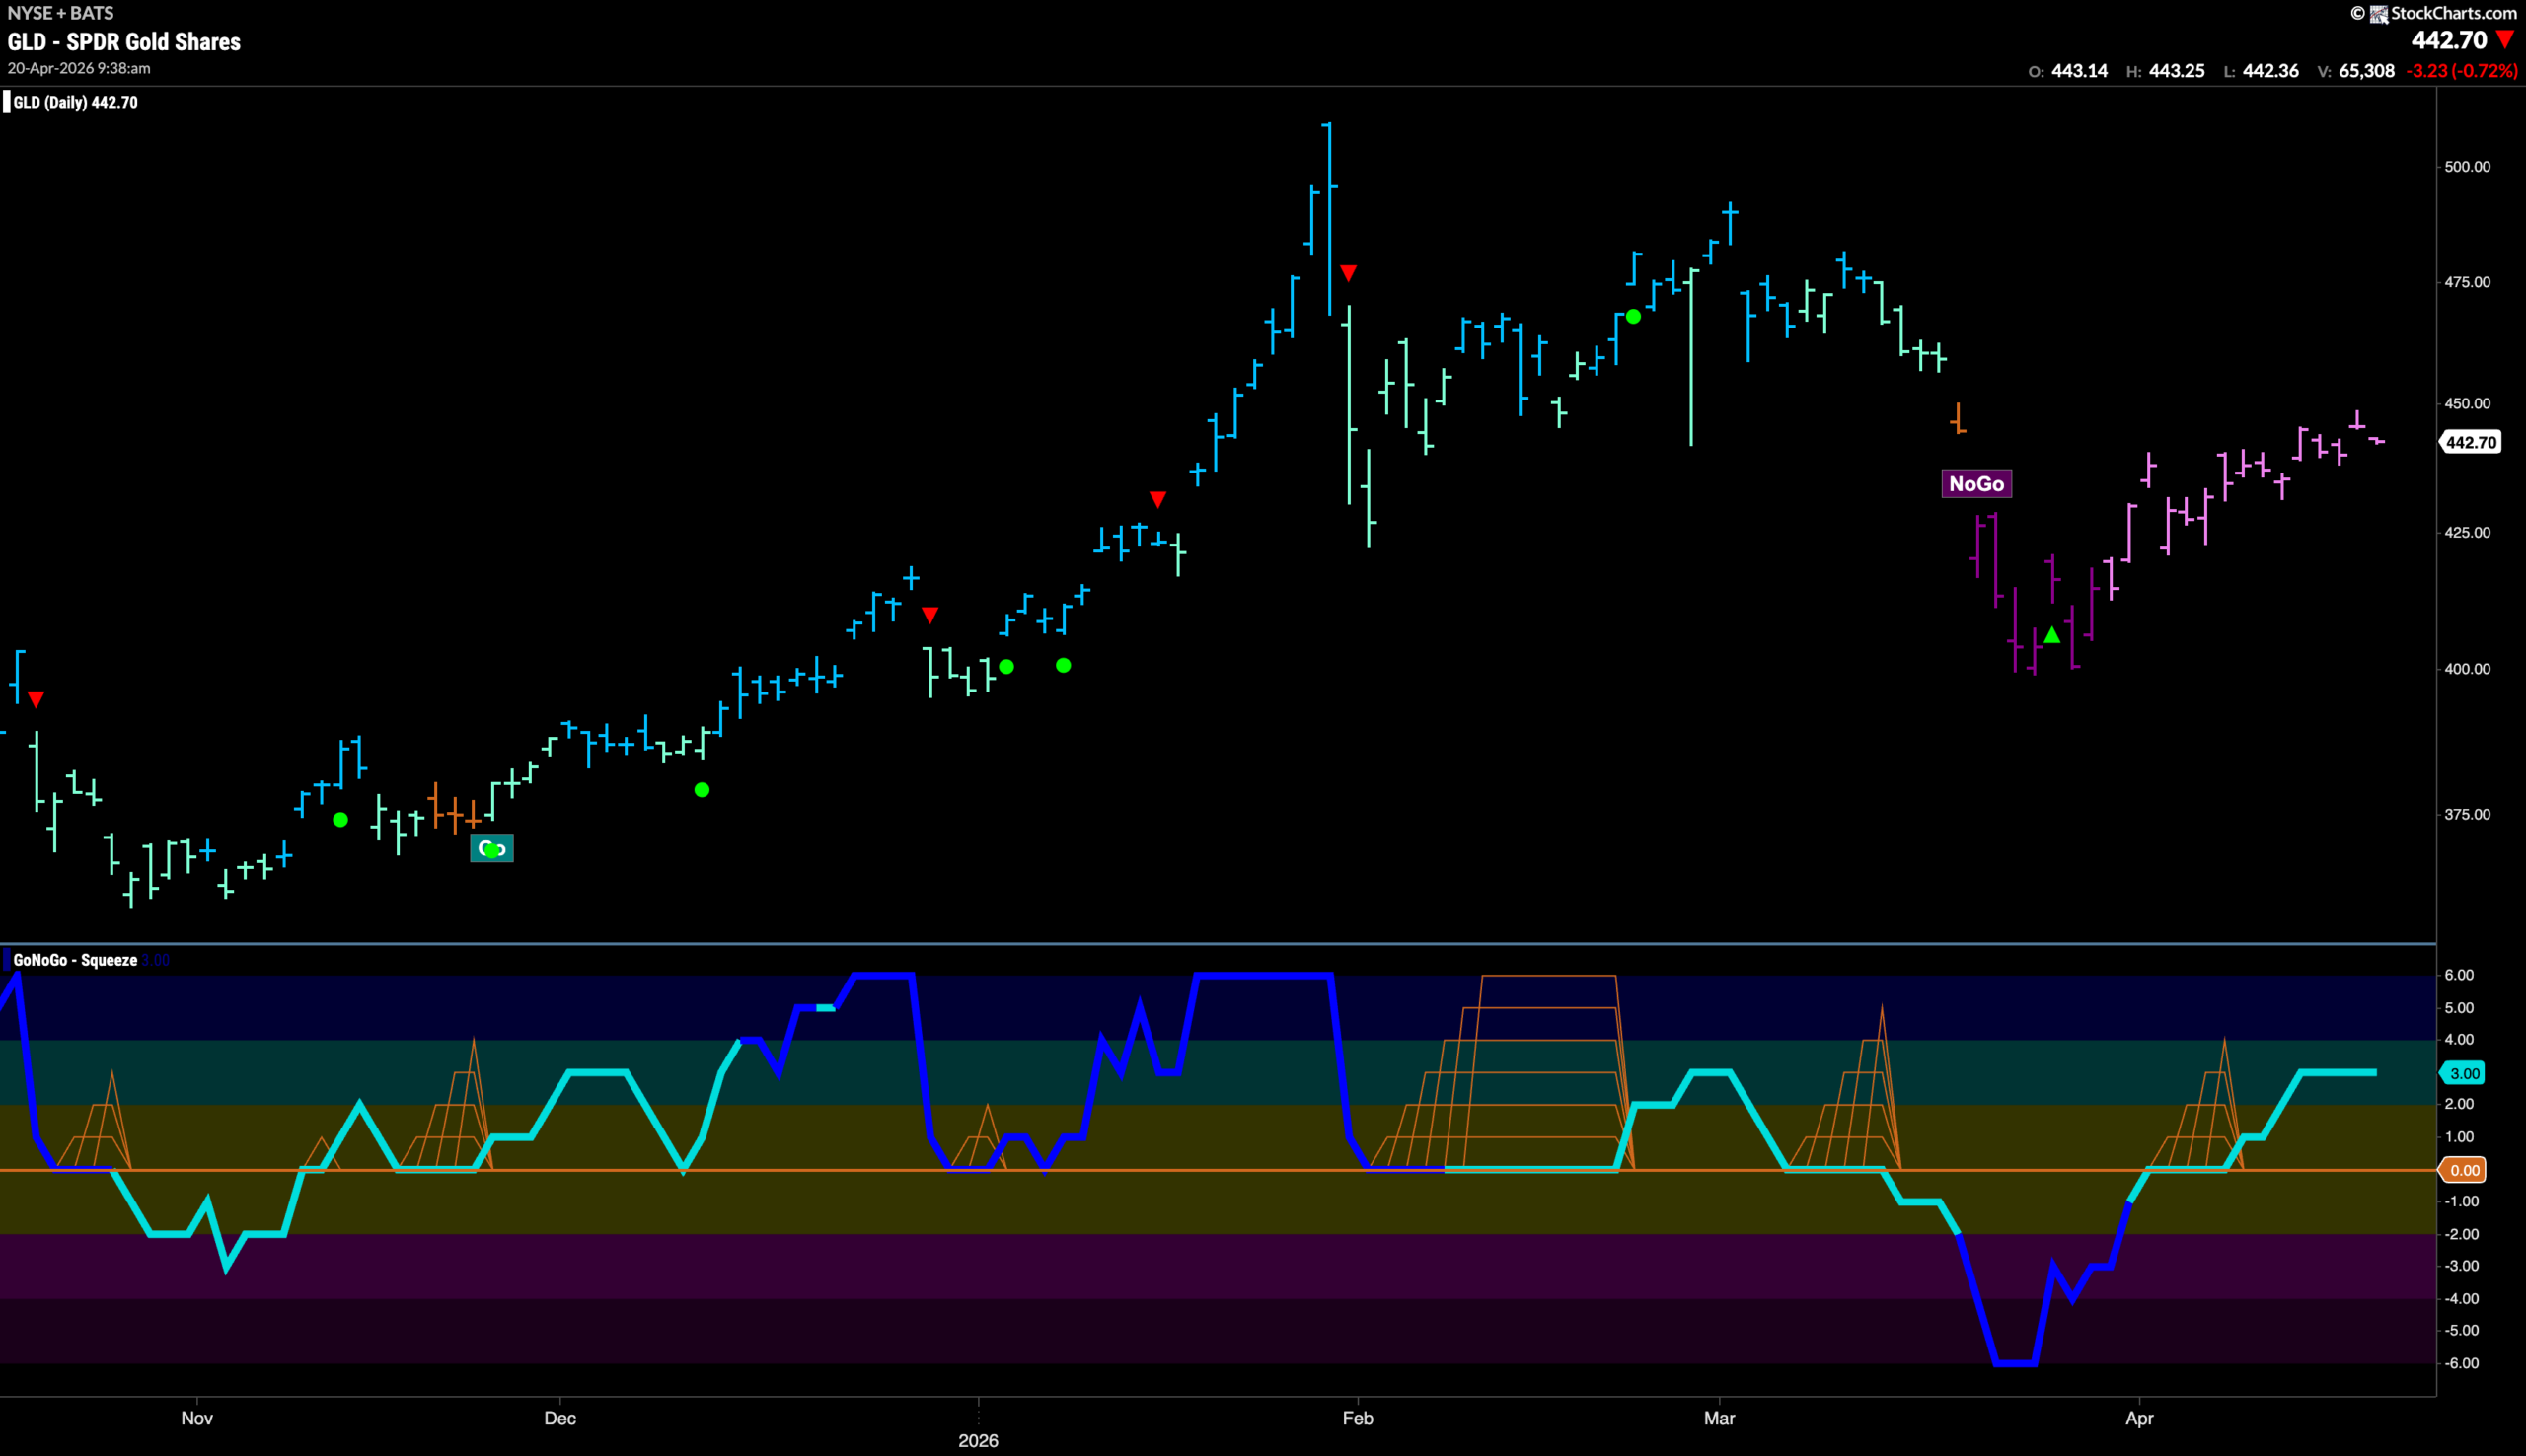
Gold remains in the “NoGo” Trend but see another week of weaker pink bars as price continues to rally from the last low in March. Price has edged higher for weeks and GoNoGo Oscillator has settled into positive territory after breaking out of a small GoNoGo Squeeze at a value of 3. There appears to be some resistance in the form of the gap and the lone amber “Go Fish” bar and so we will watch to see if gold can climb back above that level.
Sector RelMap
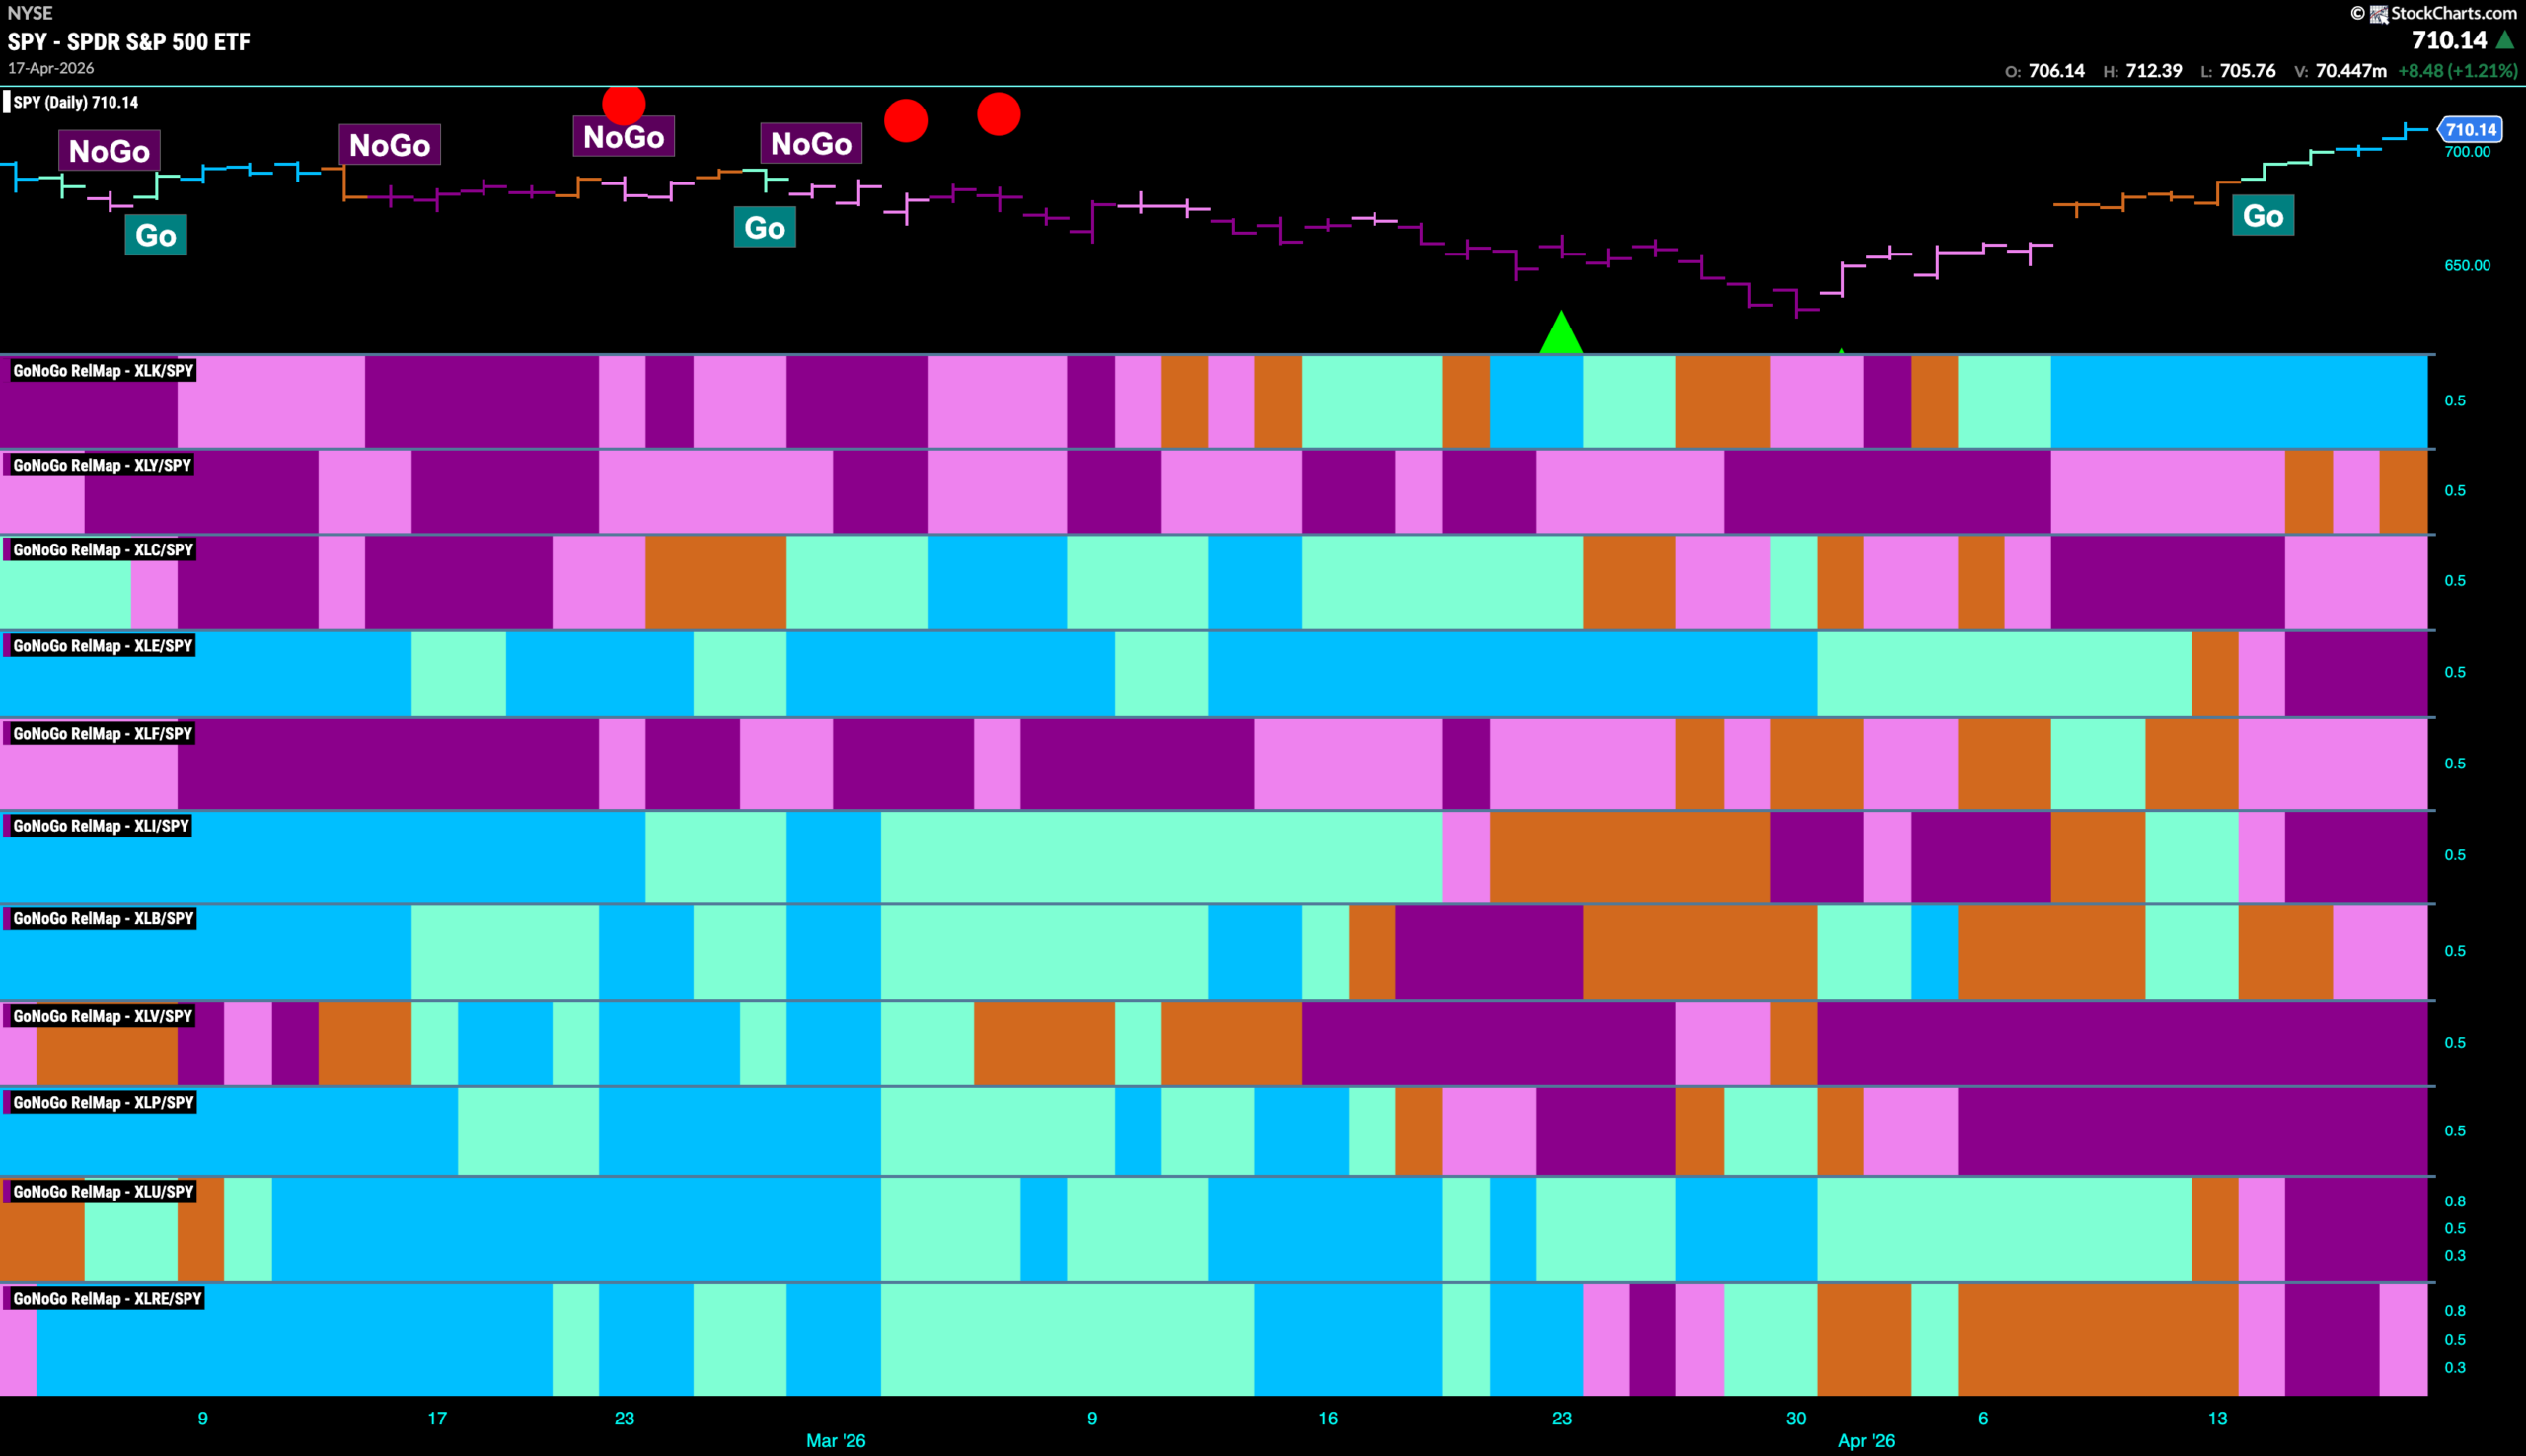
Below is the GoNoGo Sector RelMap. This GoNoGo RelMap applies the GoNoGo Trend to the relative strength ratios of the sectors to the base index. With this view we can get a sense of the relative out performance and relative underperformance of the sectors. 1 sector is in a relative “Go” trend. $XLK, is painting relative “Go” bars.
Technology Sub-Group RelMap
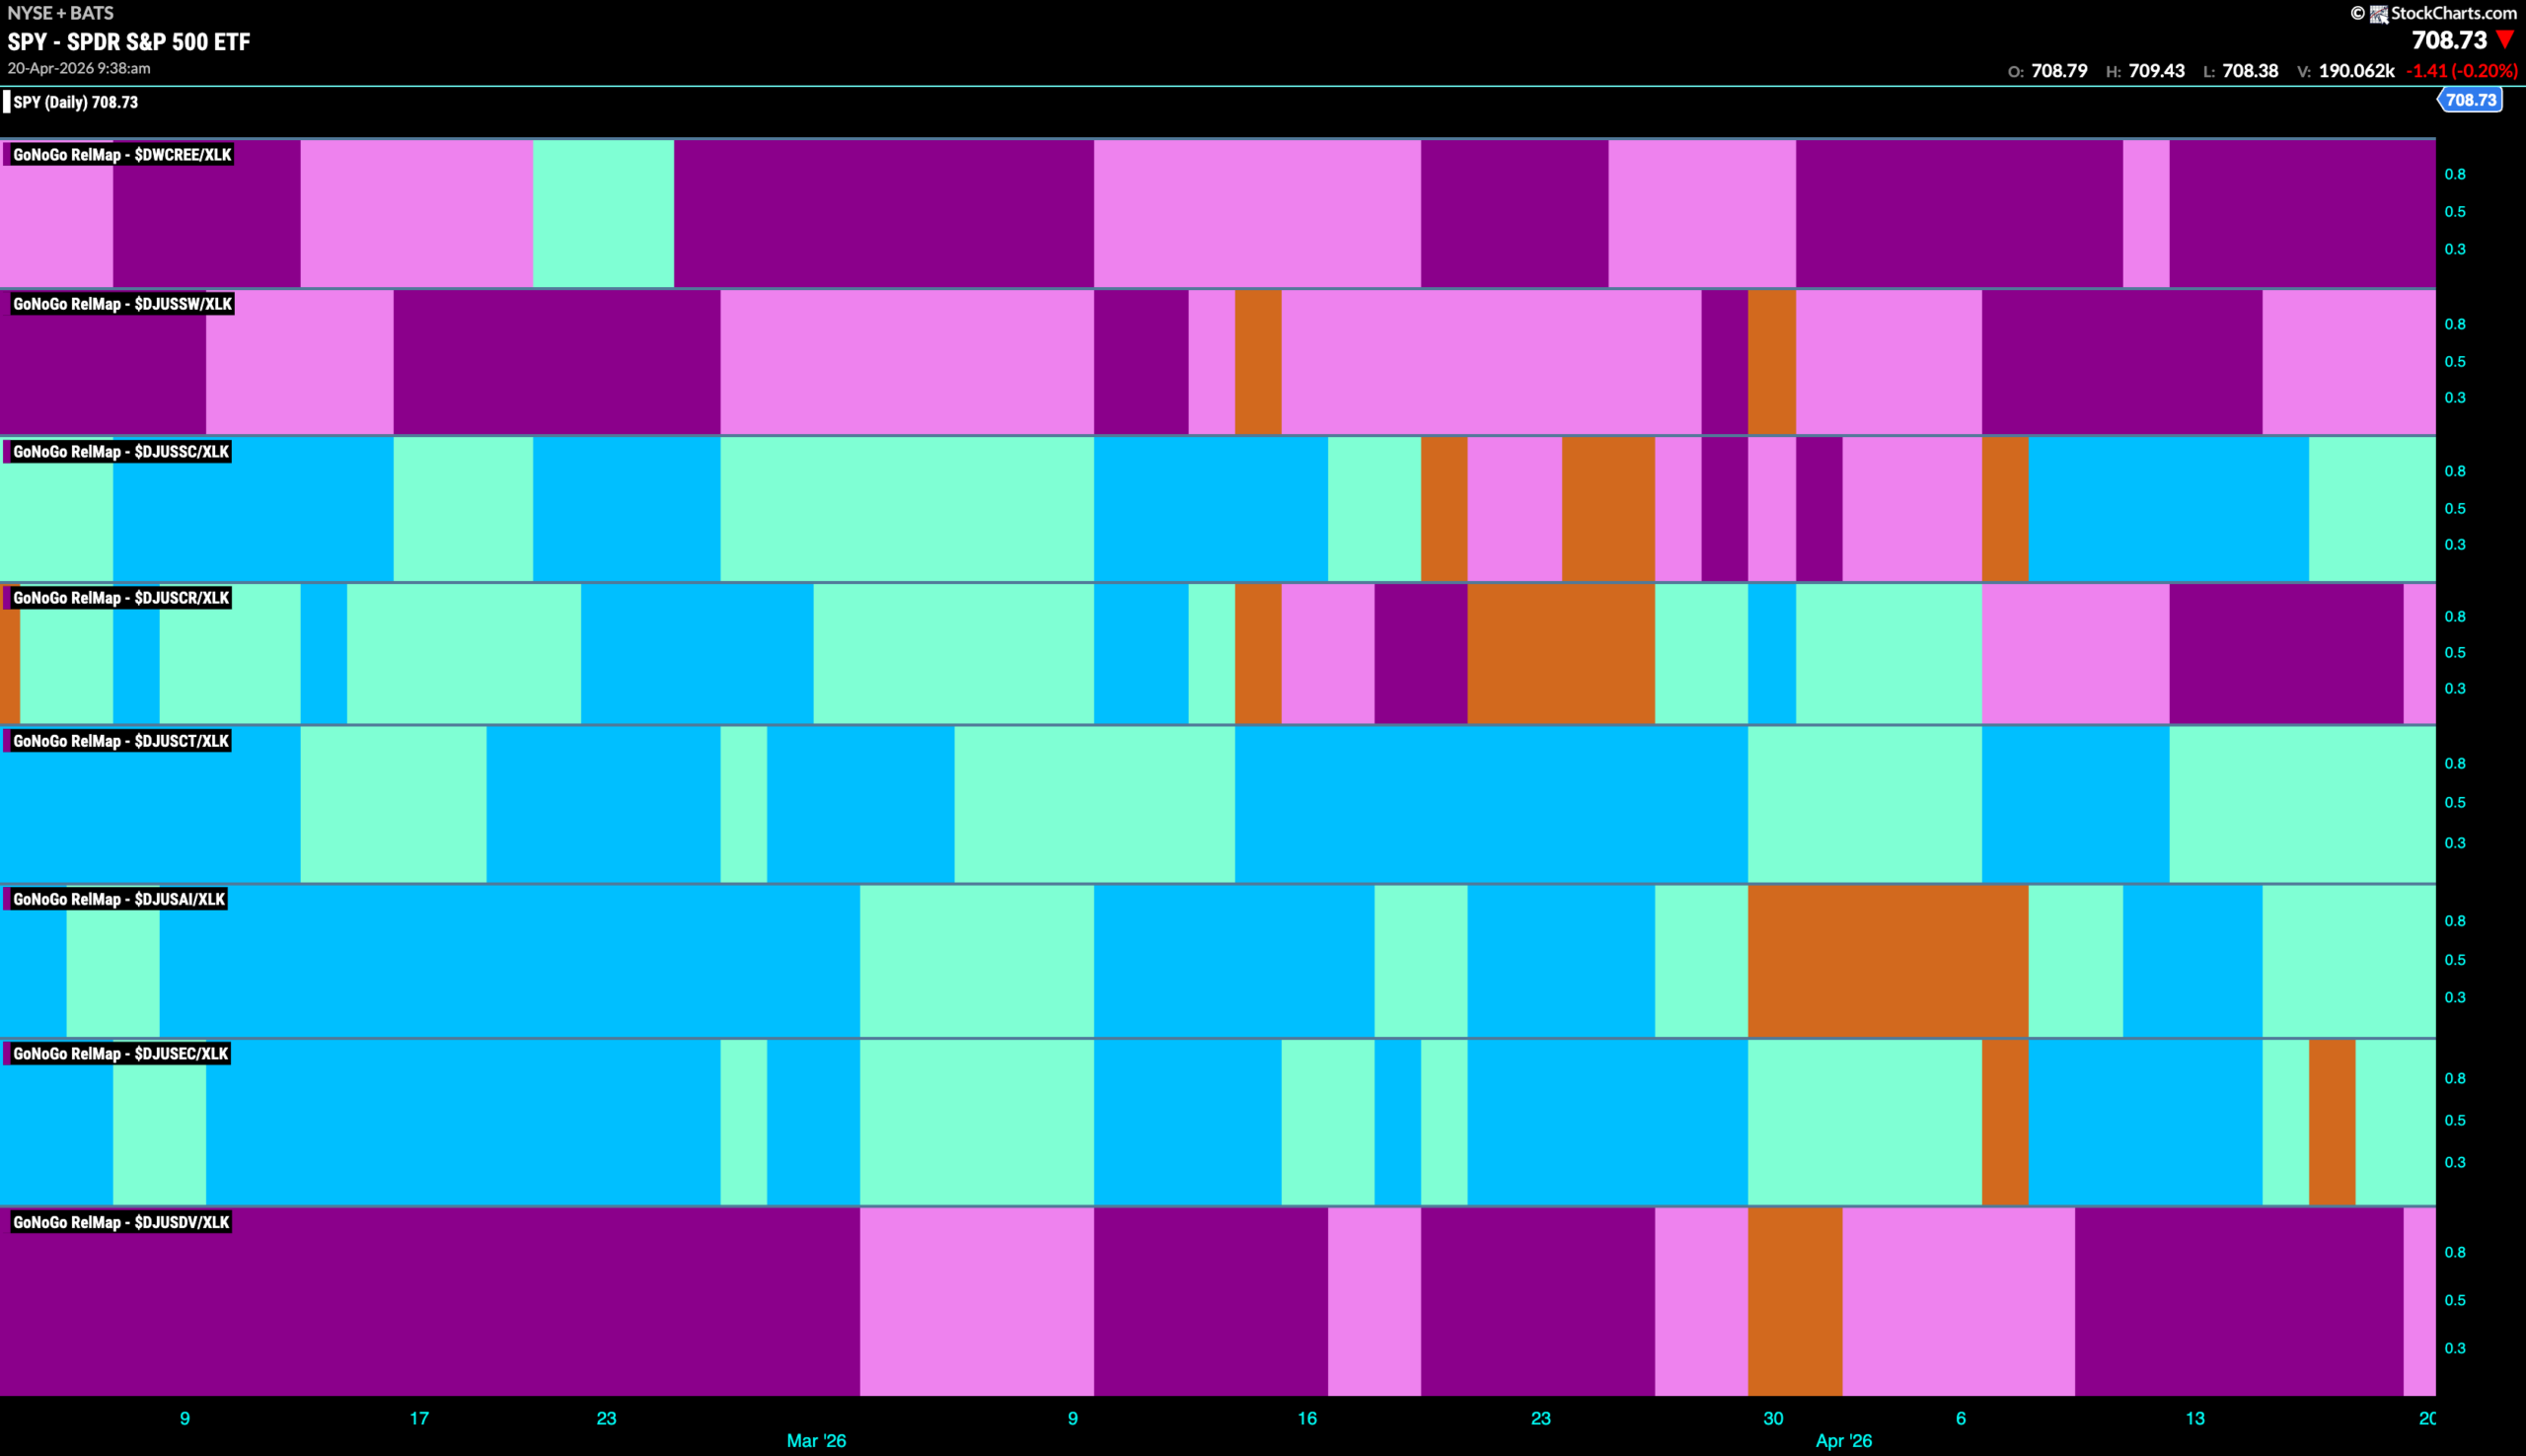
The chart below shows a relative trend breakdown of the sub groups within the technology sector again this week. The Sub-Group RelMap plots the GoNoGo Trend of each sub index to the $XLK. We saw in the above GoNoGo Sector RelMap that $XLK continues to outperform and paints strong relative “Go” bars. When we look at the below RelMap we can see that the semiconductors index in the third panel continues to paint “Go” bars on a relative basis.
$SATS Breaks to New Highs
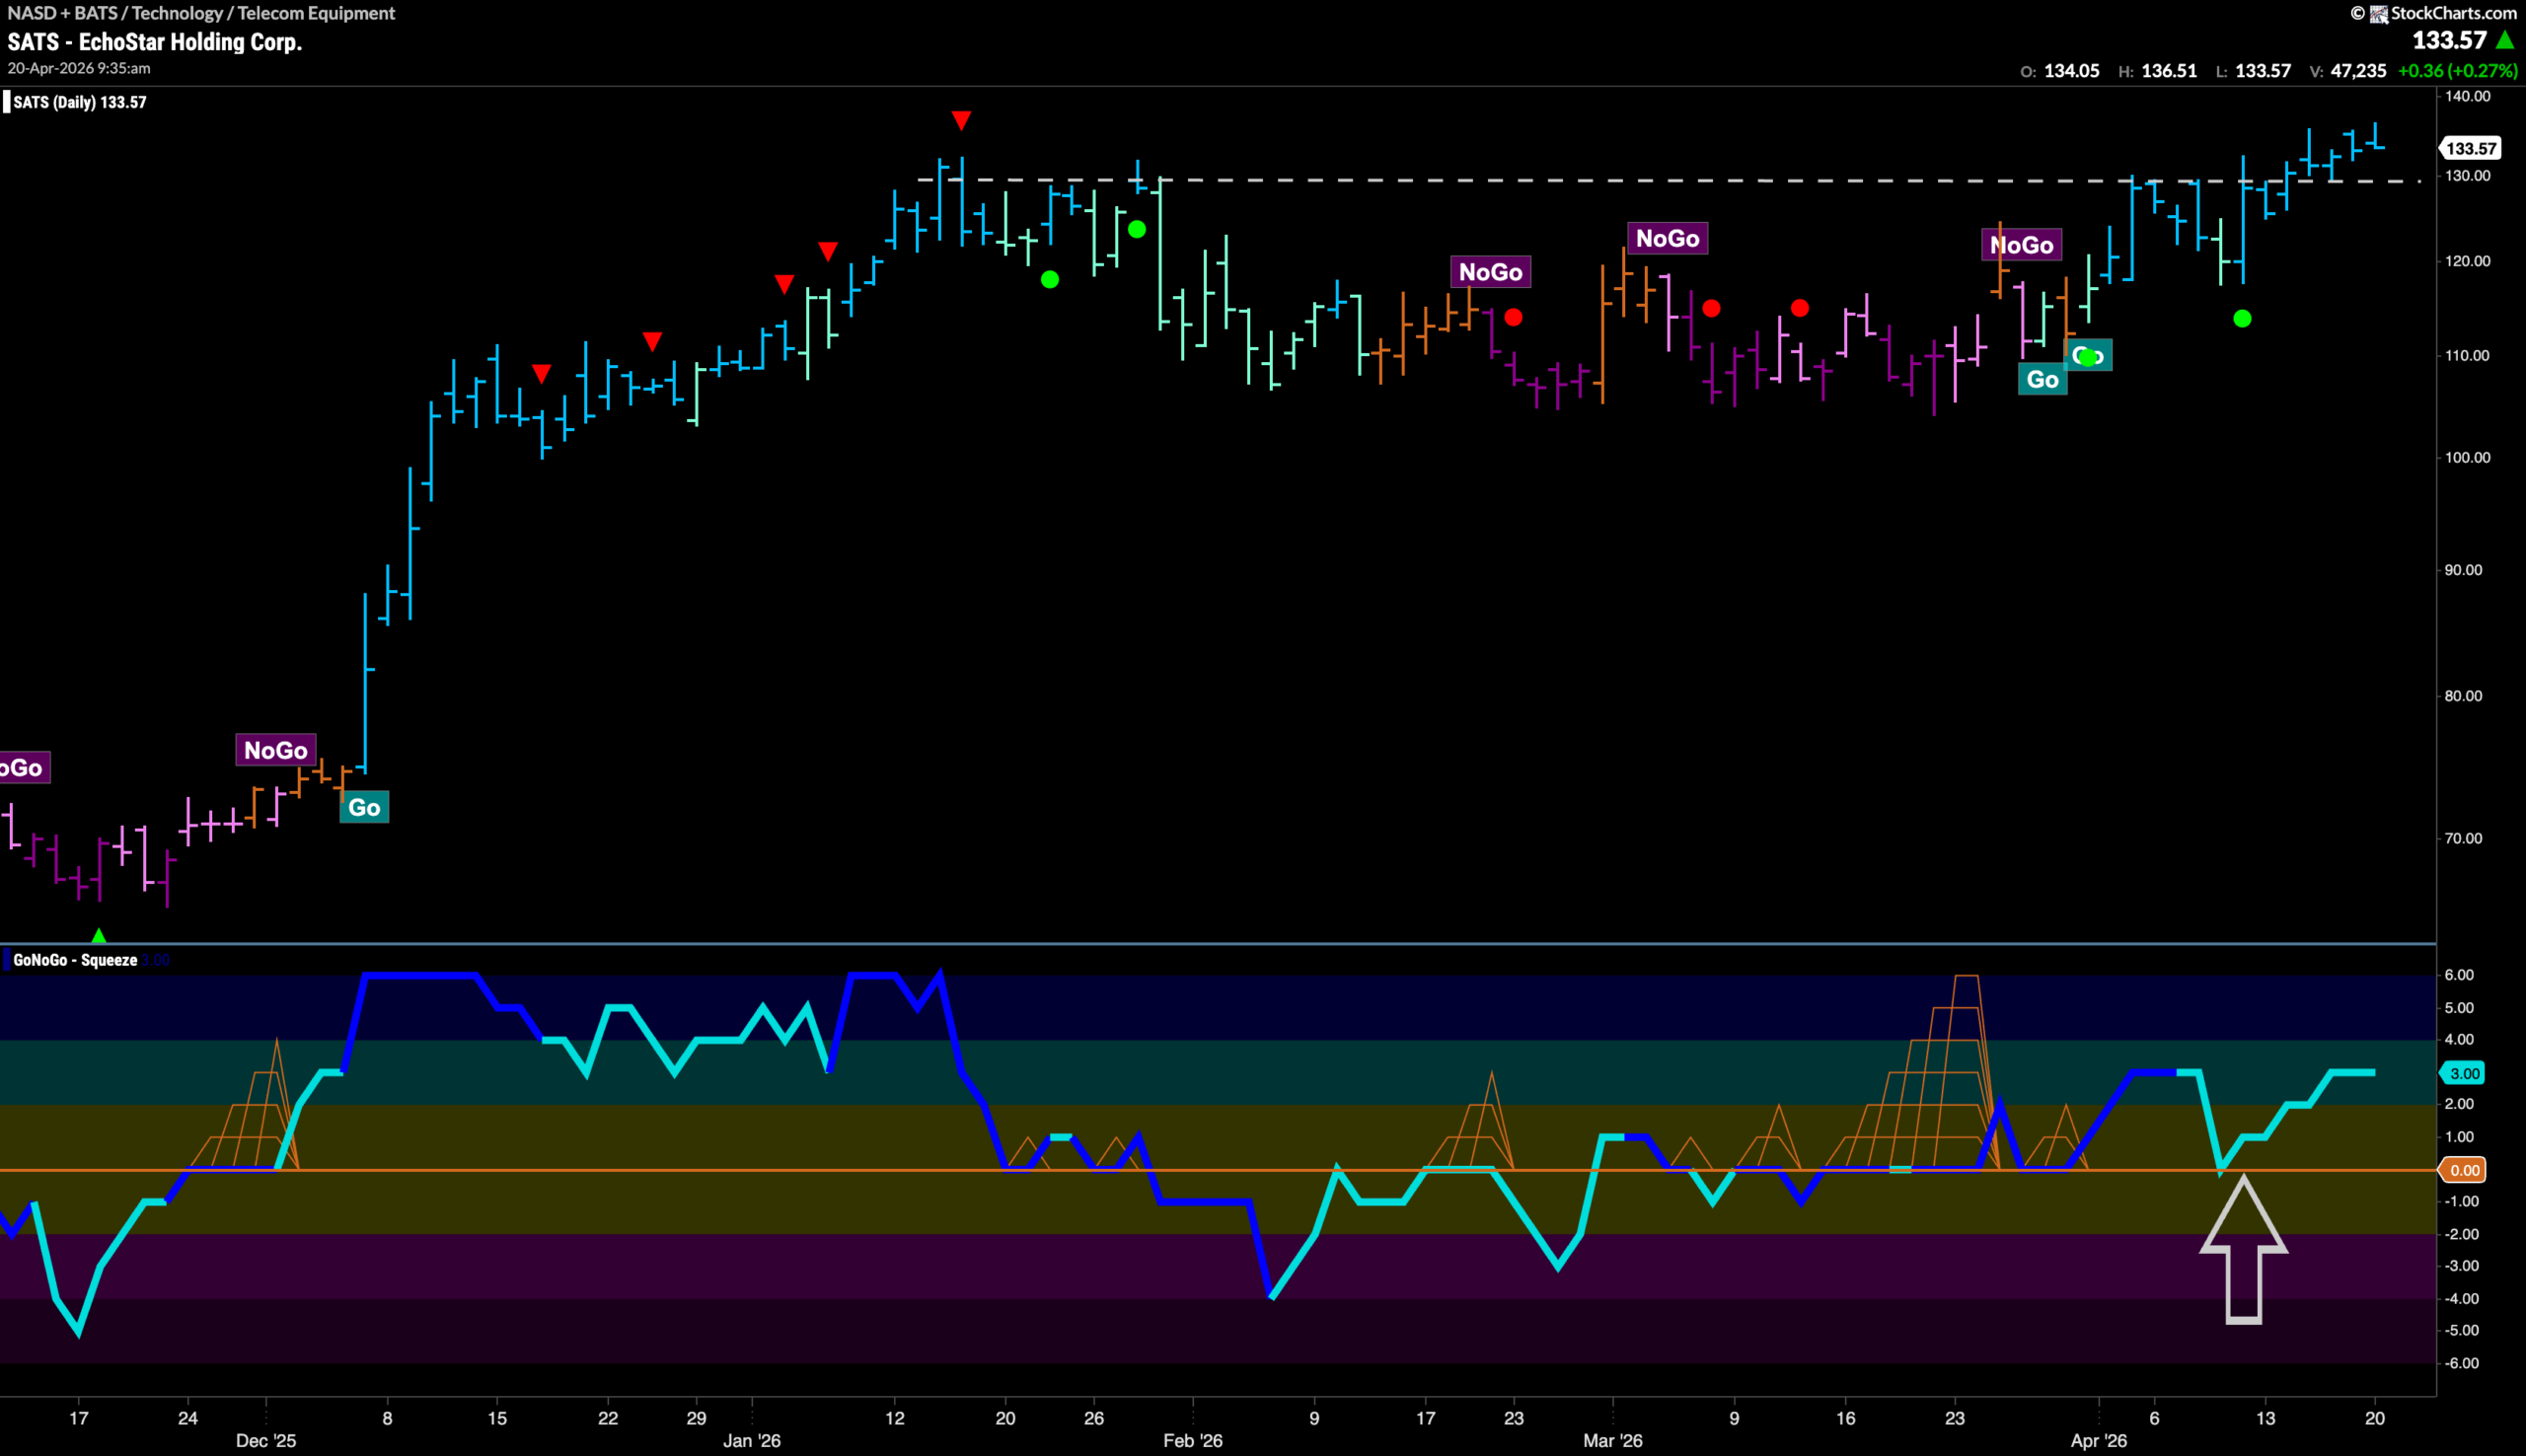
GoNoGo Trend shows that EchoStar Holding Corp has emerged from a “NoGo” correction and is now in a “Go” trend with the indicator painting strong blue “Go” bars as it pushes through overhead resistance from prior highs. This comes after we saw momentum turn up a few weeks ago. First, GoNoGo Oscillator broke out of a GoNoGo Squeeze into positive territory before retesting that level more recently. Finding support at zero, we see a Go Trend Continuation Icon (green circle) propelled price higher and through resistance. We will watch to see if price can consolidate at these higher levels in the coming days and weeks.
$GLW Looks for Support at Prior High
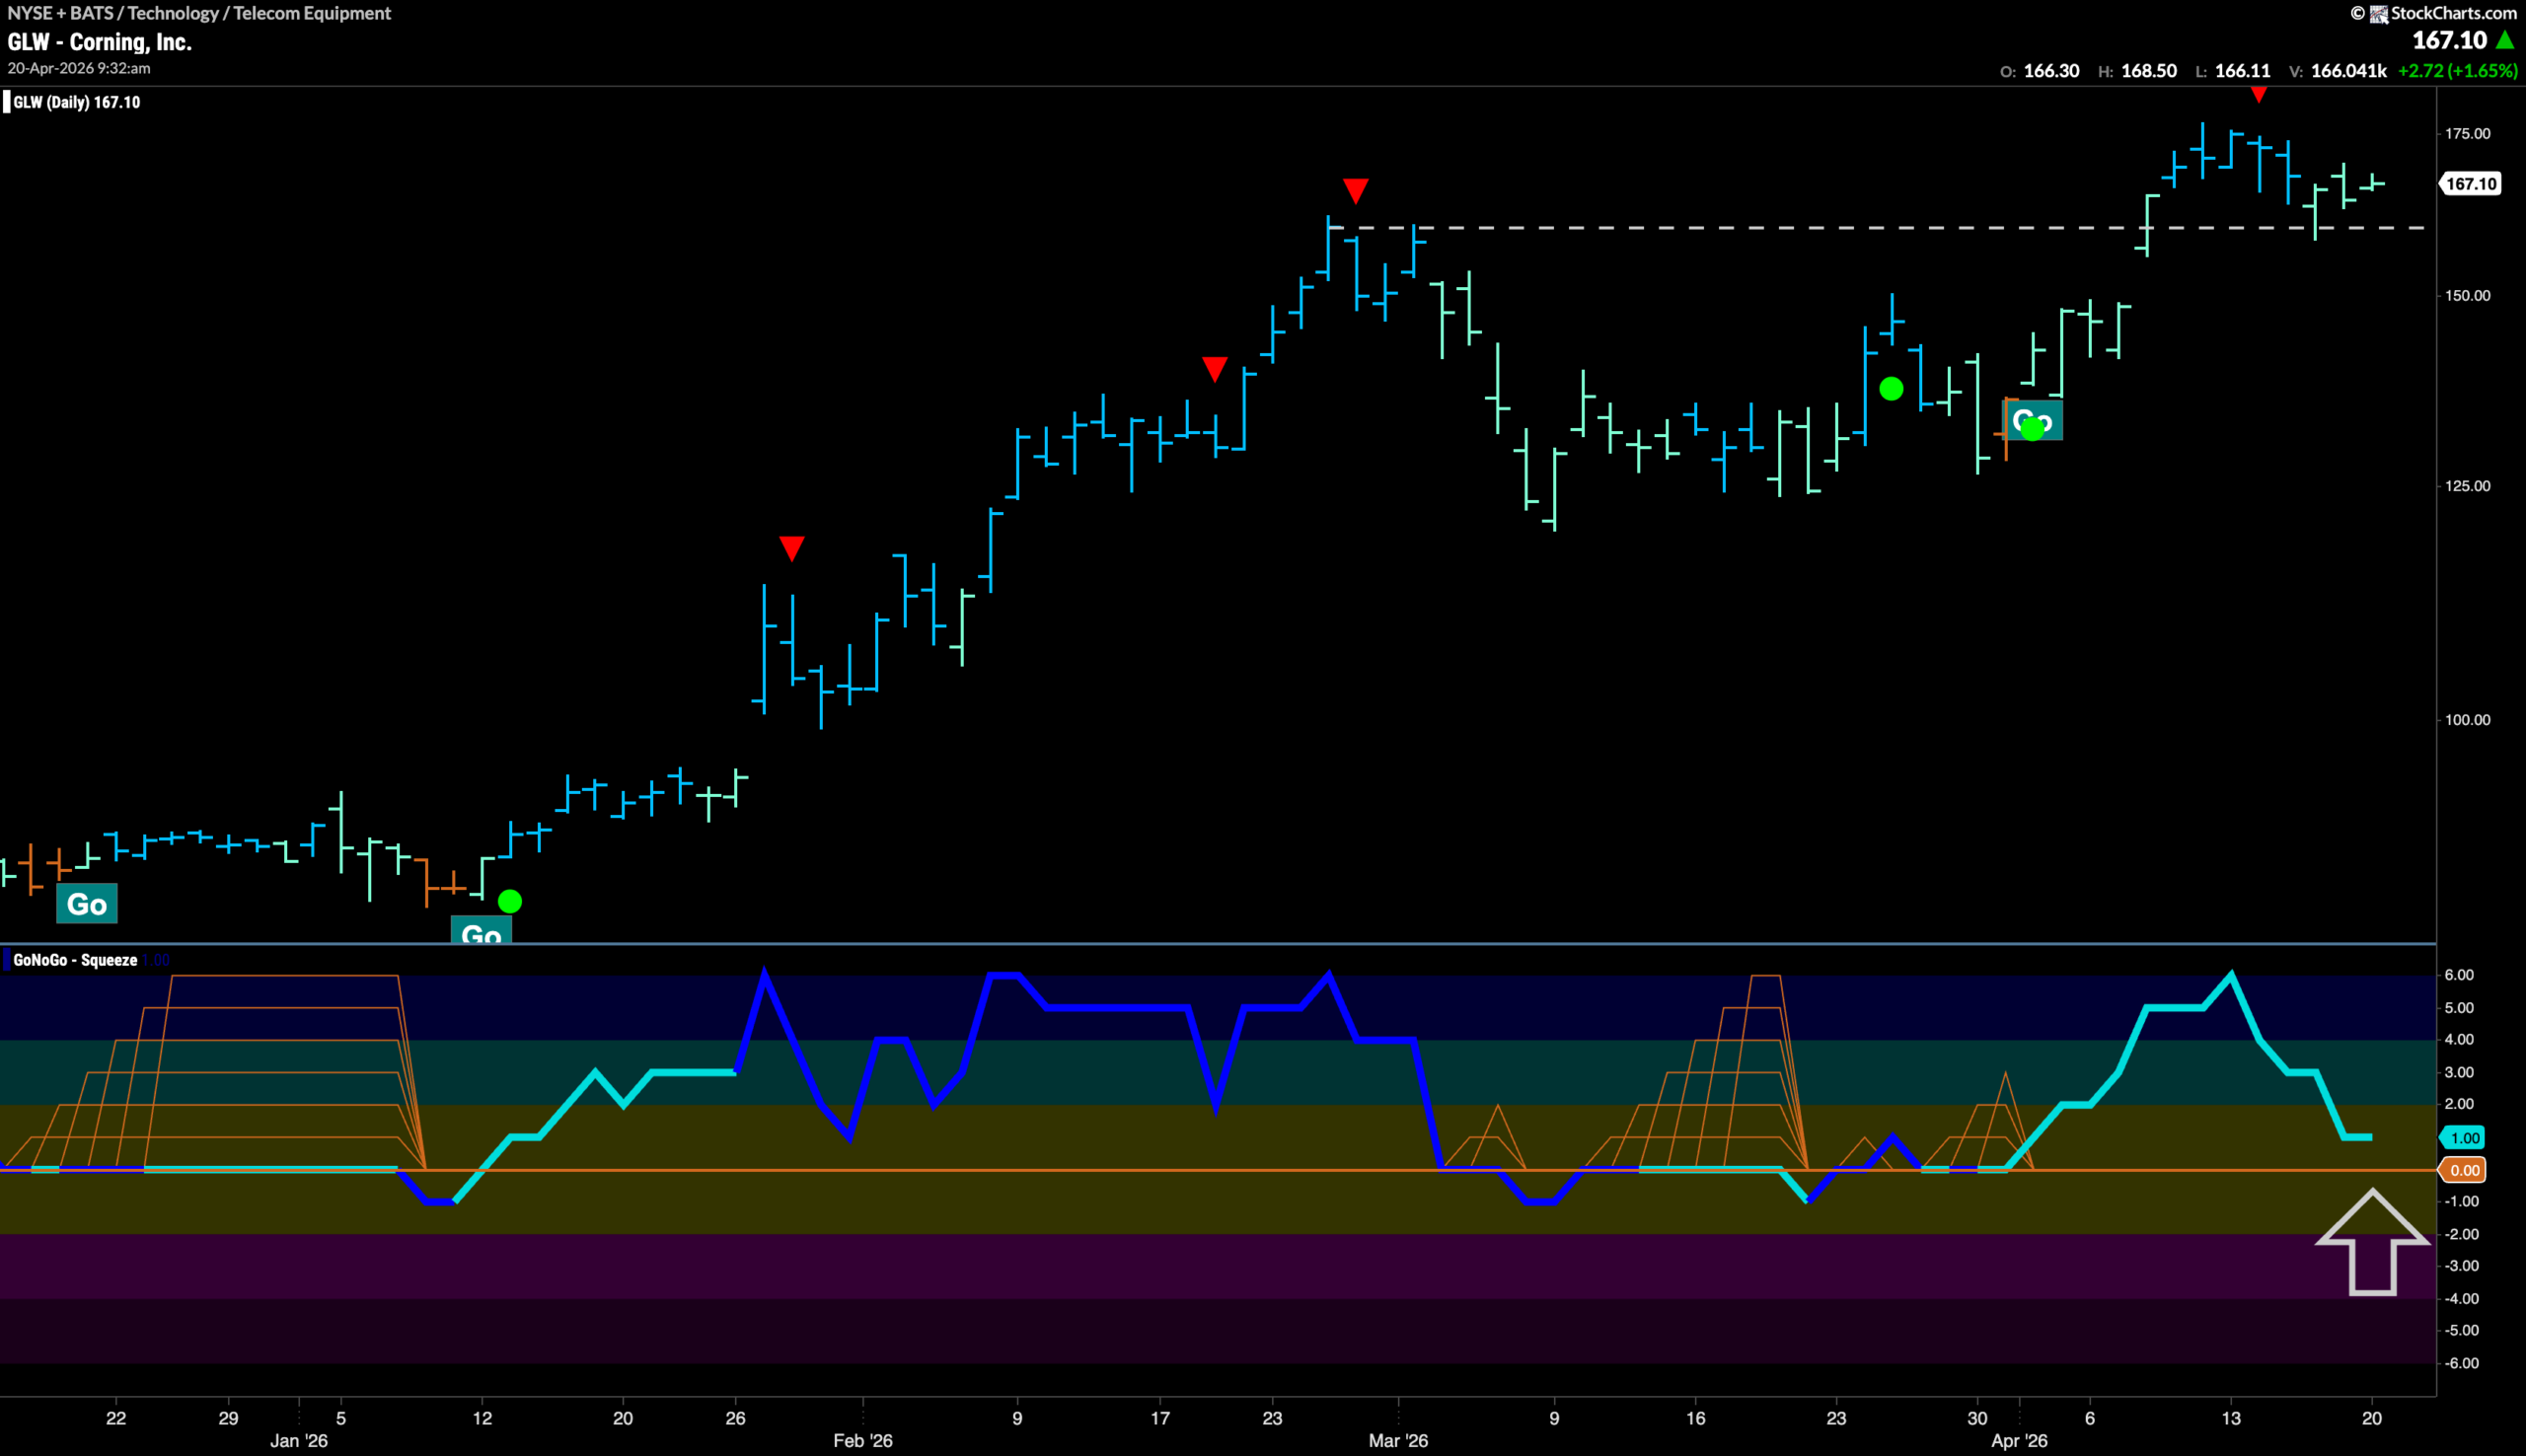
$GLW broke to new highs 10 days ago after having seen momentum rally off the zero line giving a boost to the trend. Now, with price setting a new high a few bars ago, we saw a Go Countertrend Correction Icon (red arrow) indicating that price may struggle to go higher in the short term. Indeed, price fell to test the support from the last high in the “Go” trend. We will watch the Oscillator panel closely this week to see if it drops to test the zero line. If it does, and finds support, then we will expect price to make another attempt at a new high.