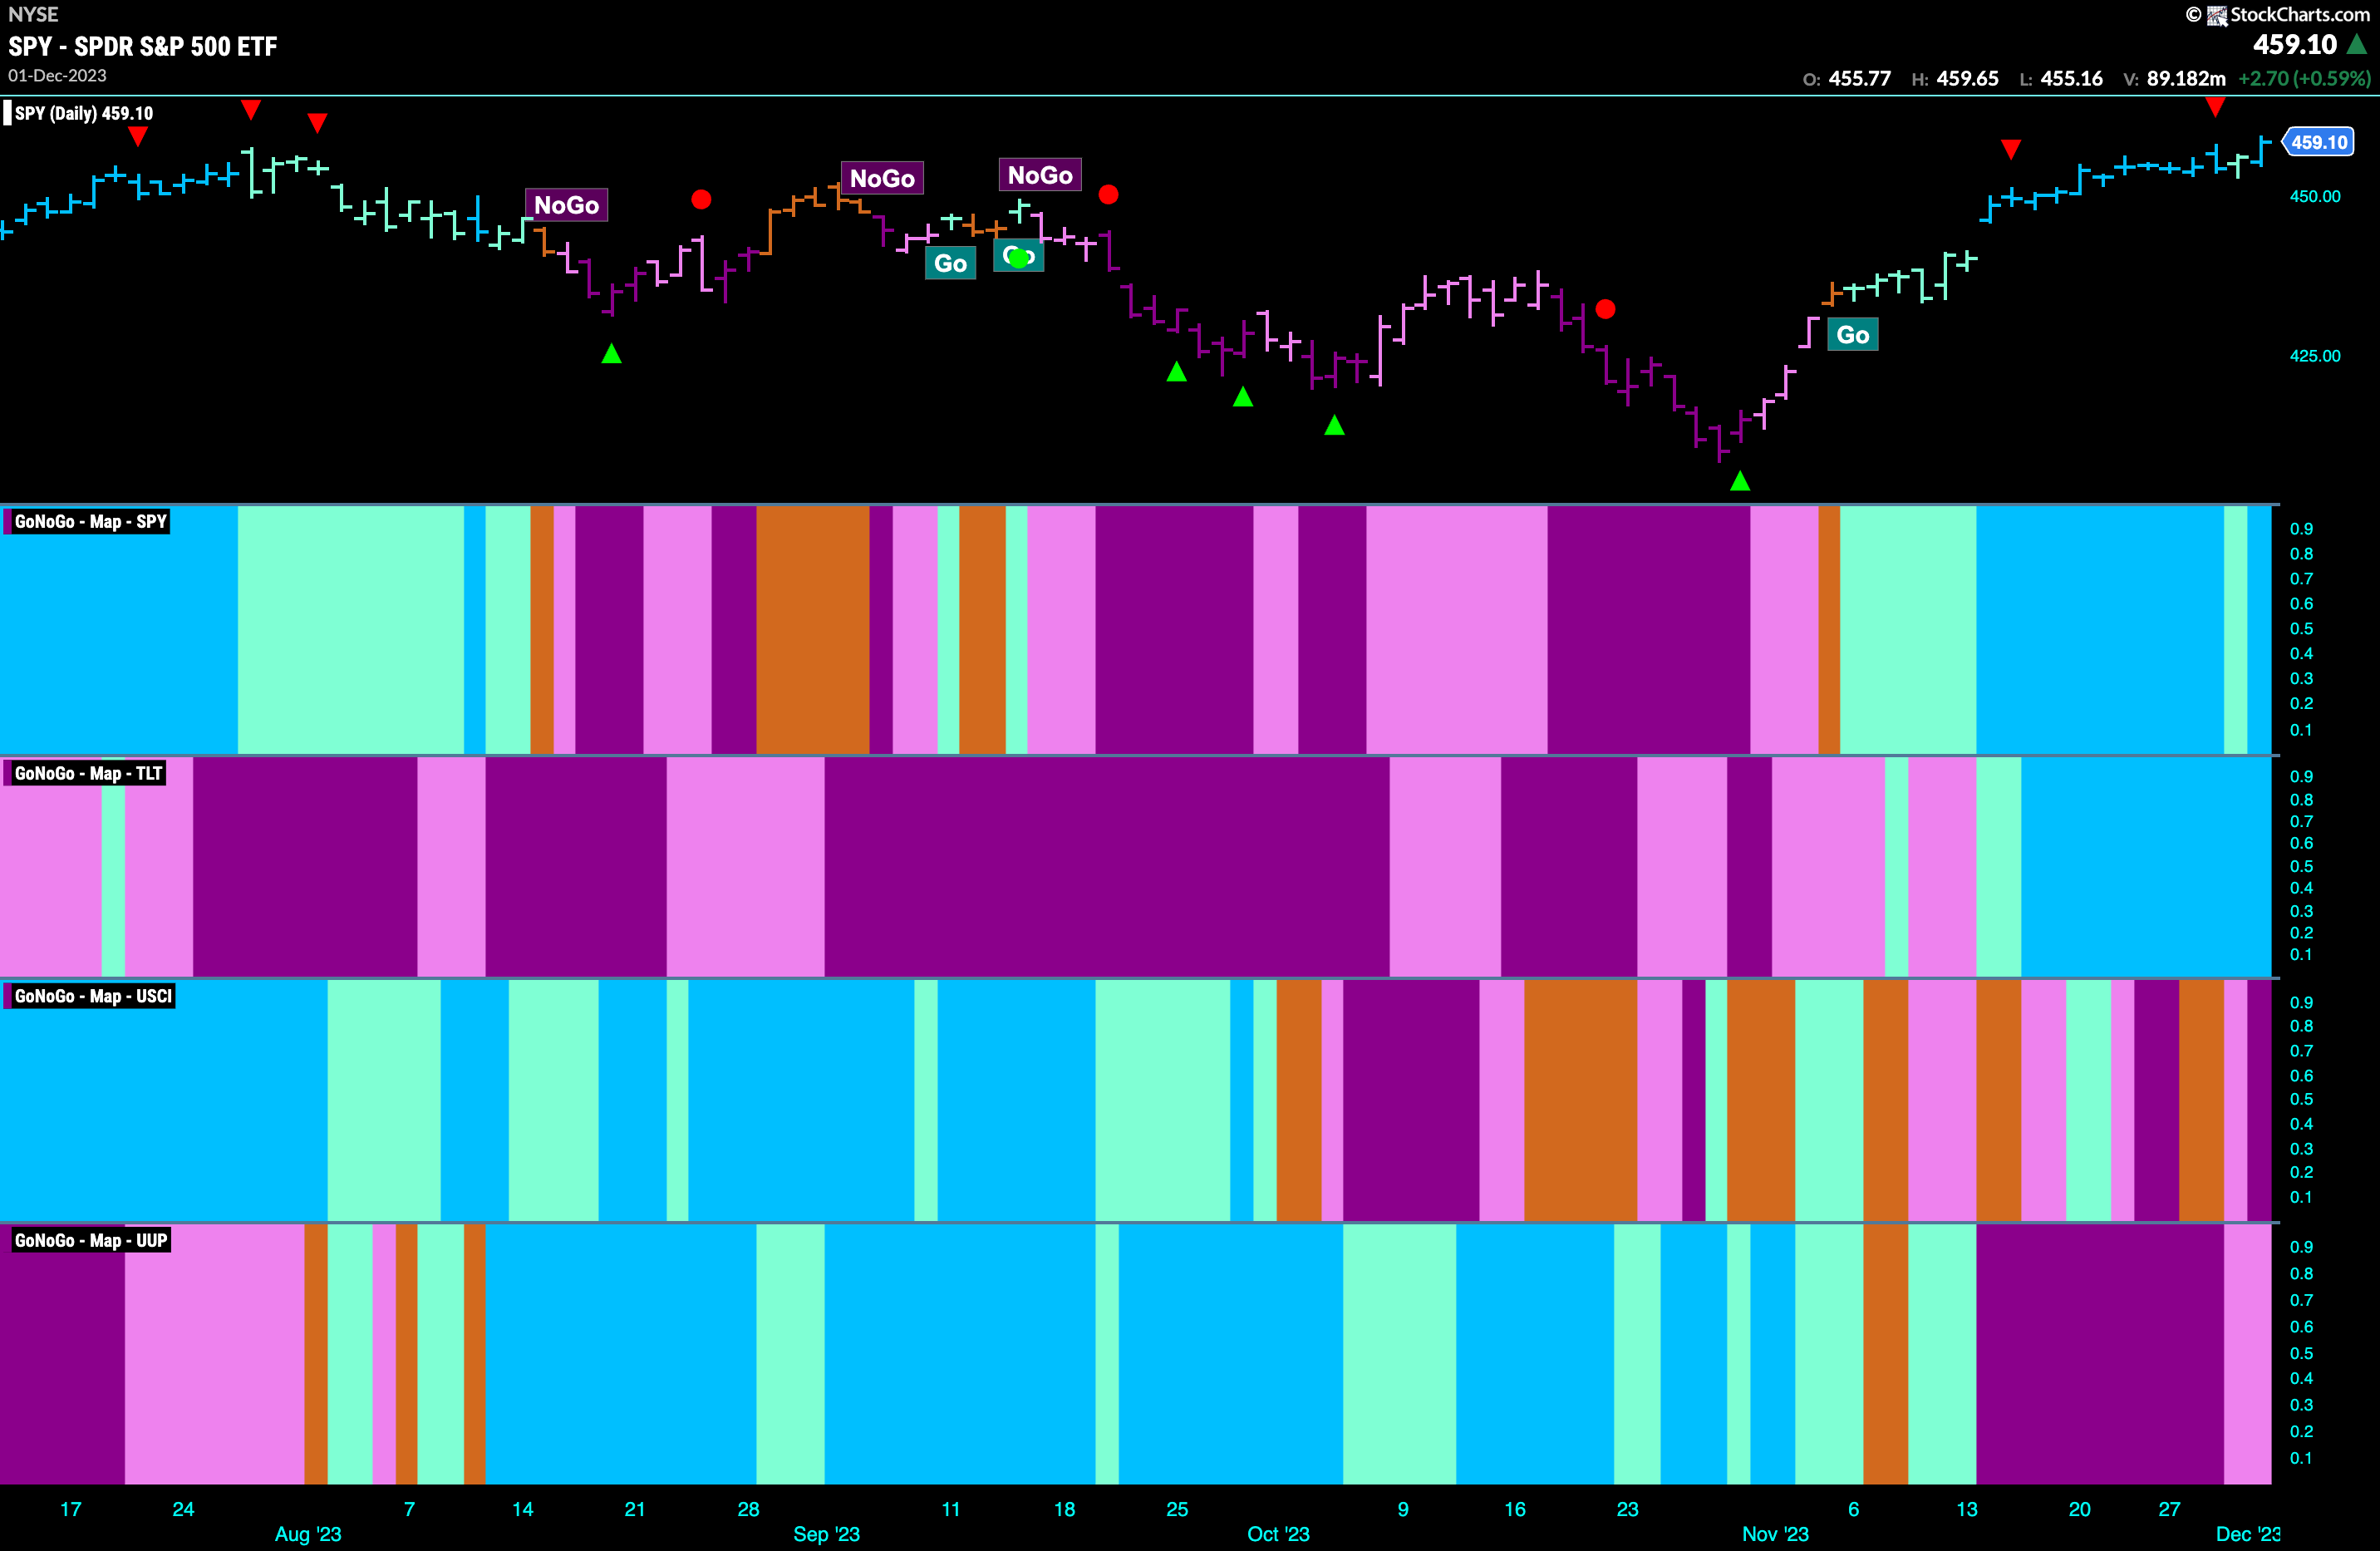
Good morning and welcome to this week’s Flight Path. Equity prices remain strong this week as they close higher. Treasury bond prices have managed to hold onto bright blue “Go” bars for the entire week. Commodities continue to struggle and the week ends with purple “NoGo” bars. The dollar, likewise, remains in a “NoGo” trend but has painted a couple of weaker pink bars.
Equity PricesMove beyond August Highs
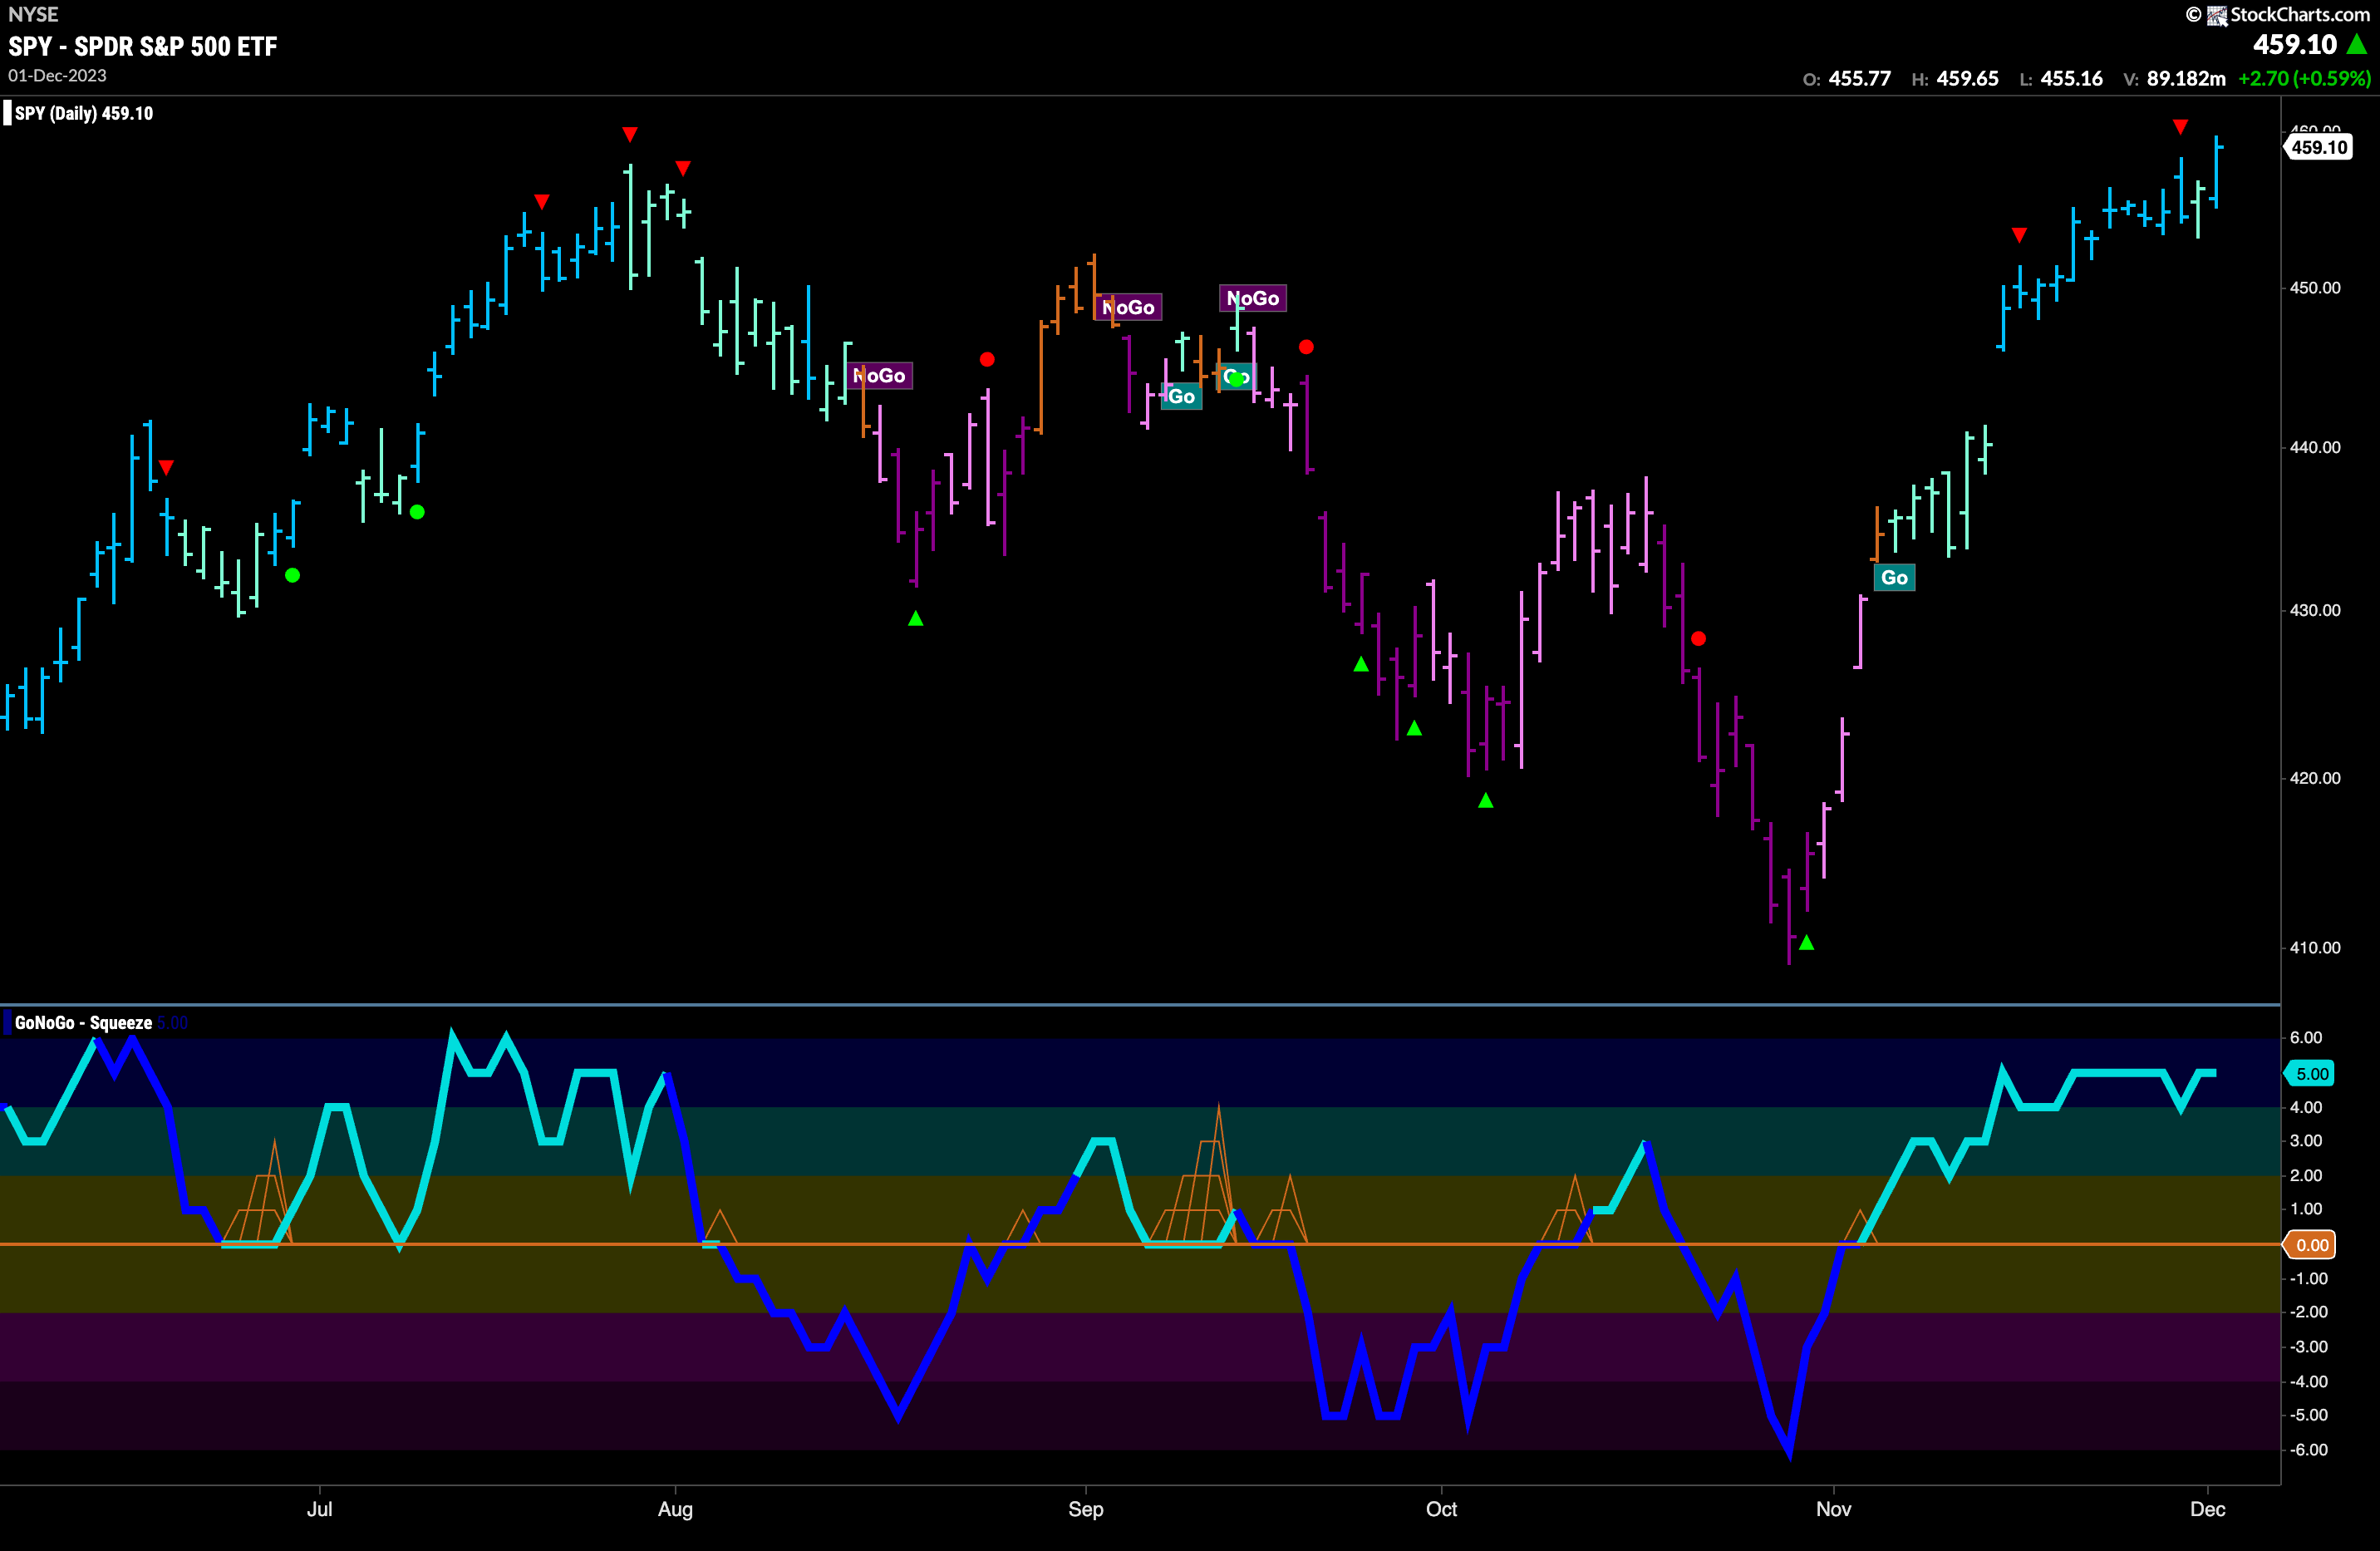
The week ended on a high note as U.S. equities moved higher still. We saw a strong “Go” bar that allowed price to close higher than the highest closes from August. Now only the all time highs from the end of 2022 stand in our way. GoNoGo Oscillator remained elevated this week and set a value of 5. Momentum is very strong currently, hovering around the overbought mark as prices climb. This shows for the moment, strong momentum.
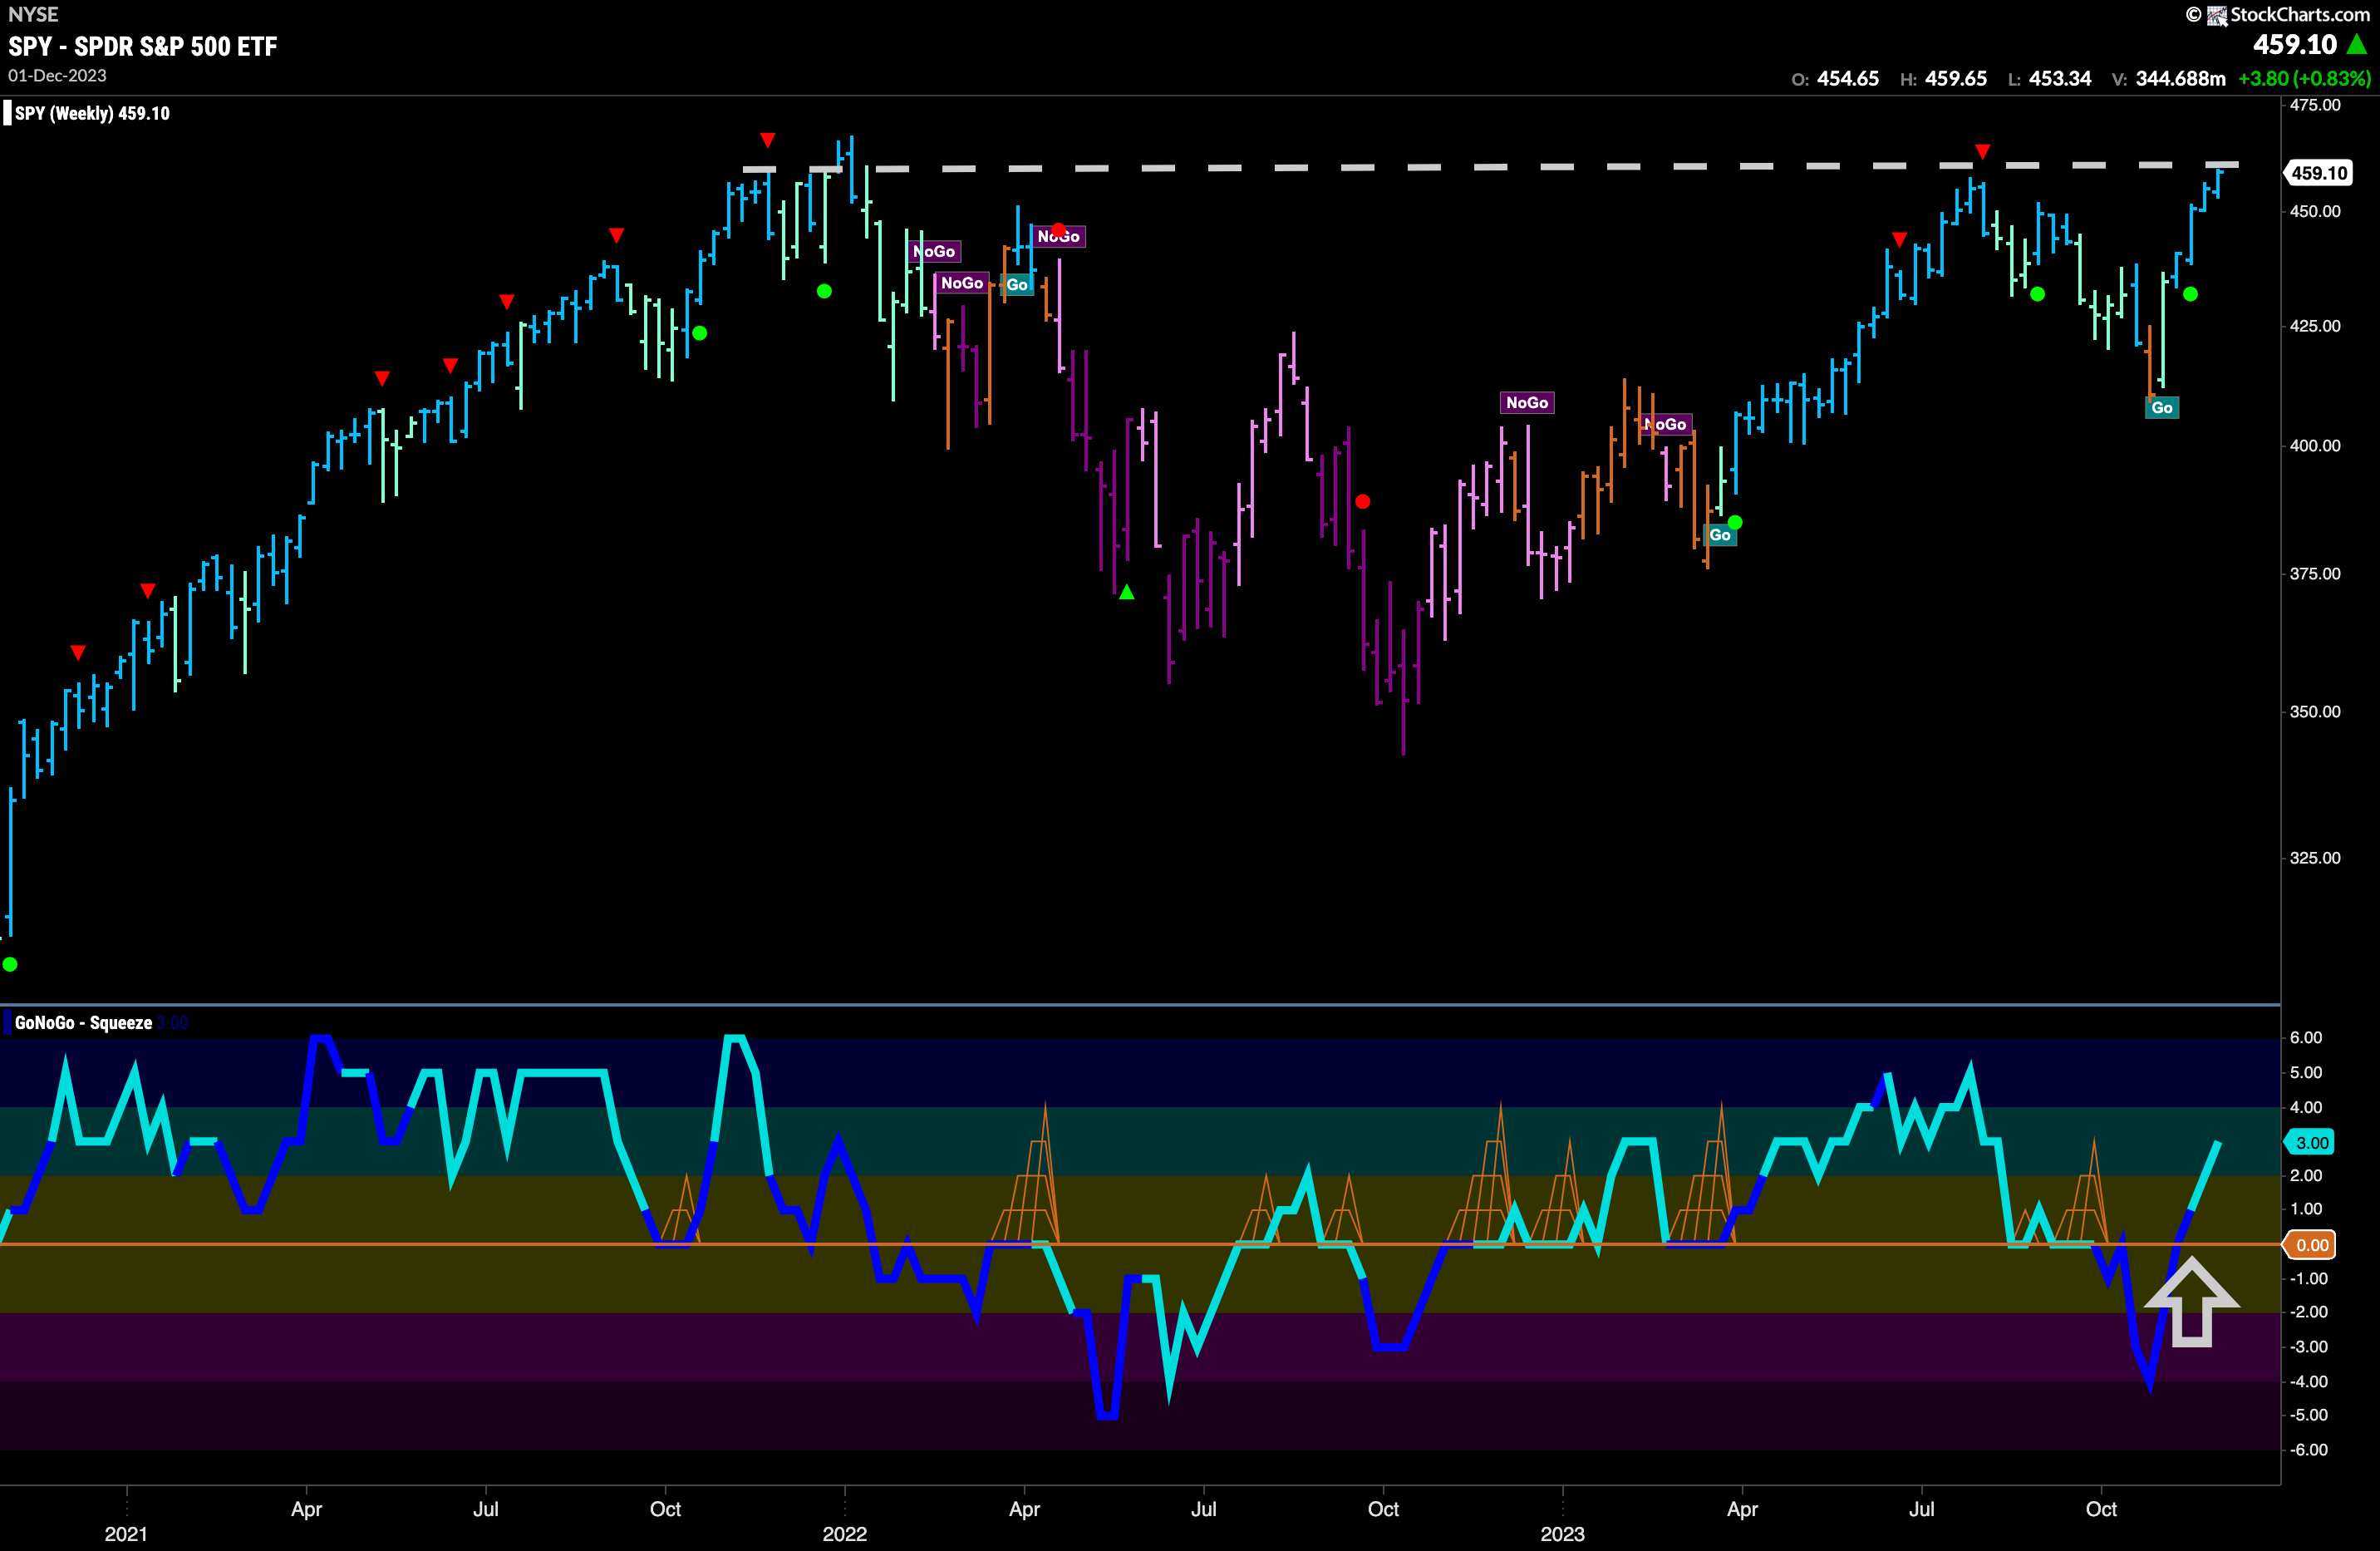
This past week saw price close above the August highs as we mentioned above. We can see now that we are running up against the highs from the end of 2022. Strong blue “Go” bars don’t show any weakness yet and we see rising momentum as the oscillator is at a value of 3. We can see that it was recently able to break through the zero line into positive territory. All of these things are good signs for the bullish thesis. We will watch to see if we can have another higher weekly close.
Treasury Rates Continue to Fall
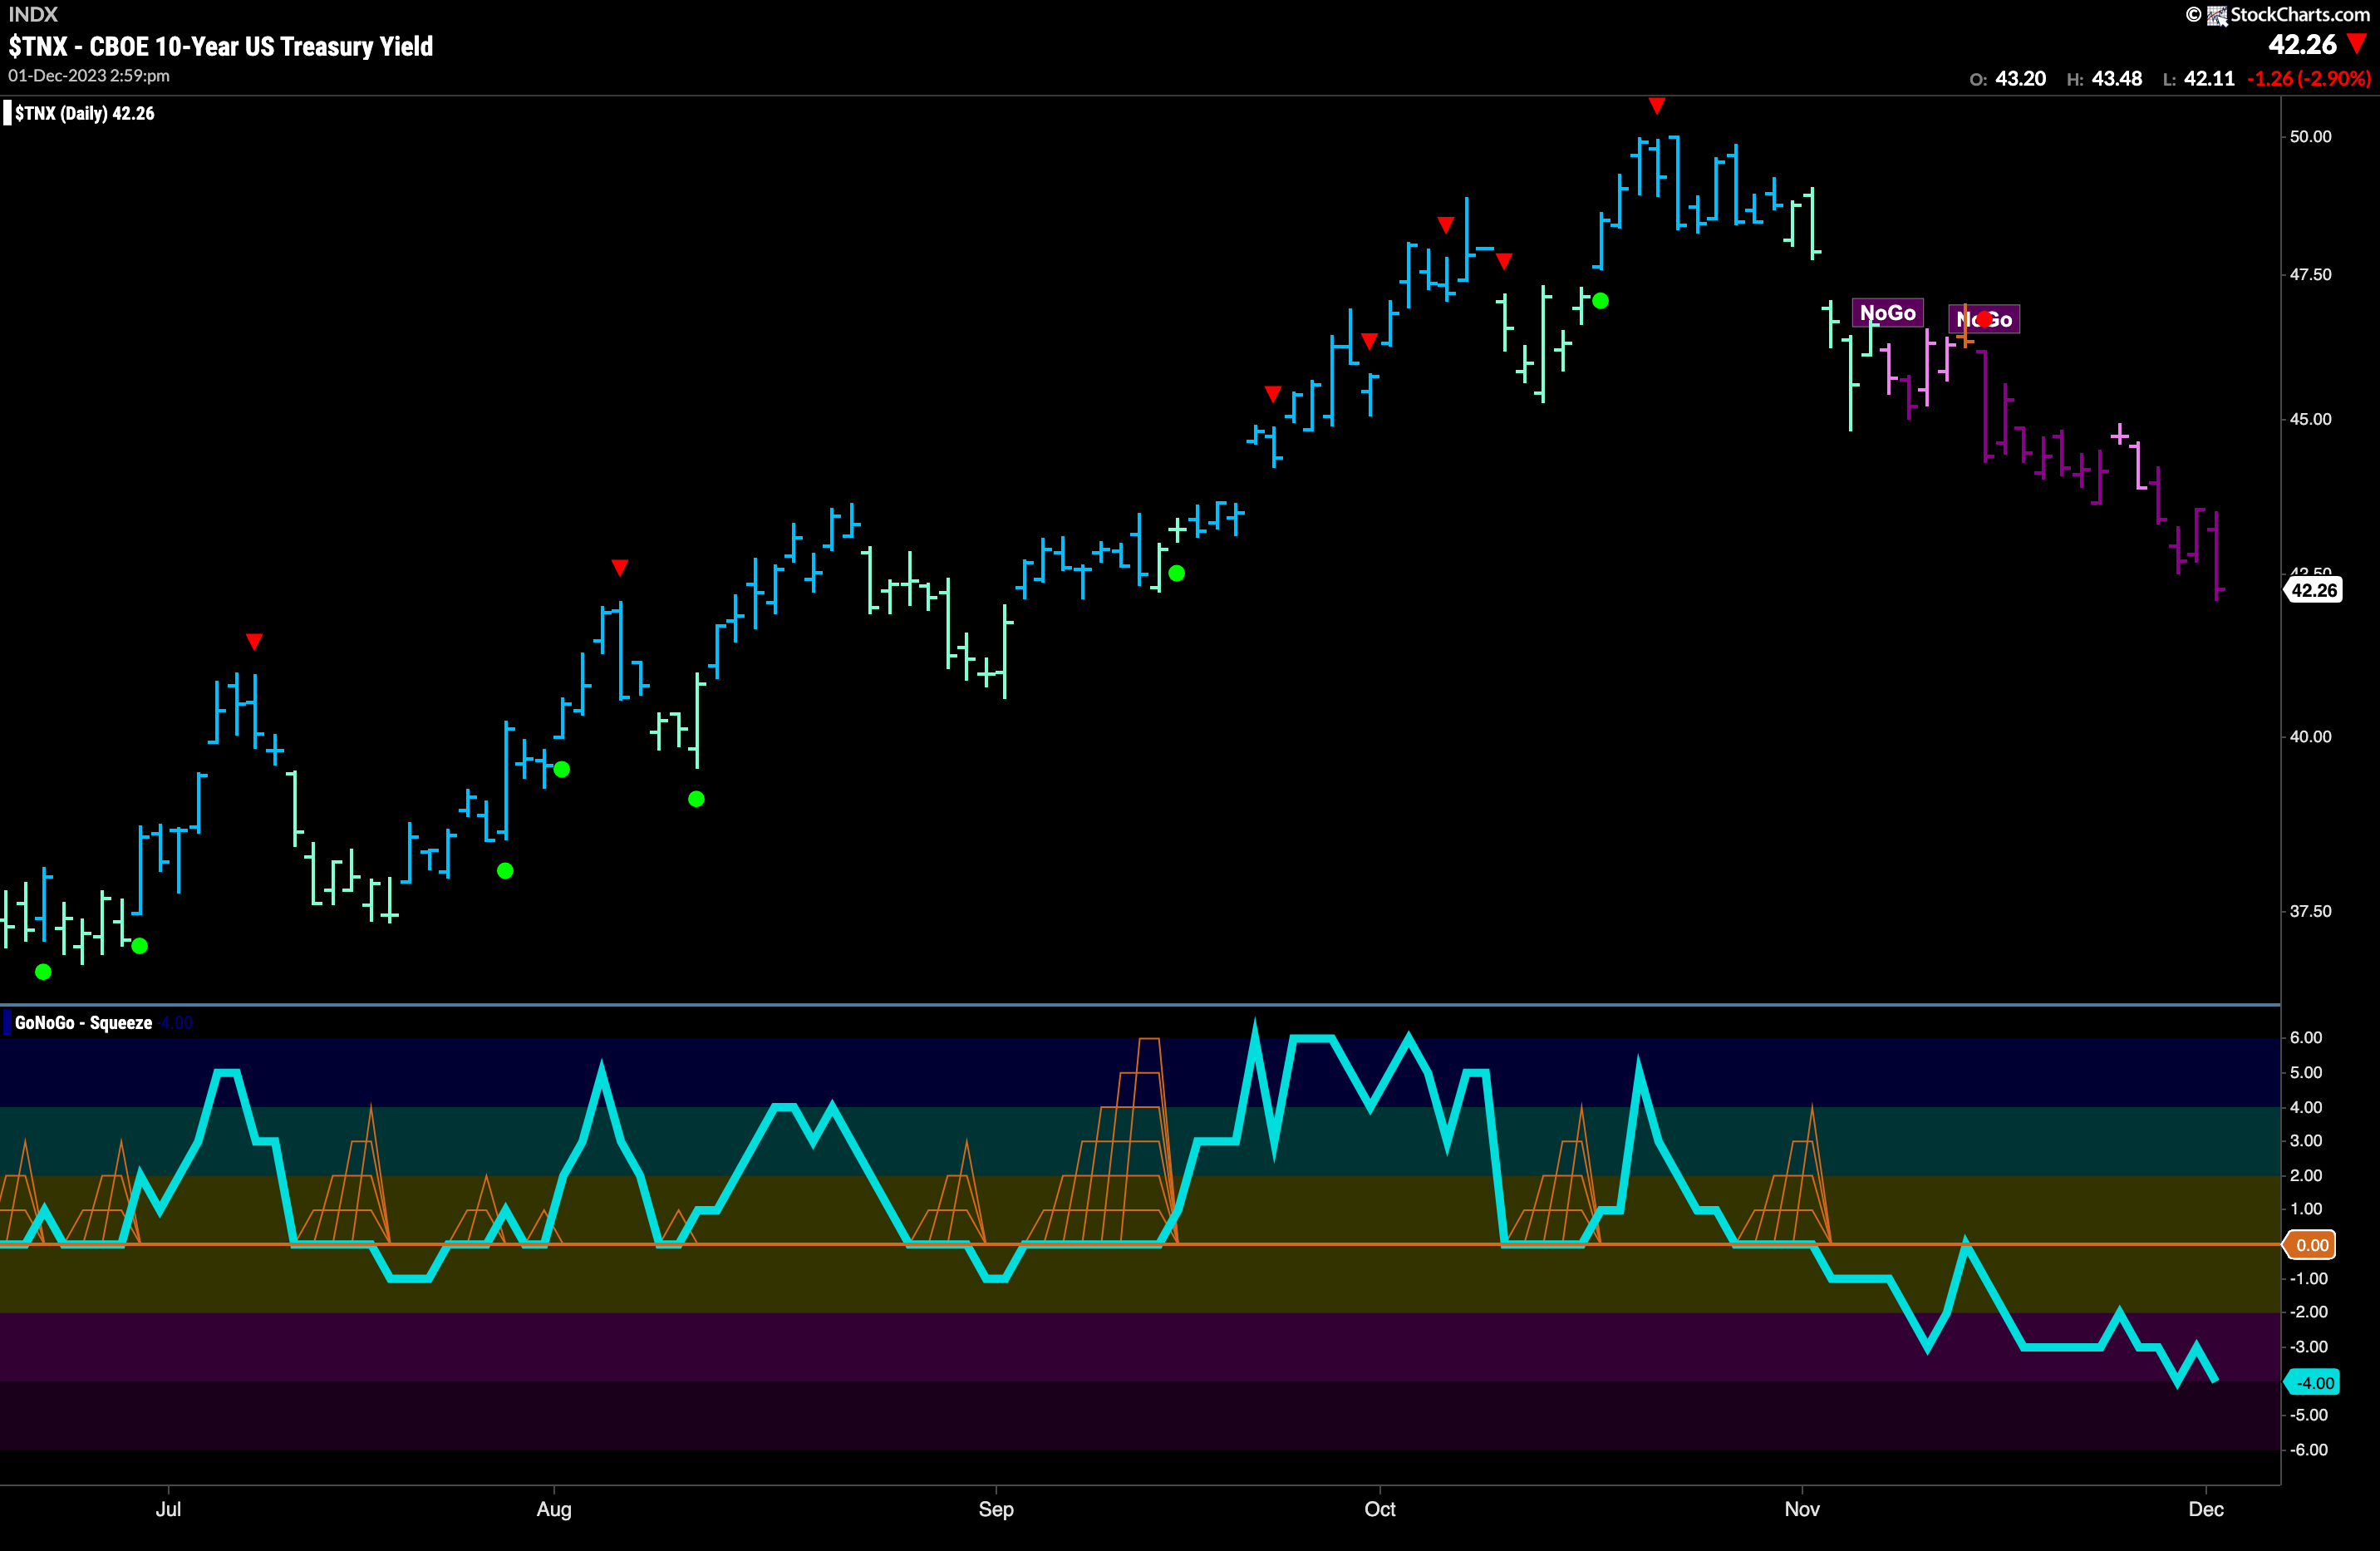
The “NoGo” trend continues in rates as the support we were looking at last week fell away. We can see price set another lower low and the bars remained strong purple for much of the week telling us that the “NoGo” trend is strong. GoNoGo Oscillator has been falling with price confirming the trend. Since breaking through the zero line ahead of the trend change at the beginning of November we have seen the zero line tested once from below where it offered resistance. After that, the oscillator has fallen further into negative territory and is now at a value of -4, not quite yet oversold.
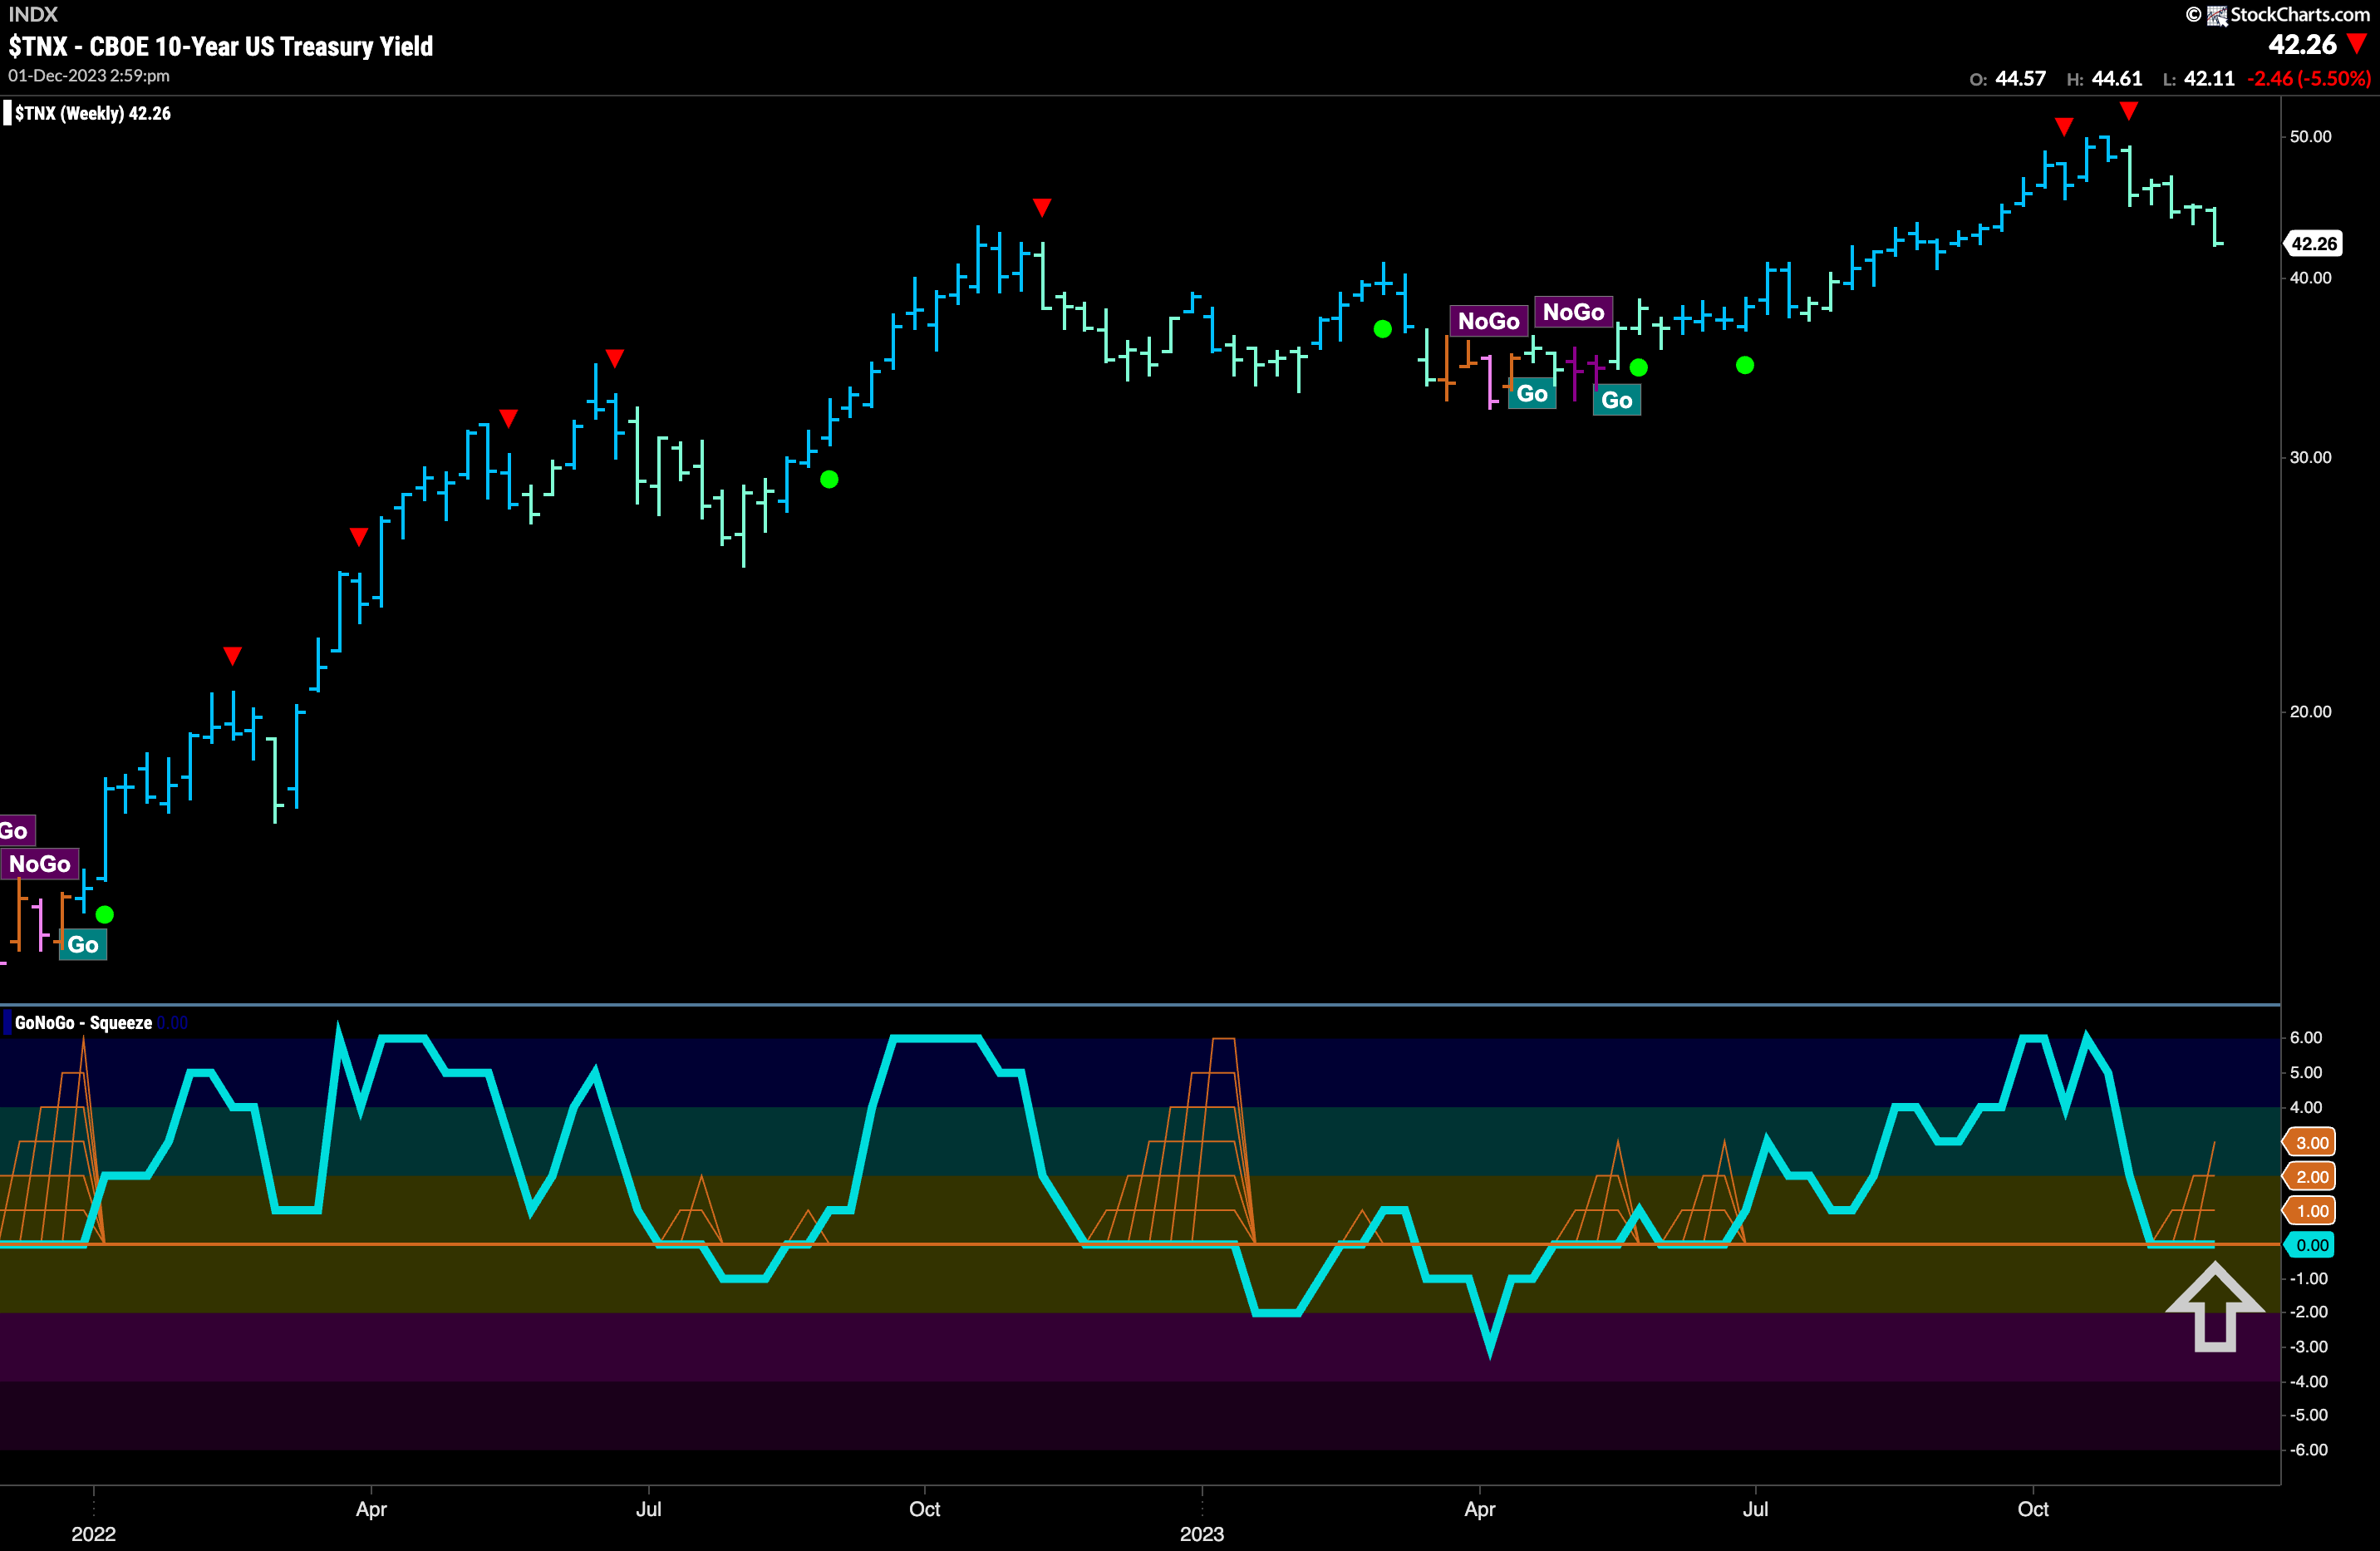
The larger timeframe chart shows us that we are still at an important inflection point for longer term price action. GoNoGo Trend painted another weaker aqua bar this past week as price fell again. Since the Go Countertrend Correction Icons a month ago we have seen consistent weakness in the “Go” trend. GoNoGo Oscillator has spent another week at the zero line causing the climbing grid of GoNoGo Squeeze to begin to build. We will watch closely here. If the oscillator finds support at zero, and rallies back into positive territory then we may see the long term “Go” trend continue. If the oscillator fails to hold the zero line then that would be a signal of a deeper correction.
Dollar “NoGo” Holds for Now
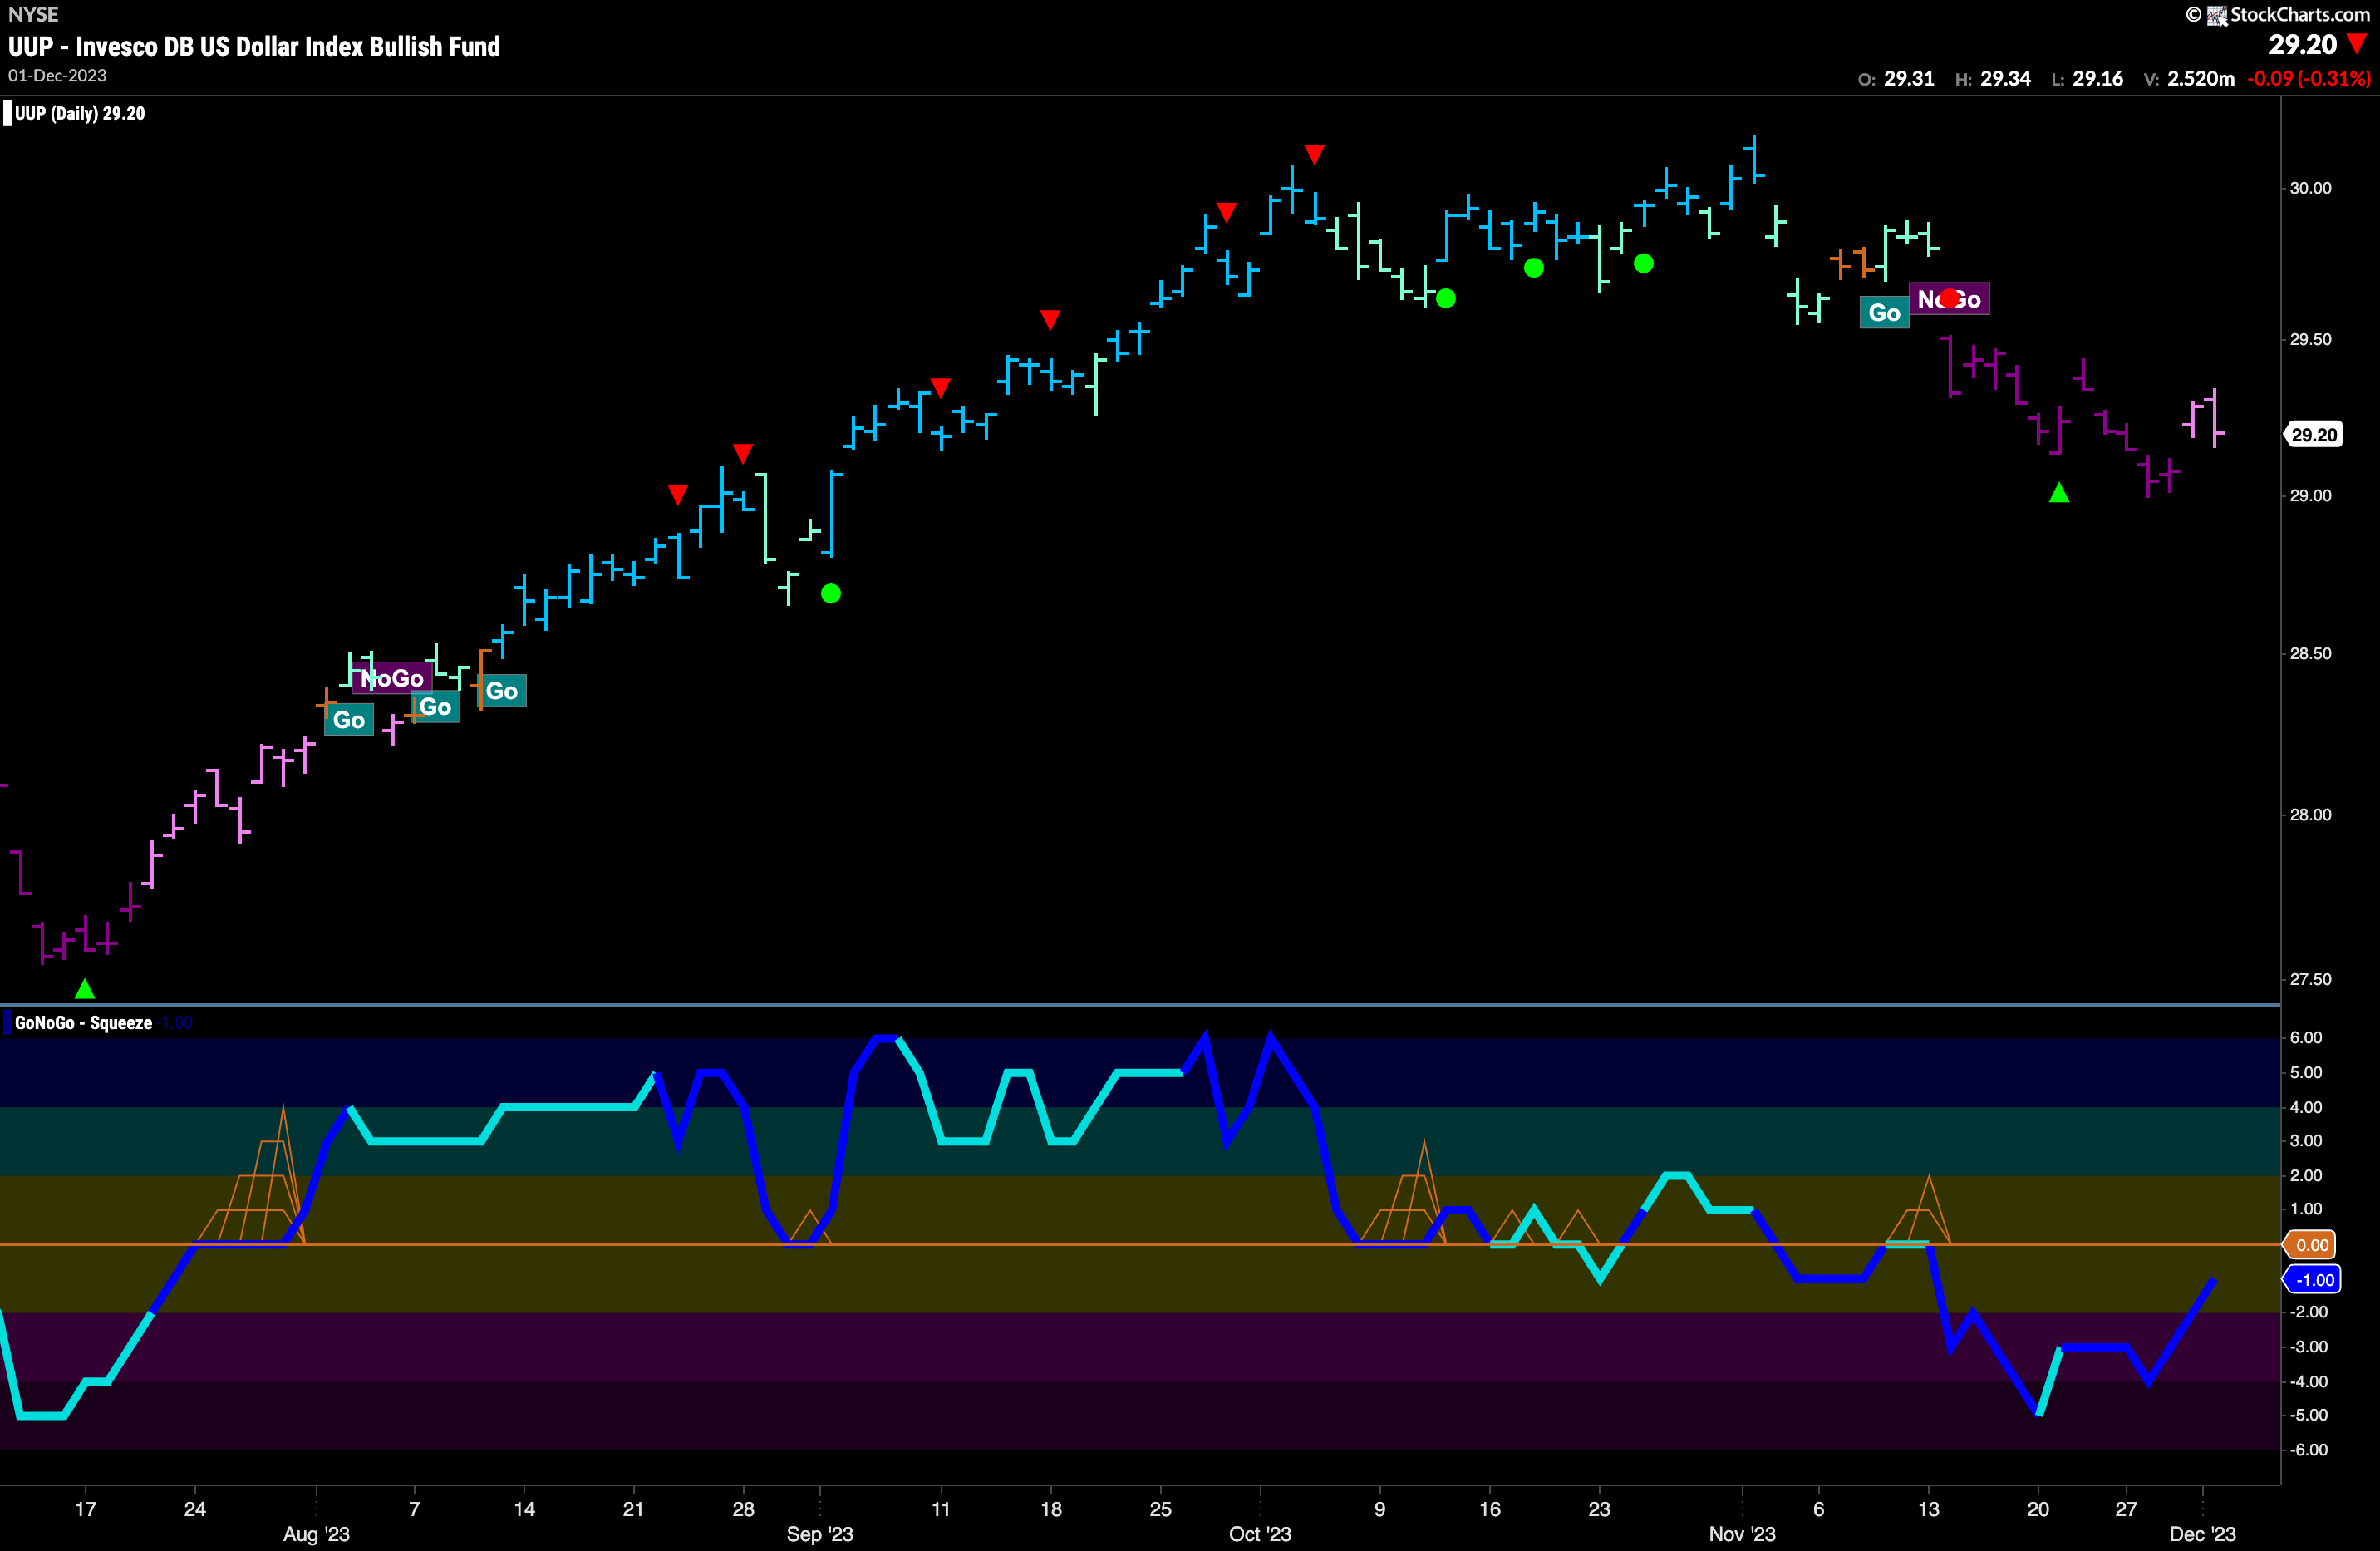
GoNoGo Trend continued to paint “NoGo” bars this week although we did see some weakness in the trend as prices tried to rally. Pink bars tell us that there is a little movement against the trend however the weight of the evidence reminds us that the “NoGo” trend is still in place. GoNoGo Oscillator is in negative territory but rising and volume is heavy. We will watch what happens as the oscillator approaches the zero line.
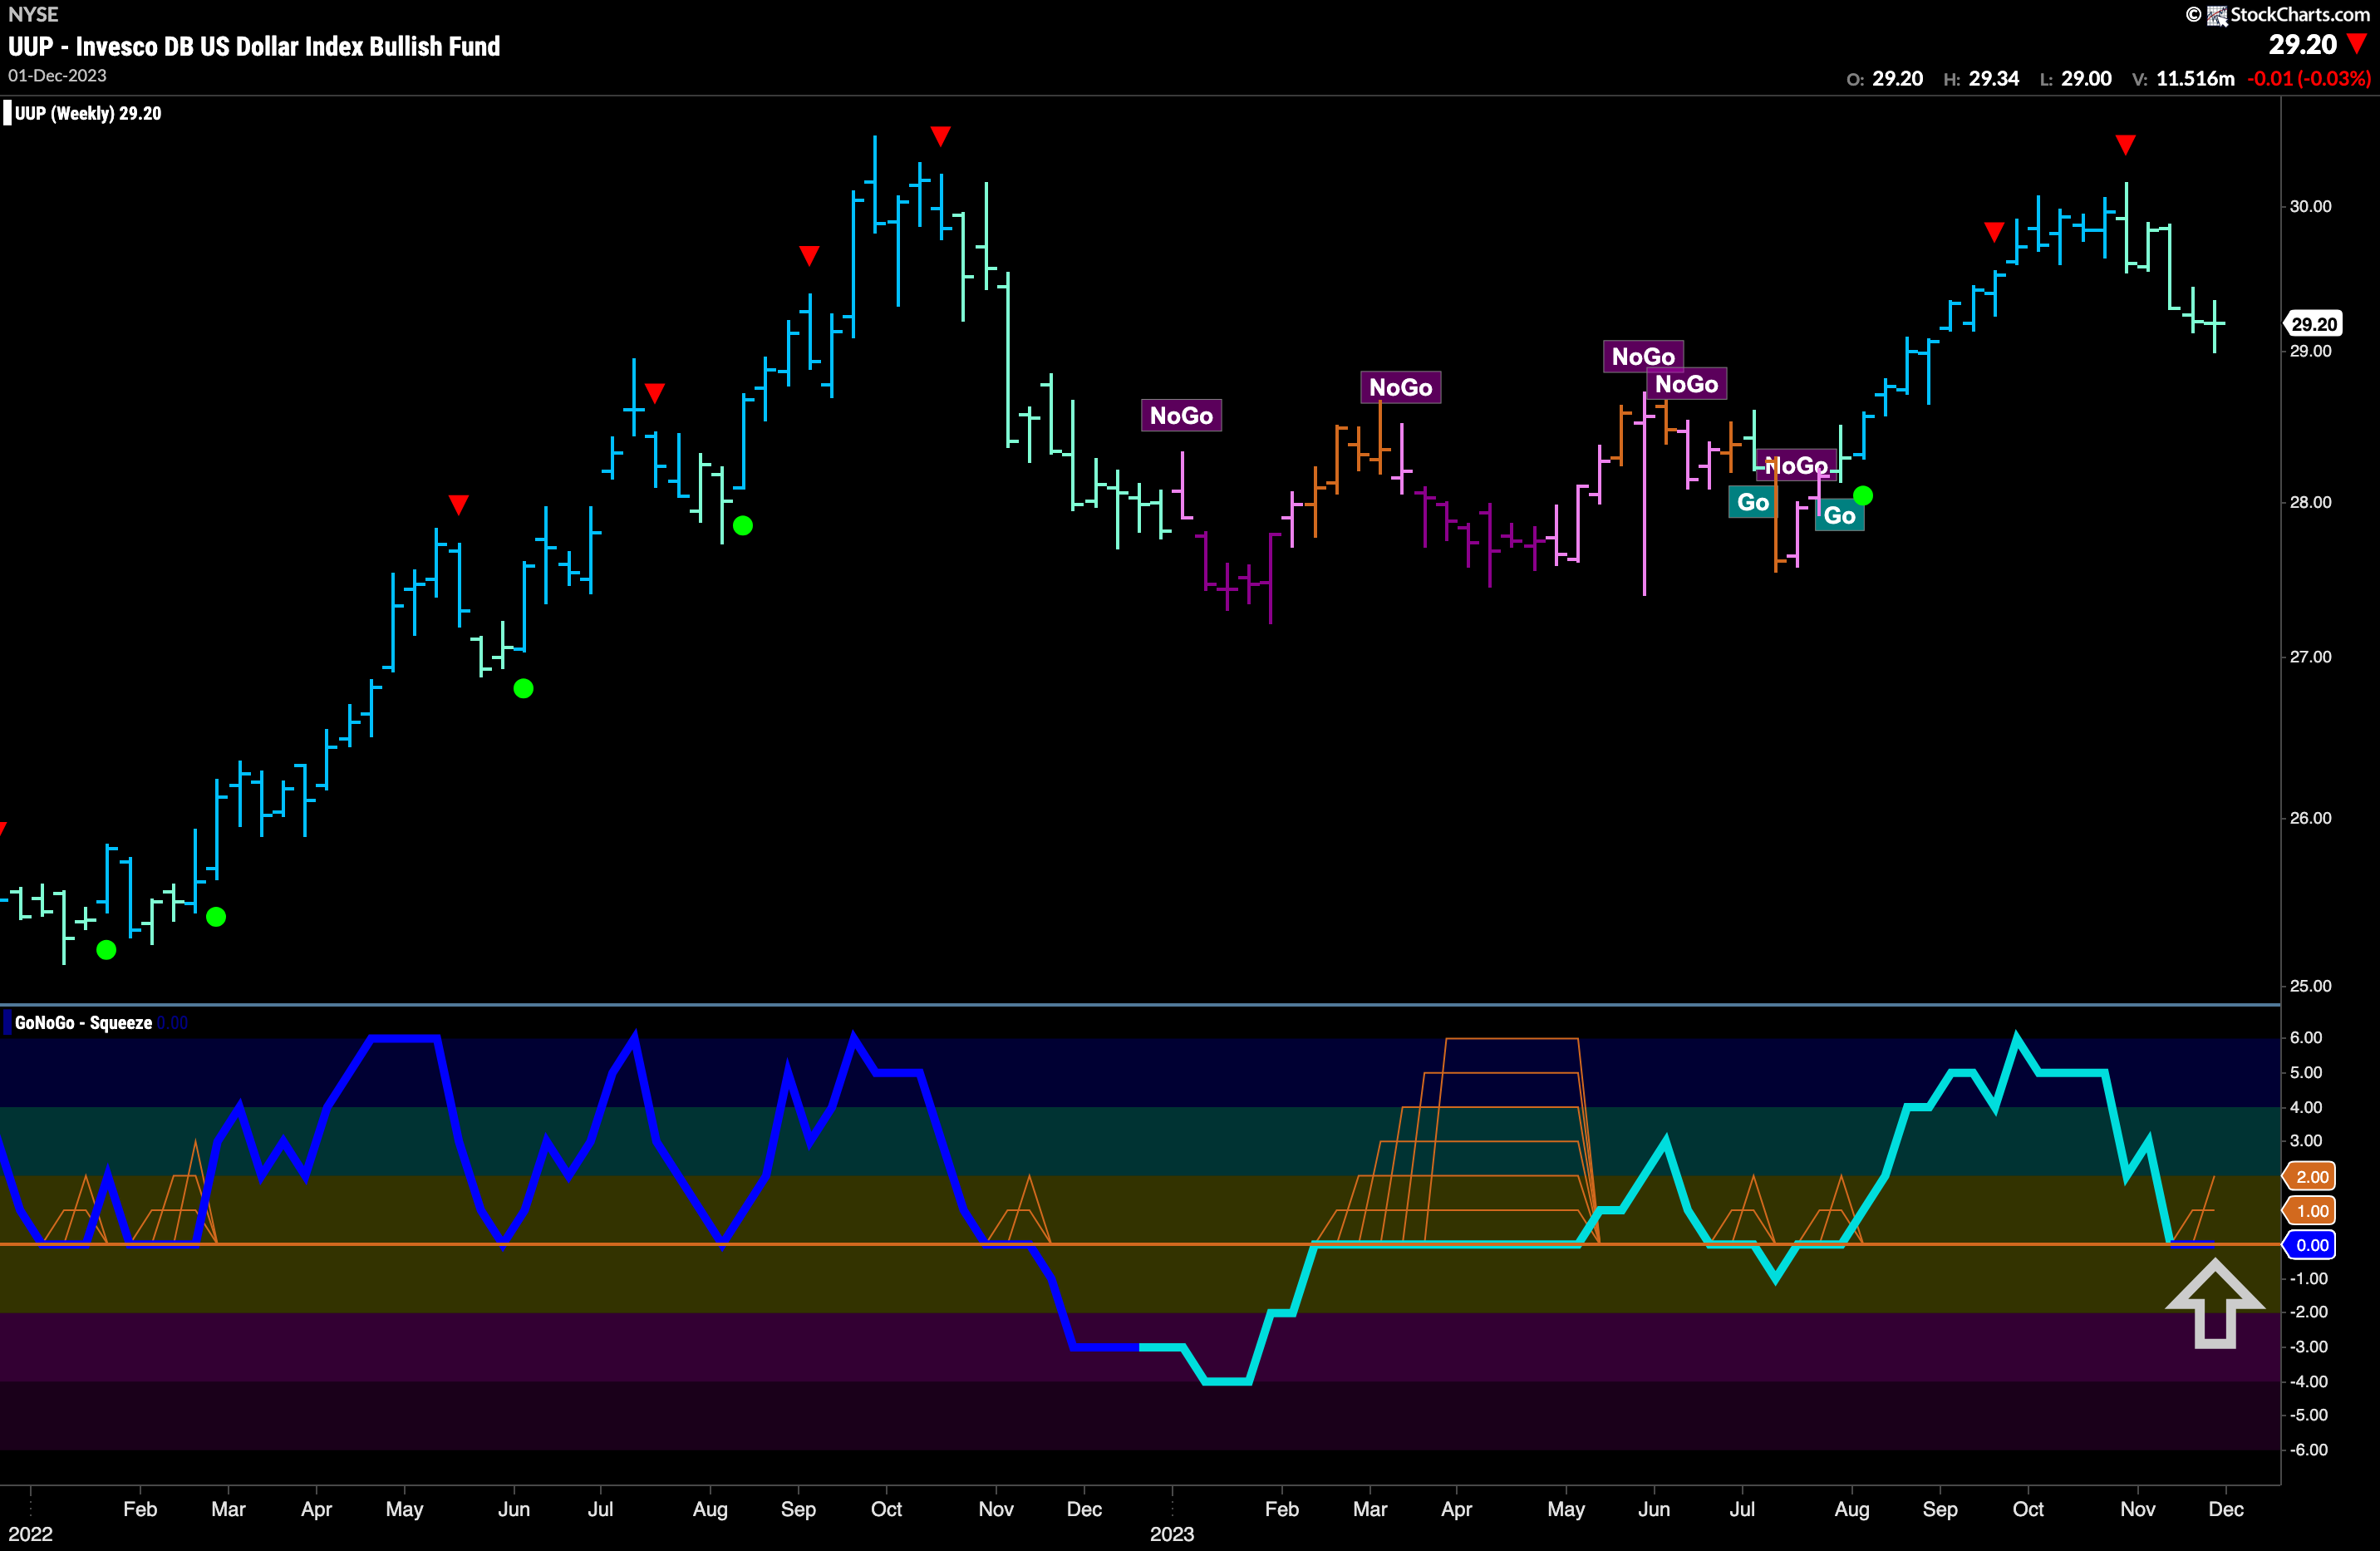
The weekly chart shows that the “Go” trend continues to be tested. We have another weaker aqua bar this past week. We can say that it is also a “doji”, as the open and close were at very close to the same level. Doji’s represent uncertainty, and that is logical as price approaches support from the prior highs (March/June). As price has pulled back from the Go Countertrend Correction Icon (red arrow) the oscillator has fallen to and stayed at the zero level. Volume has picked up as we see the beginnings of a GoNoGo Squeeze. We will watch to see if the oscillator rallied back into positive territory from here.
Oil Continues to Struggle
GoNoGo Trend finished the week painting another strong purple “NoGo” bar as price fell back toward the lows of the pattern. There has been consolidation at this level with no new low or new high for several weeks. The weight of the evidence approach insists that the trend is still a “NoGo” and if we turn our eye to GoNoGo Oscillator we can see that it is being firmly rejected by the zero line. This tells us that for now momentum remains in the direction of the “NoGo” trend so we will not be surprised to see price make an attempt at a lower low.

Gold Kicks on to Higher Highs
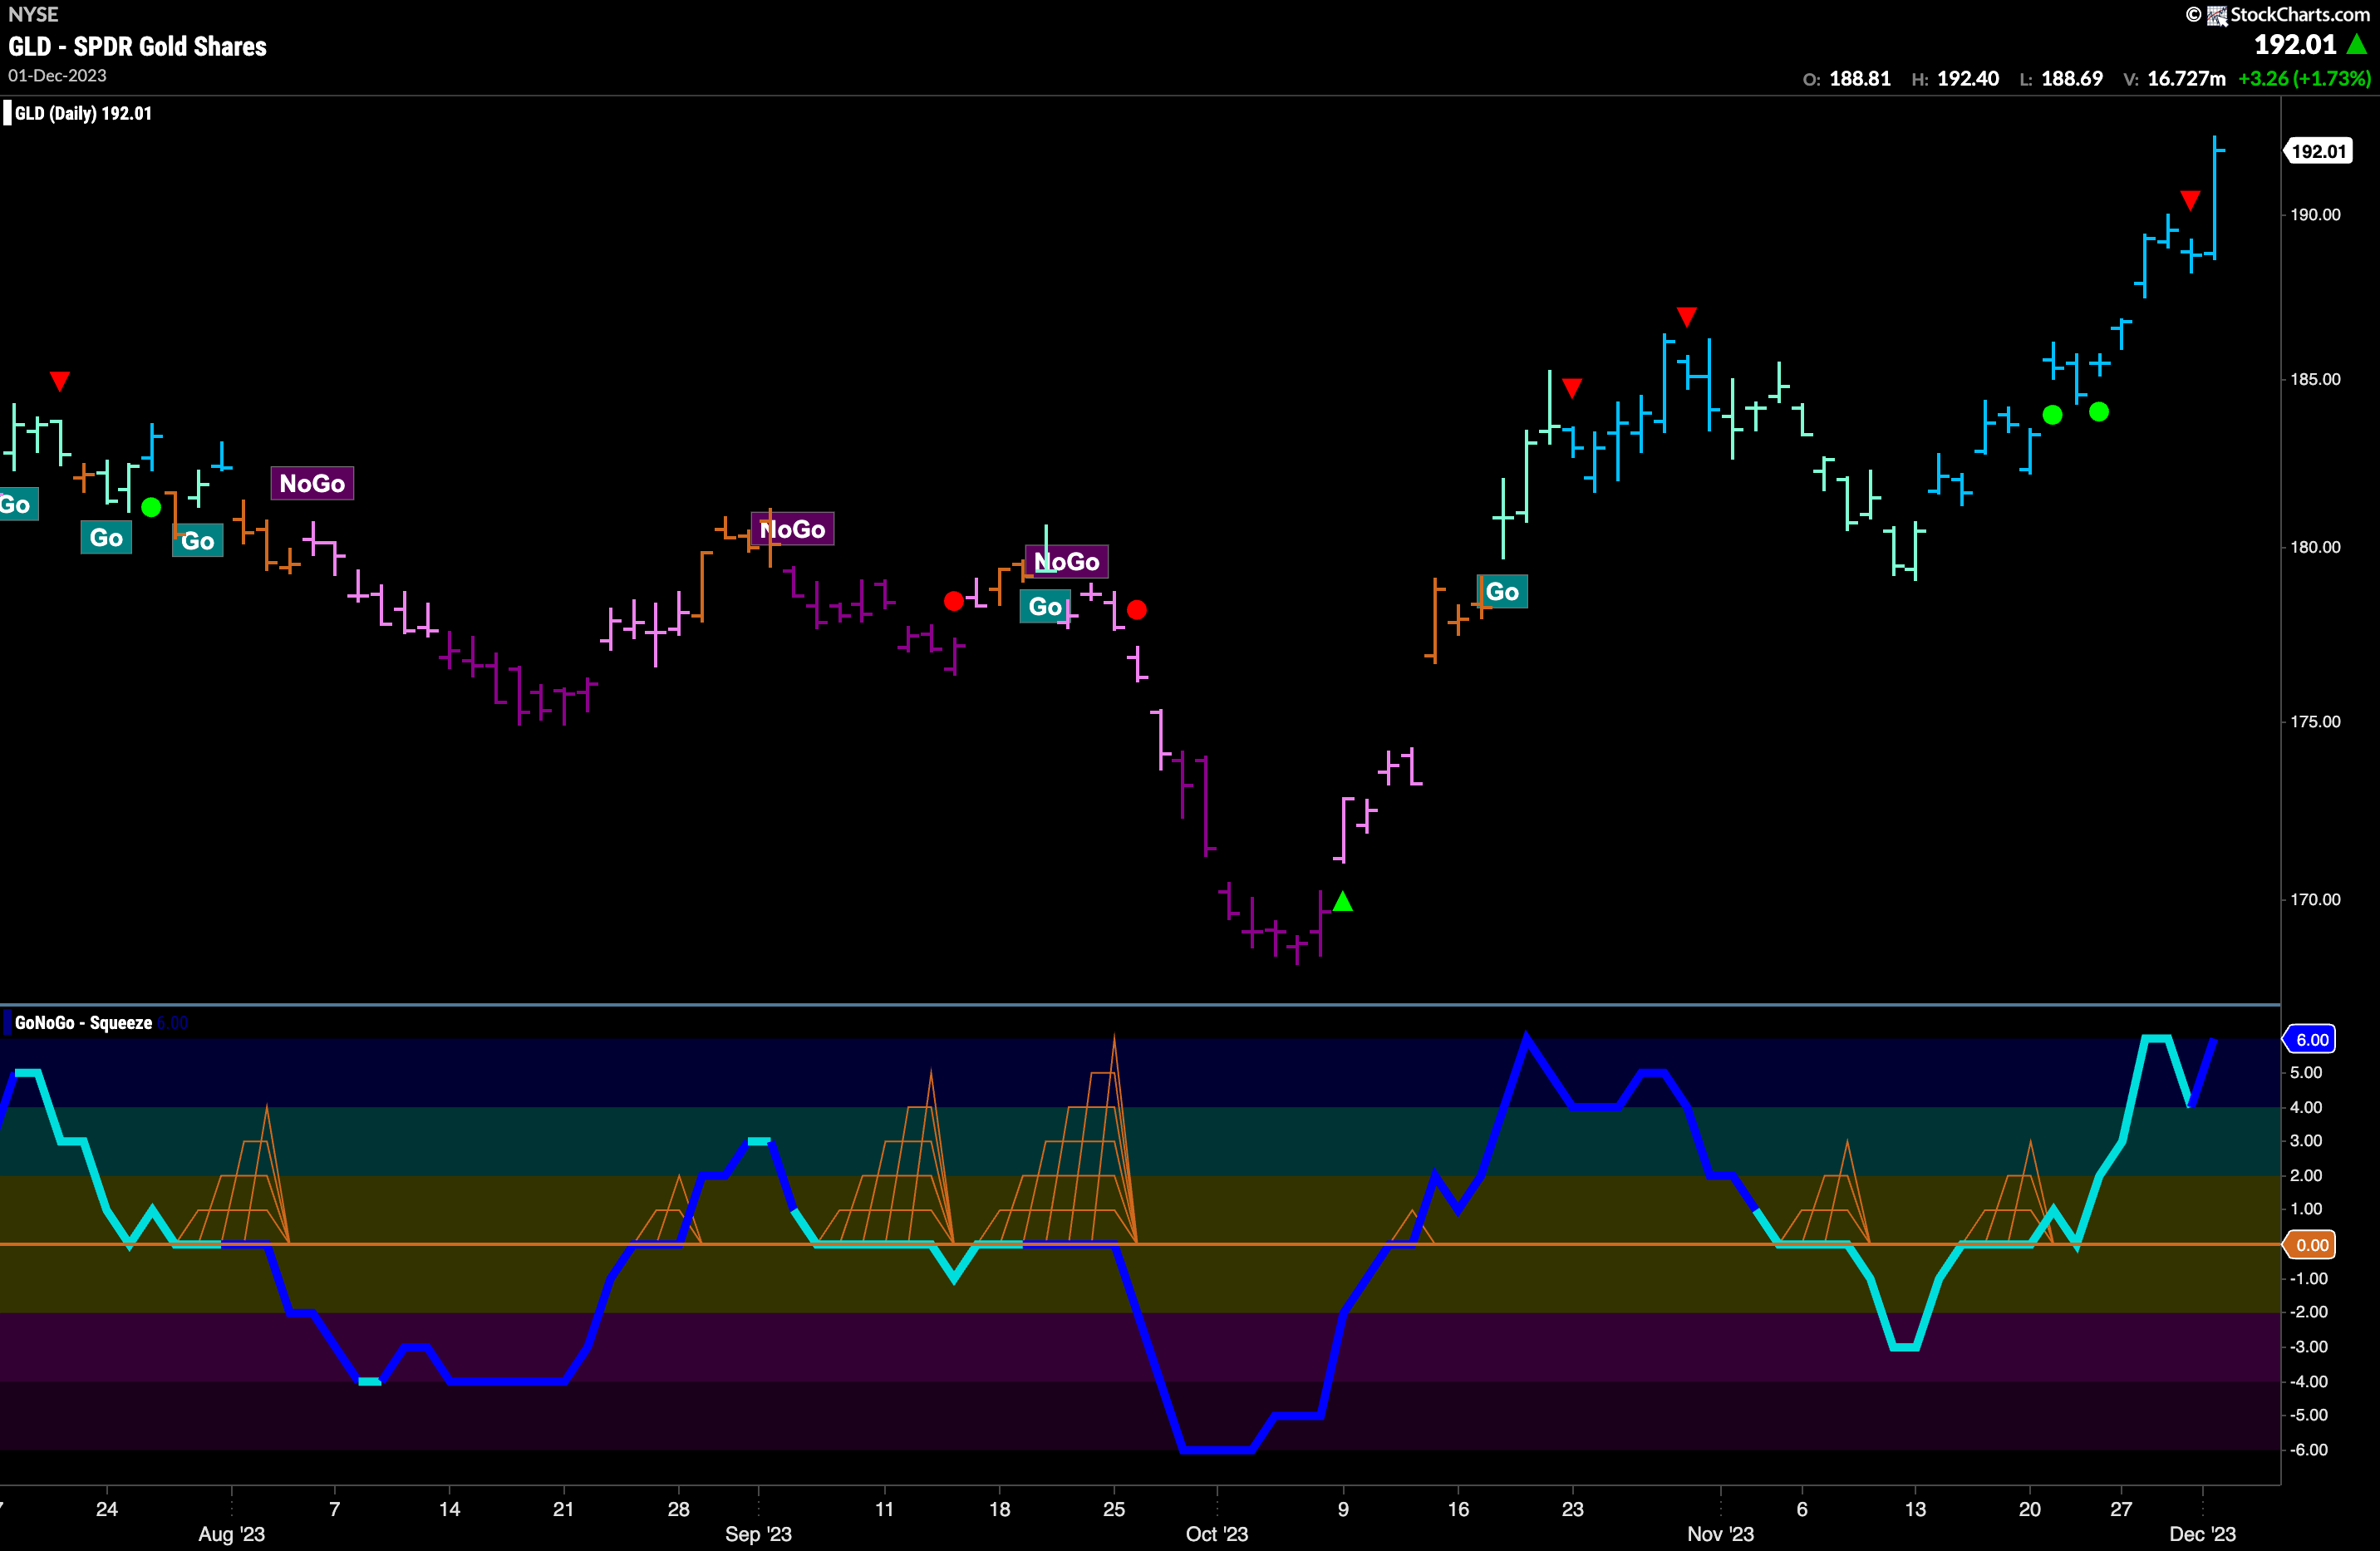
Last week we noted the support that price had found as GoNoGo Oscillator bounced off the zero line back into positive territory. This Go Trend Continuation has propelled price higher this week as we see a string of strong blue “Go” bars and price racing higher. GoNoGo Oscillator is now in overbought territory and volume is heavy. We will look to see if this can be sustained this week or of price takes a breath.
Sector RelMap
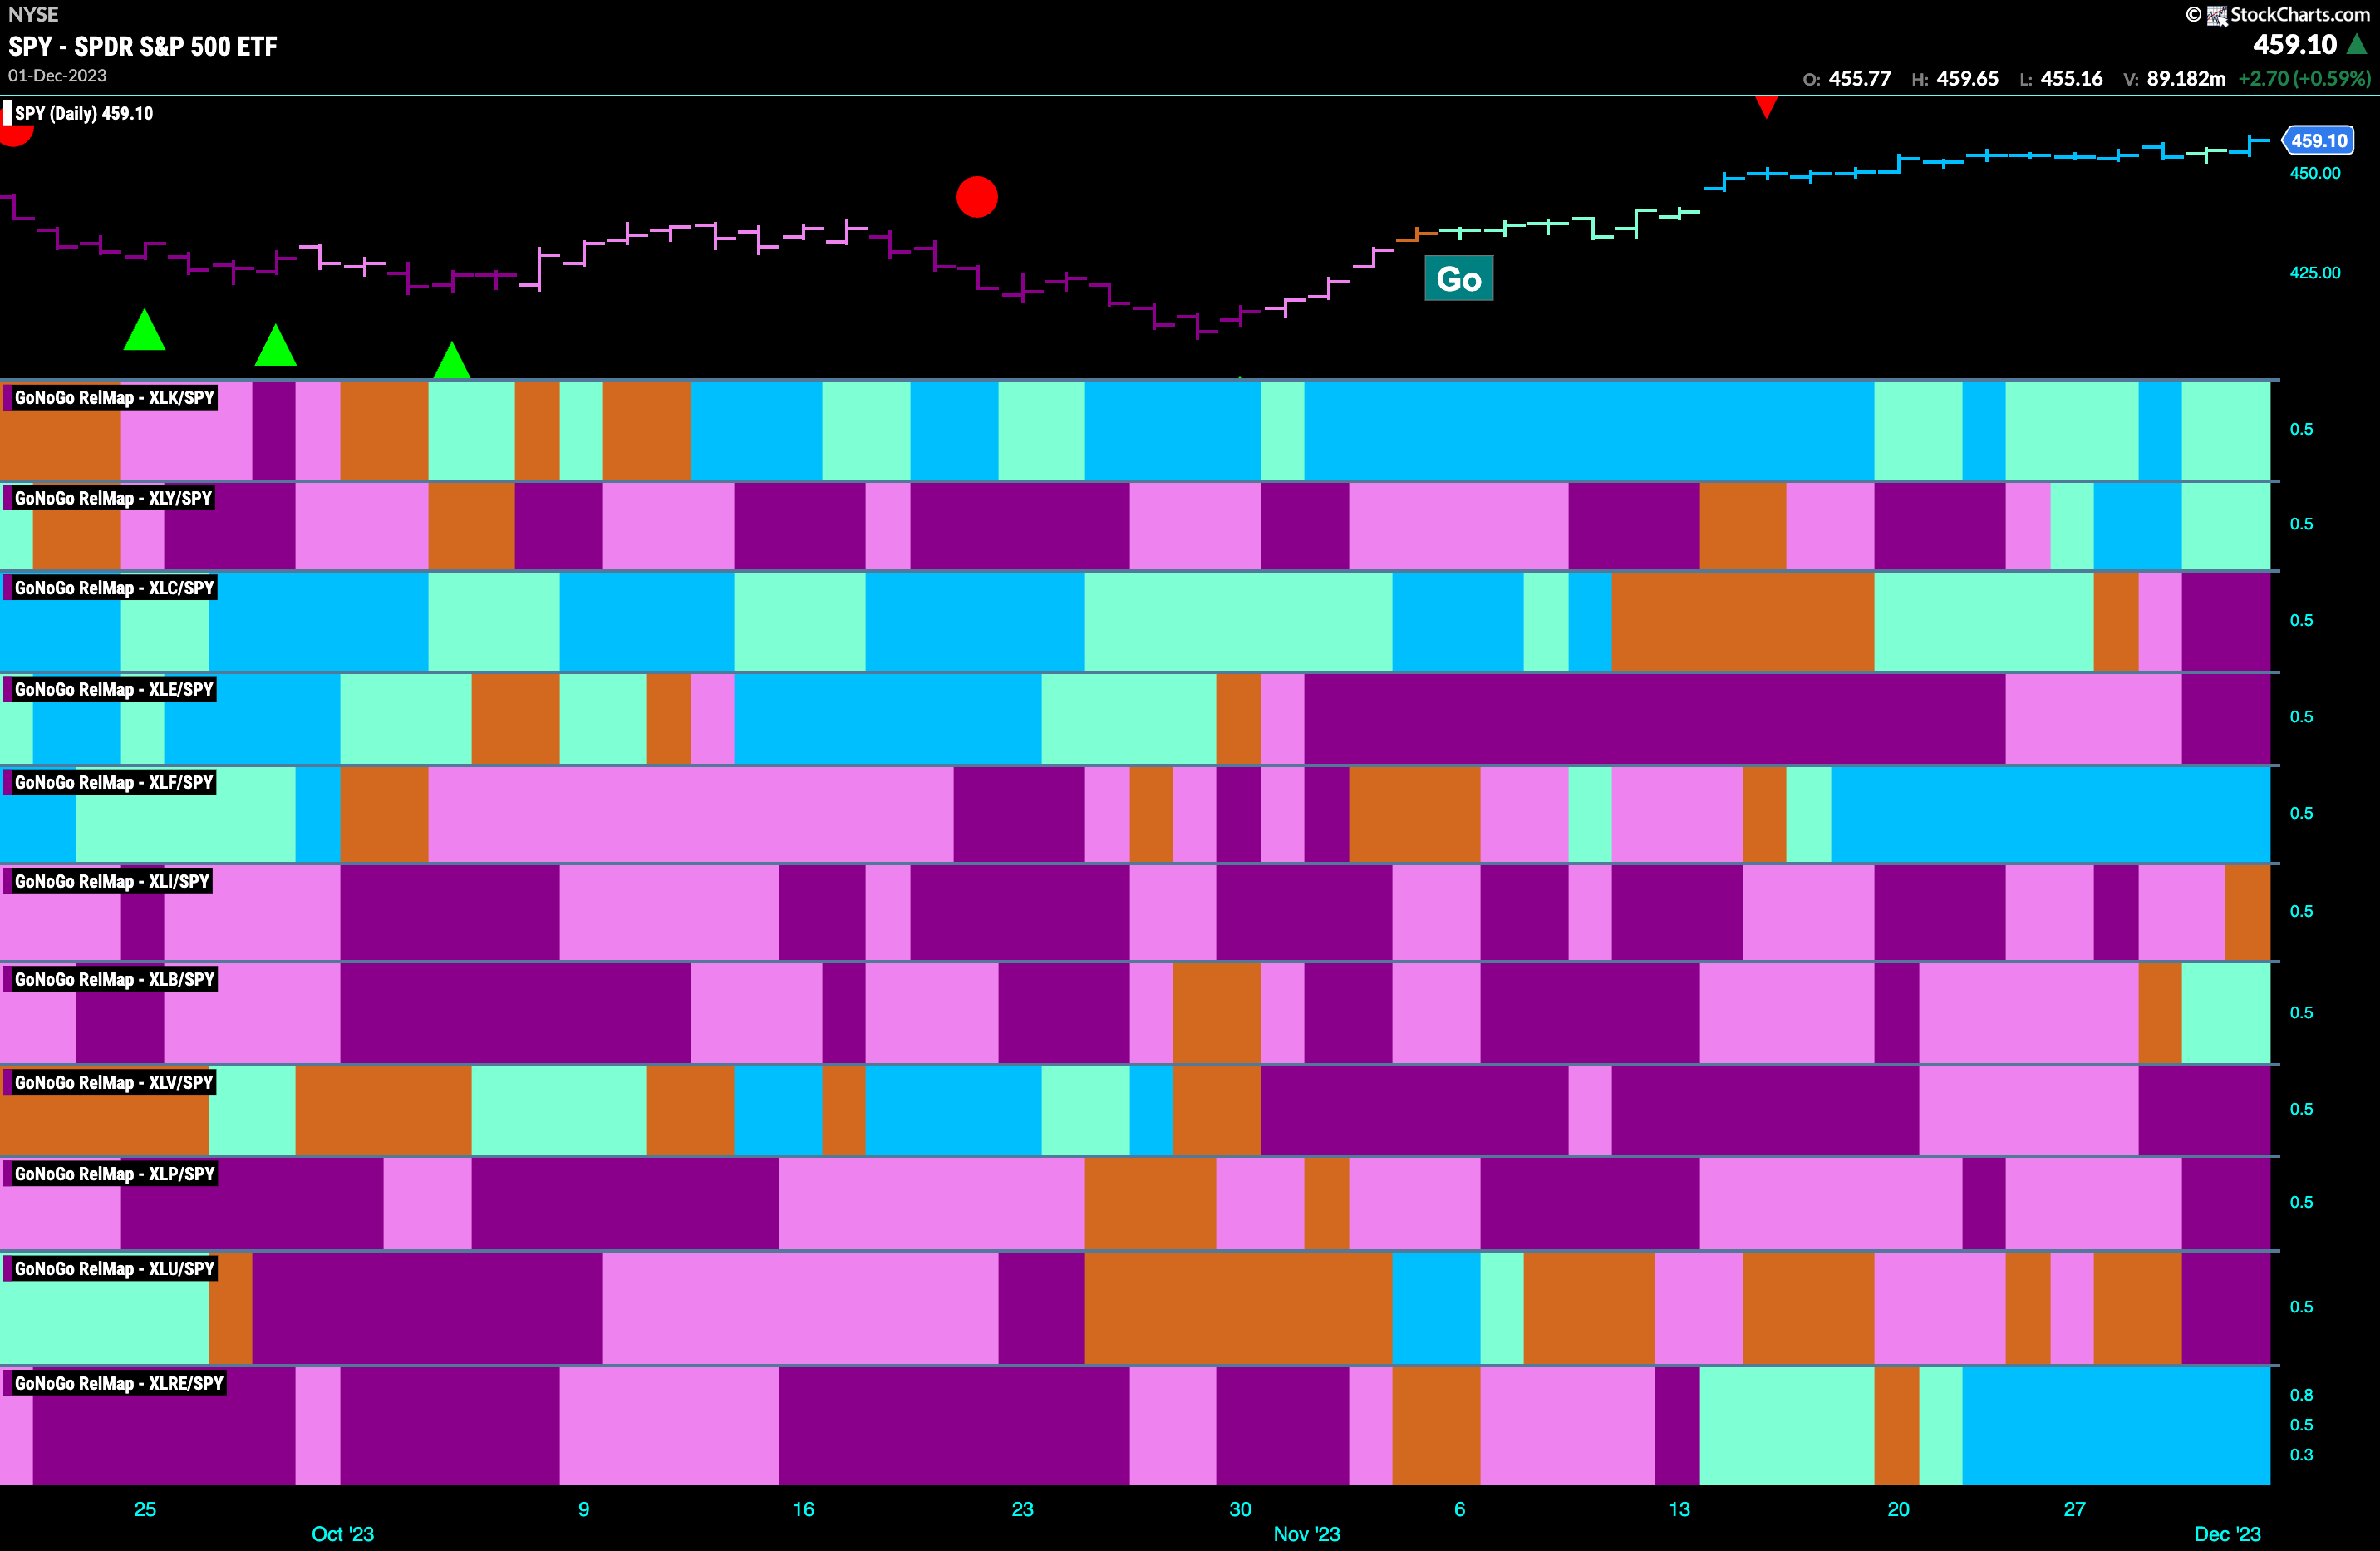
Below is the GoNoGo Sector RelMap. This GoNoGo RelMap applies the GoNoGo Trend to the relative strength ratios of the sectors to the base index. Looking at this map, we can quickly see where the relative outperformance is coming from as well as which sectors are lagging on a relative basis. 5 sectors are outperforming the base index this week. $XLK, $XLY $XLF, $XLB, and $XLRE, are painting “Go” bars.
Materials Race Higher
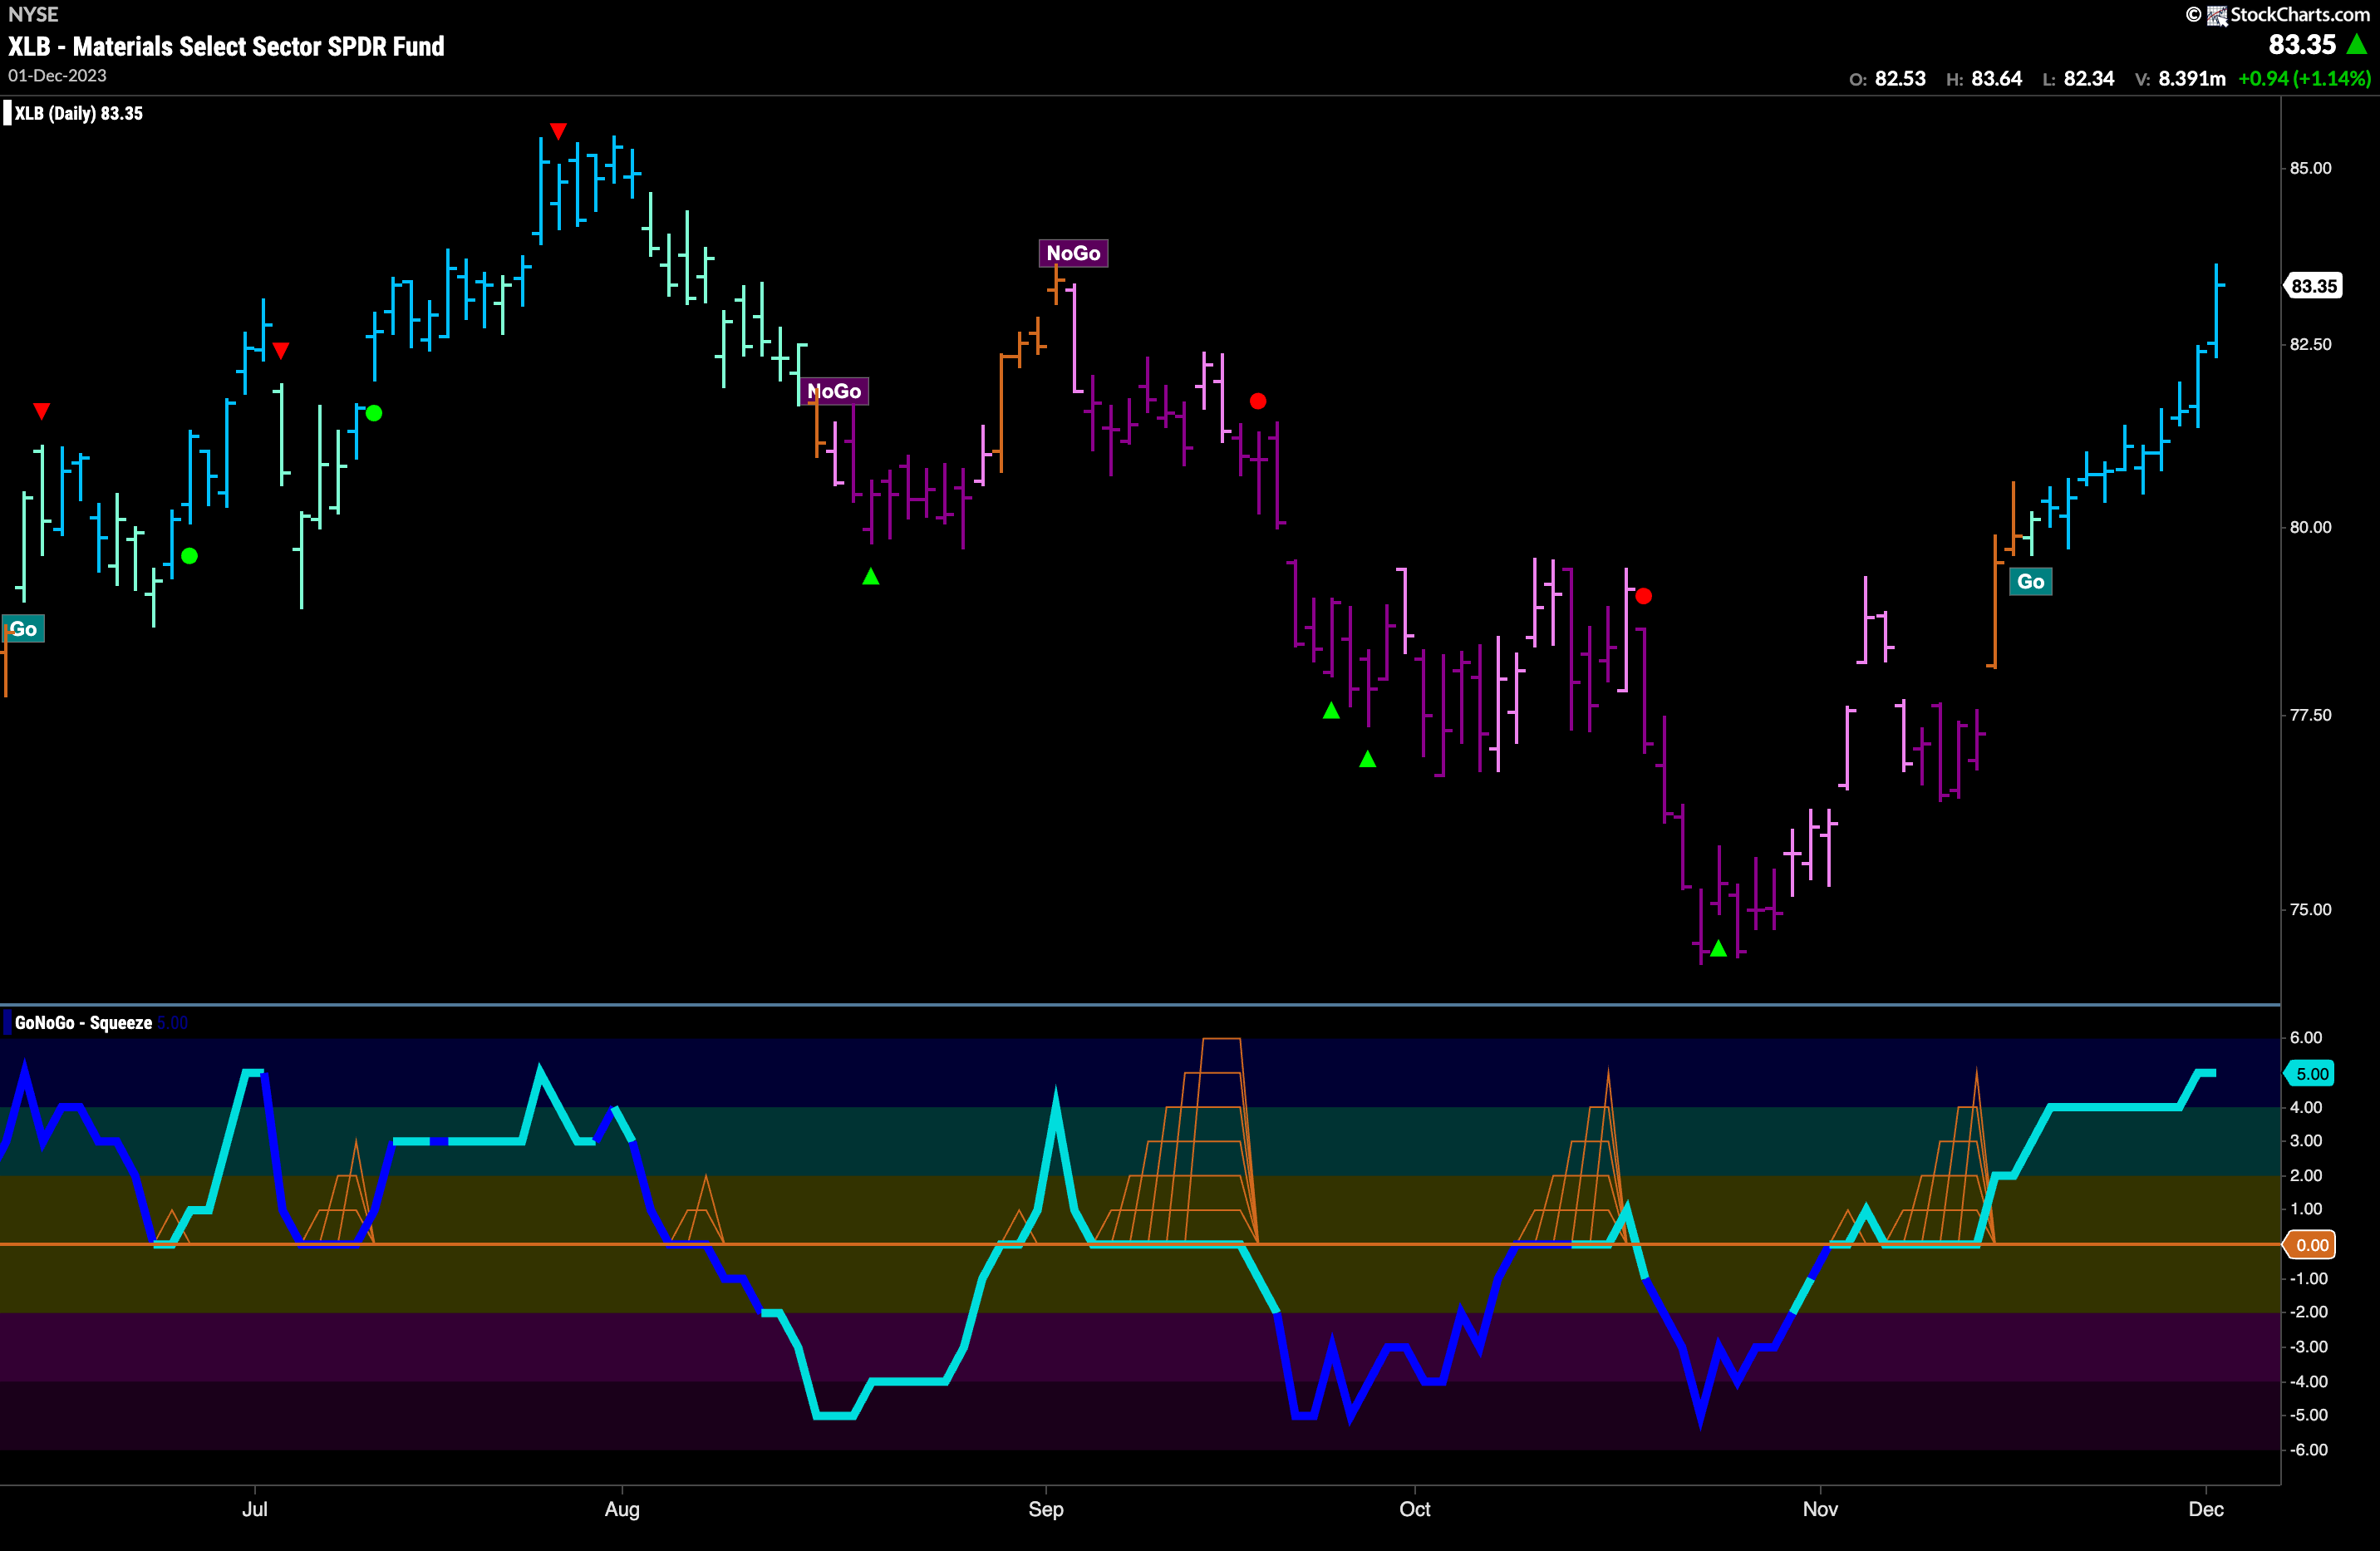
The GoNoGo Sector RelMap above shows that the materials sector is starting to outperform the larger index as it paints its first “Go” bars for some time. The chart below shows the daily prices of $XLB with the full suite of GoNoGo Charts applied. We see that as price rallied off the lows in November, GoNoGo Oscillator rose to test the zero line from below. As it rode that level, causing a GoNoGo Squeeze to build, GoNoGo Trend was able to paint amber “Go Fish” bars showing the uncertainty surrounding the “NoGo” trend. The oscillator jumped out of the GoNoGo Squeeze into positive territory and then GoNoGo Trend recognized the new “Go” trend. With a string of blue “Go” bars and the Oscillator in overbought territory the trend looks strong.
Materials Sub Group RelMap
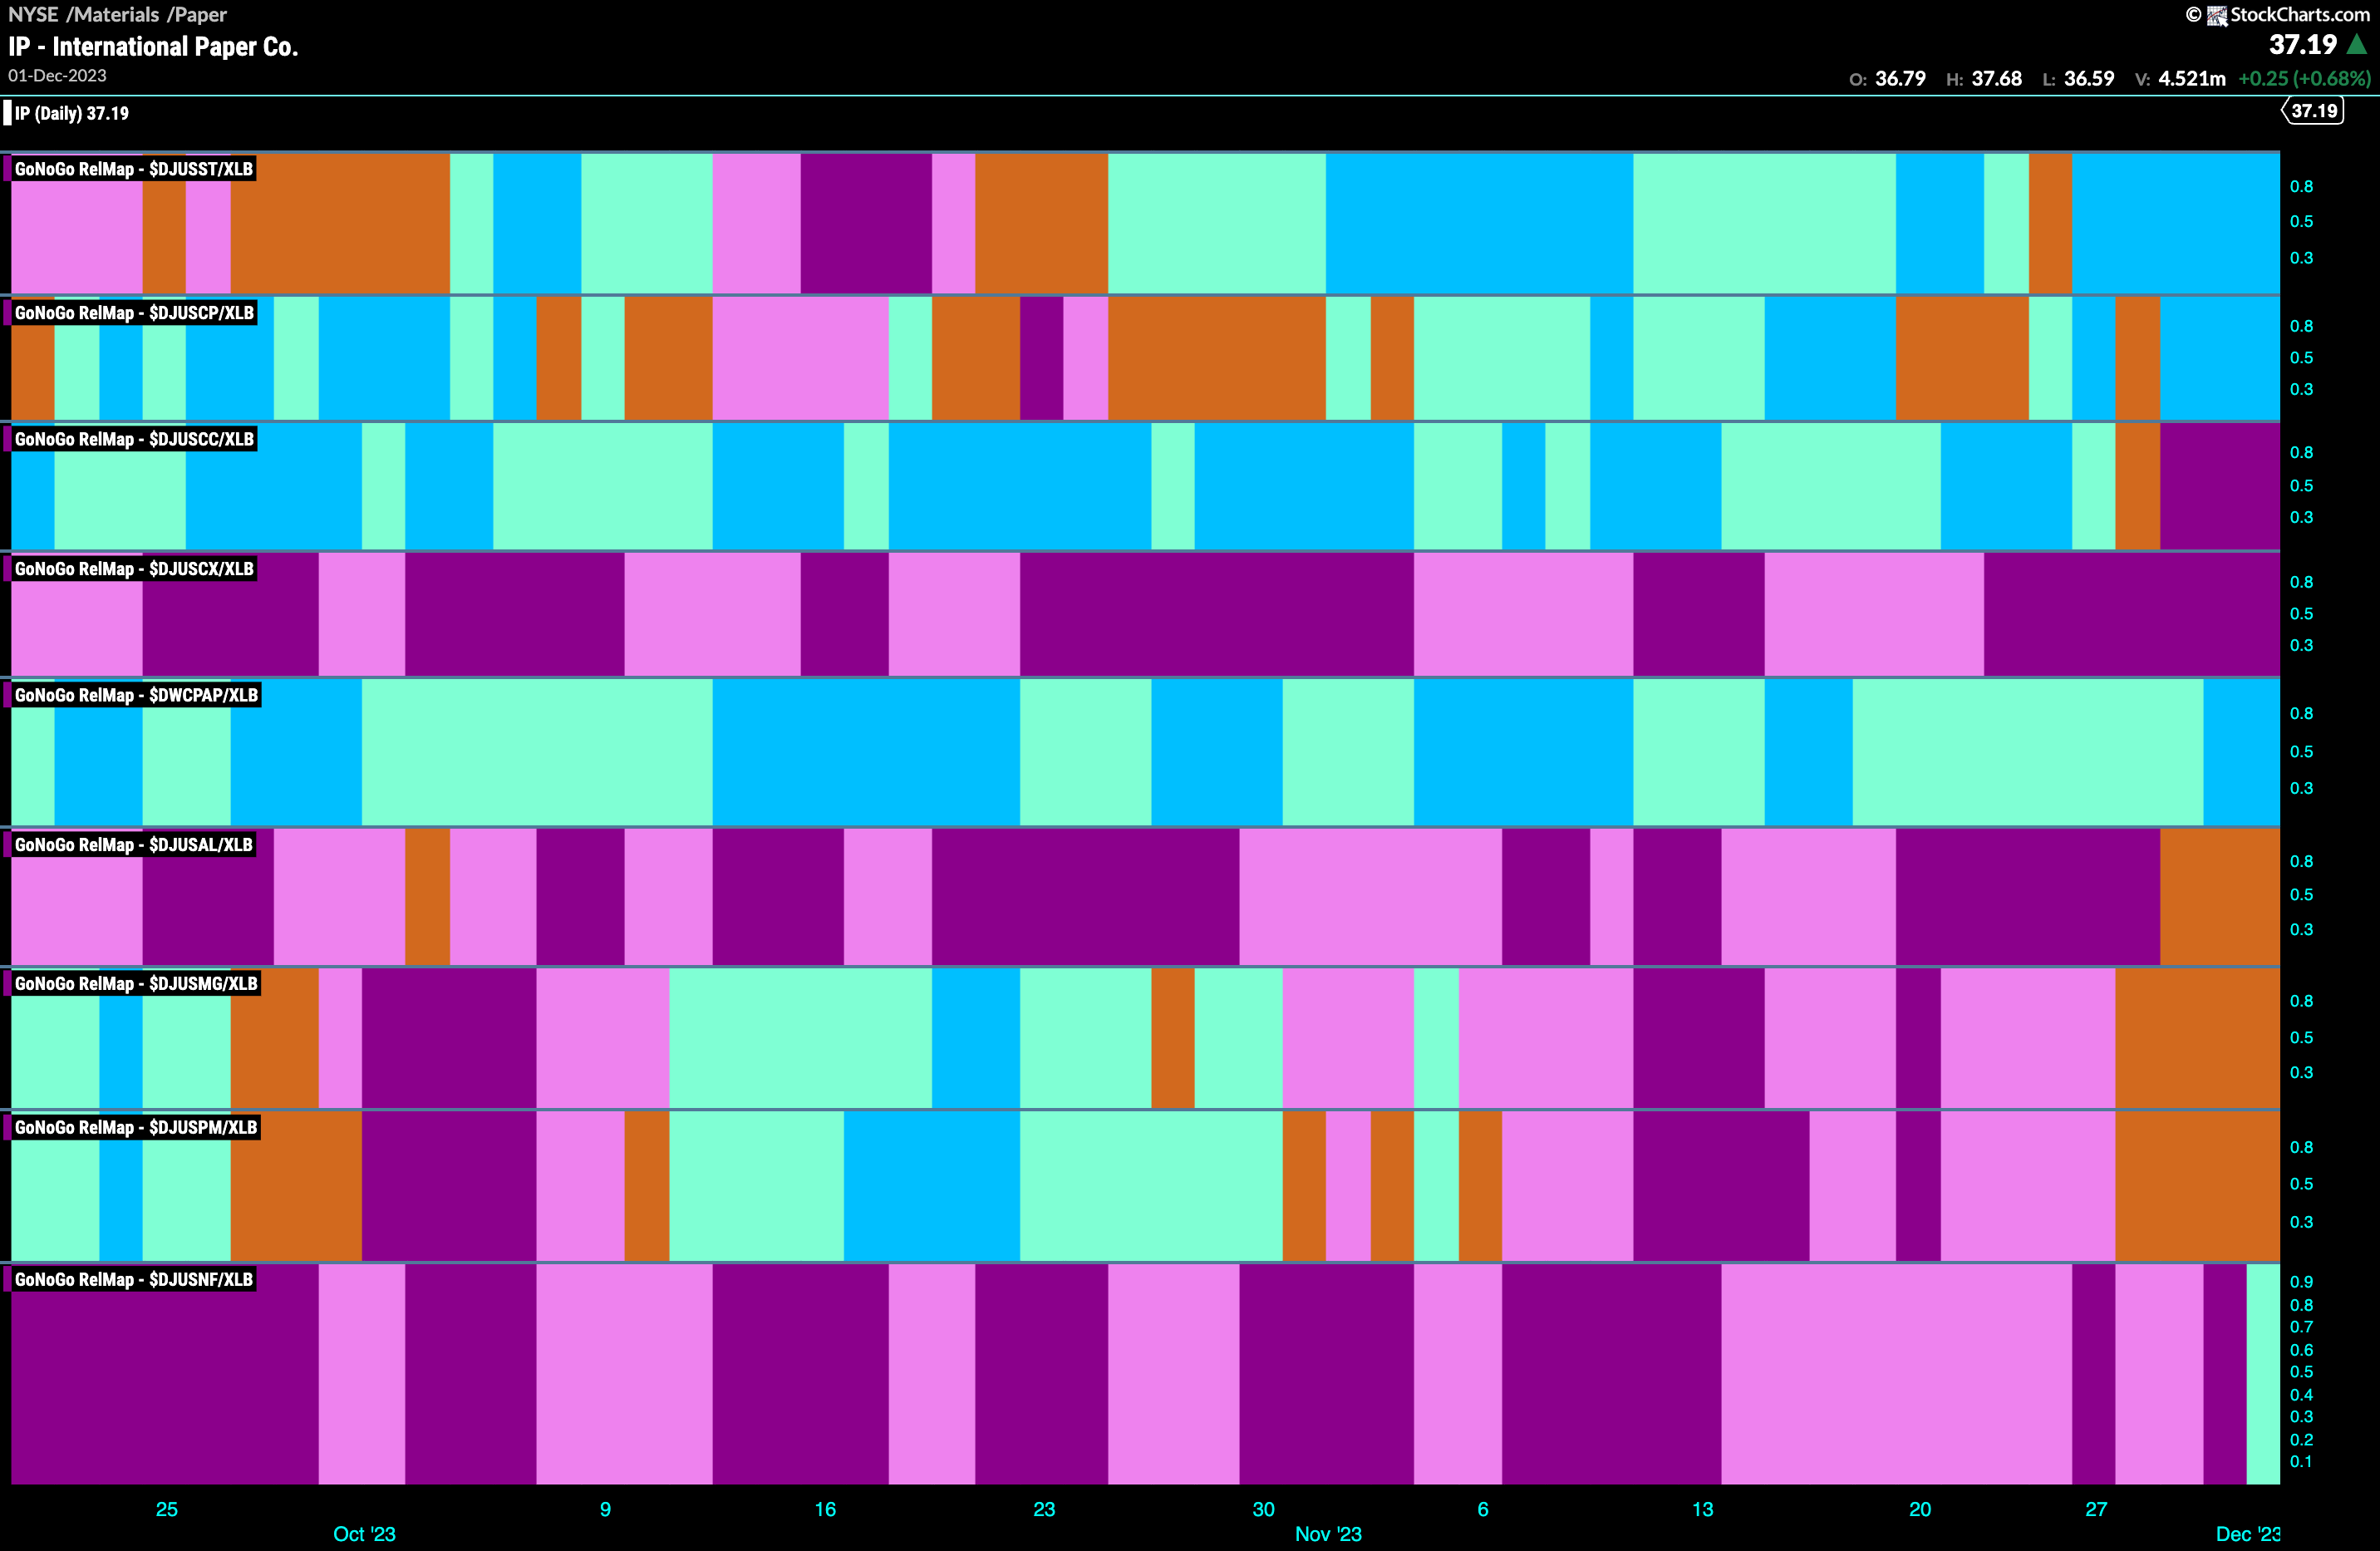
We saw in the above GoNoGo Sector RelMap that the materials sector has joined the fray as it outperforms the larger index. The GoNoGo Sub Group RelMap below shows us where that outperformance is coming from. There are a few industry groups that are driving the sector forward. Non ferrous metals (lowest panel) has very recently joined the party but if we look at the 5th panel we can see that it is the paper index that has been the most consistently strong performer here as it has painted relative “Go” bars throughout the time window of this chart.
International Paper Co. Breaks Higher
The chart below shows the weekly prices of $IP. We can see that last week’s price action saw price breakout of a 2 year down trend. This was highlighted by the “NoGo” trend. What is of note here is that as price tested the downward sloping trend line this last time GoNoGo Trend started to paint new colors, and the “NoGo” couldn’t hold giving way to several amber “Go Fish” and “Go” bars. GoNoGo Oscillator rode the zero line causing a Max GoNoGo Squeeze to build reflecting the tug of war at play as investors wrestled with the resistance from the trend line. GoNoGo Oscillator was able to break out of the Max Squeeze into positive territory on heavy volume and that gave price the push it needed to finally break through.
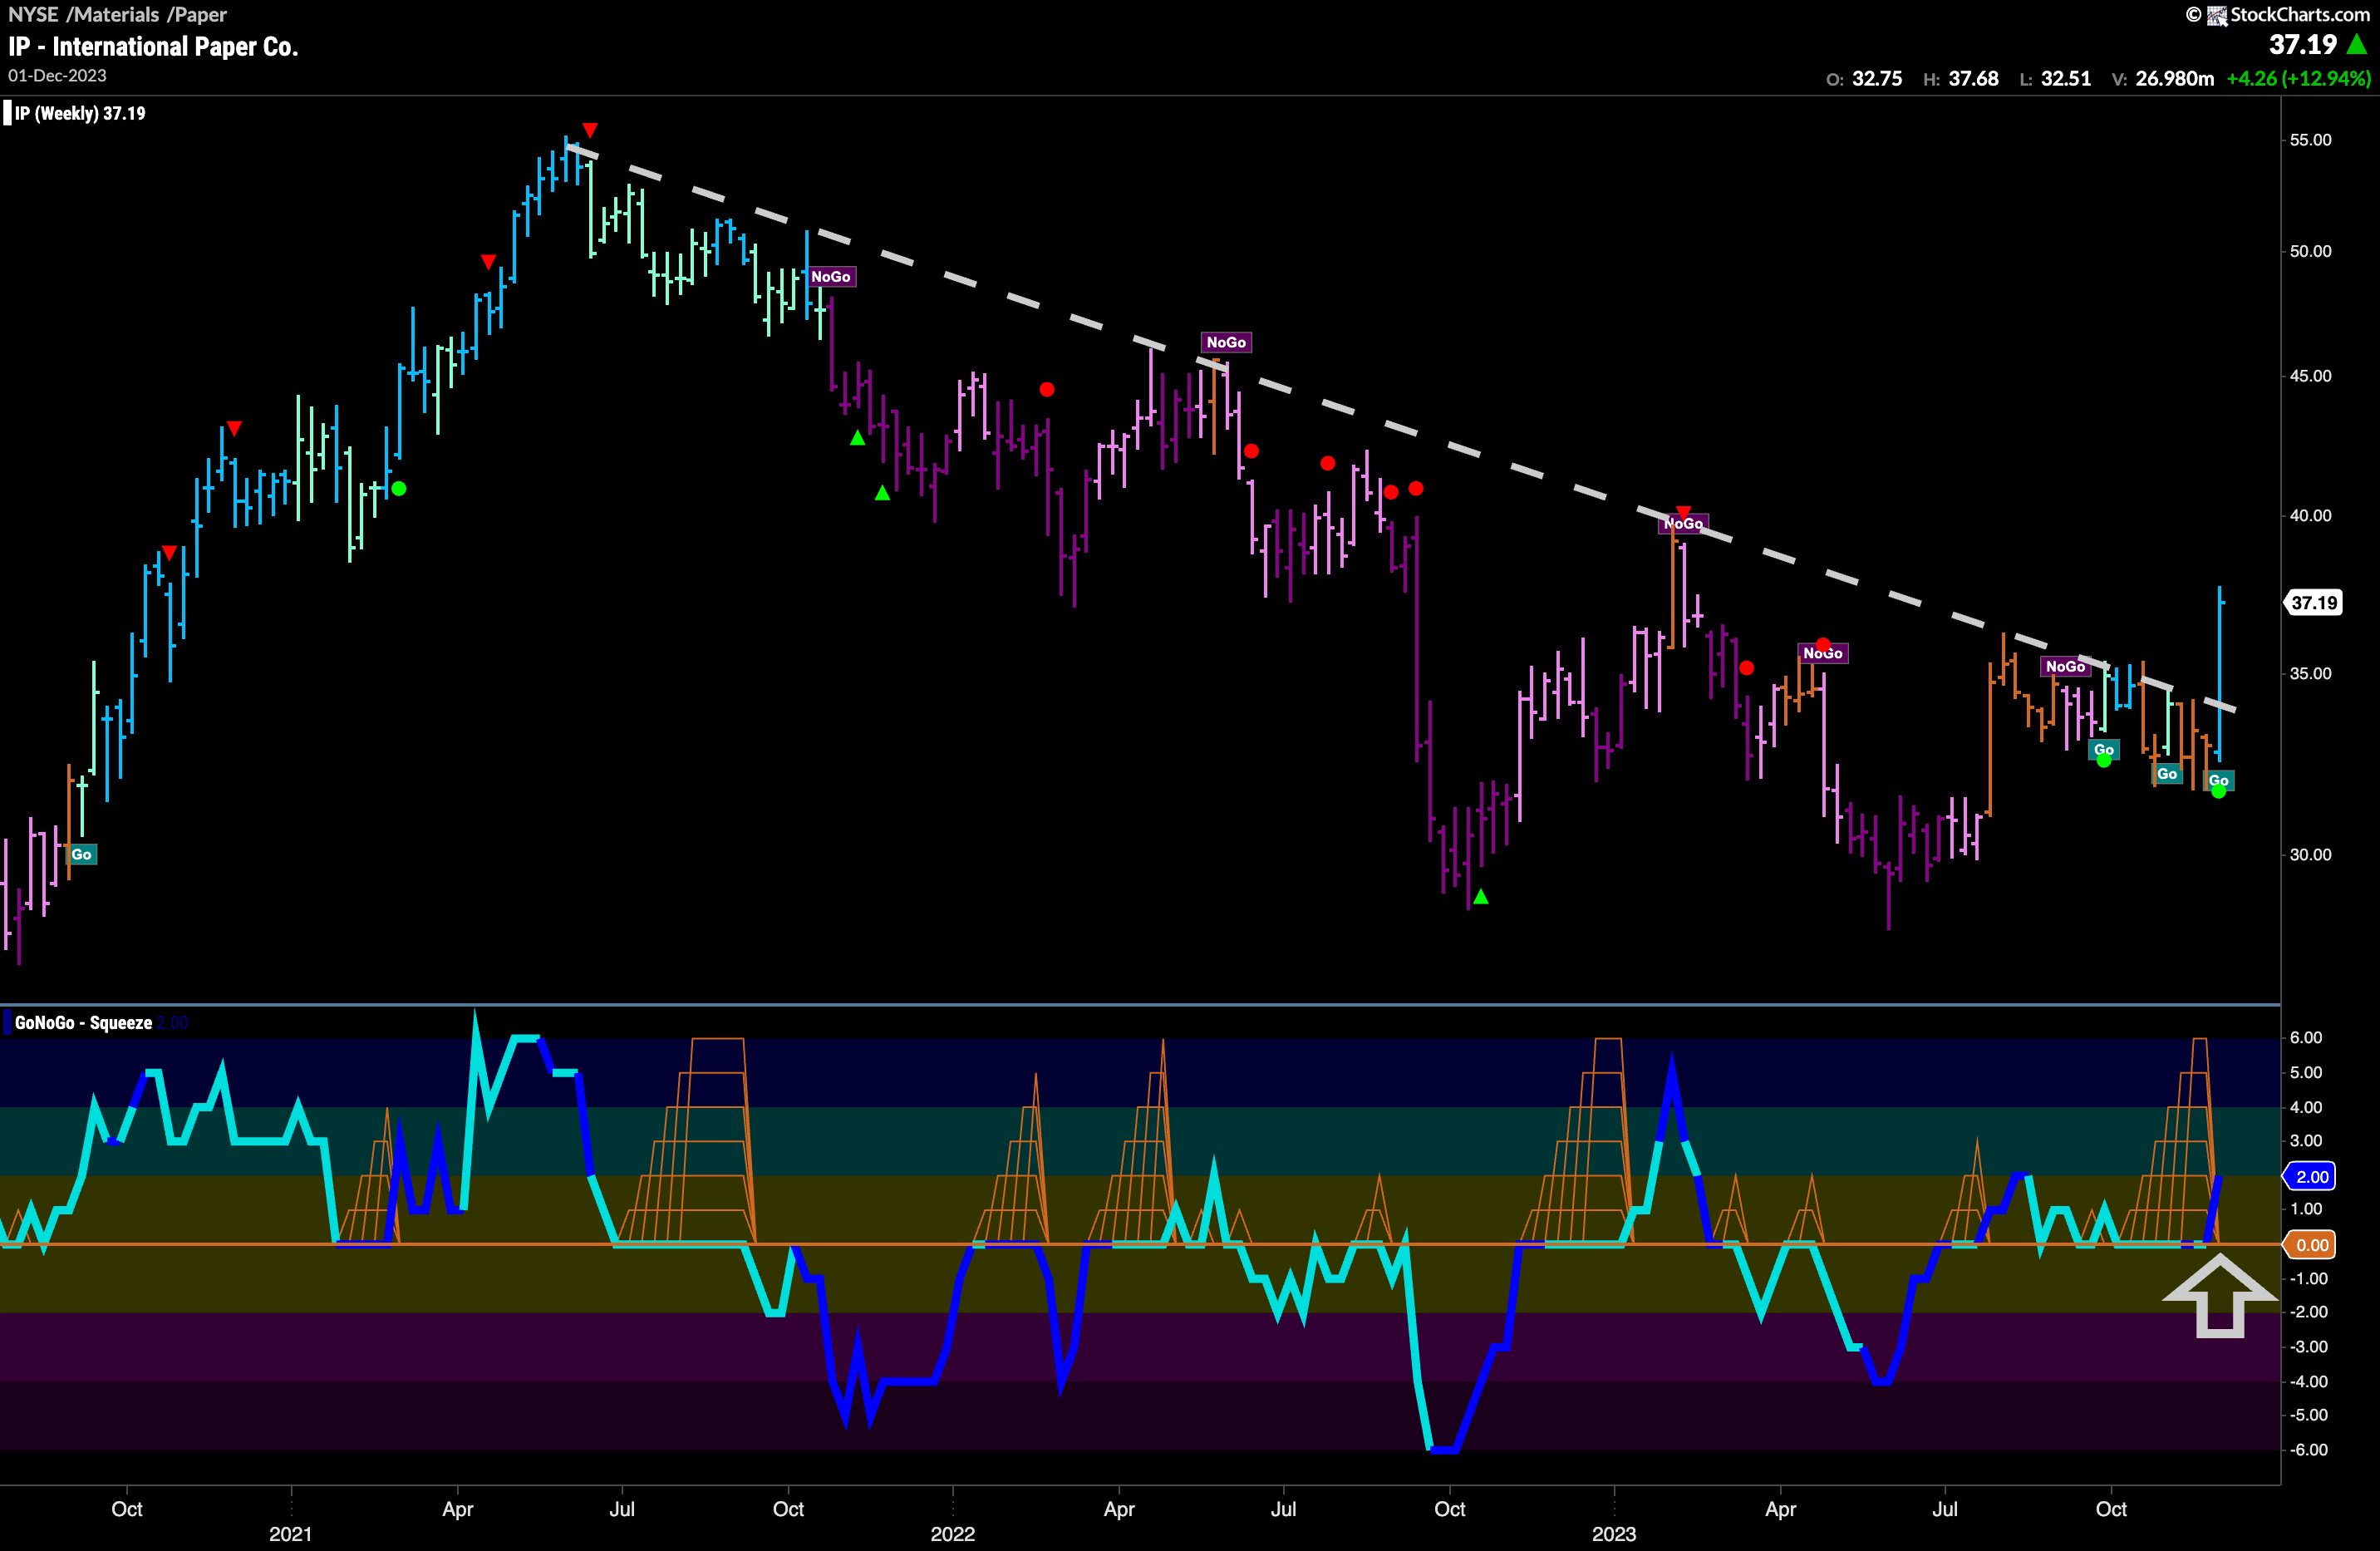
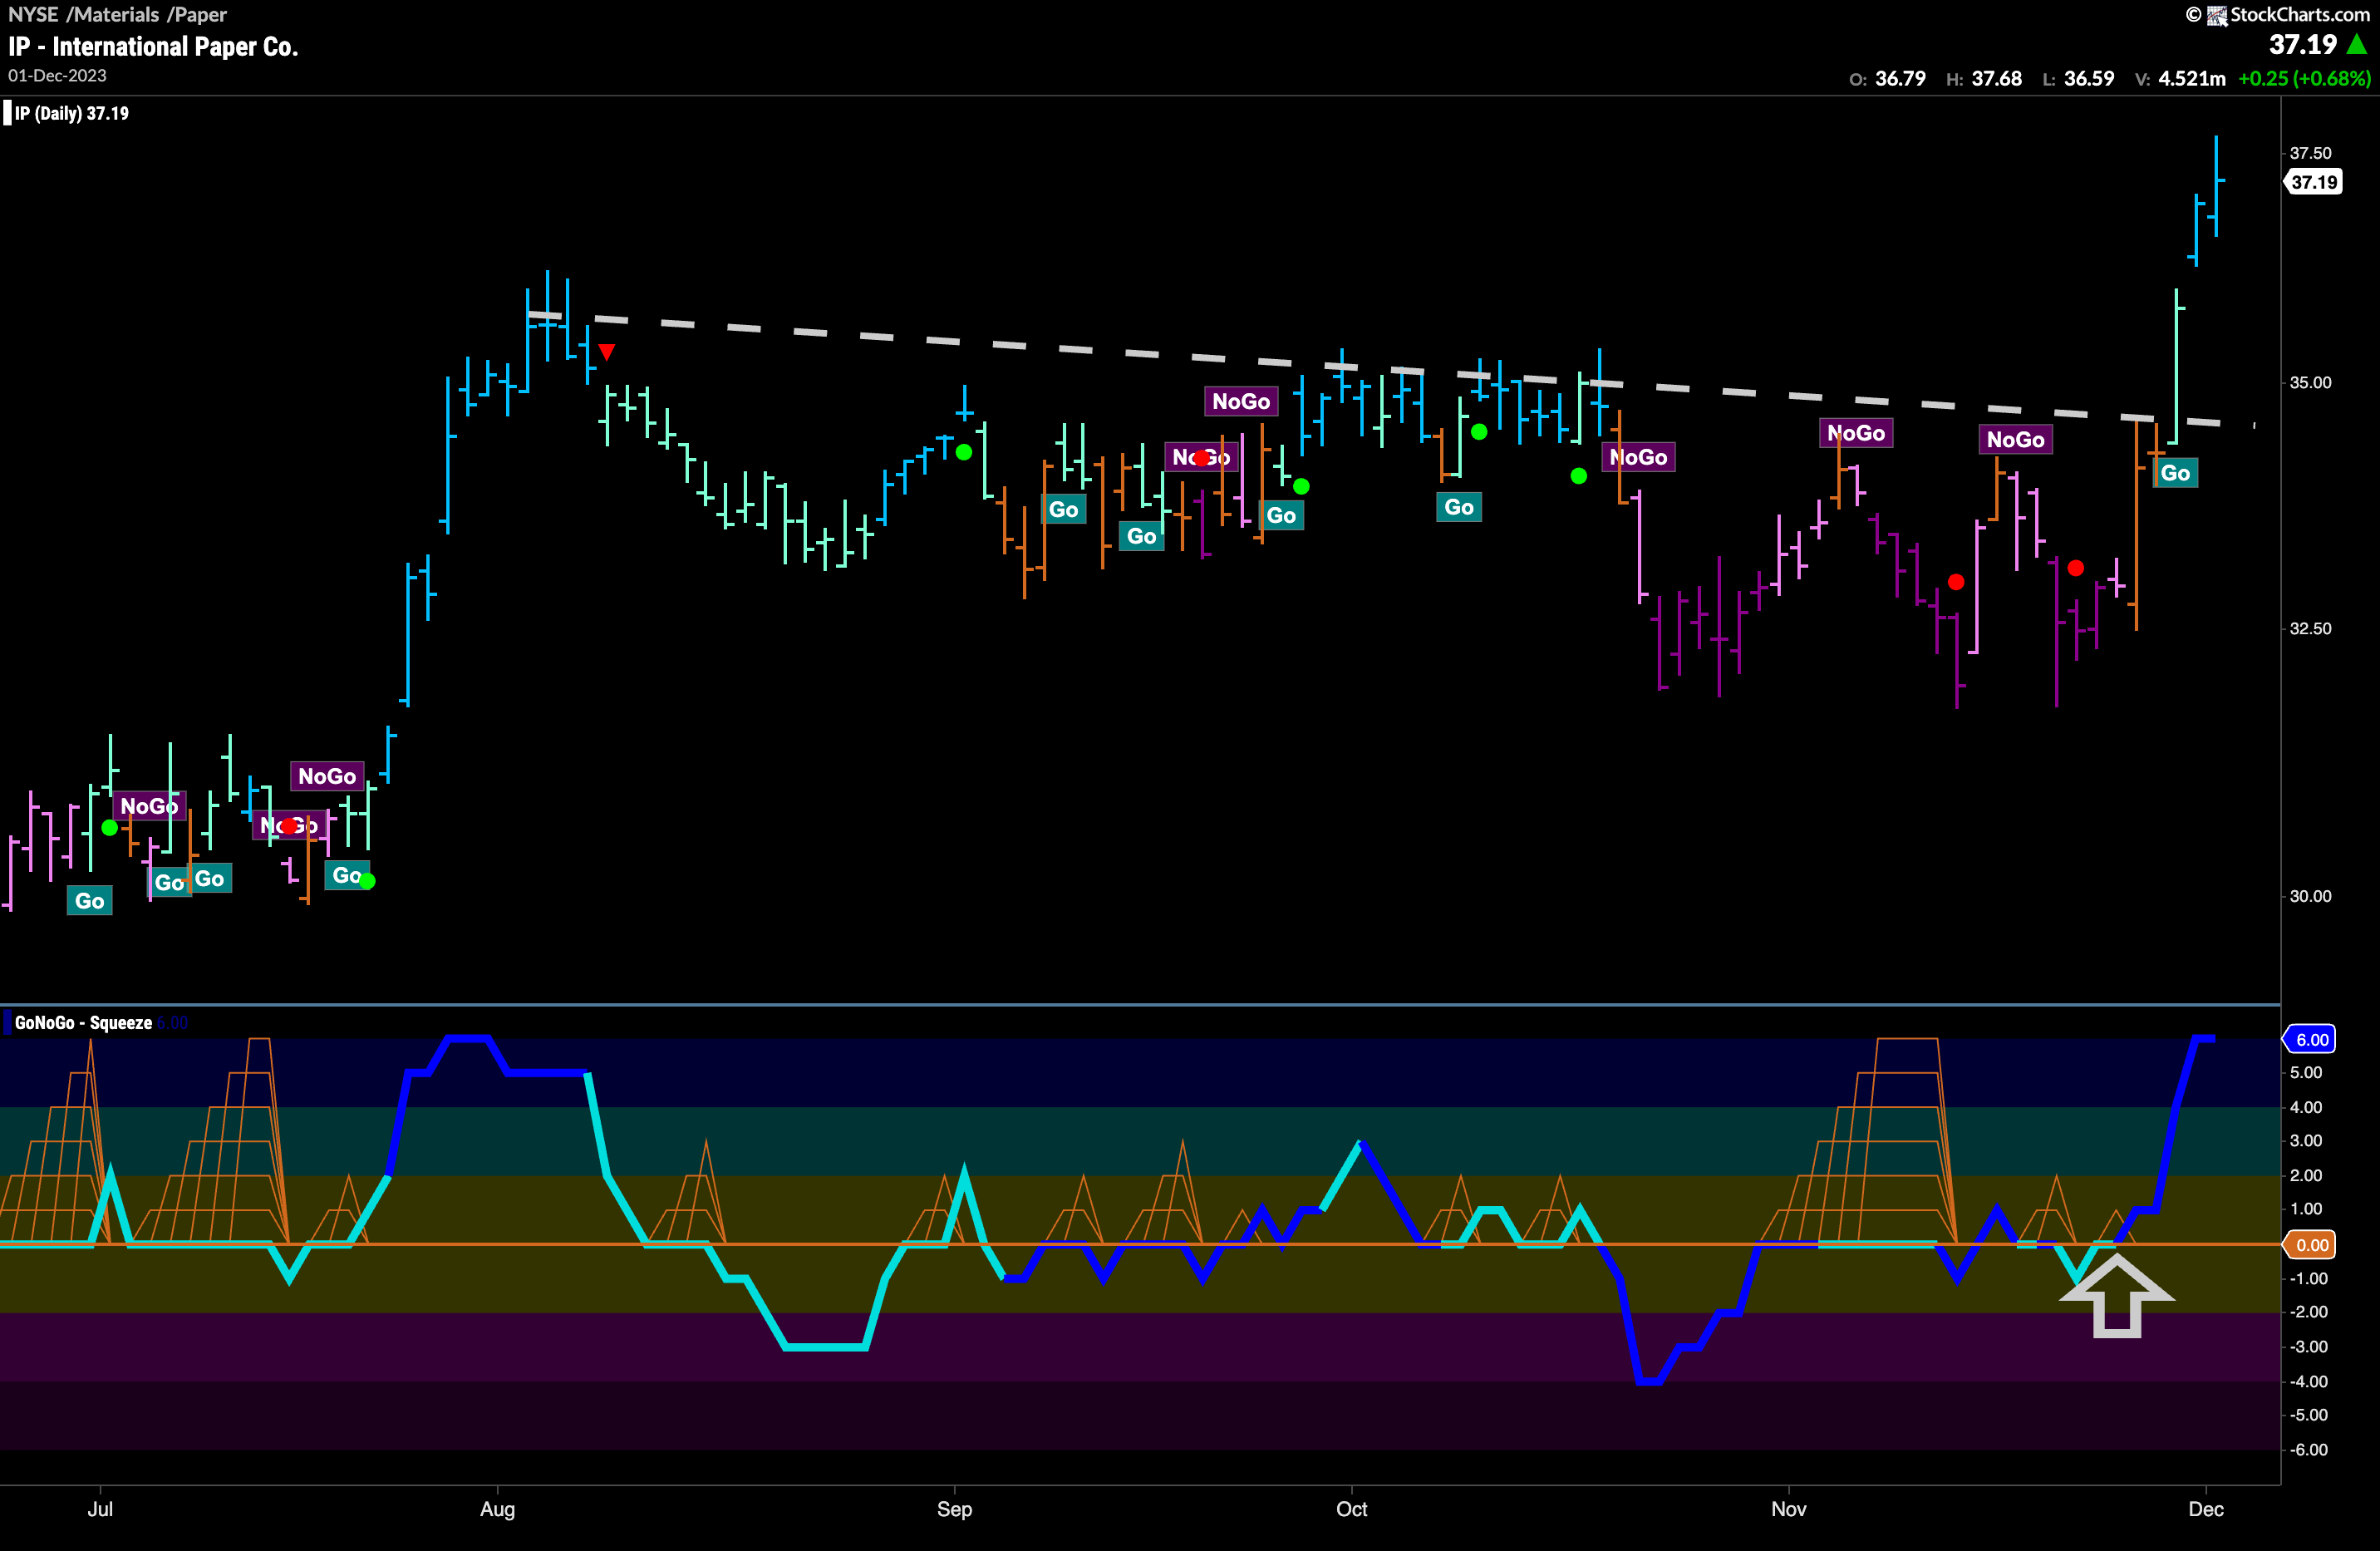
The daily chart shows how fast that move was. Again, we can see the market dynamics underneath the chart playing out on top of it. The Max GoNoGo Squeeze finally being broken into positive territory on heavy volume acted like a catapult sending price higher and the new “Go” trend was launched. We will watch now if price can consolidate at these levels. From the weekly chart we looked at prior, we can see that this may be only the beginning of a longer term move.
