Good morning and welcome to this week’s Flight Path. Let’s take a look at the GoNoGo Asset map below. Equities continued to struggle this week and fell away sharply to paint strong purple “NoGo” bars. Treasury bond prices saw the “NoGo” falter as the week ends with an amber “Go Fish” bar. Commodities saw the “NoGo” strengthen and the dollar remained in its “Go” trend.
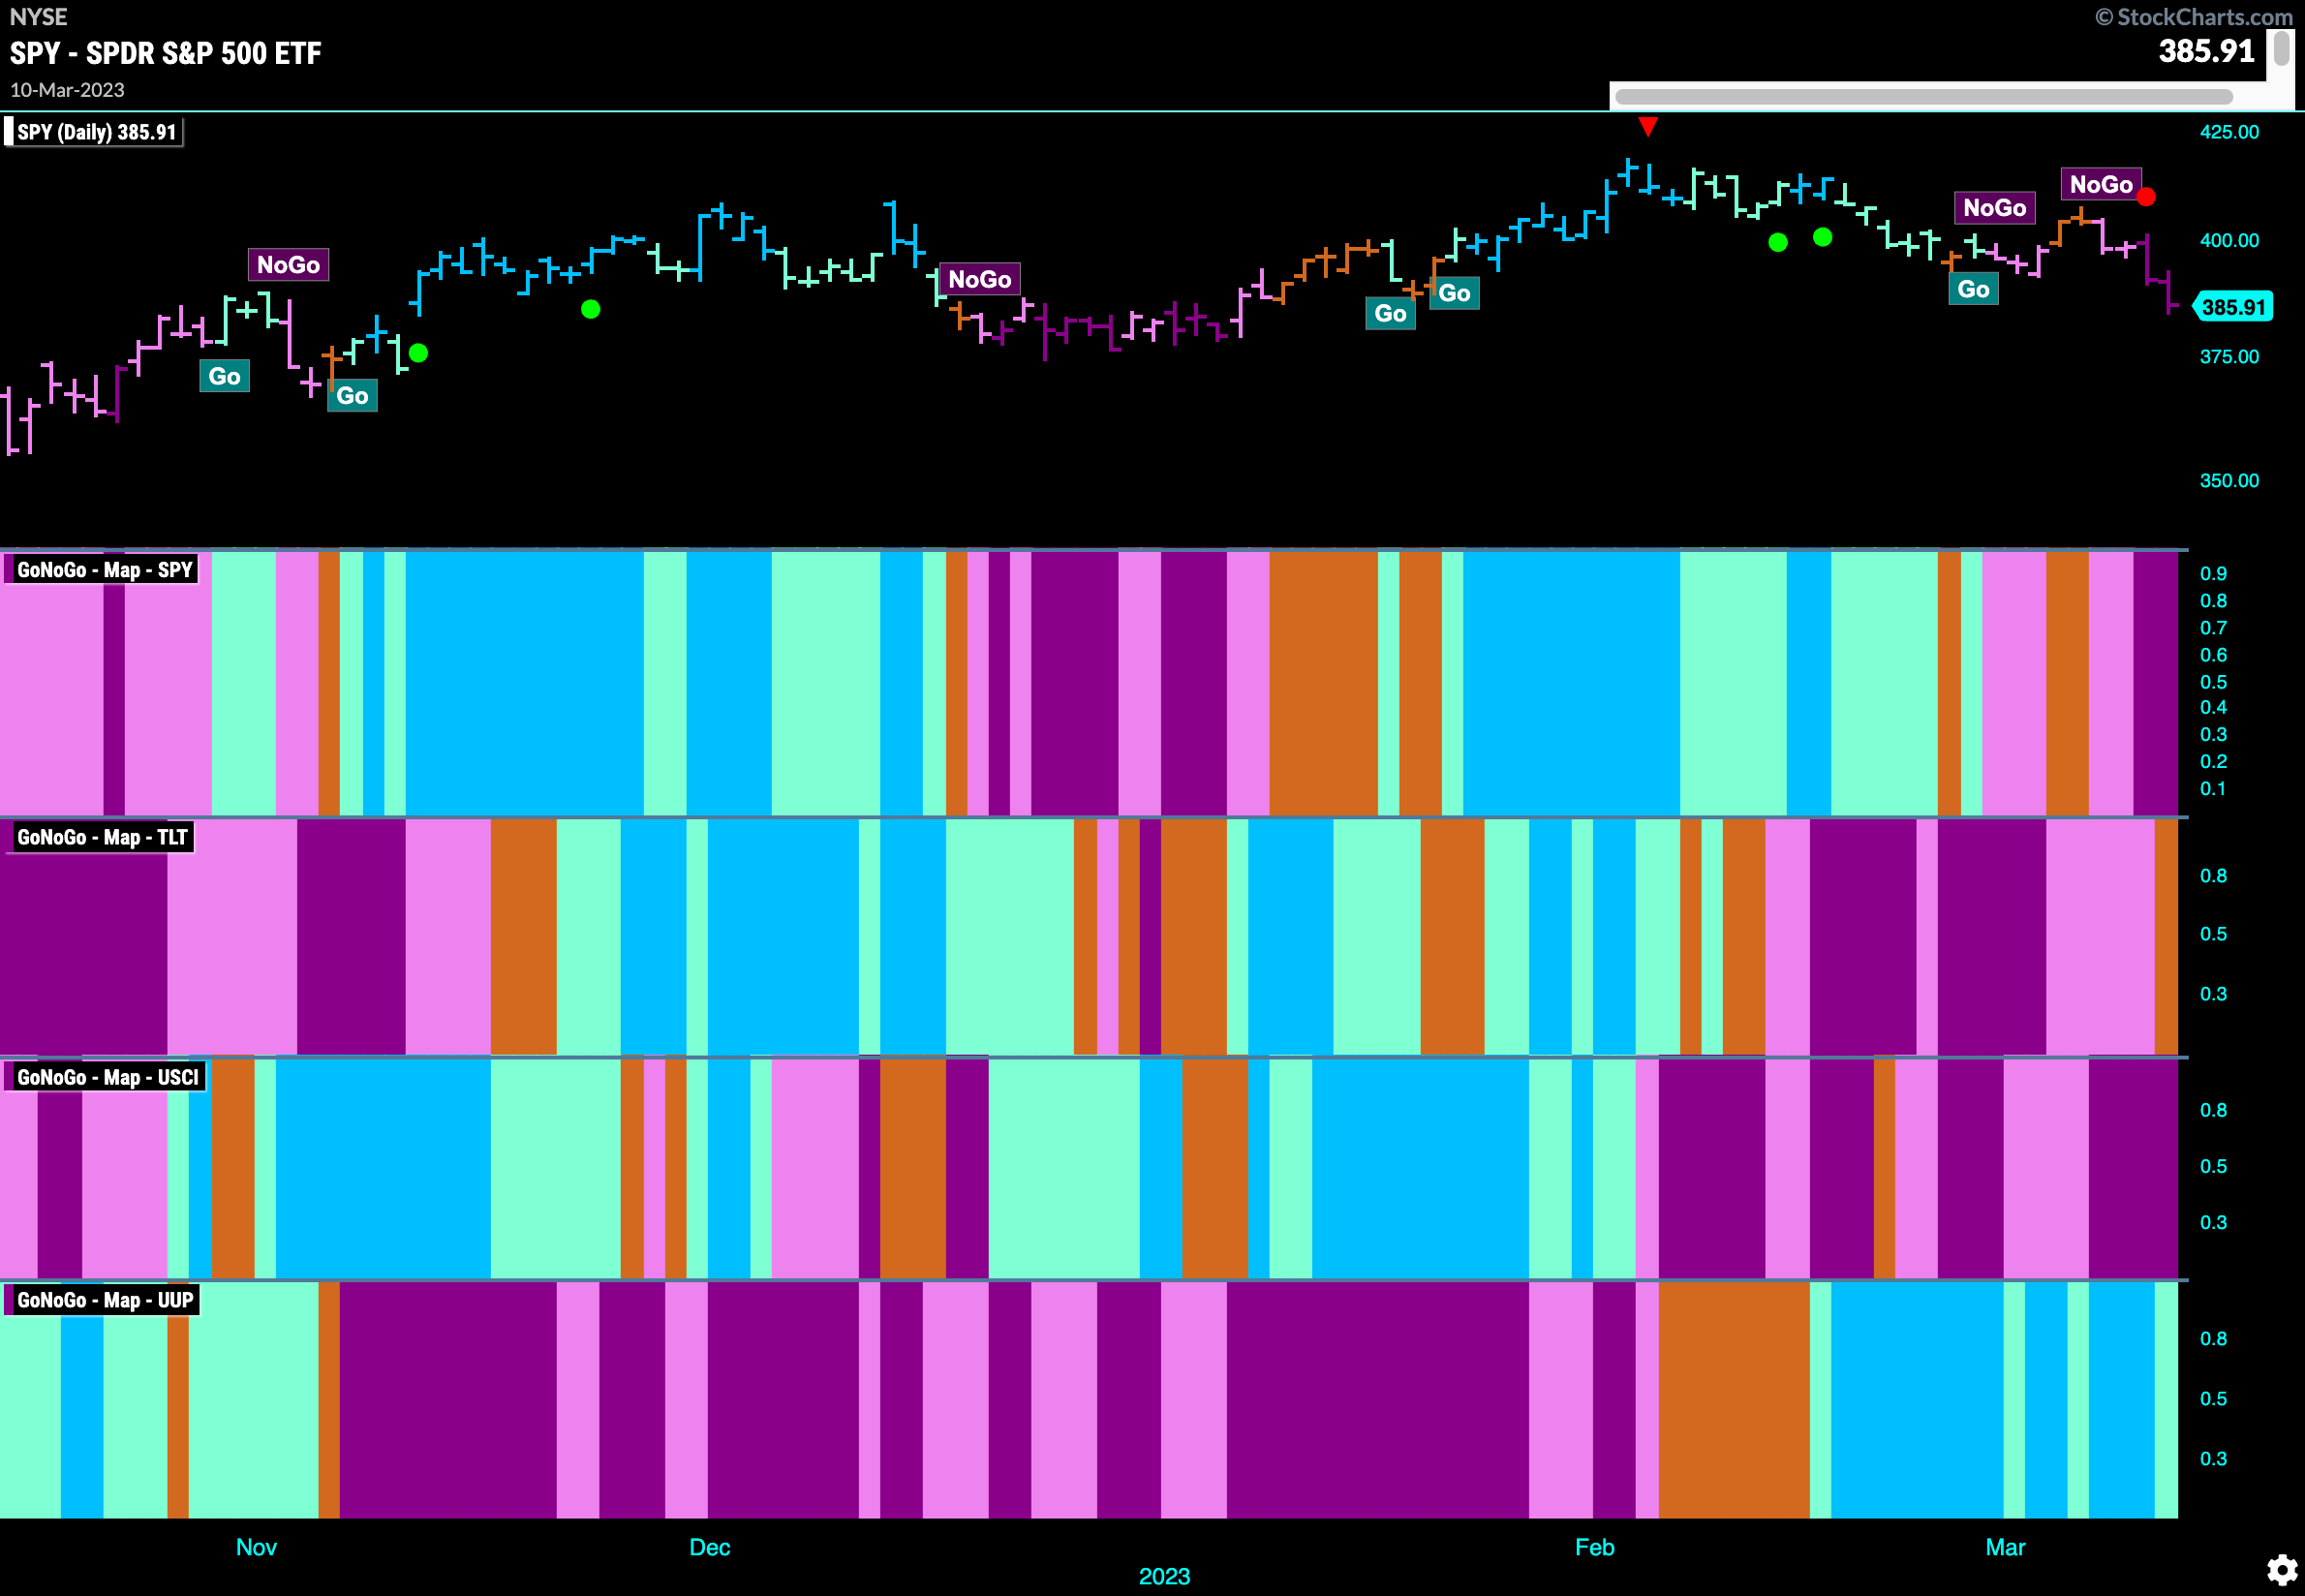
After Attempting to Go Higher Equities Plummet
What a difference a week makes. Monday saw equities in an amber “Go Fish” bar as price tried to get back to “Go’ colors. Importantly, GoNoGo Oscillator never got back above the zero line and after testing it from below was rejected on heavy volume. This confirmed the quick move back to a “NoGo” trend and now we see strong purple bars as price hits a new short term low. 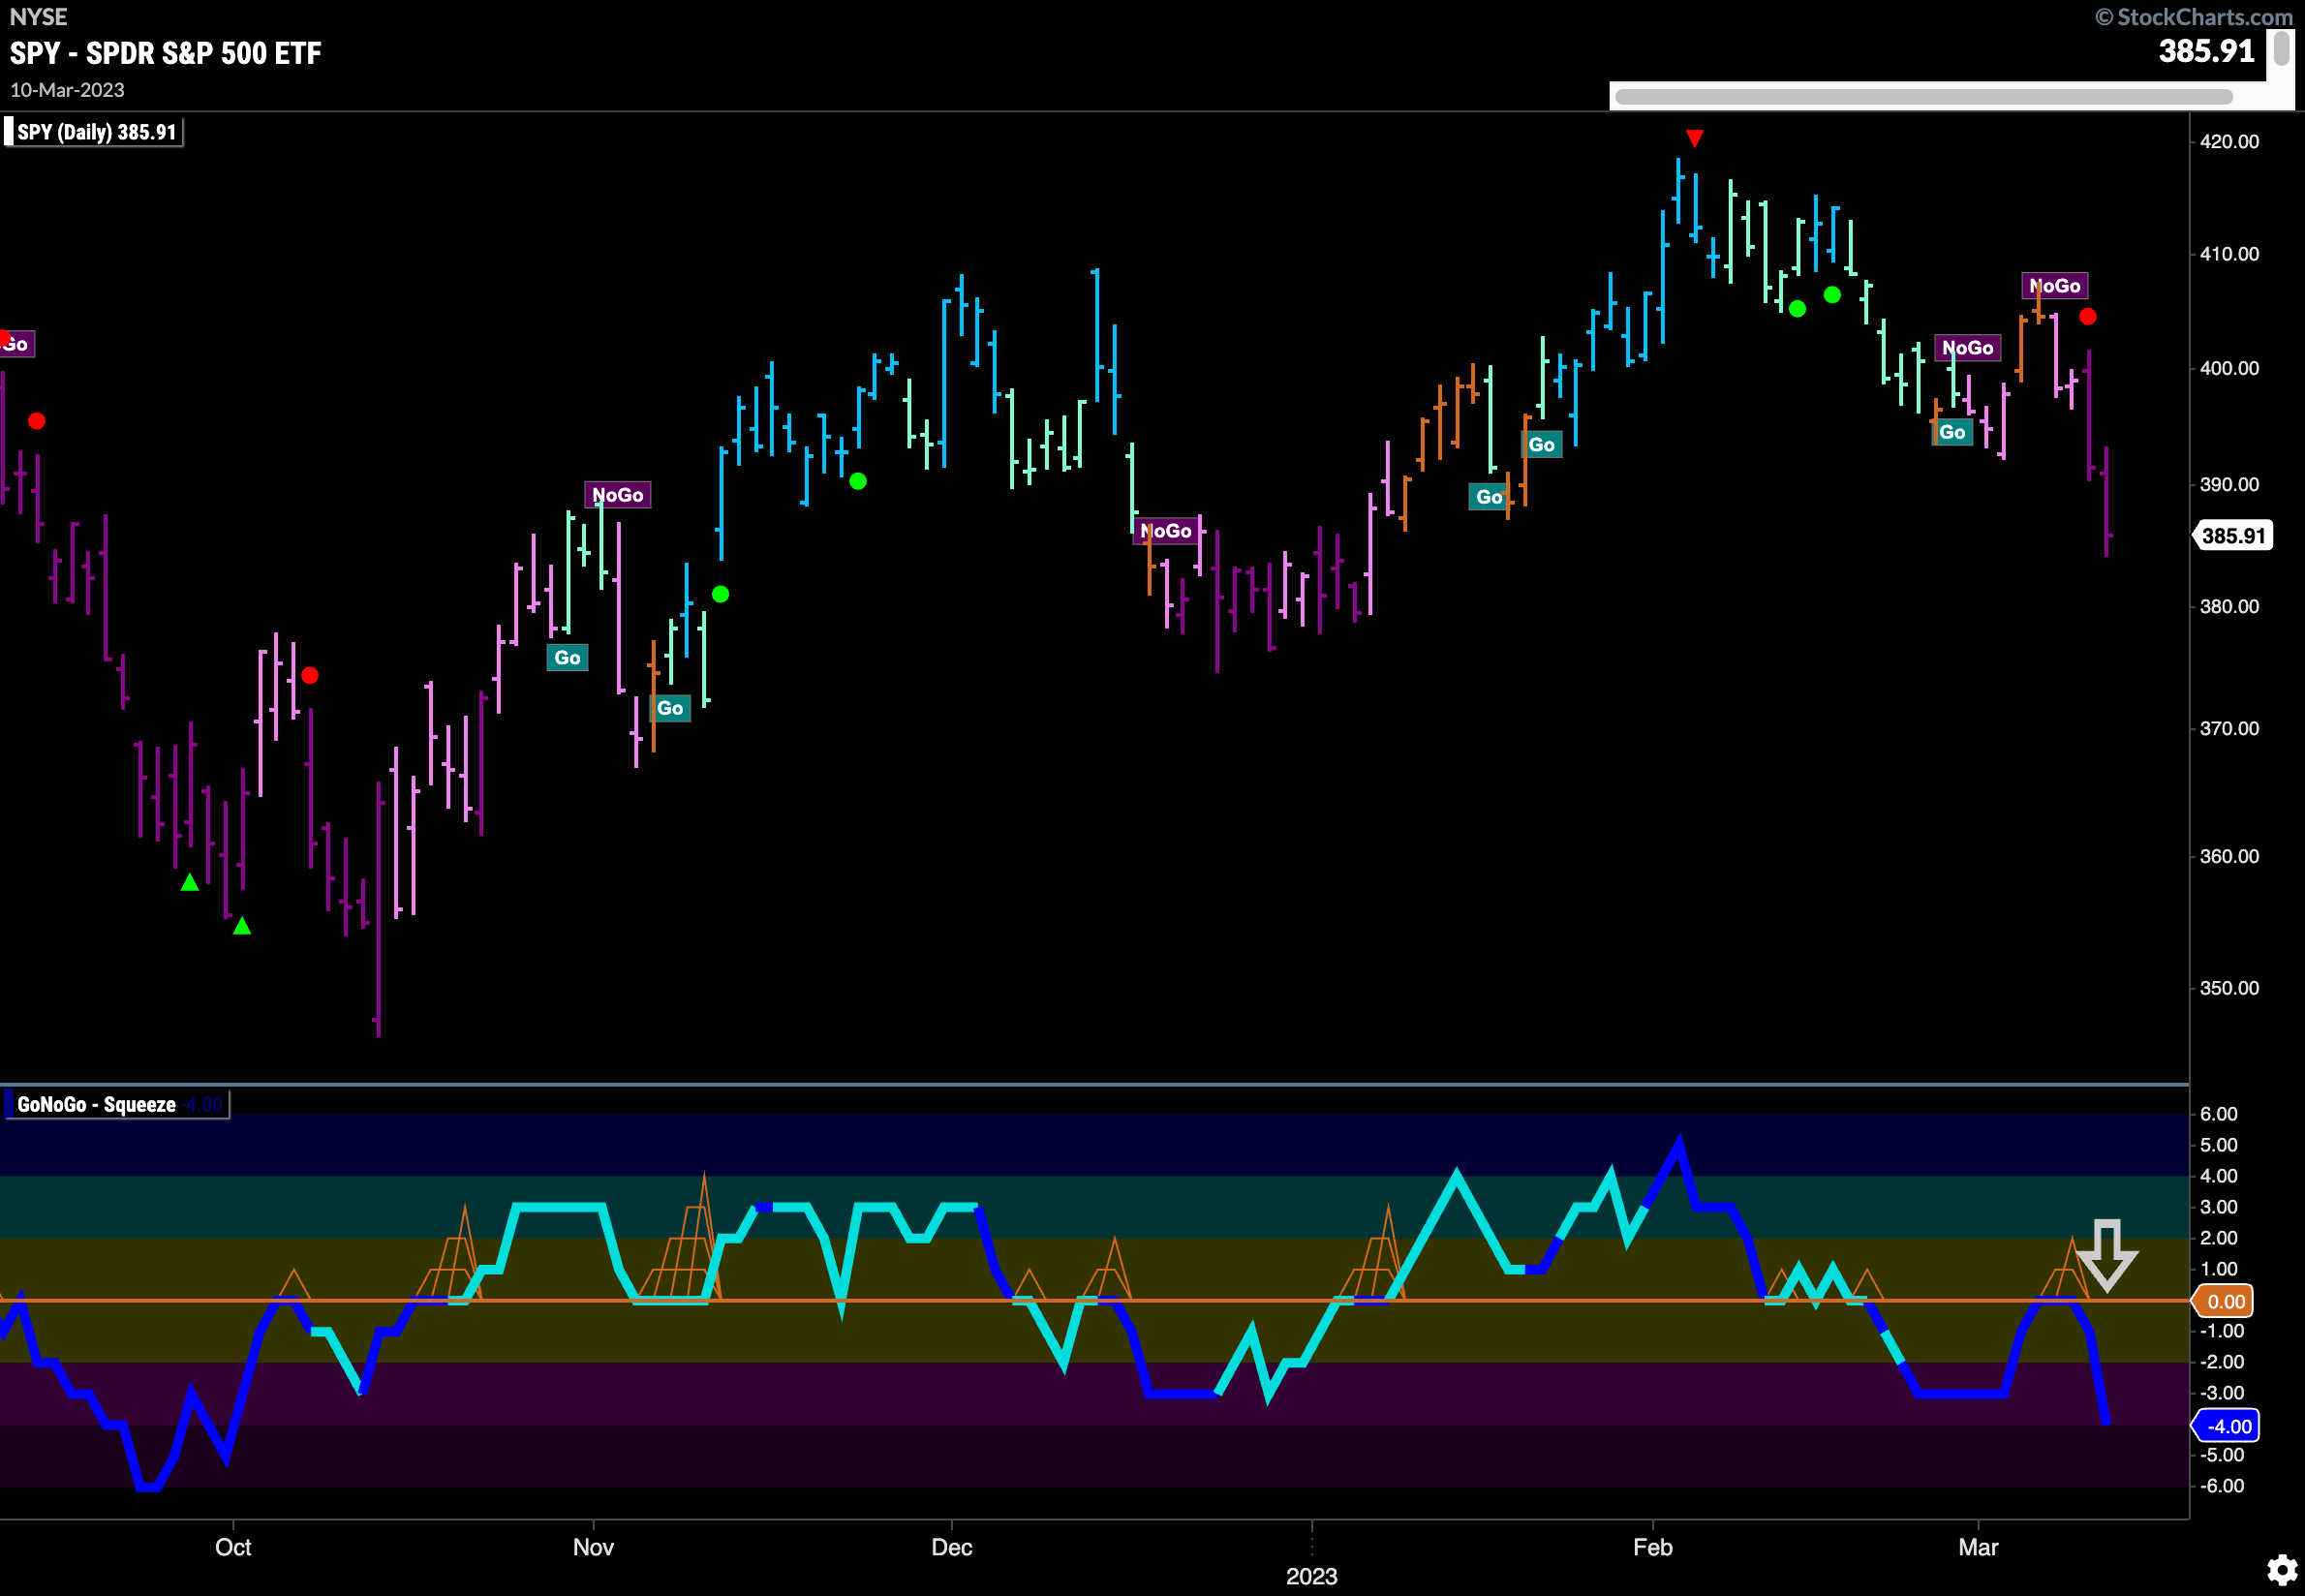
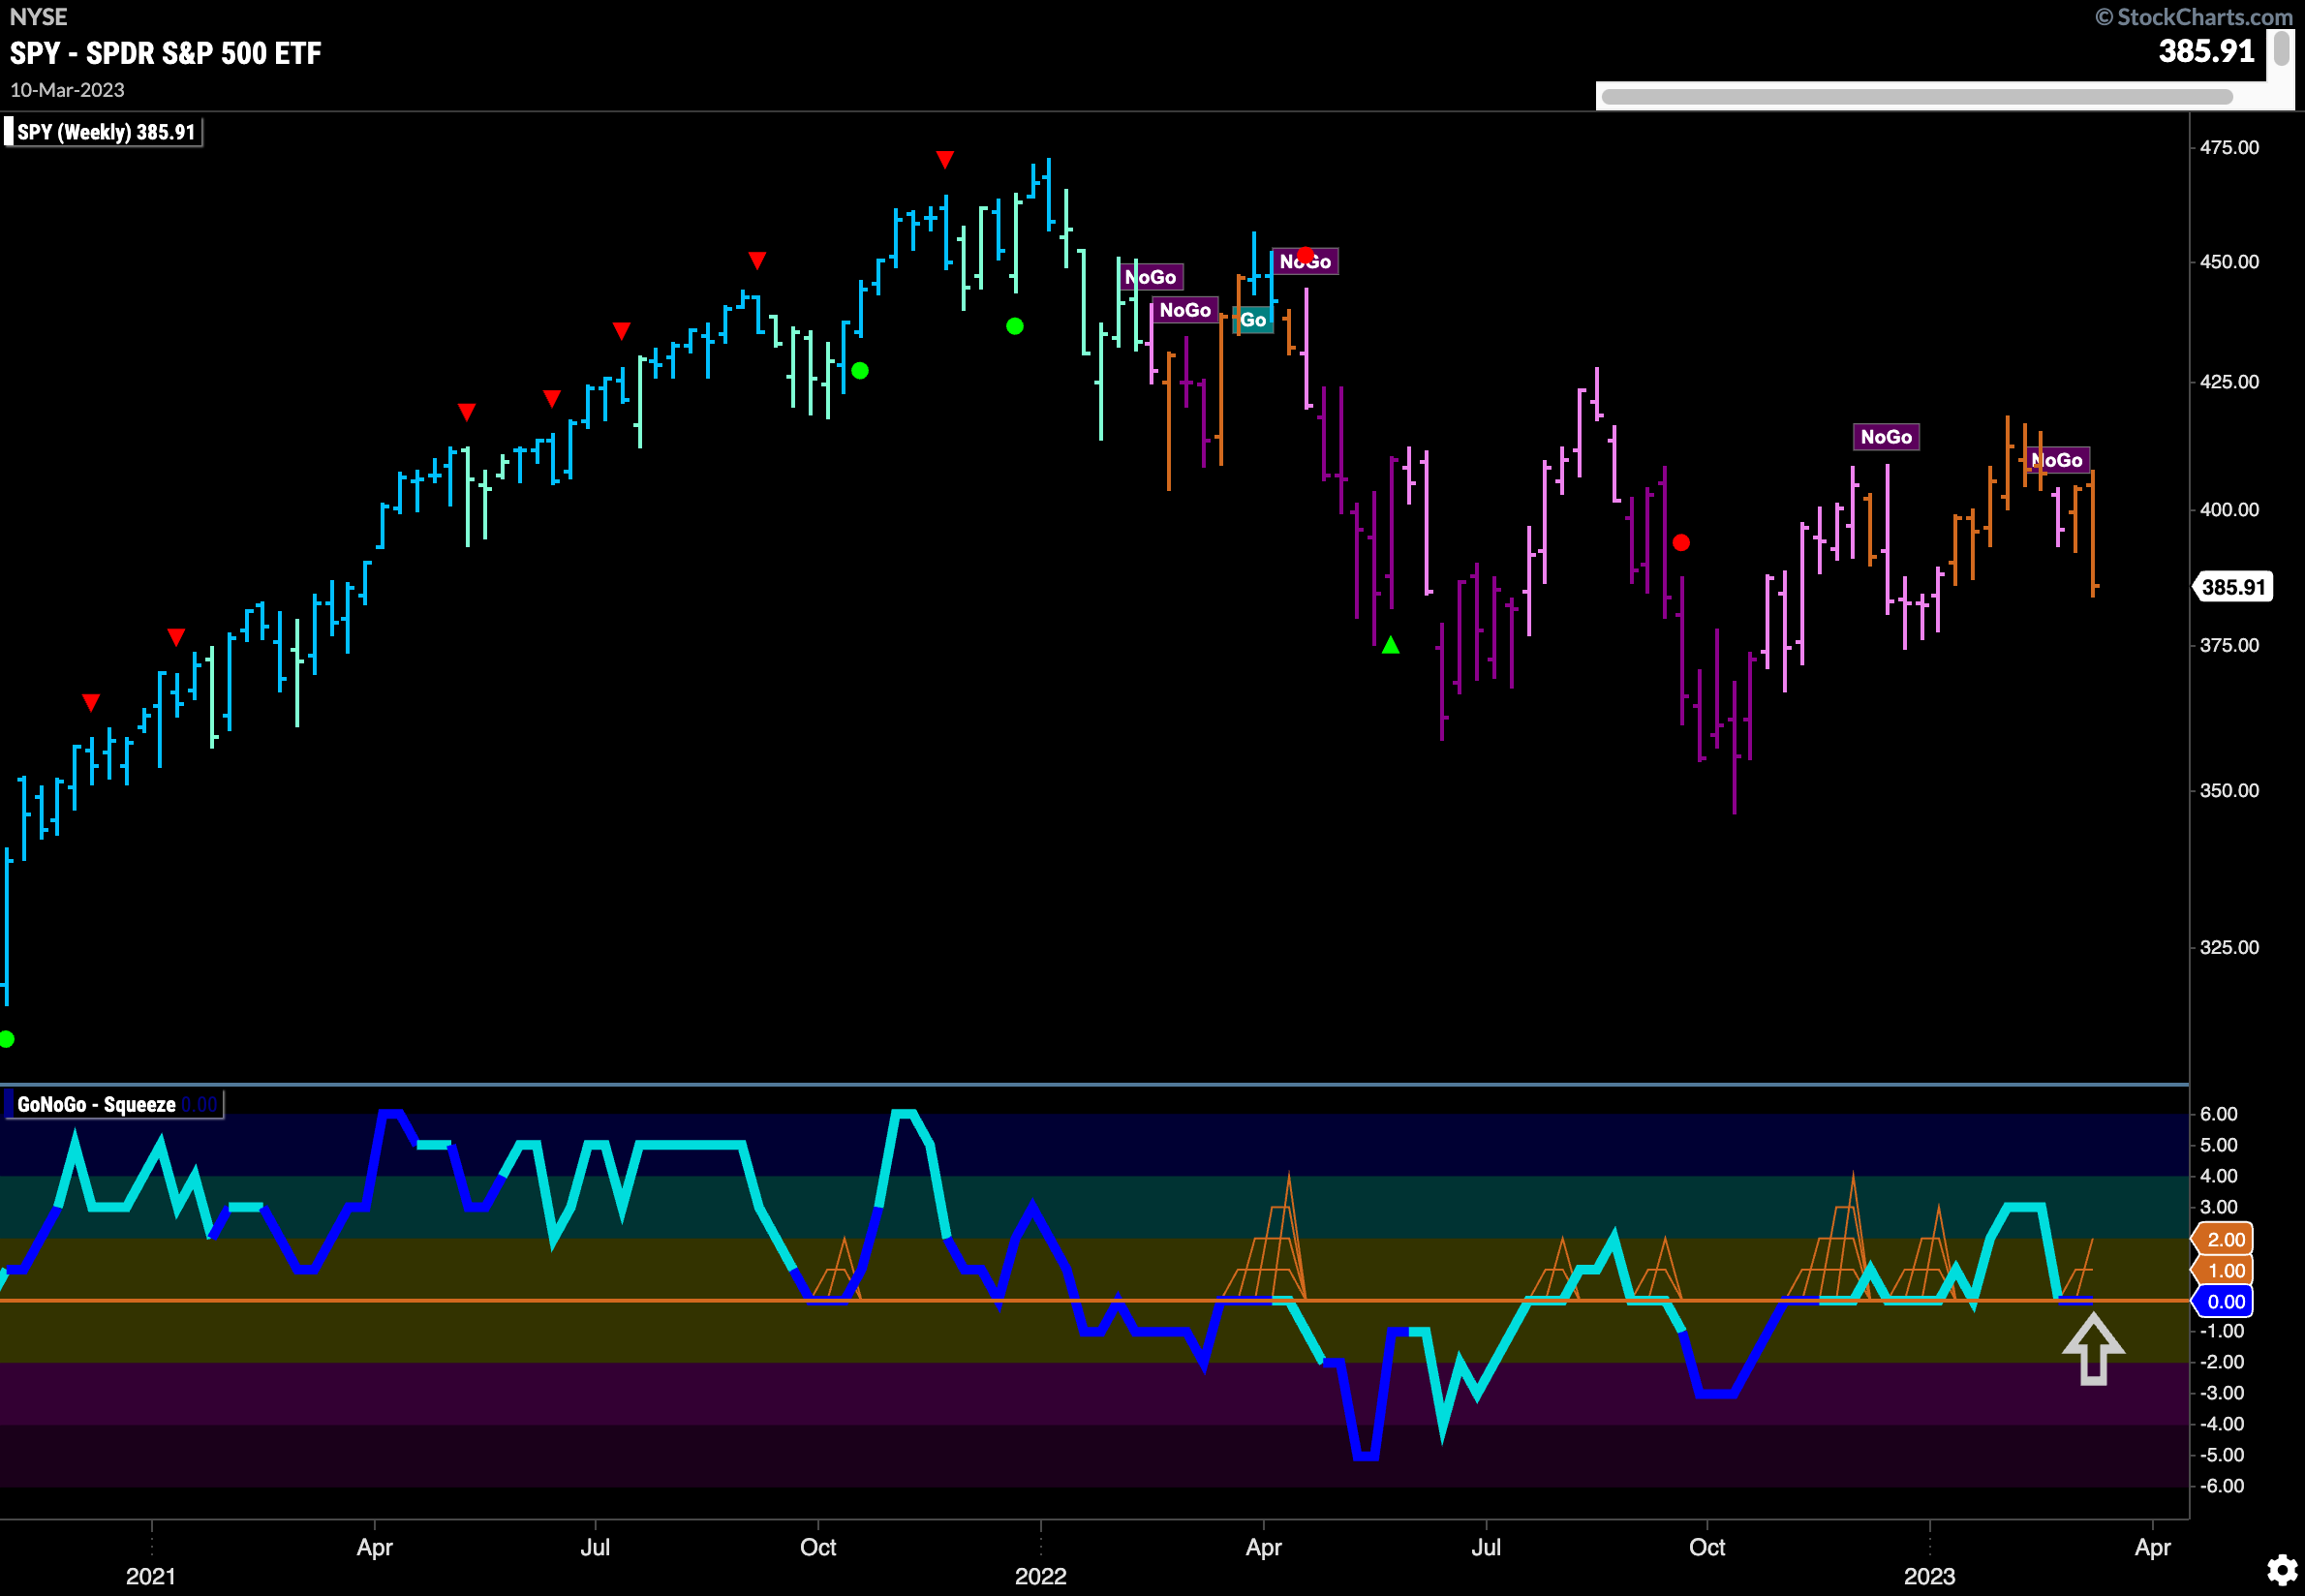
The longer term weekly chart continued uncertainty as price tries to climb out of the long term “NoGo” trend that has engulfed the market since the start of 2022. An amber “Go Fish” bar sees price close lower this past week as GoNoGo Oscillator reverts back to test the zero line from above. We will watch to see if it finds support here.
Treasury Rates Tumble
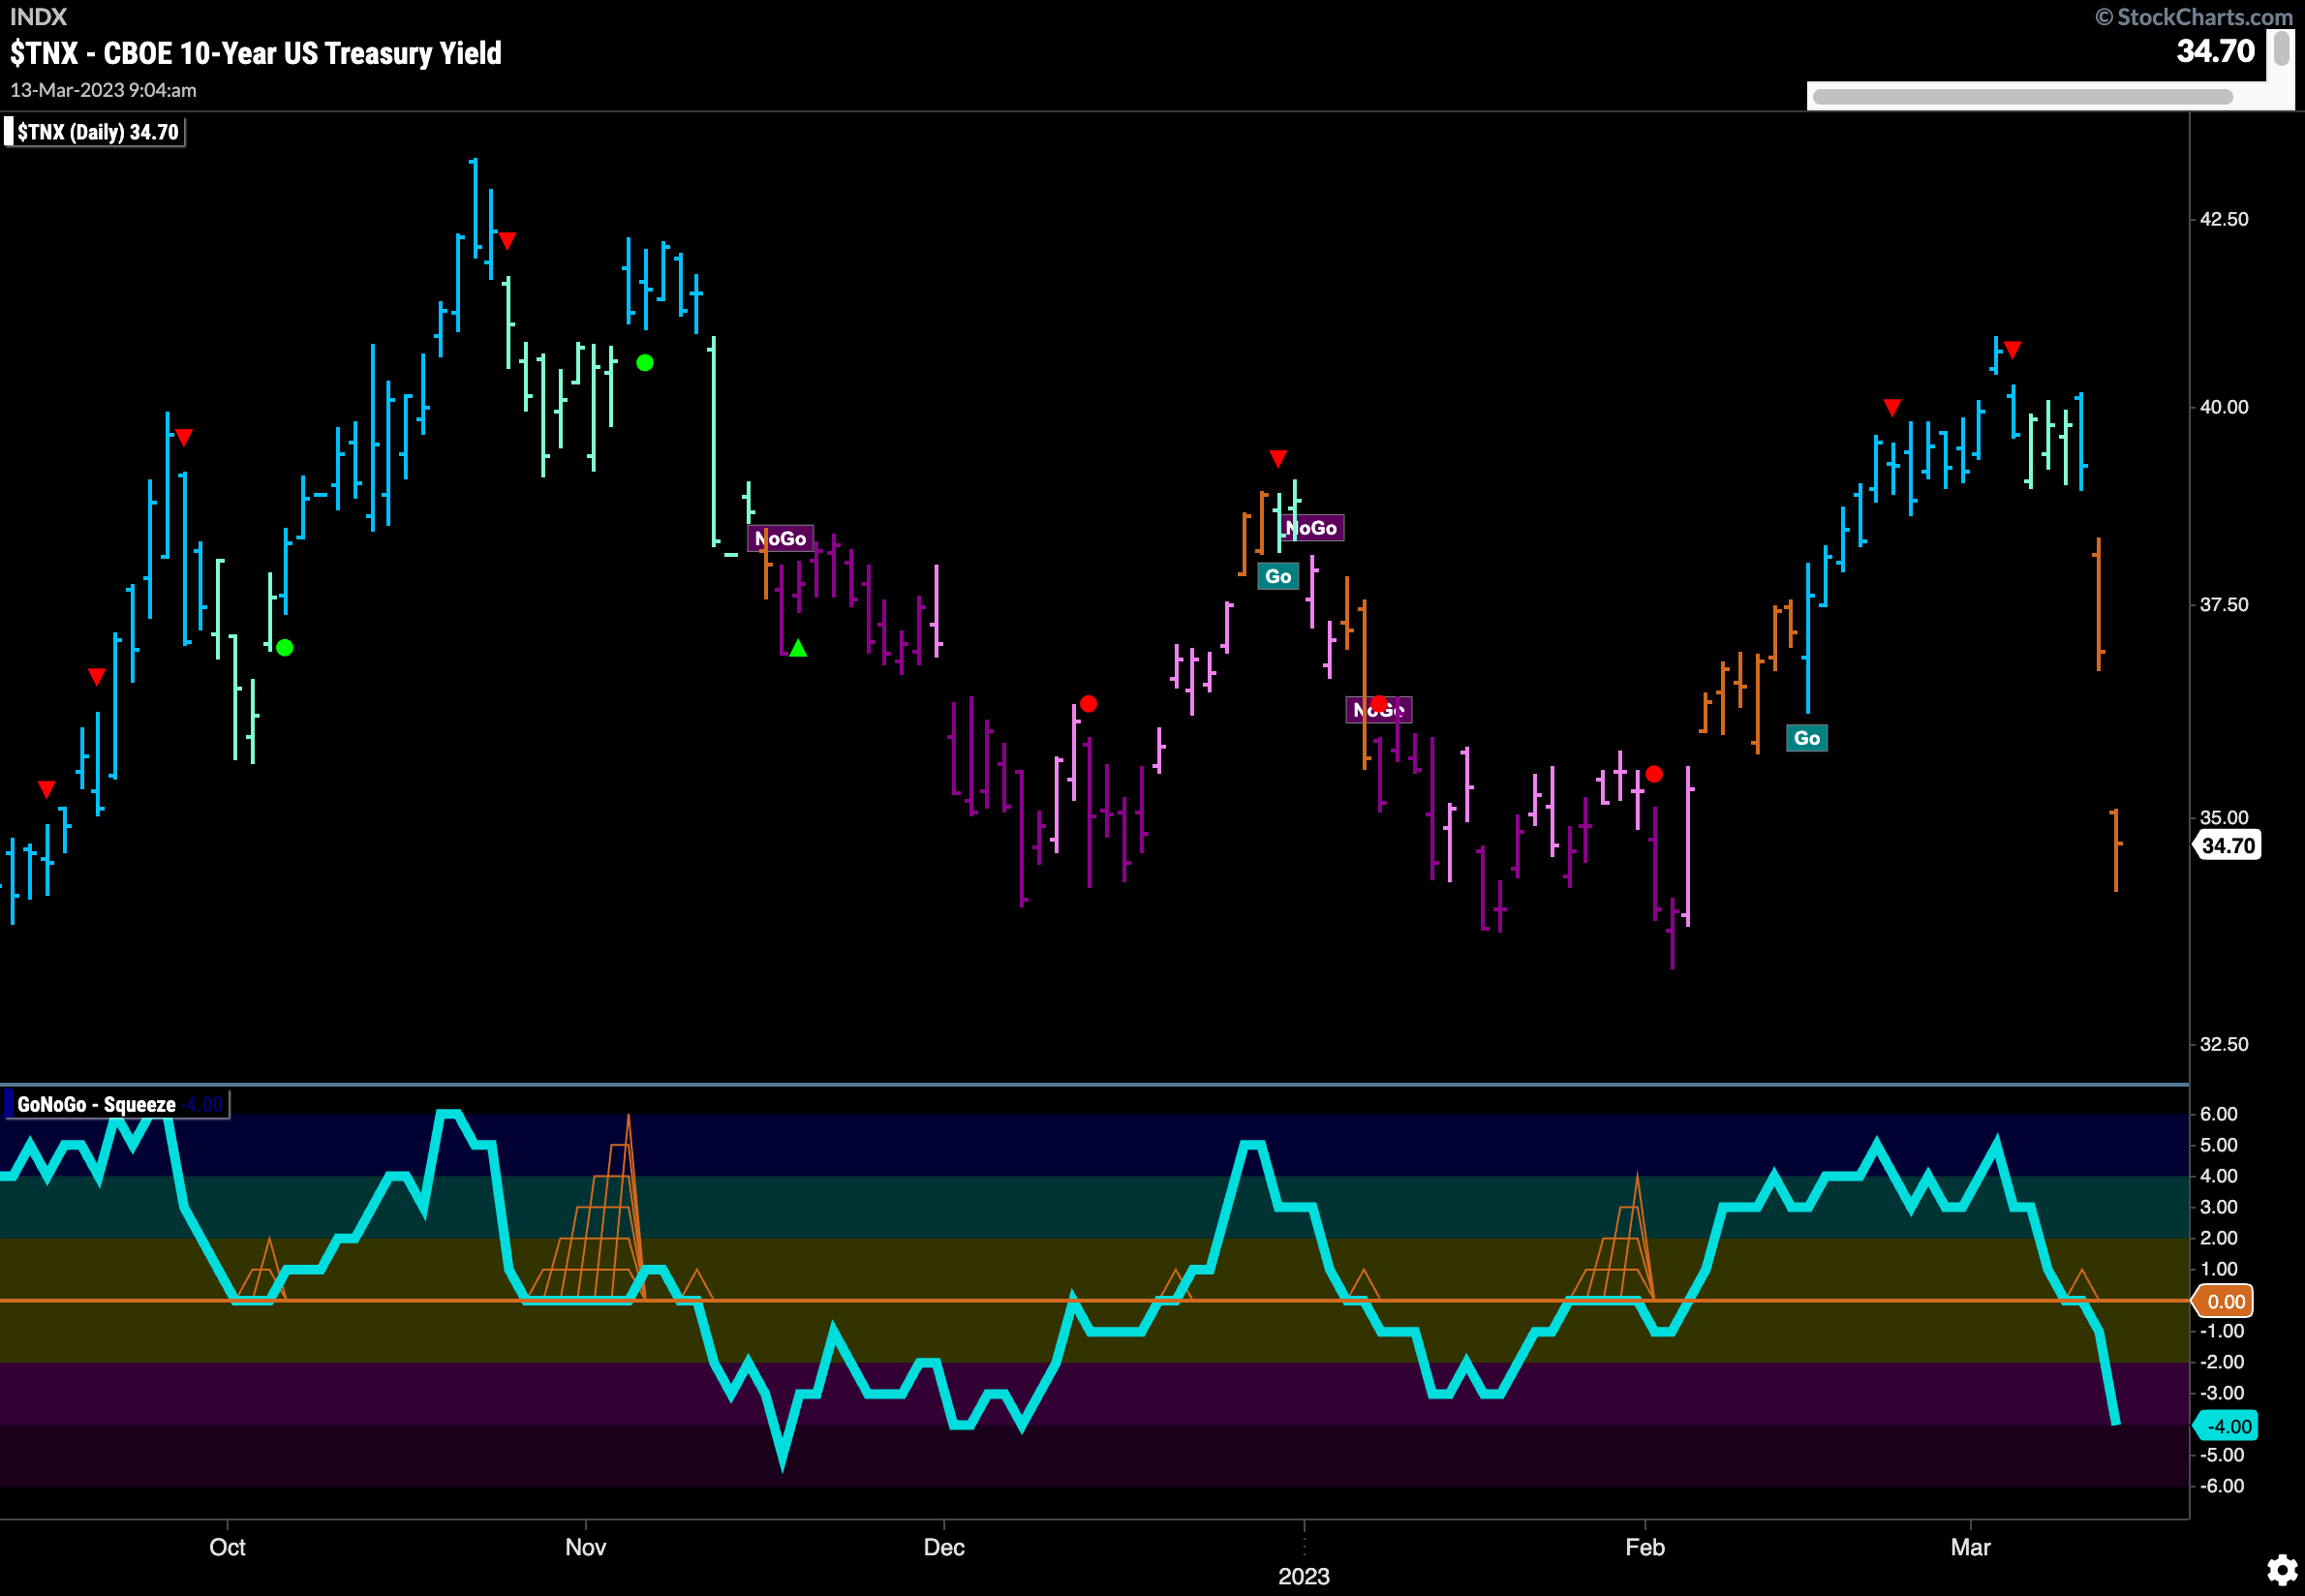
Treasury rates fell off a cliff late last week as we see consecutive gaps lower on amber “Go Fish” bars. As price tests recent lows from the last “NoGo” we see GoNoGo Oscillator crash through the zero line into negative territory. Although not yet oversold it is falling sharply.
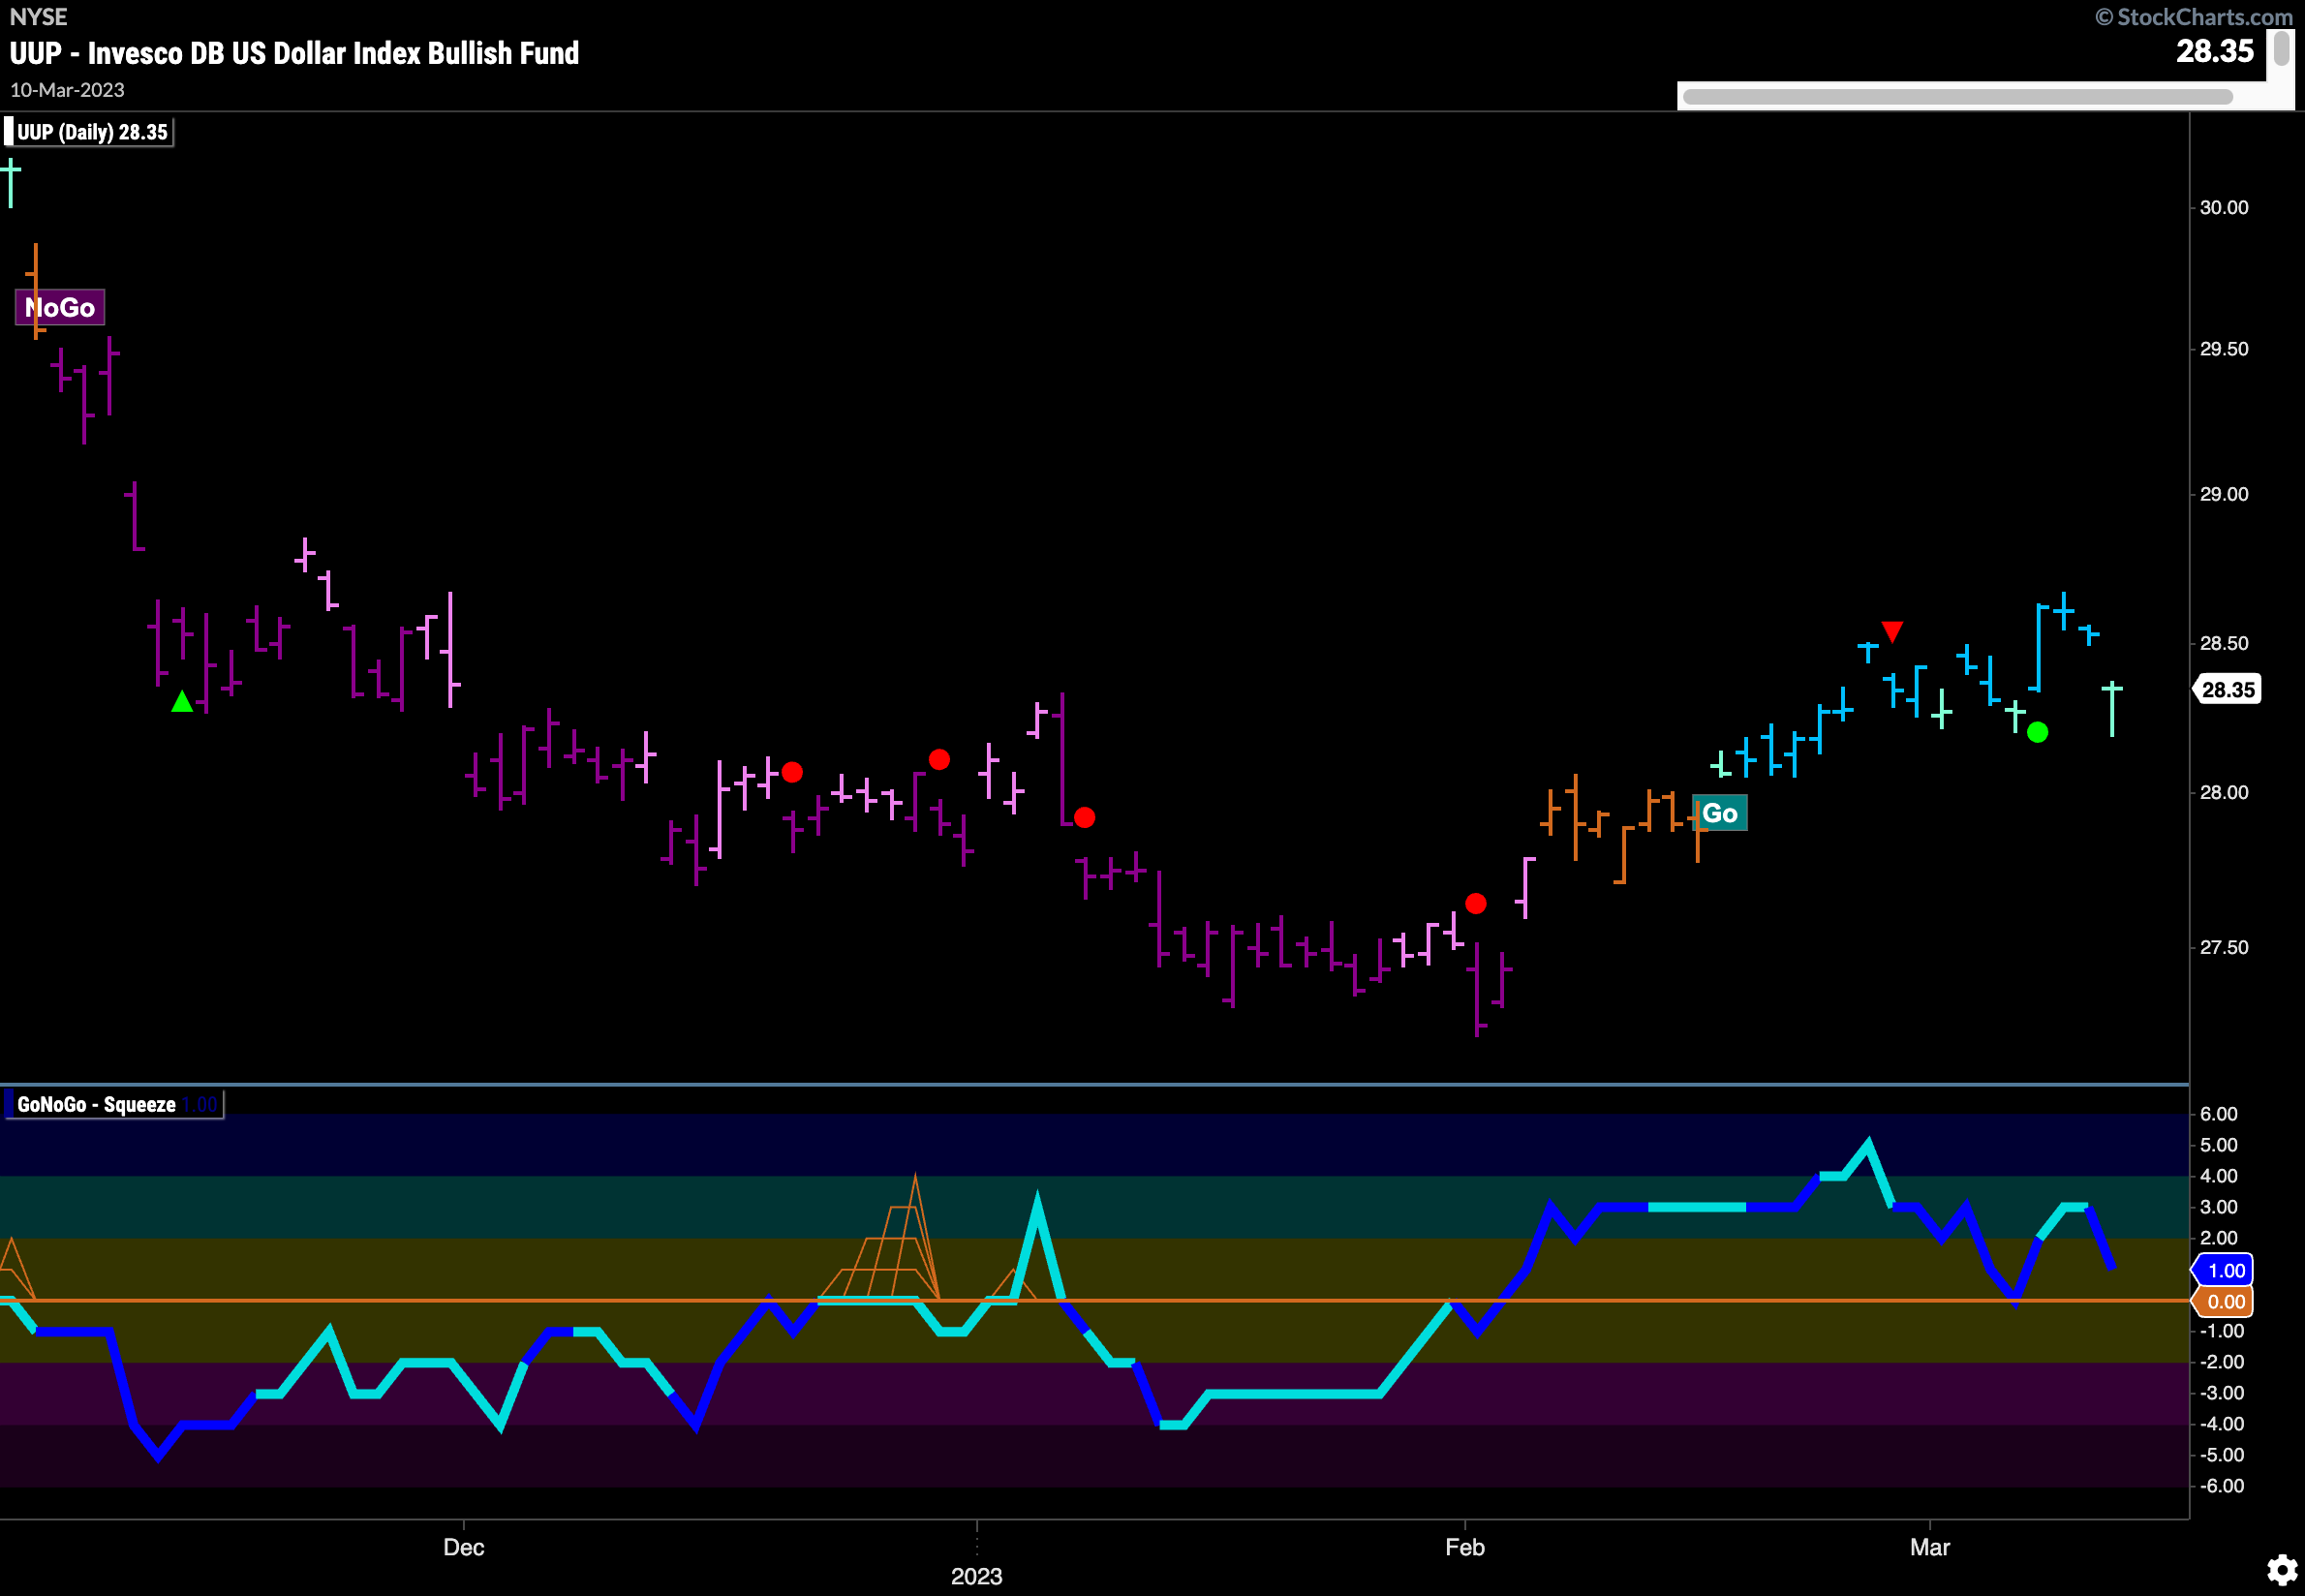
Dragonfly Doji on the Dollar
The “Go” trend remains in place for the dollar this week although Friday saw price gap lower. Interestingly, dollar bears pushed price much lower than the open but the market closed right back up where it started. This type of Doji bar with open and close the same but near the top of the trading range and with a long lower shadow is often called a Dragonfly Doji. While the doji of course expresses uncertainty, a Dragonfly Doji has slightly bullish connotations as the bulls were able to win the day.
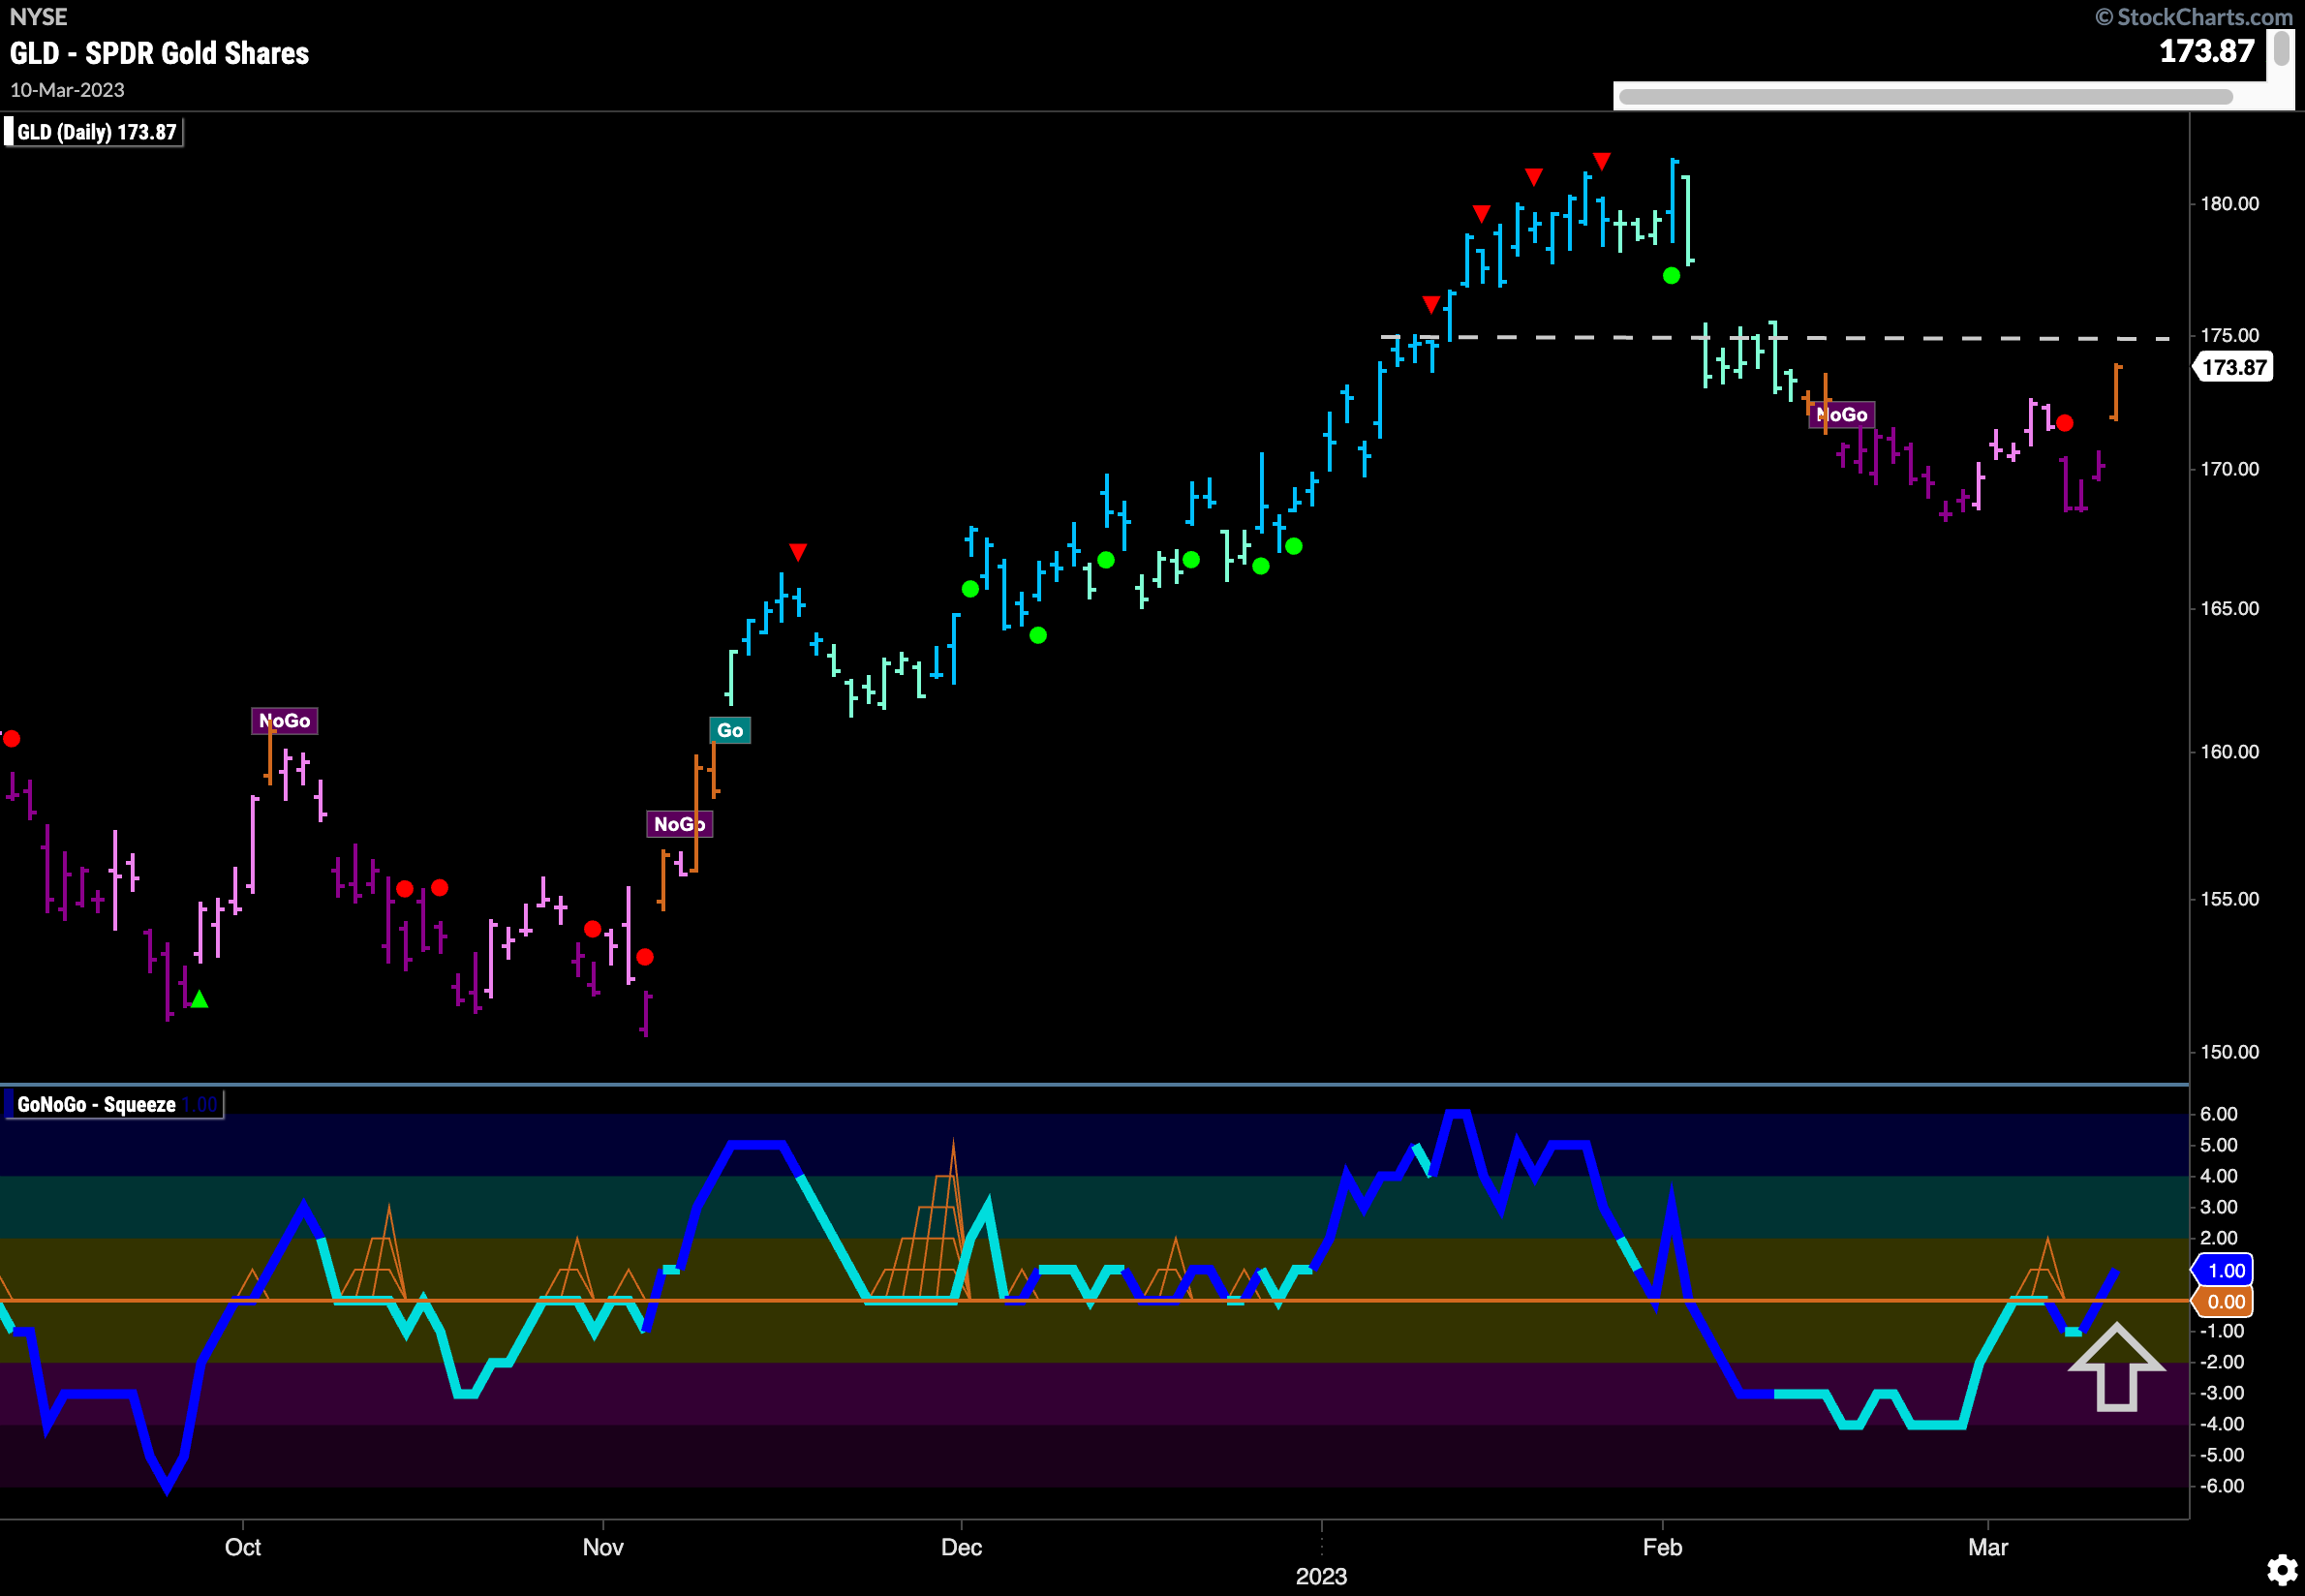
Gold Sees “Go Fish” Bar of Uncertainty
Gold prices gapped sharply higher on Friday. GoNoGo Trend shows that the “NoGo” trend that was in place has faltered and we saw an amber “Go Fish” bar to end the week. GoNoGo Oscillator is currently breaking above the zero line on heavy volume. Price is facing what might be resistance just above it so we will keep an eye on that level.
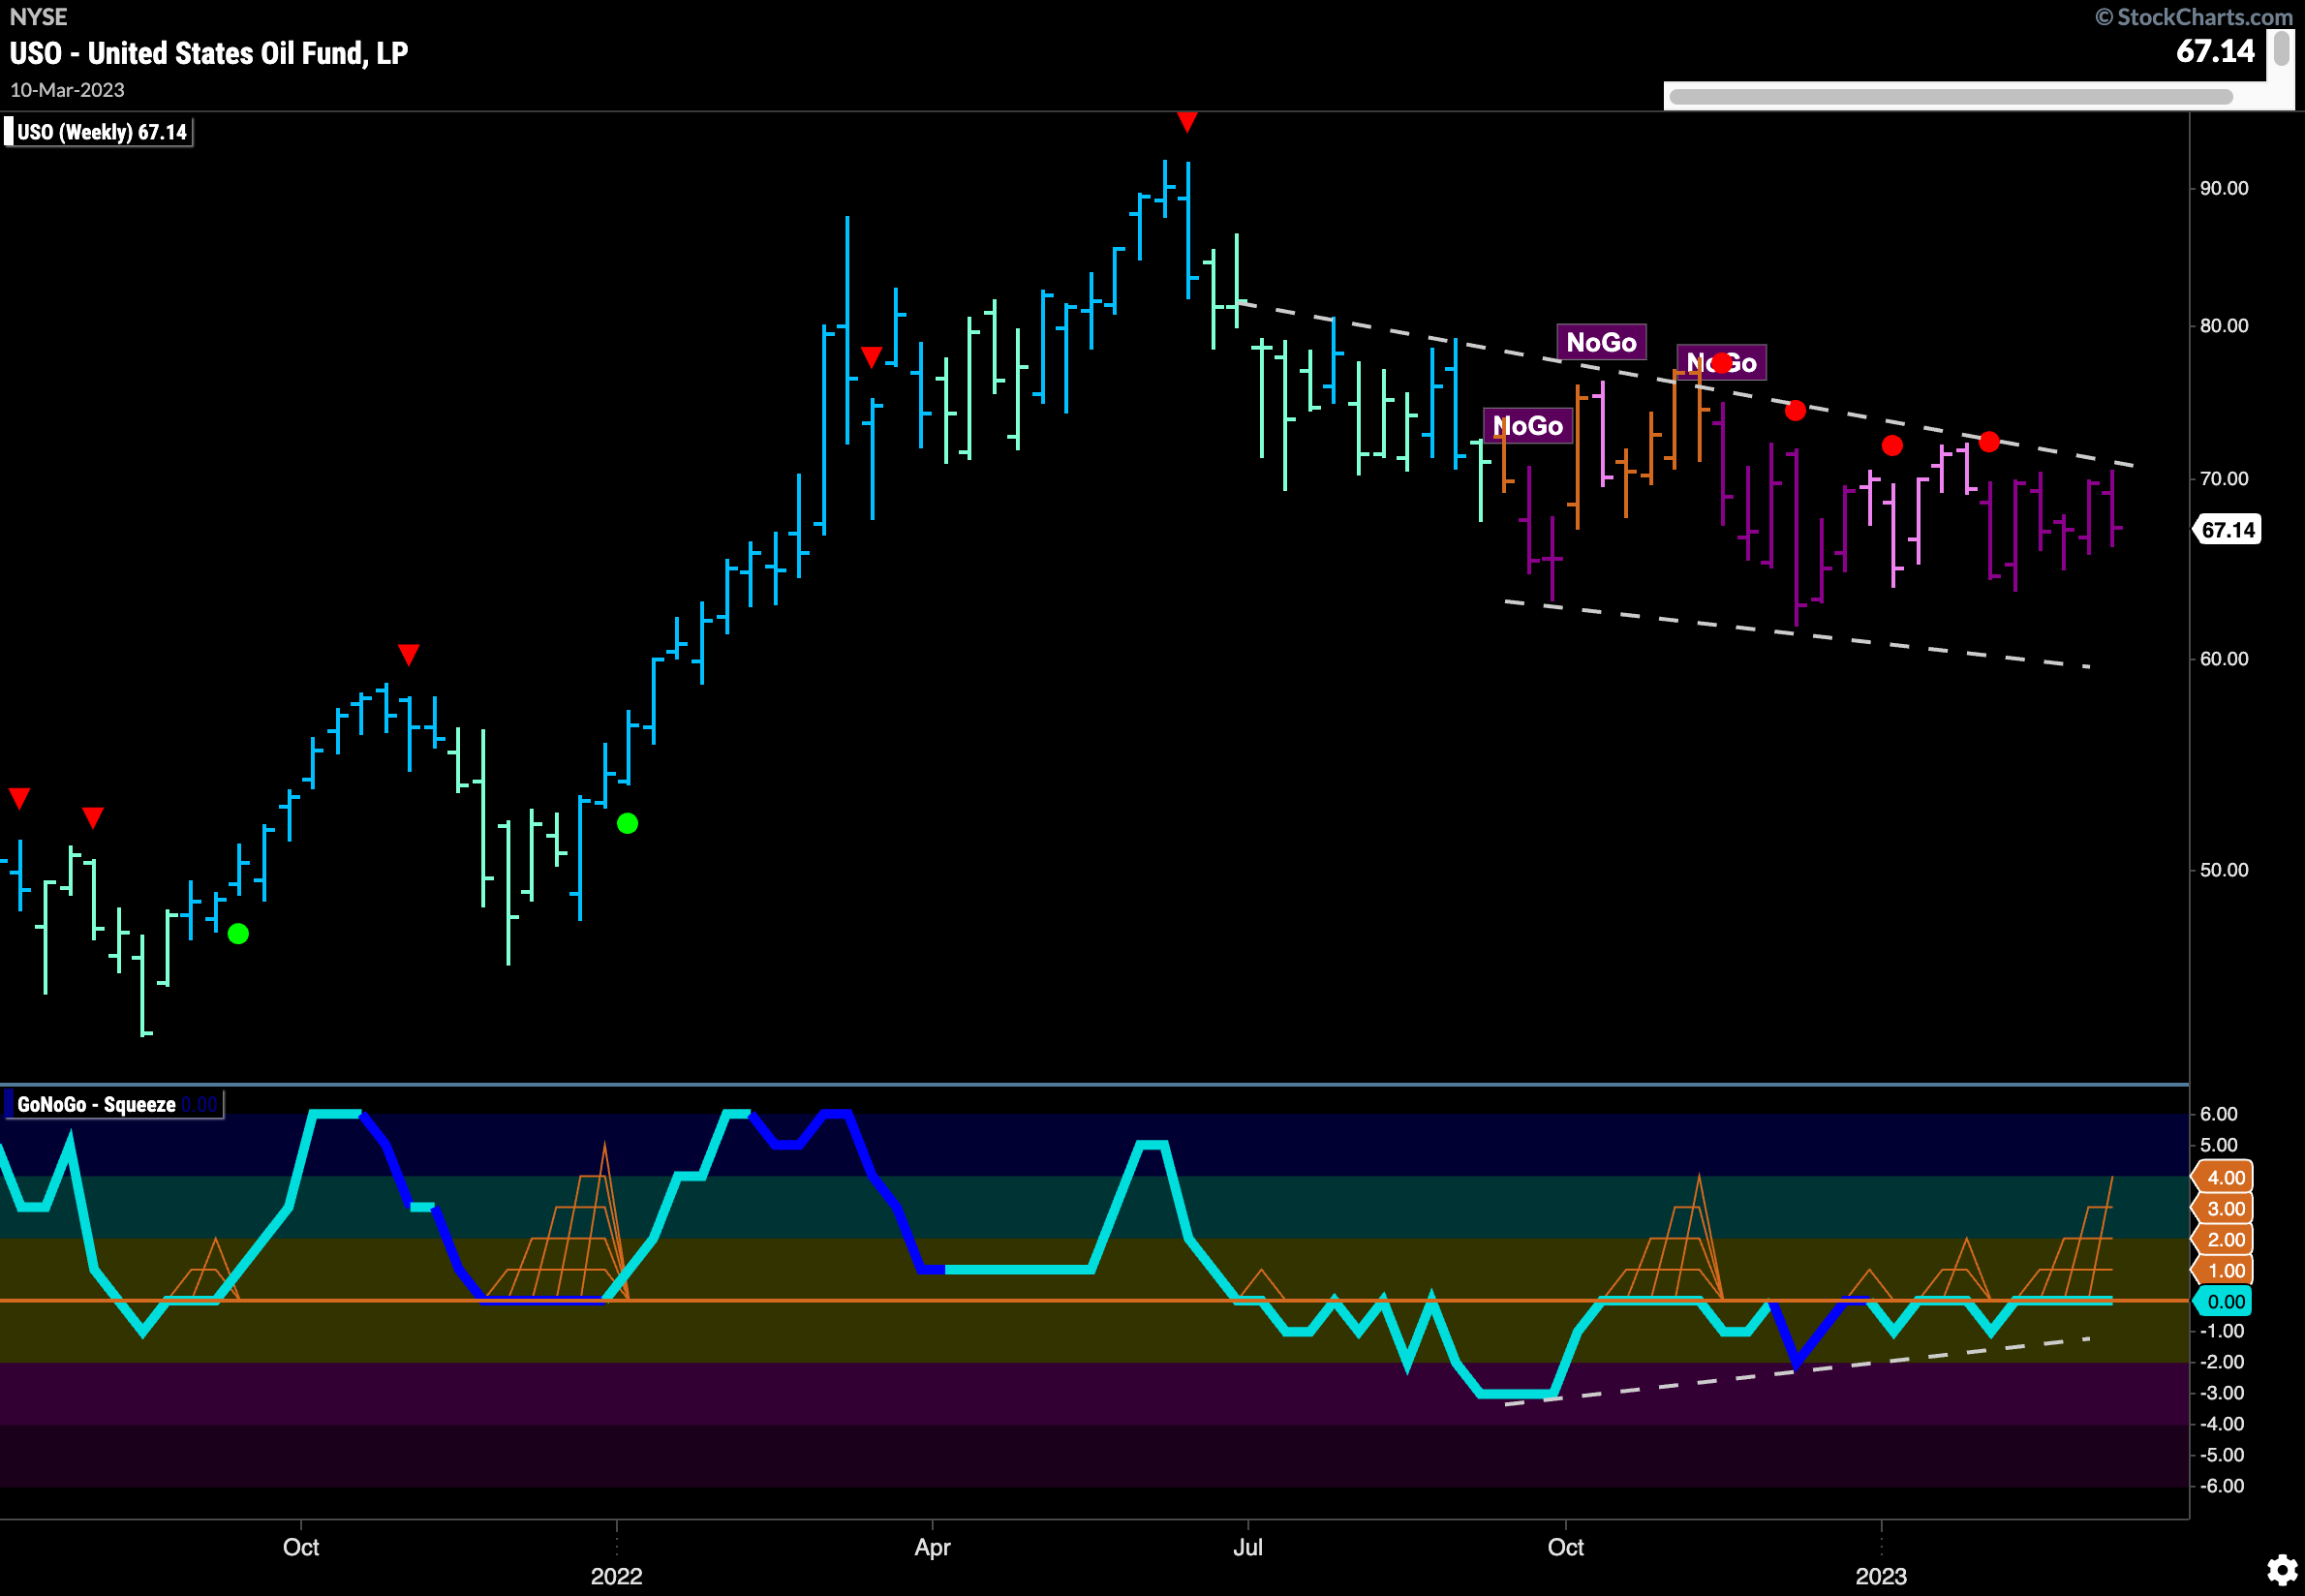
Oil Remains Locked in Slow Moving “NoGo”
Another week, another strong purple “NoGo” bar on $USO as it stays within its downward sloping trend. GoNoGo Oscillator remains stuck at the zero line and so we will watch to see if it can break above the zero line or if it is rejected again at that level. Bullish divergence remains in place but we would need to see the oscillator take out the zero line.
 Sector RelMap
Below is the GoNoGo Sector RelMap. This GoNoGo RelMap applies the GoNoGo Trend to the relative strength ratios of the sectors to the base index. Looking at this map, we can quickly see where the relative outperformance is coming from as well as which sectors are lagging on a relative basis. 3 sectors are outperforming the base this week. $XLK, $XLI, and $XLP are painting “Go” bars. The middle of the chart appears to be changing trend. 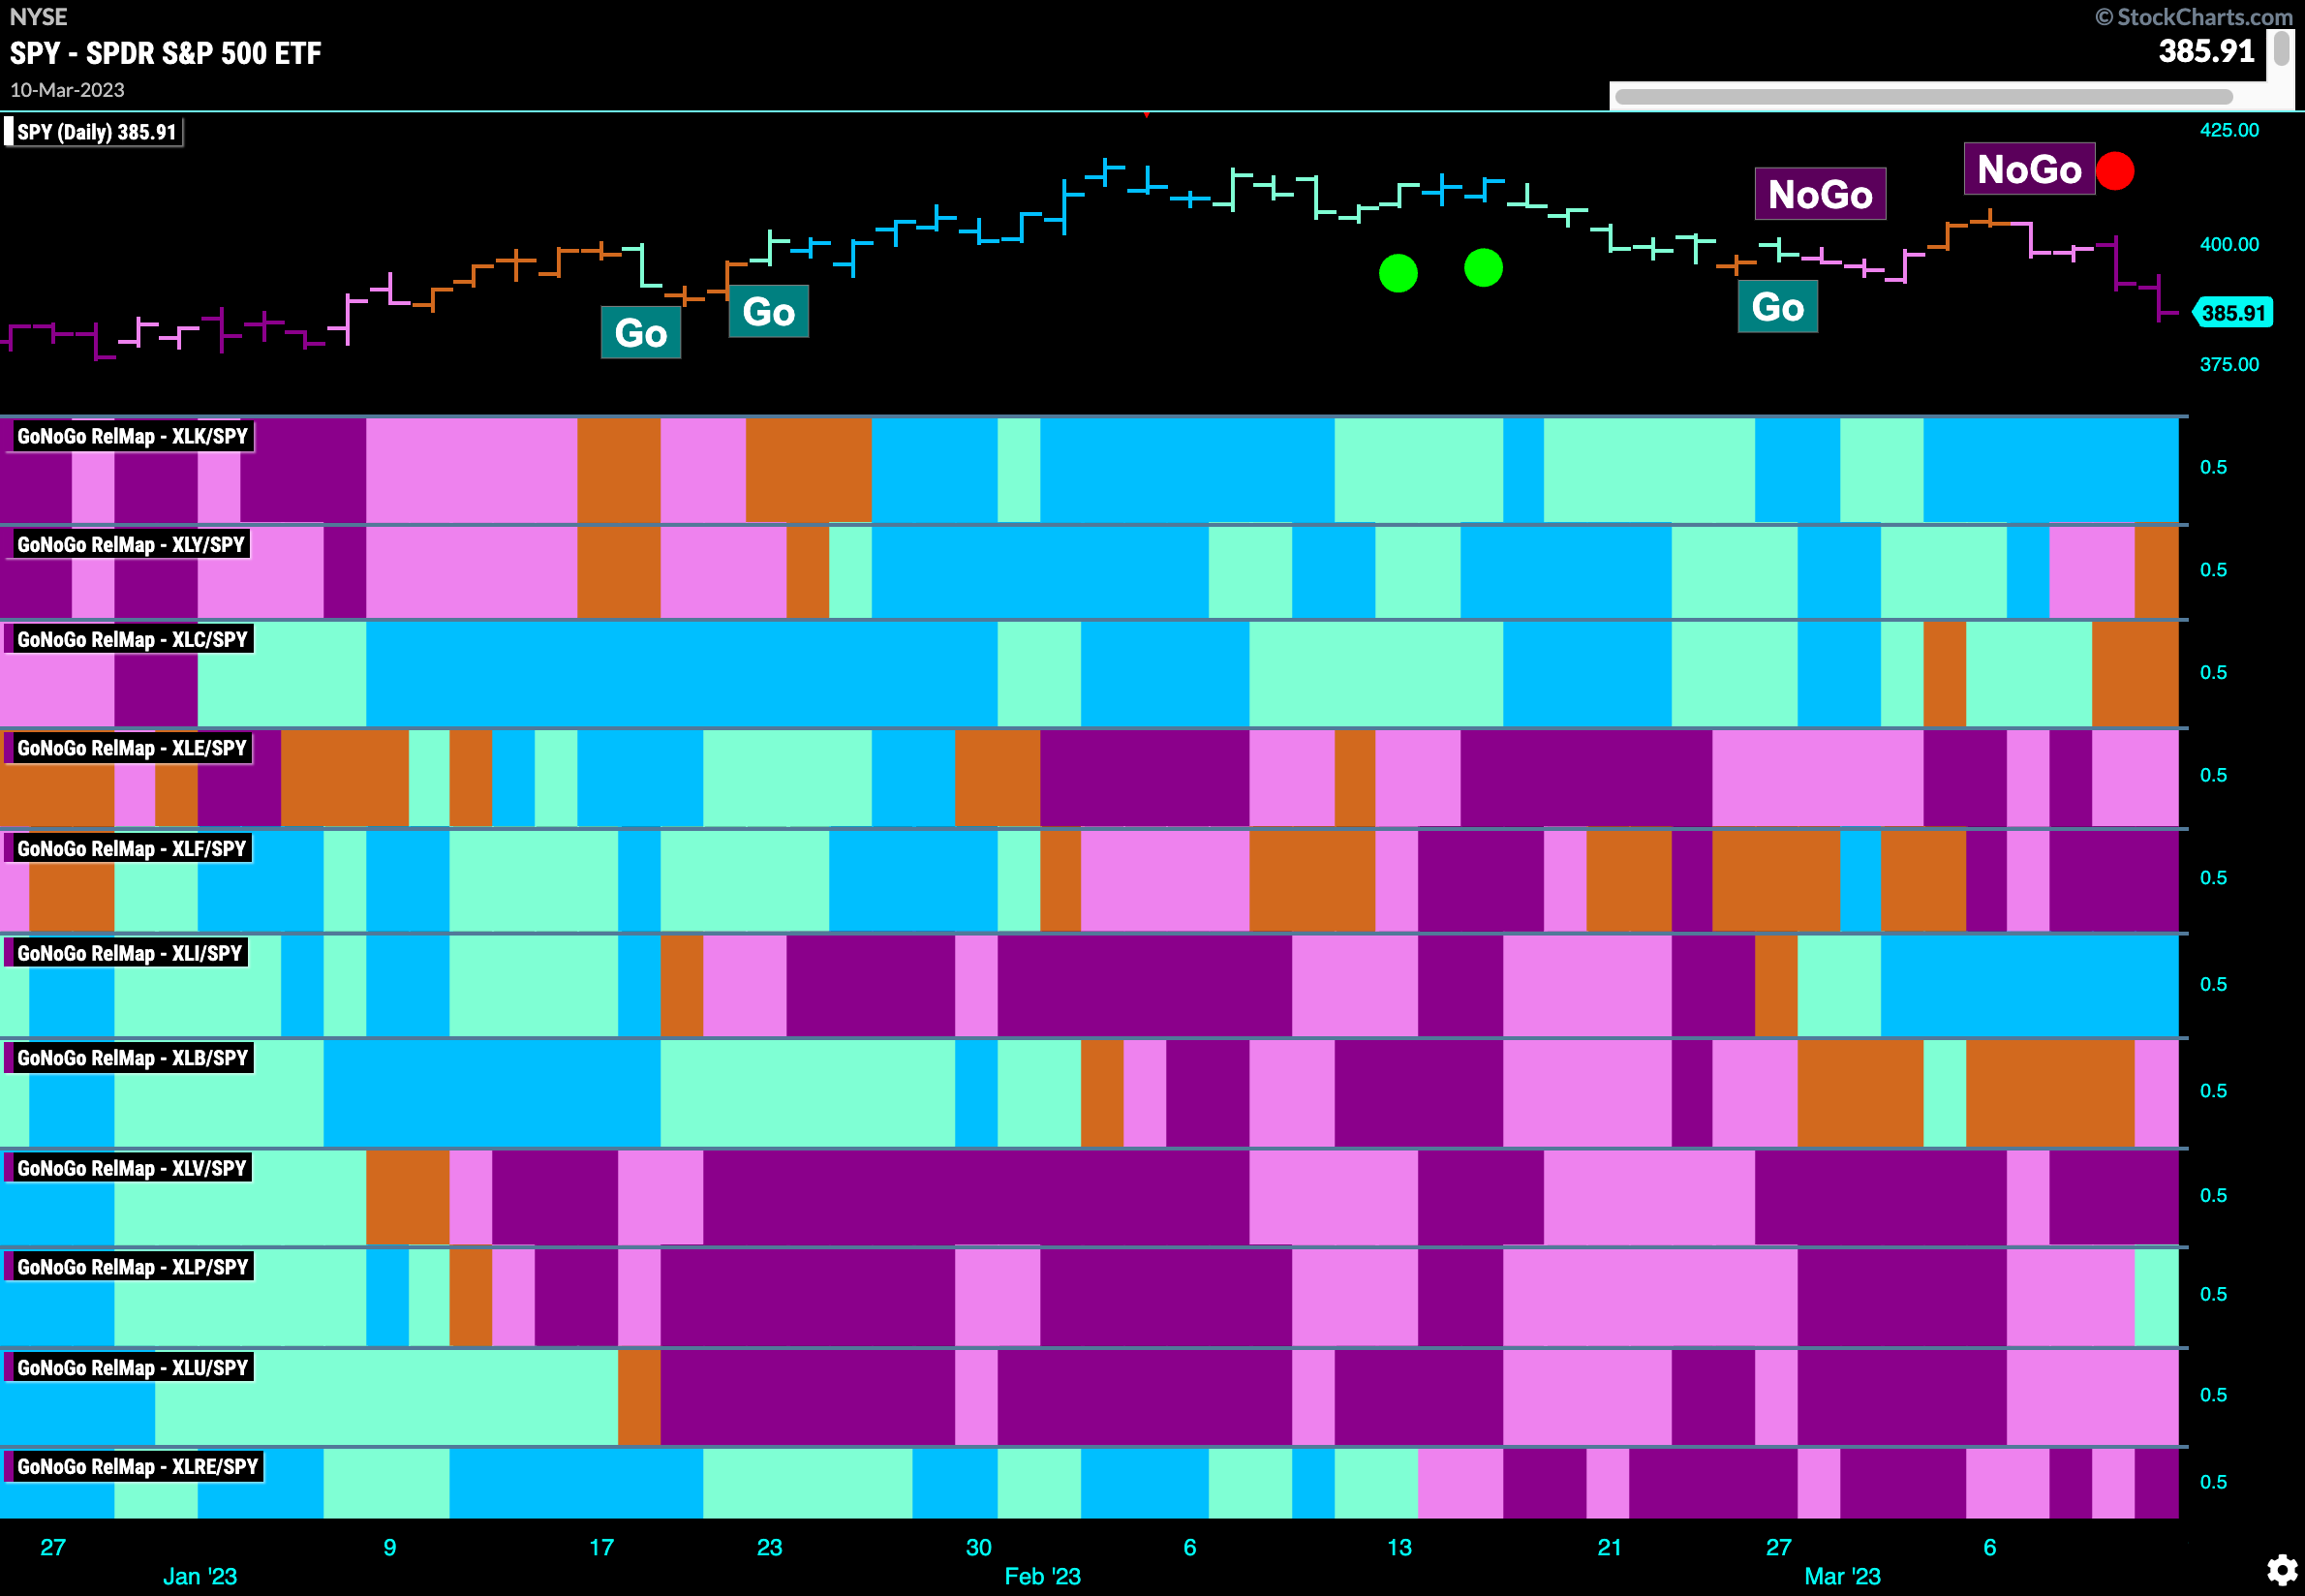
Financials in Strong “NoGo” Relative Trend
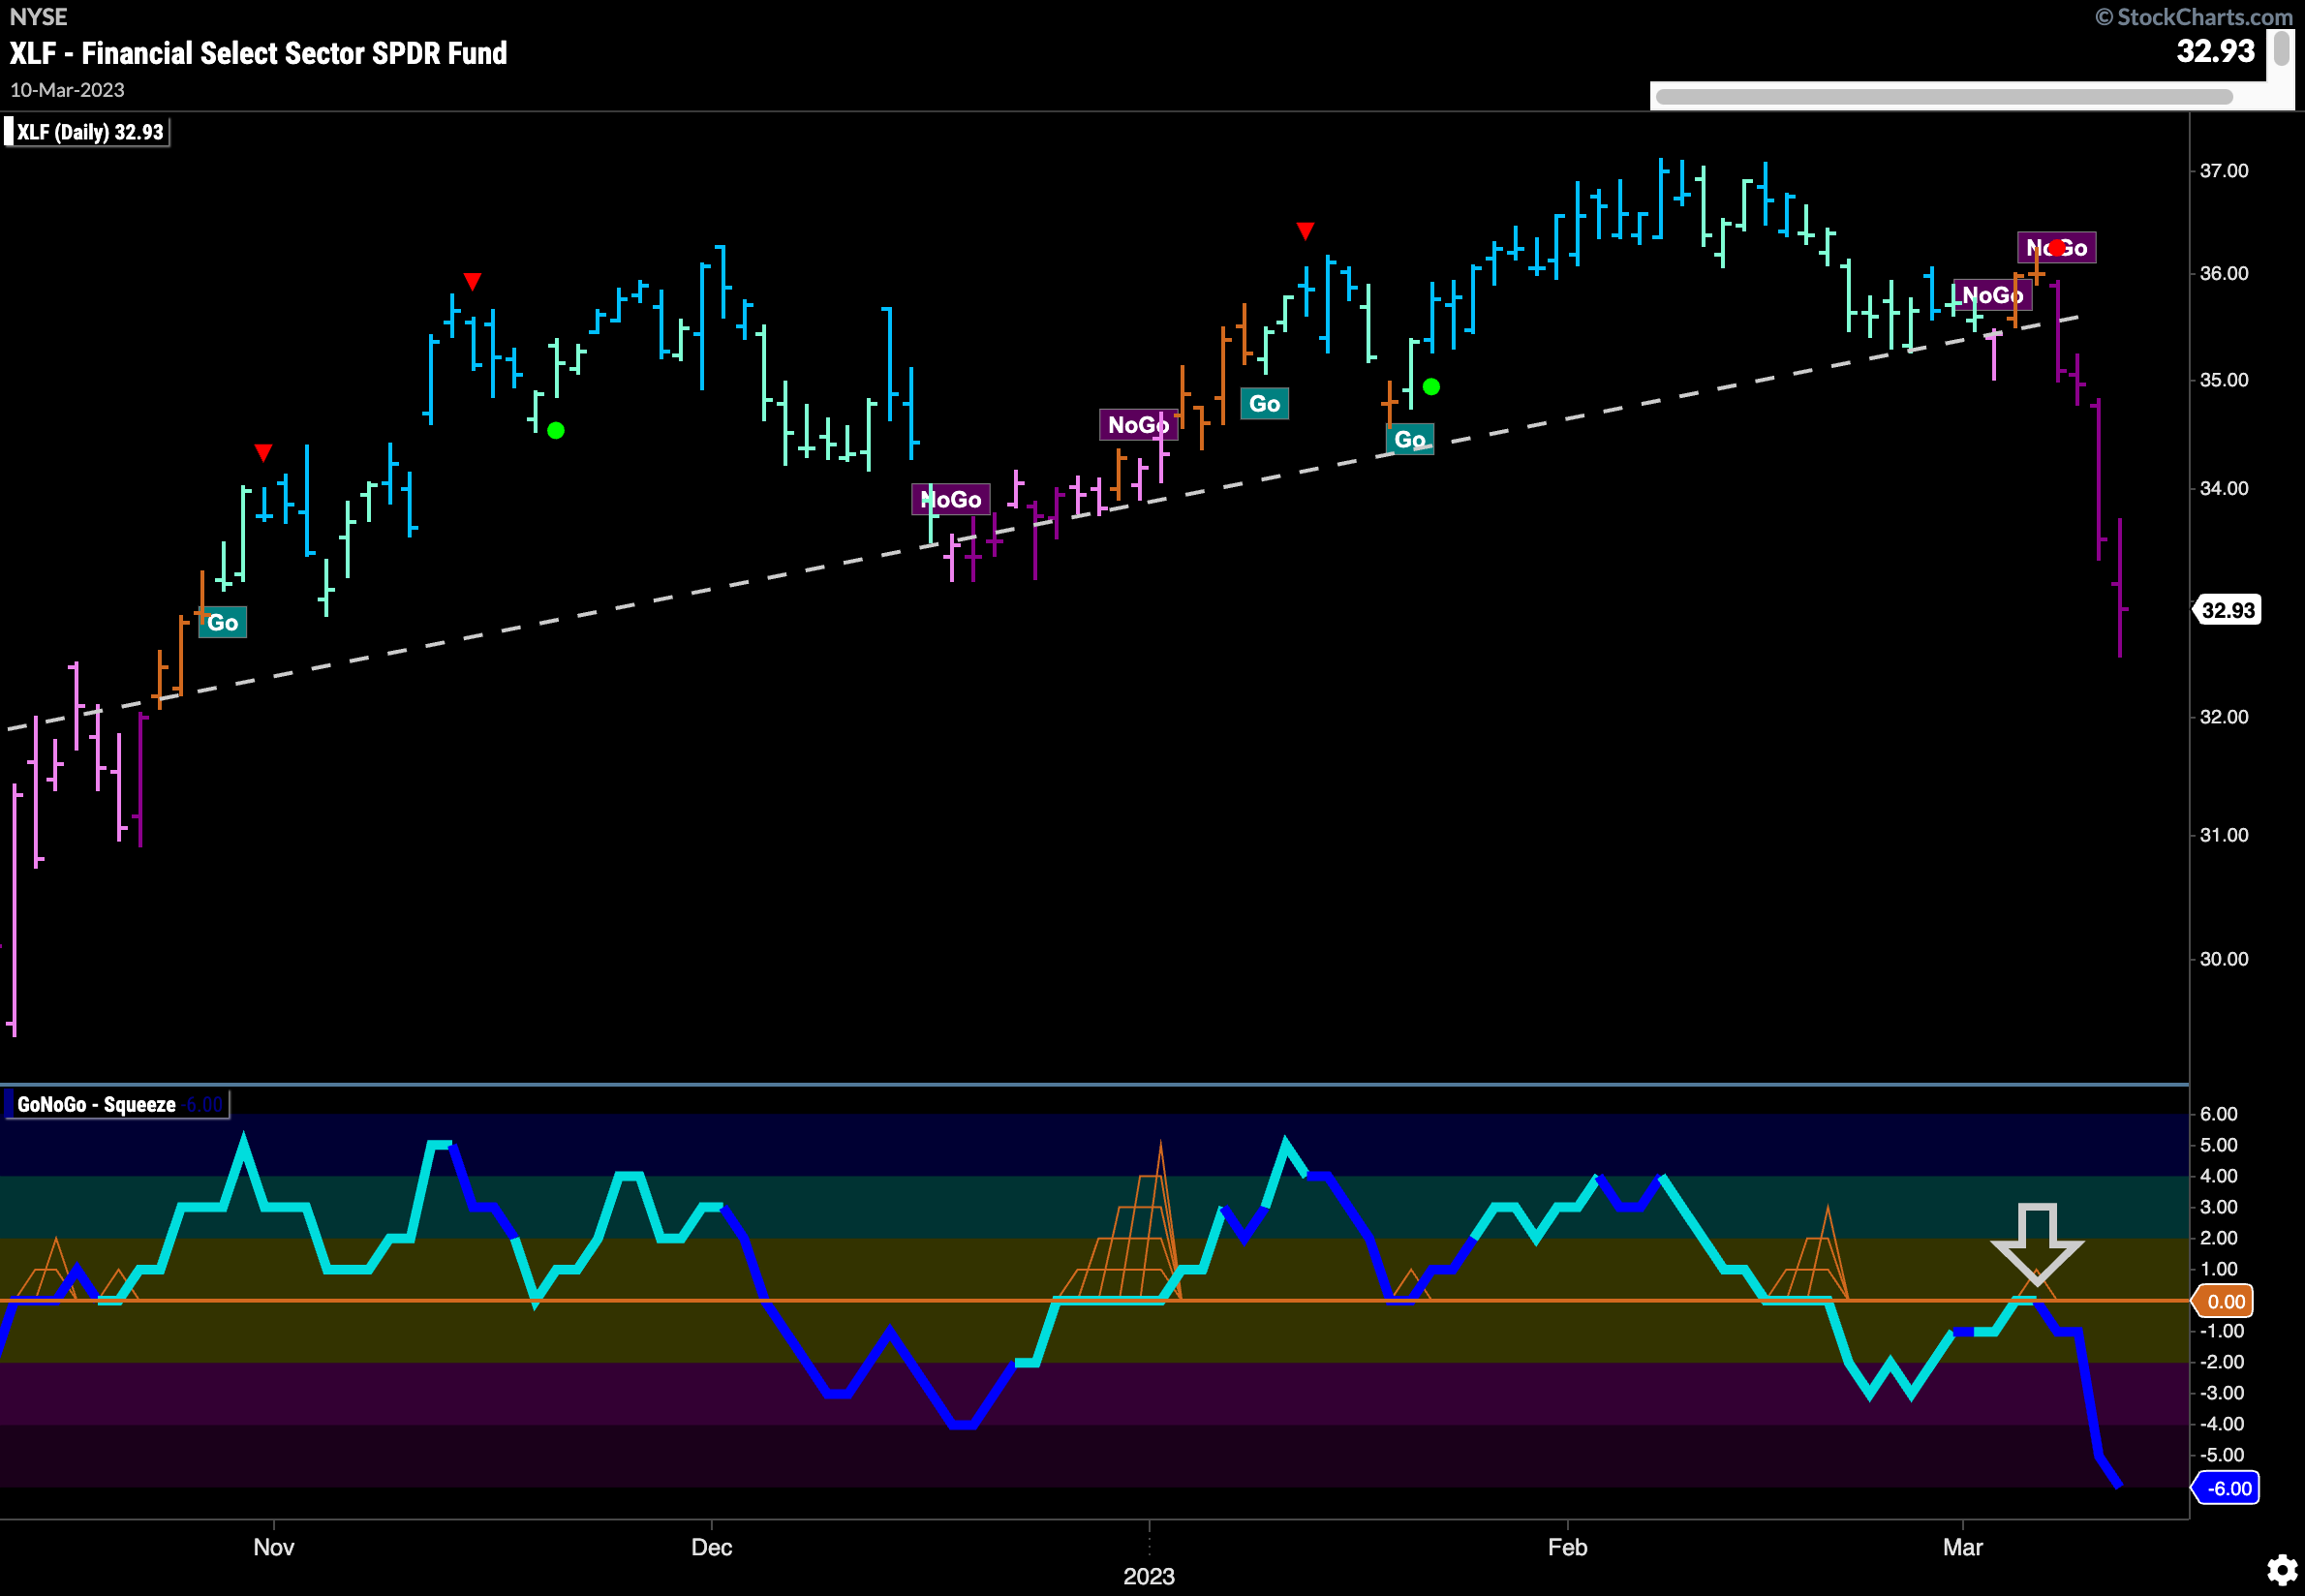
The GoNoGo Sector RelMap above shows how the technical environment is changing once again from a technical perspective. We see risky sectors such as discretionary and communications falling out of “Go” trends. A bearish map indeed. The financials sector paints a string of strong “NoGo” bars last week as it helps drag price lower. The chart below shows how sharp that move has been in $XLF. GoNoGo Oscillator broke below zero a few weeks ago while GoNoGo Trend was painting weaker aqua bars. Following suit, a “NoGo” trend took hold as price crashed through support from the upward sloping trend line. Now, we are in oversold territory on heavy volume.
Goldman Sachs Set for Further Trouble?
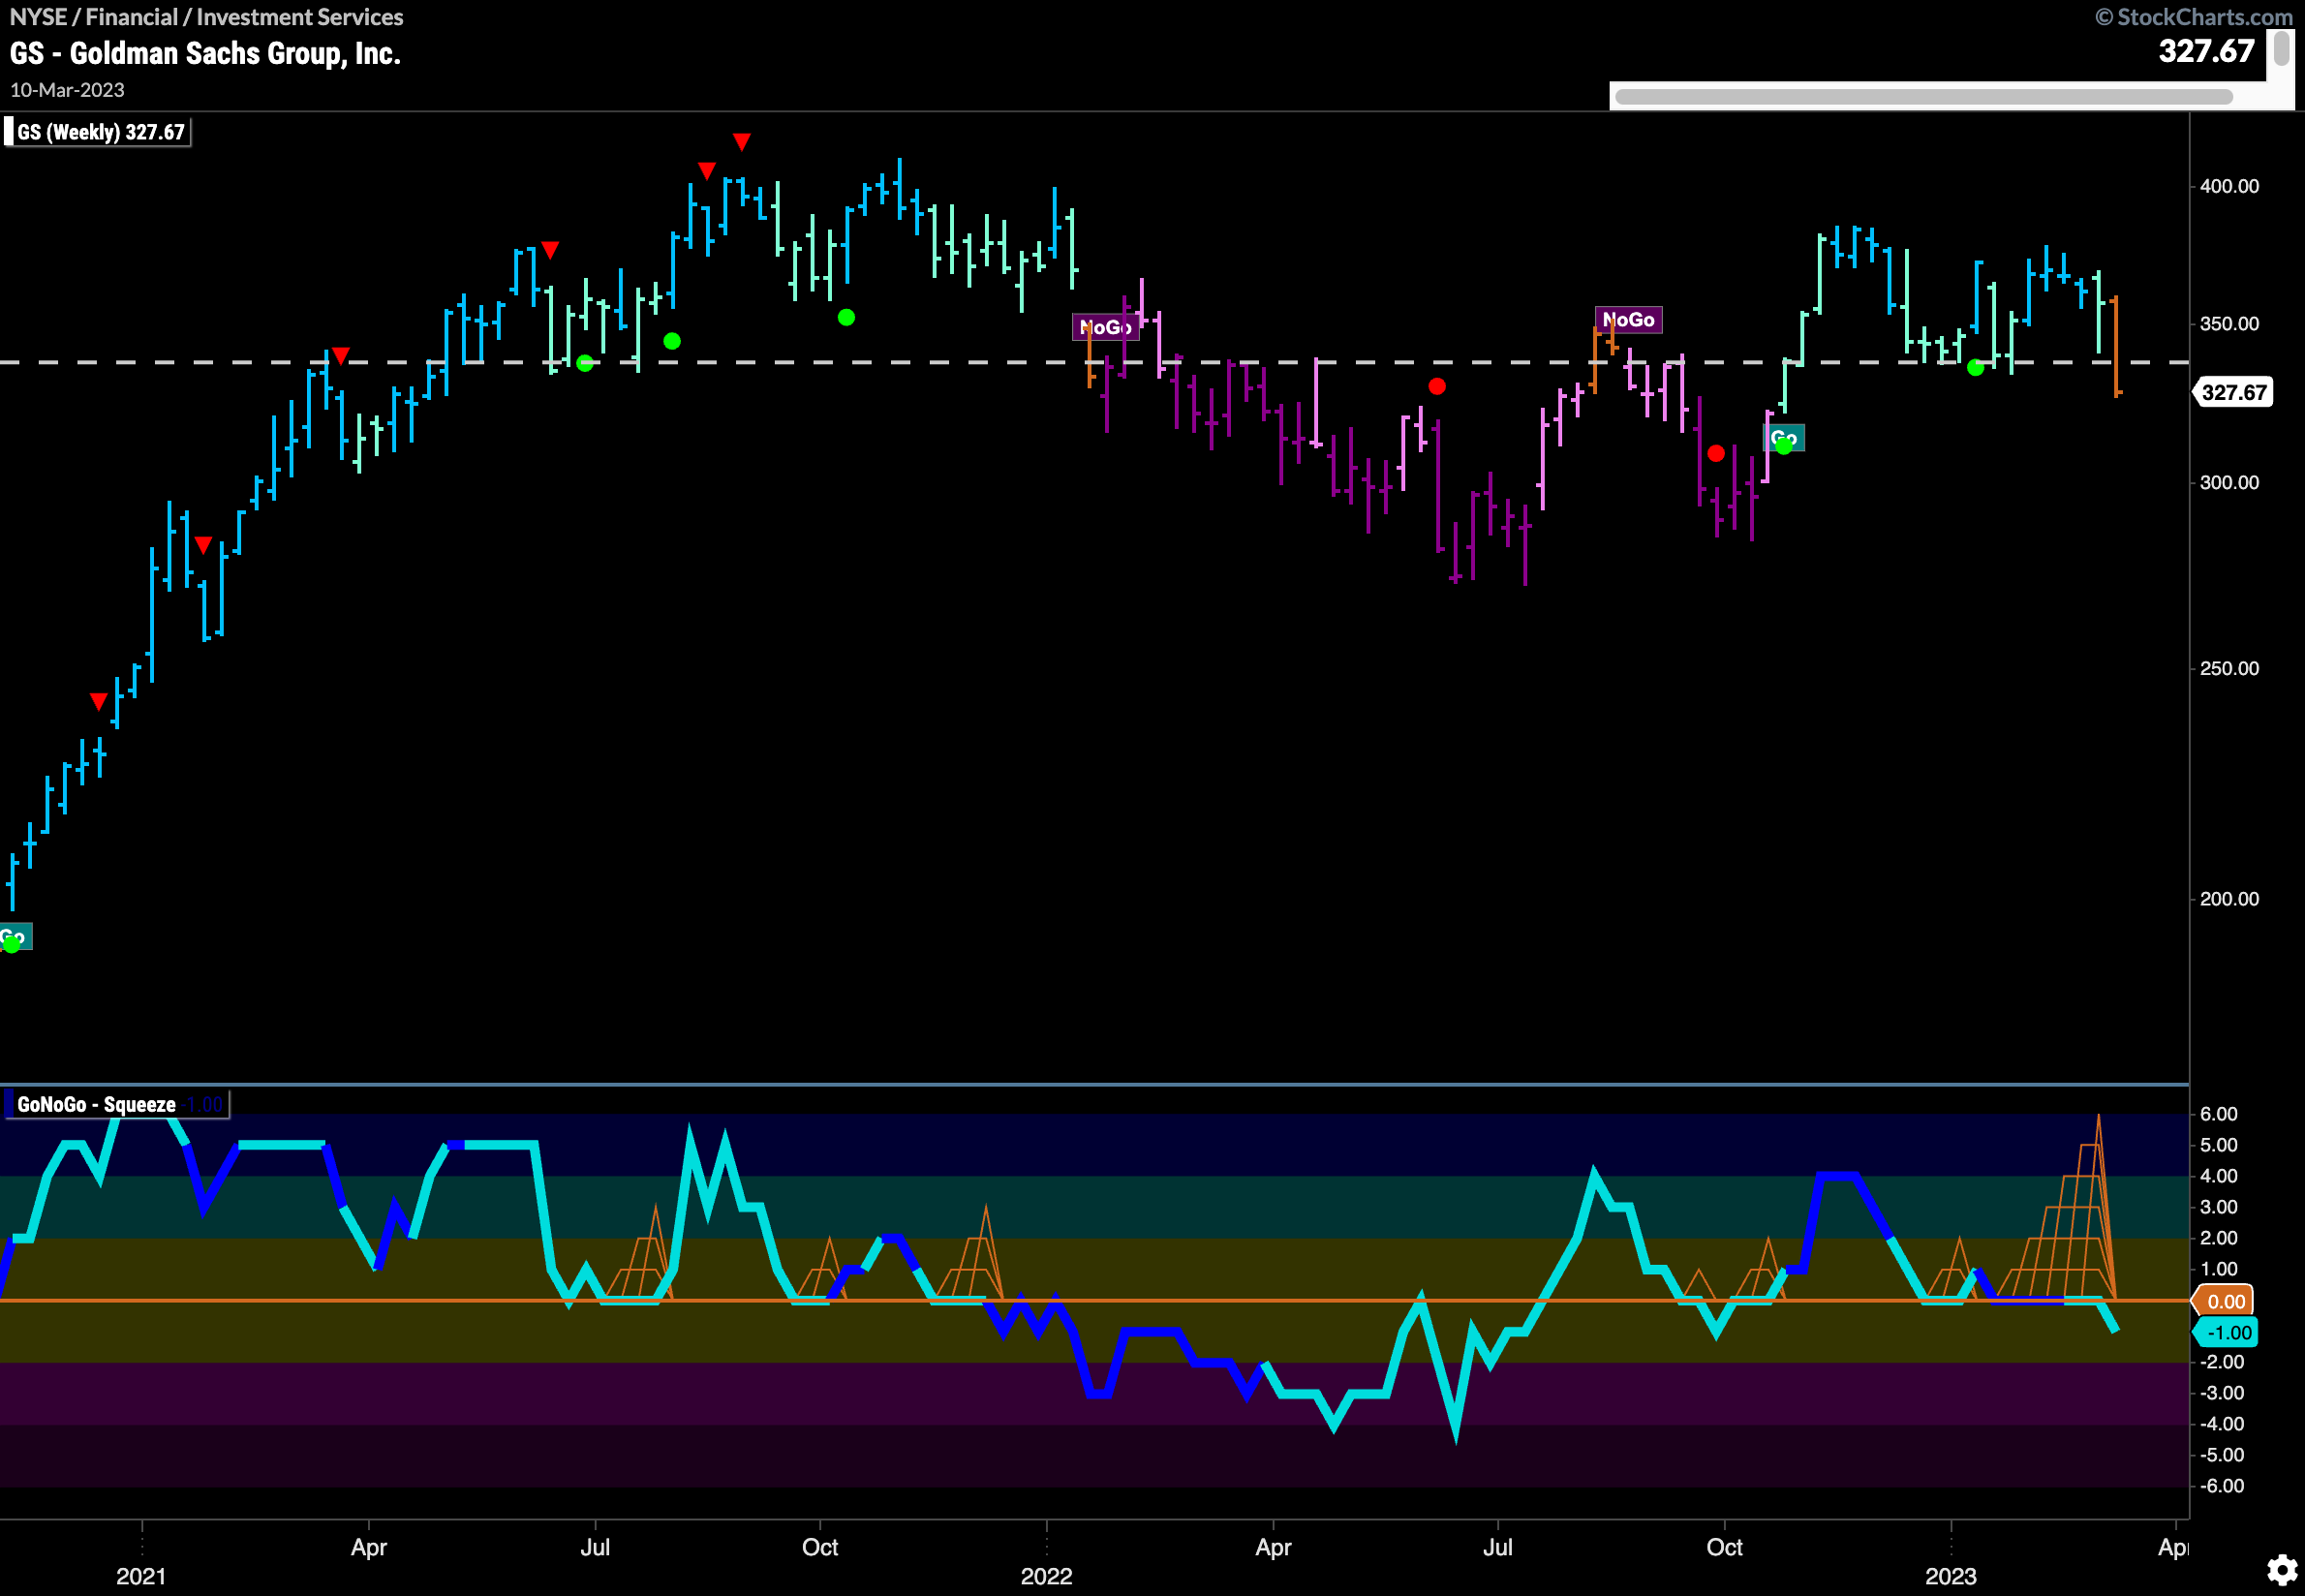
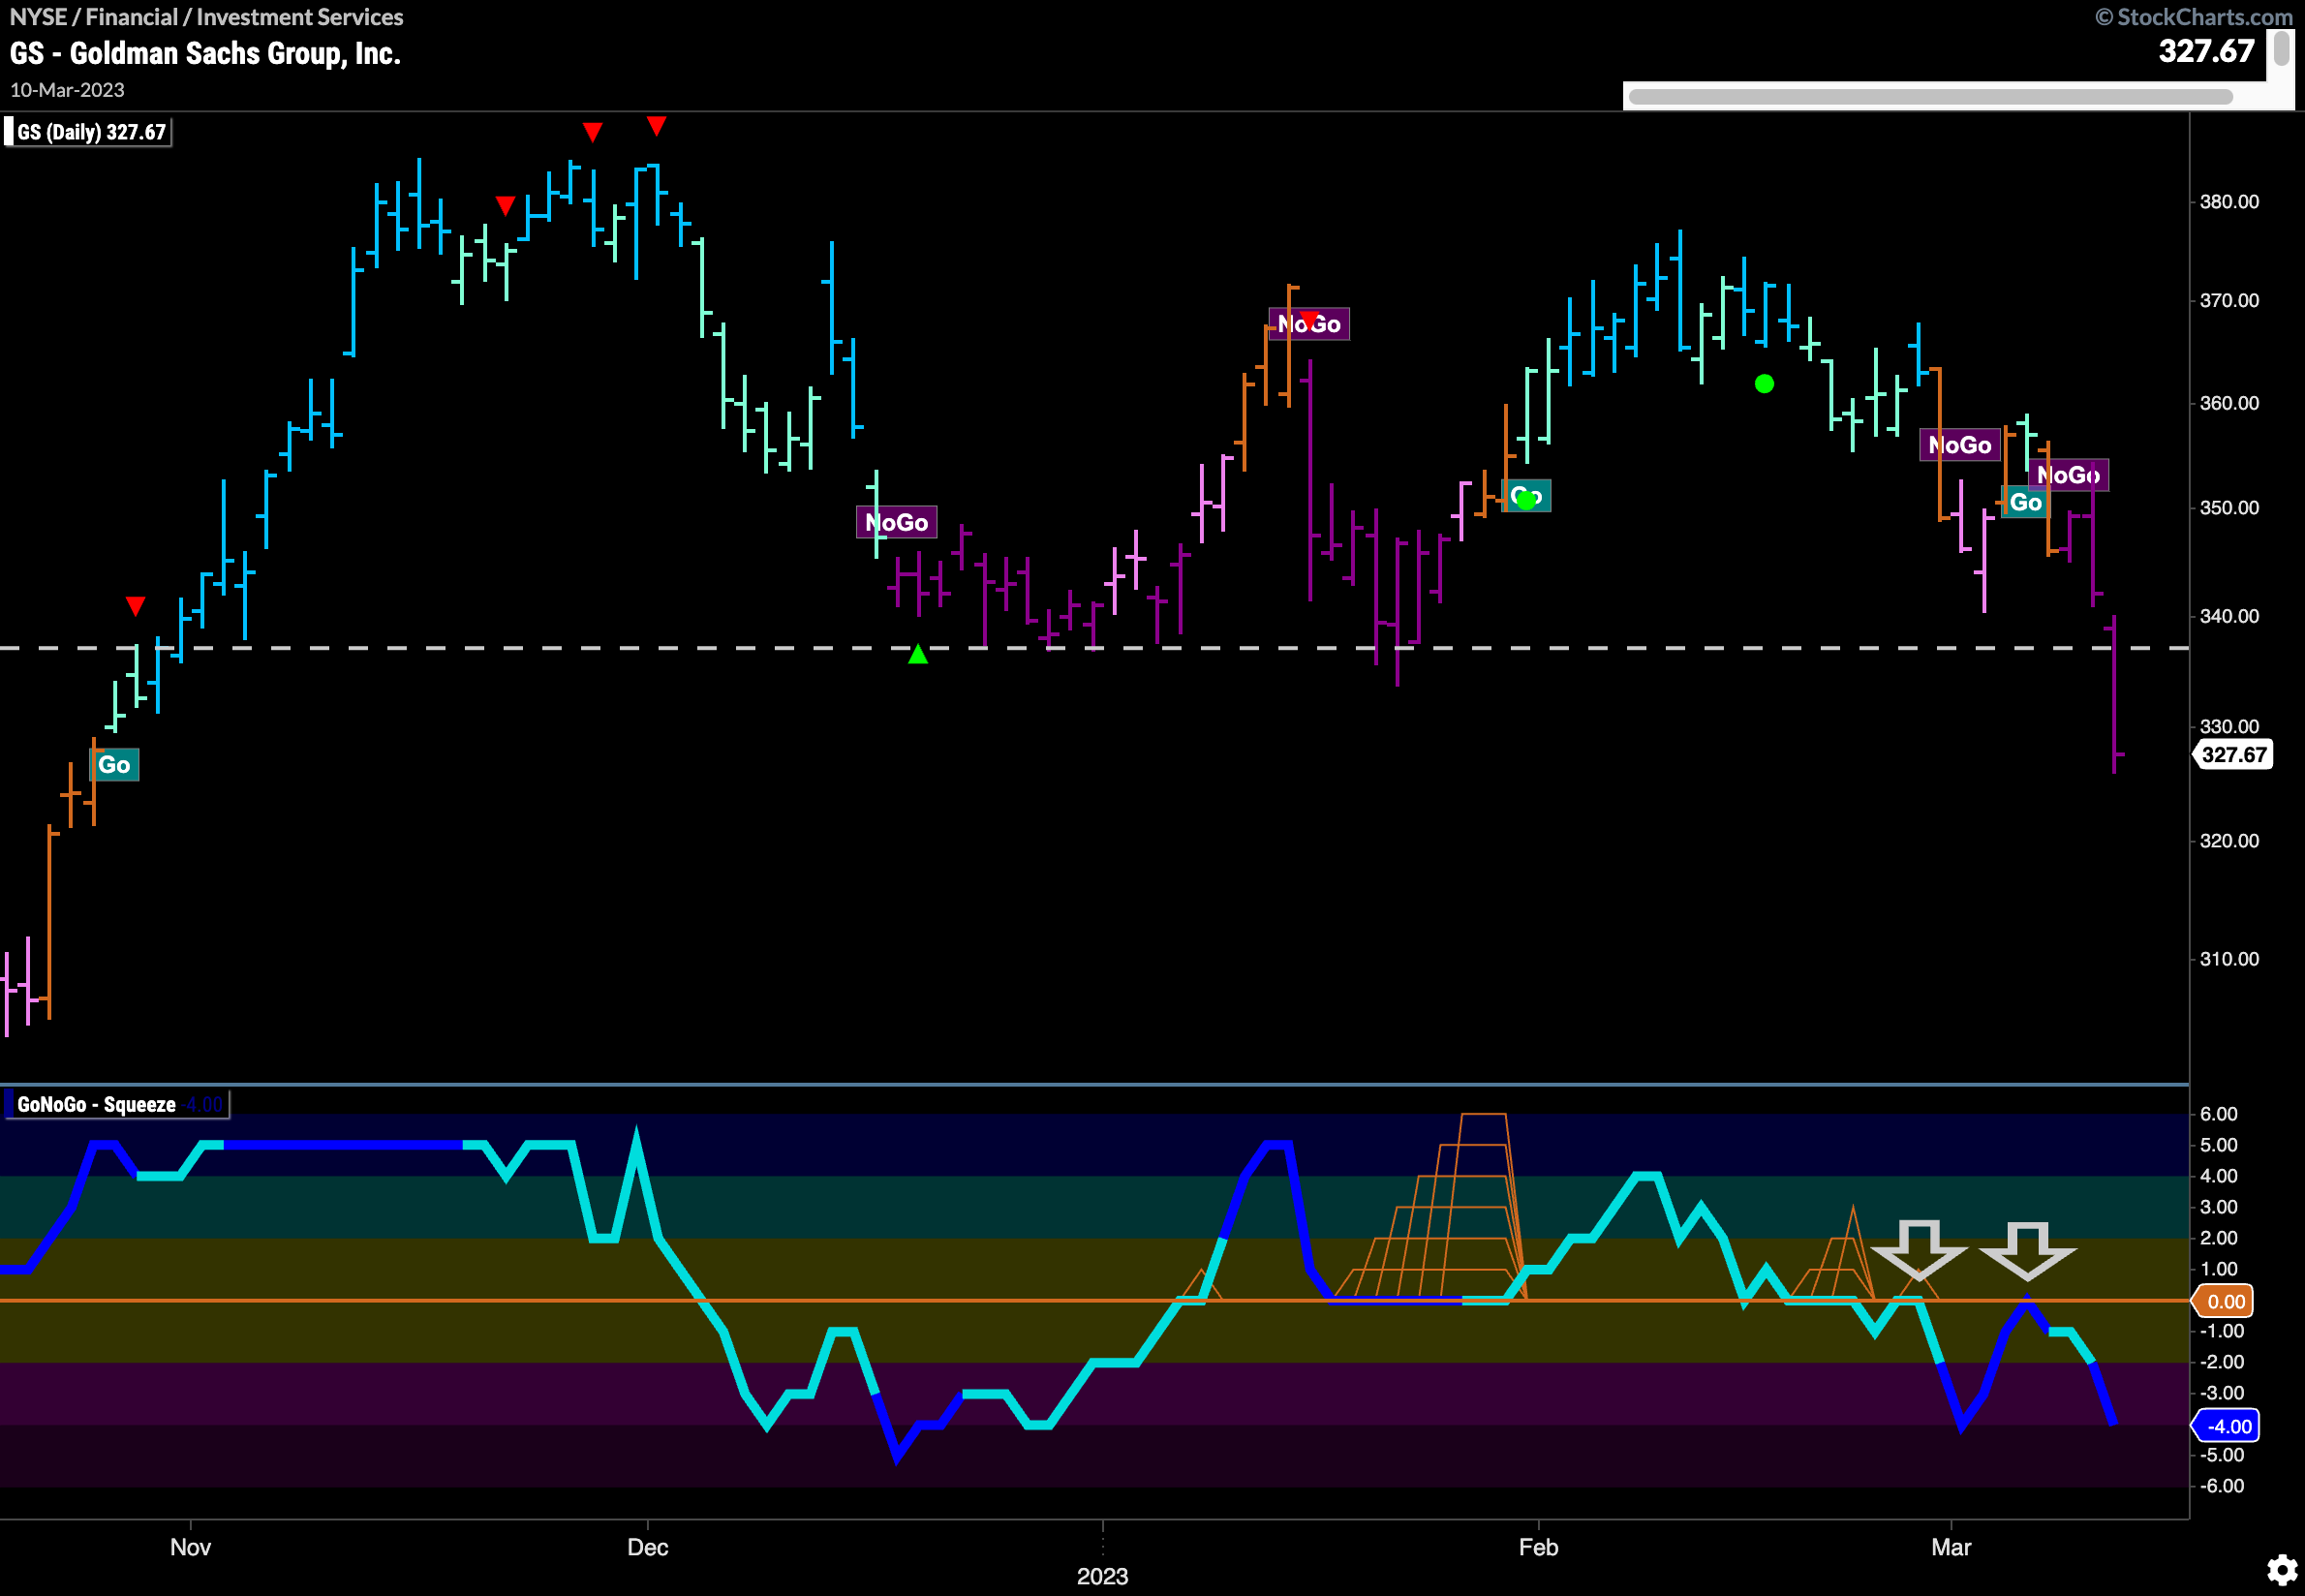
The chart below shows the price of $GS with the GoNoGo Charts full suite of tools applied. We can see how prior to breaking below support, GoNoGo Oscillator failed to hold the zero line. As GoNoGo Trend struggled to paint consistent trend colors, GoNoGo Oscillator tested the zero line from below and was rejected twice before price finally fell below horizontal support levels. With a “NoGo” trend in place, GoNoGo Oscillator in negative territory, and some space below, it will be interesting to see how much further price falls.
$GS on a weekly time frame seems to confirm what we just saw in the daily chart. GoNoGo Trend has been unable to maintain “Go” bars as last week’s price action saw the indicator paint an amber “Go Fish” bar. GoNoGo Oscillator has broken out of a Max GoNoGo Squeeze into negative territory as price falls below a level that has been both support and resistance over the length of the chart. We will look to see if price falls lower and GoNoGo Trend starts to paint “NoGo” bars.
