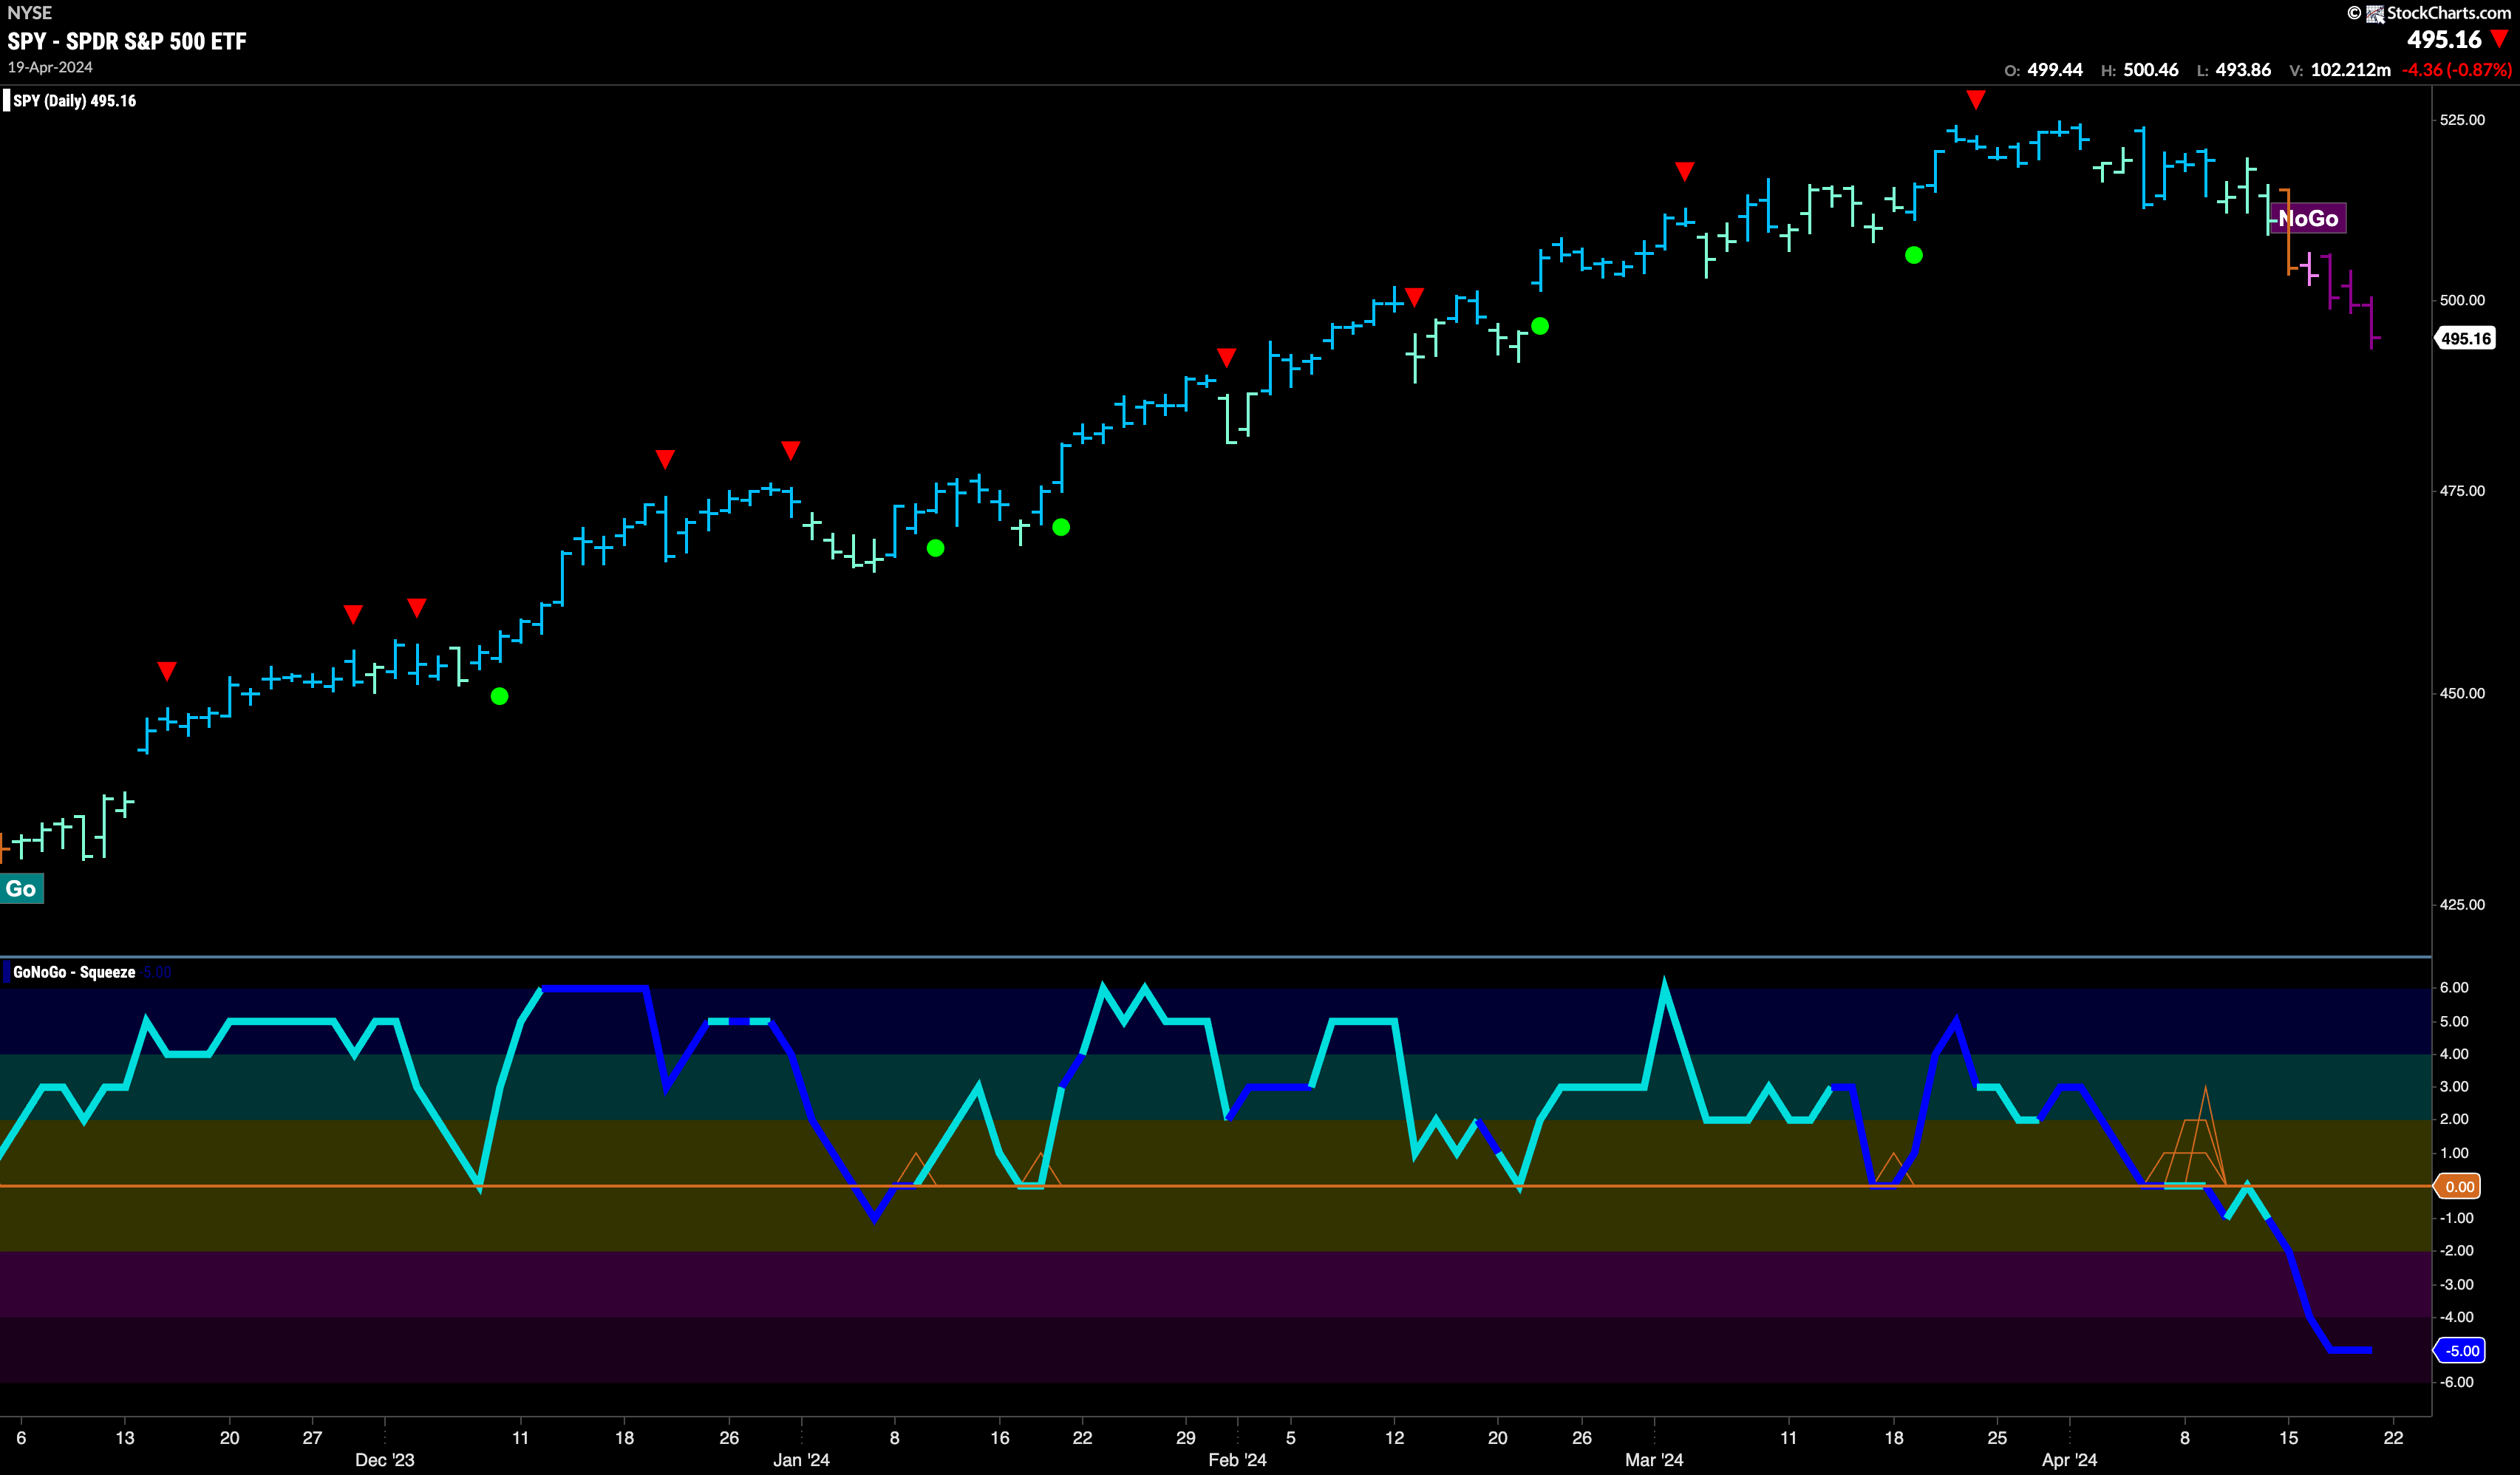
Good morning and welcome to this week’s Flight Path. The equity “Go” trend is over. We saw a pink “NoGo” bar following an amber “Go Fish” bar of uncertainty and then that was followed by strong purple bars as the week continued. Treasury bond prices remained in a strong “NoGo” trend as we saw an entire week of uninterrupted “NoGo” strong purple bars. Commodity prices hung on through a period of weakness to paint a strong blue bar at the end of the week. The dollar showed strength all week as GoNoGo Trend. colored all of the bars a strong blue “Go”.

Equities Roll Over into “NoGo”
Last week we noted the weakness we had seen in the “Go” trend. The last high triggered a Go Countertrend Correction Icon (red arrow) that indicated prices may struggle to go higher in the short term. Prices moved mostly sideways or away from the high since then and this past week saw the technical environment change. First, an amber “Go Fish” bar reminded us that there was uncertainty in the current trend, and that quickly gave way to a pink “NoGo” bar. Without looking back, the latter part of the week saw strong purple “NoGo” bars as price moved progressively lower.
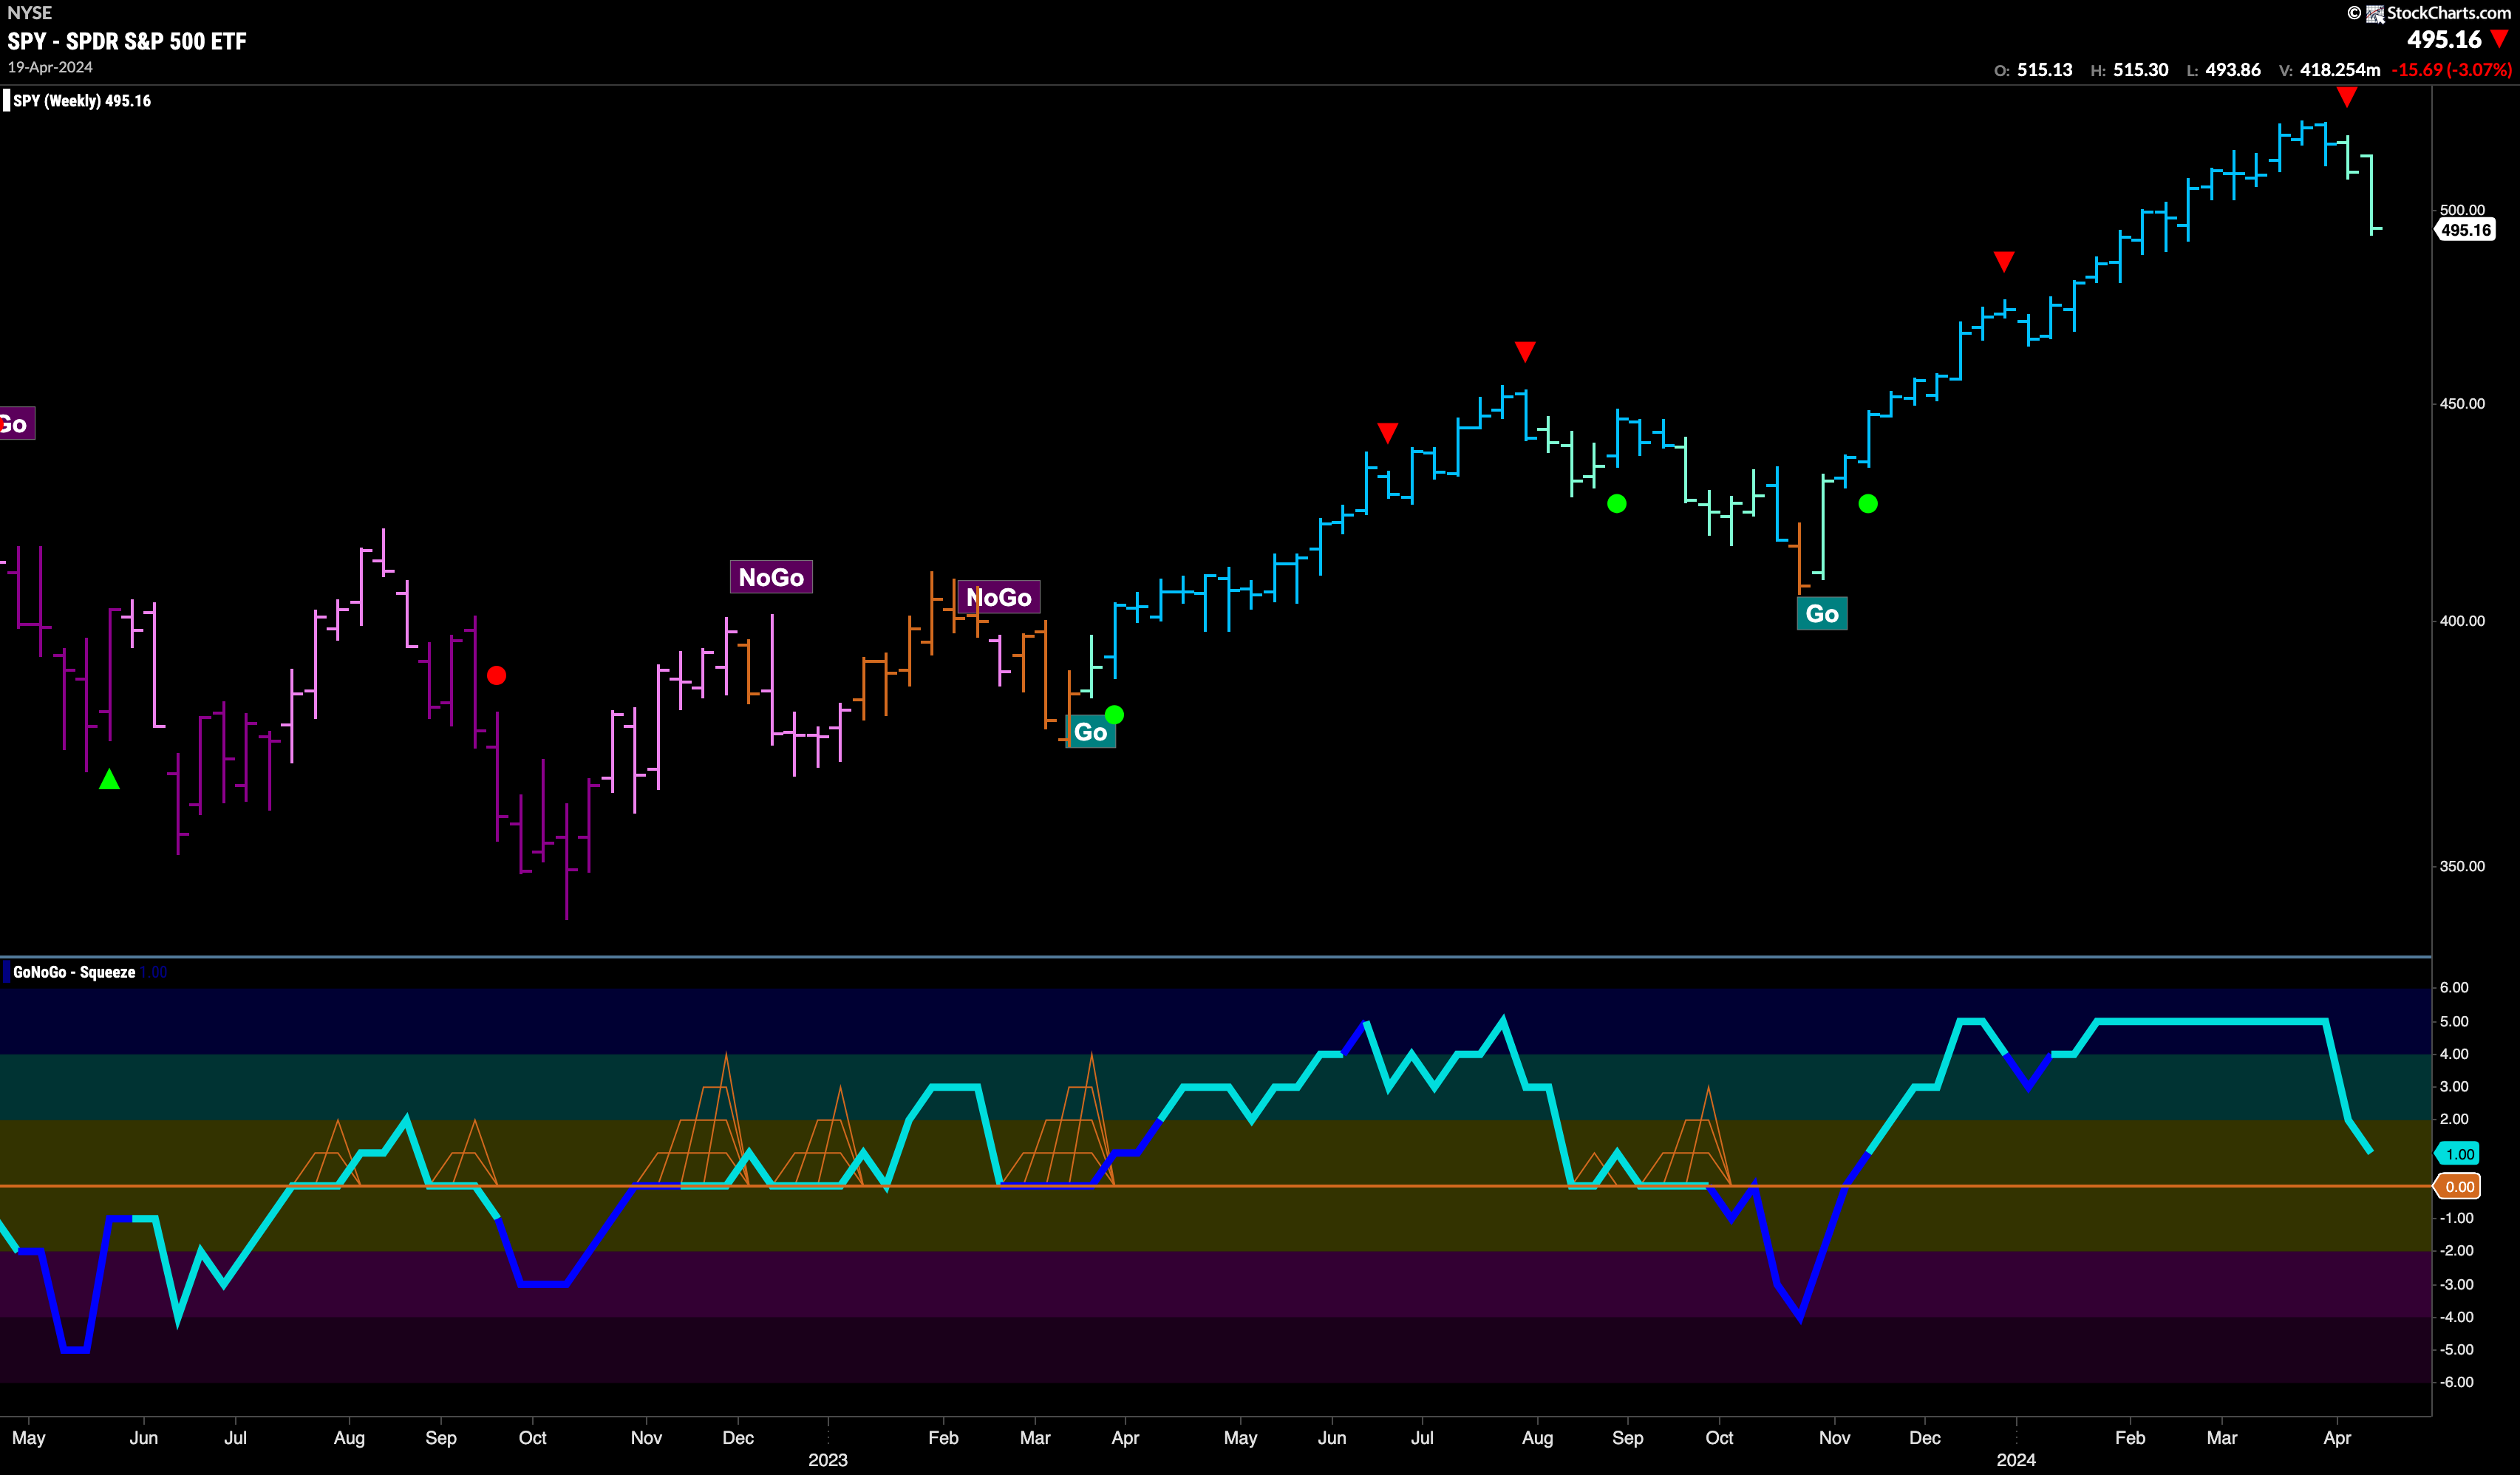
Last week’s paler aqua “Go” bar brought with it a Go Countertrend Correction Icon (red arrow). This week we see price falling further from the most recent high as GoNoGo Trend paints a second weaker aqua bar. We look to the oscillator panel and see that it is fast approaching the zero line. That will be the next important test of this “Go” trend. As price continues to fall, we will want to see support found by the oscillator at zero. If it finds it, we will expect price to set a new higher low and can look for signs of trend continuation. If the oscillator fails to find support at the zero line, we could well see a deeper correction and possible trend change in the price panel.
Rates in Strong “Go” Trend
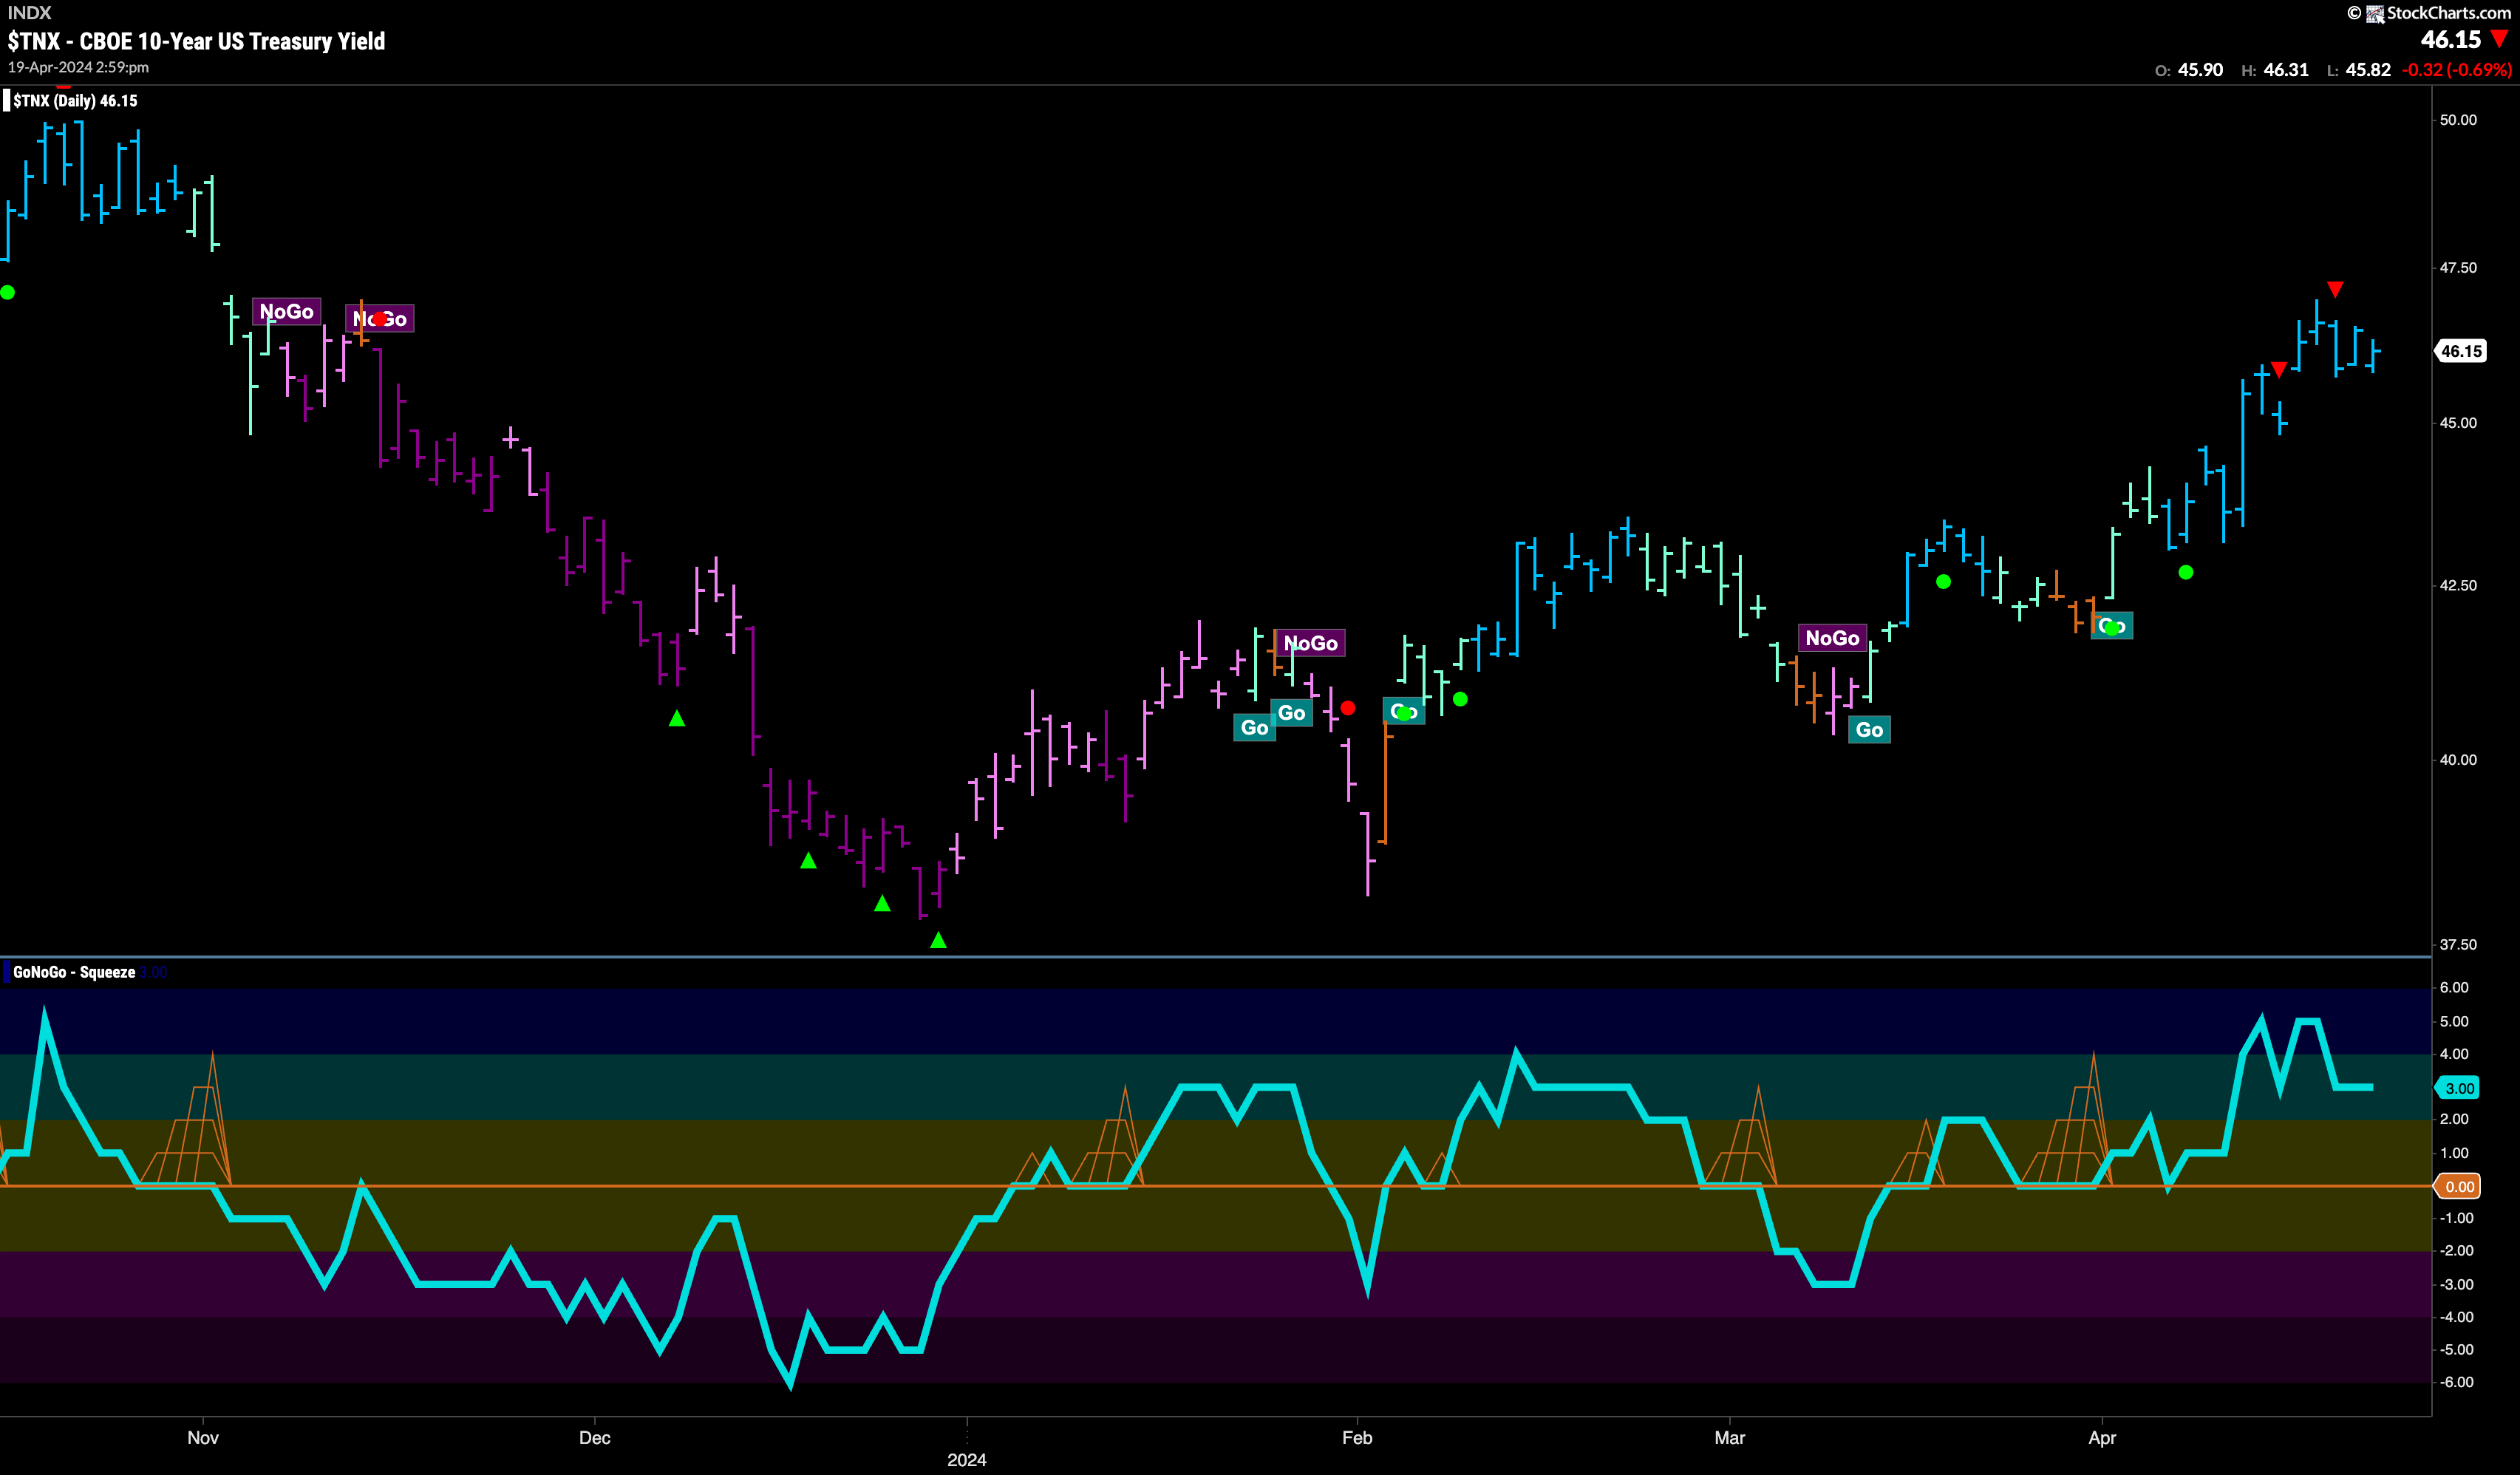
We saw a week of strong blue “Go” bars in treasury rates. After hitting a high in the beginning of the week the chart triggered a Go Countertrend Correction Icon (red arrow) and we know that it will be hard for price to rise higher in the short term. GoNoGo Oscillator is in positive territory but no longer overbought. After some consolidation at these levels we will look to see if the trend can continue.
Dollar Takes a Pause at New Highs
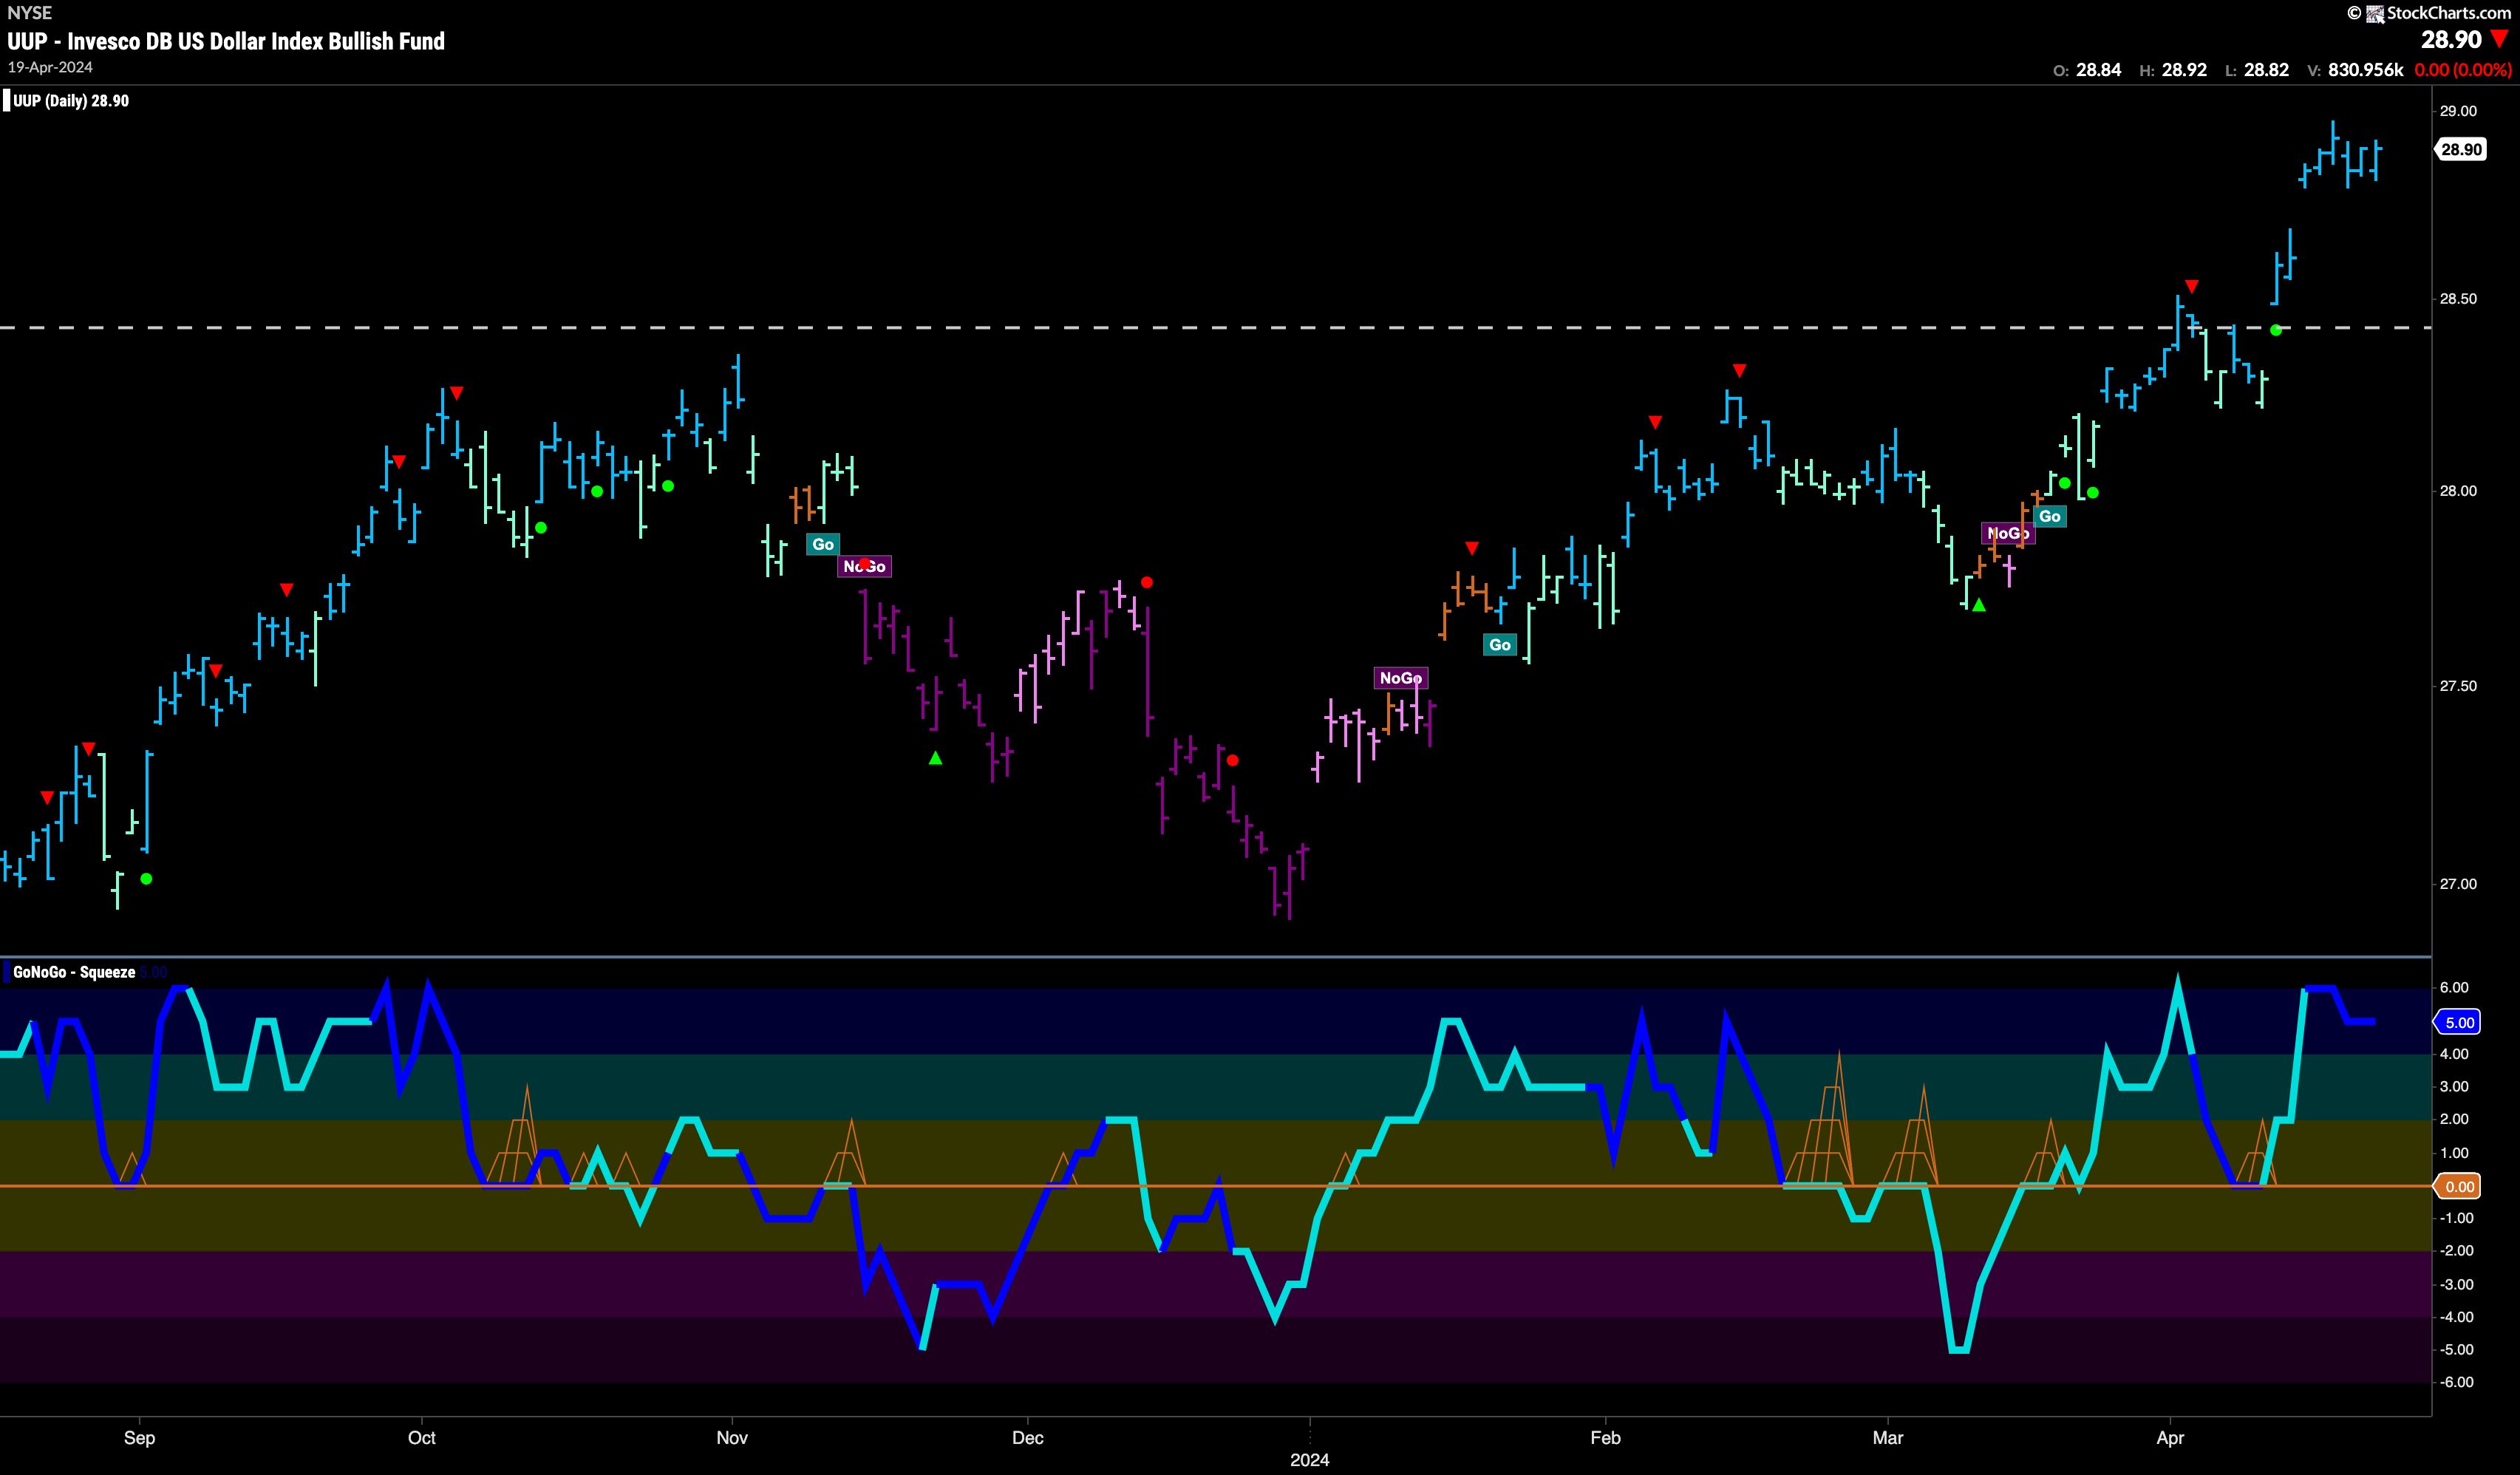
After last week’s gap higher, we saw price consolidate at these new higher levels. GoNoGo Trend painted a full week of strong blue bars and we will look at the top of that gap for potential support going forward. GoNoGo Oscillator remains overbought at a value of 5 and volume is heavy. We will watch to see if momentum wanes, giving us a Go Countertrend Correction Icon on the chart and leading to further price consolidation.
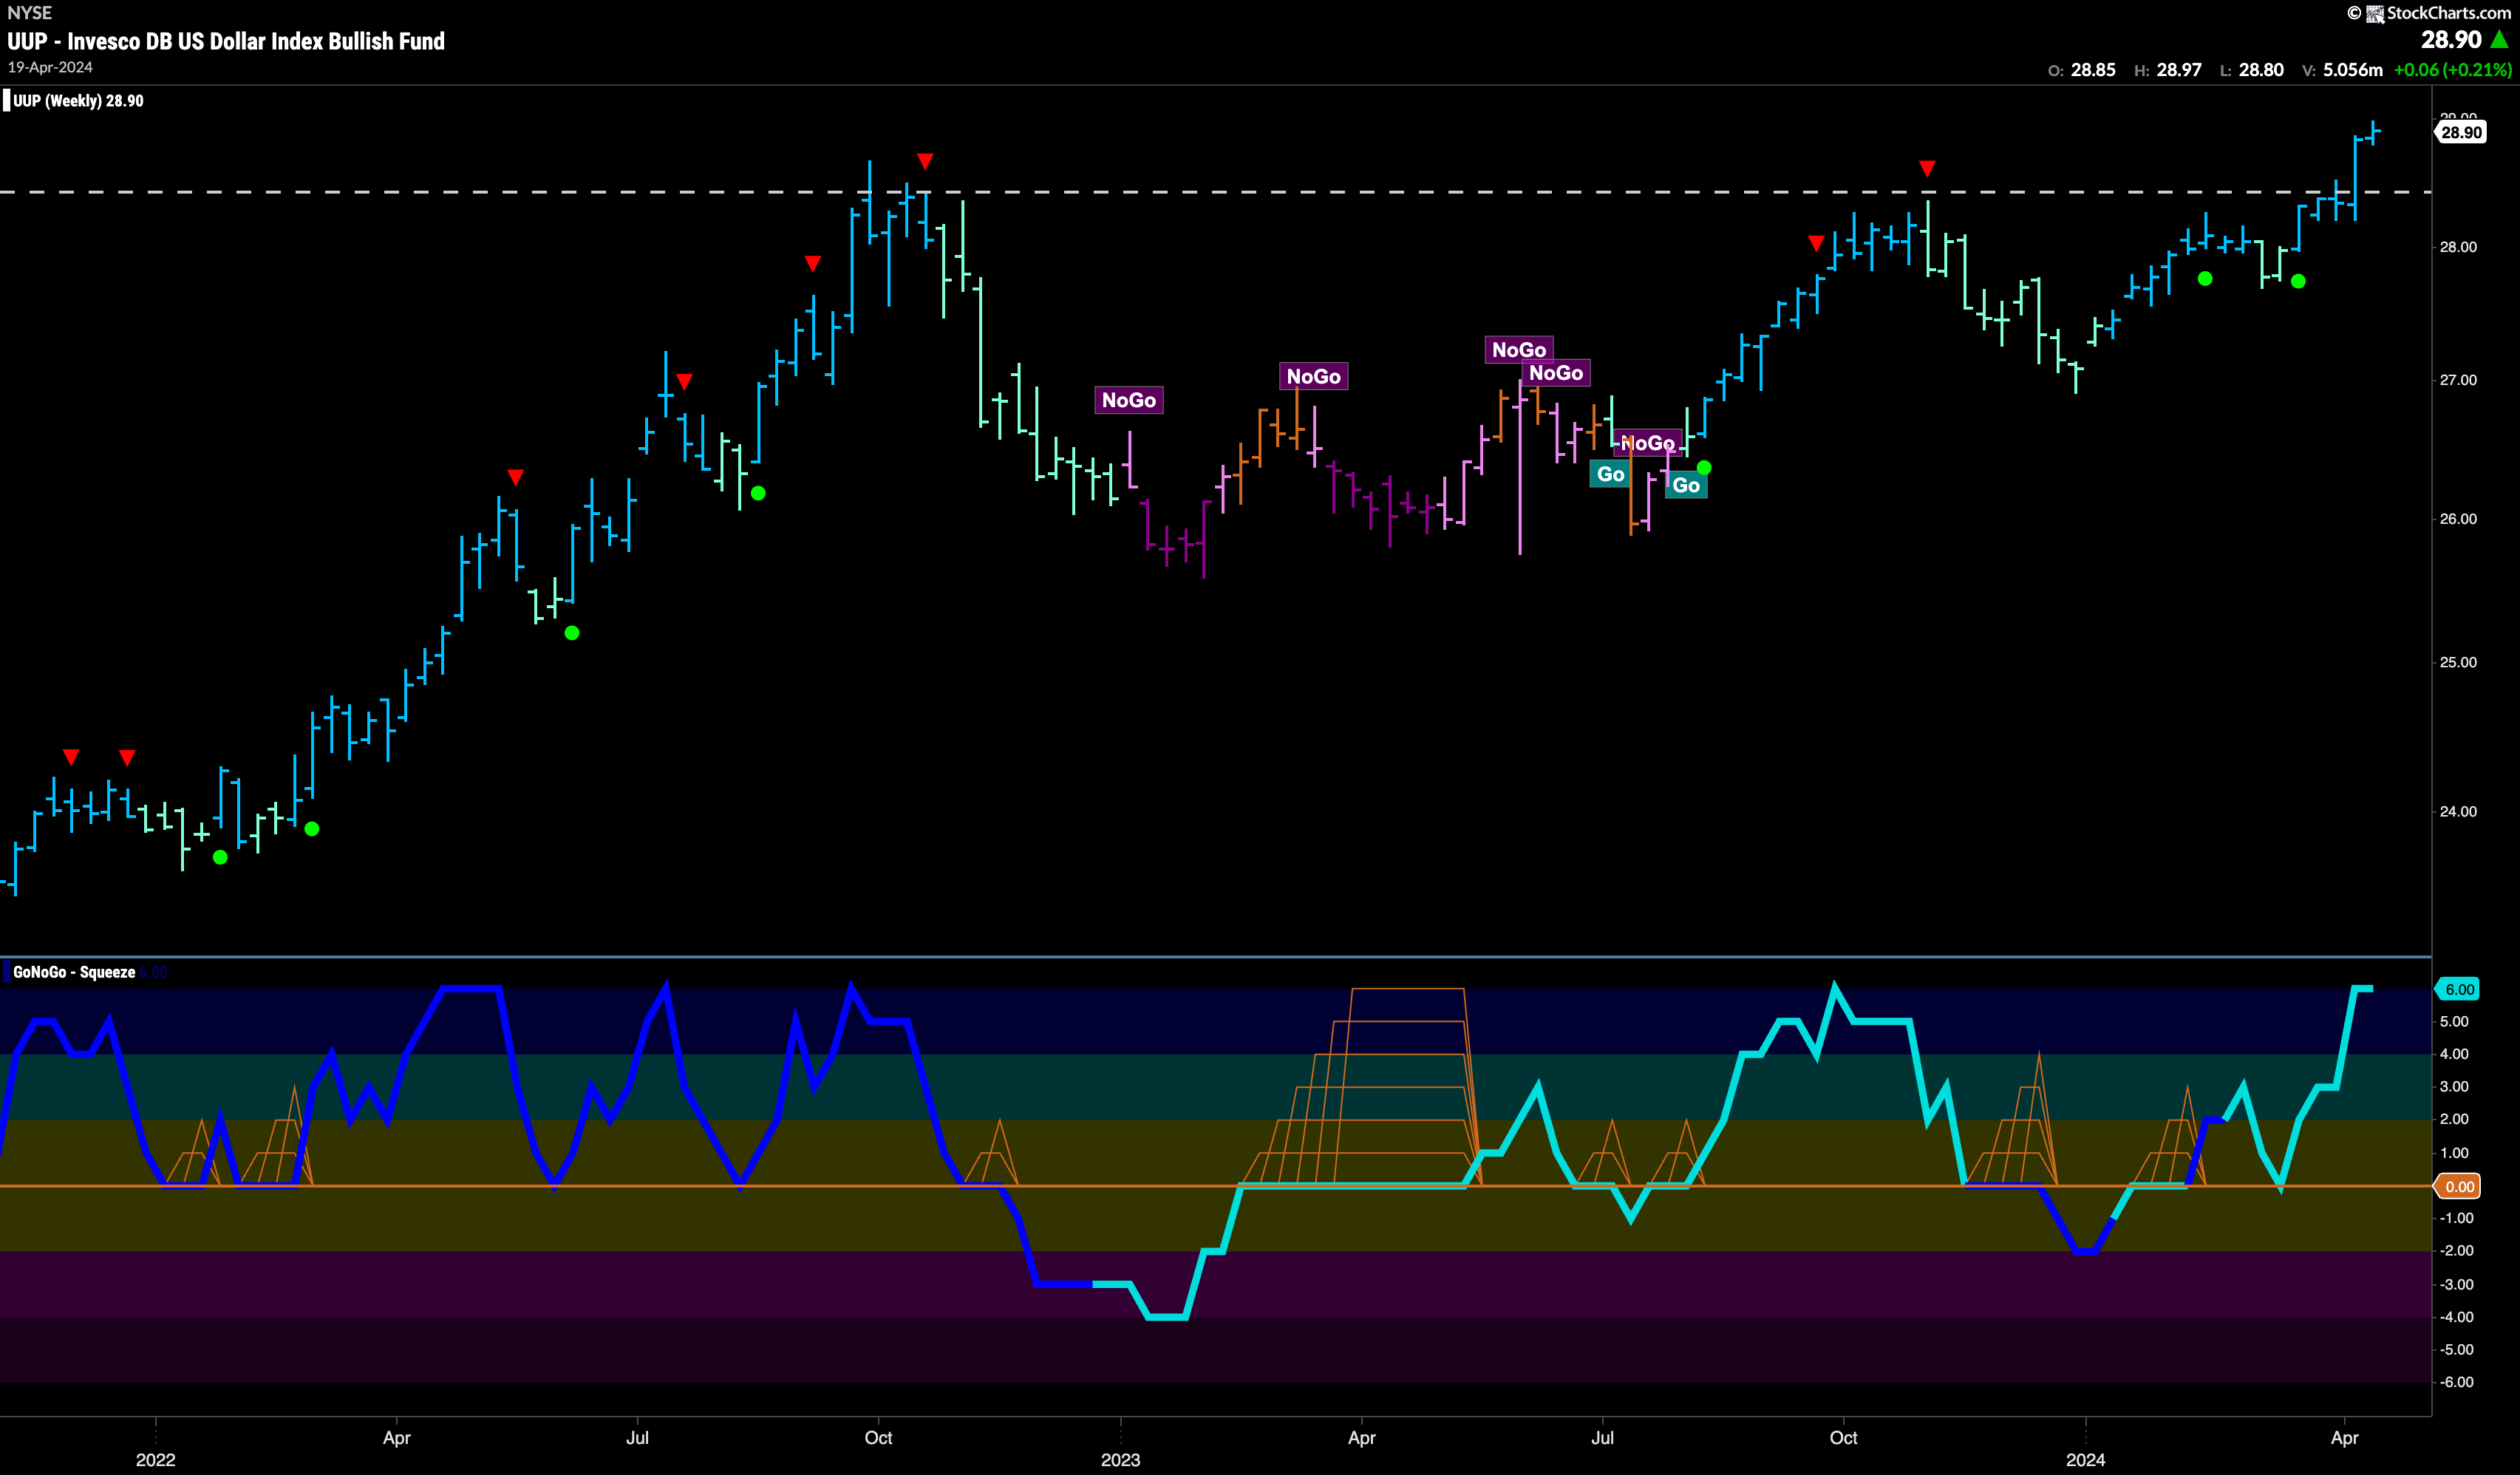
The longer term chart shows clearly where long term support should now be found. Last week’s strong price action pushed price above horizontal resistance that we see on the chart from prior highs. There is some likelihood that price takes a breath soon as momentum is overbought. As it moves back into neutral territory and potentially toward the zero line we will look for price support at the horizontal level and for oscillator support at the zero line.
Oil “Go” Trend Continues to Weaken
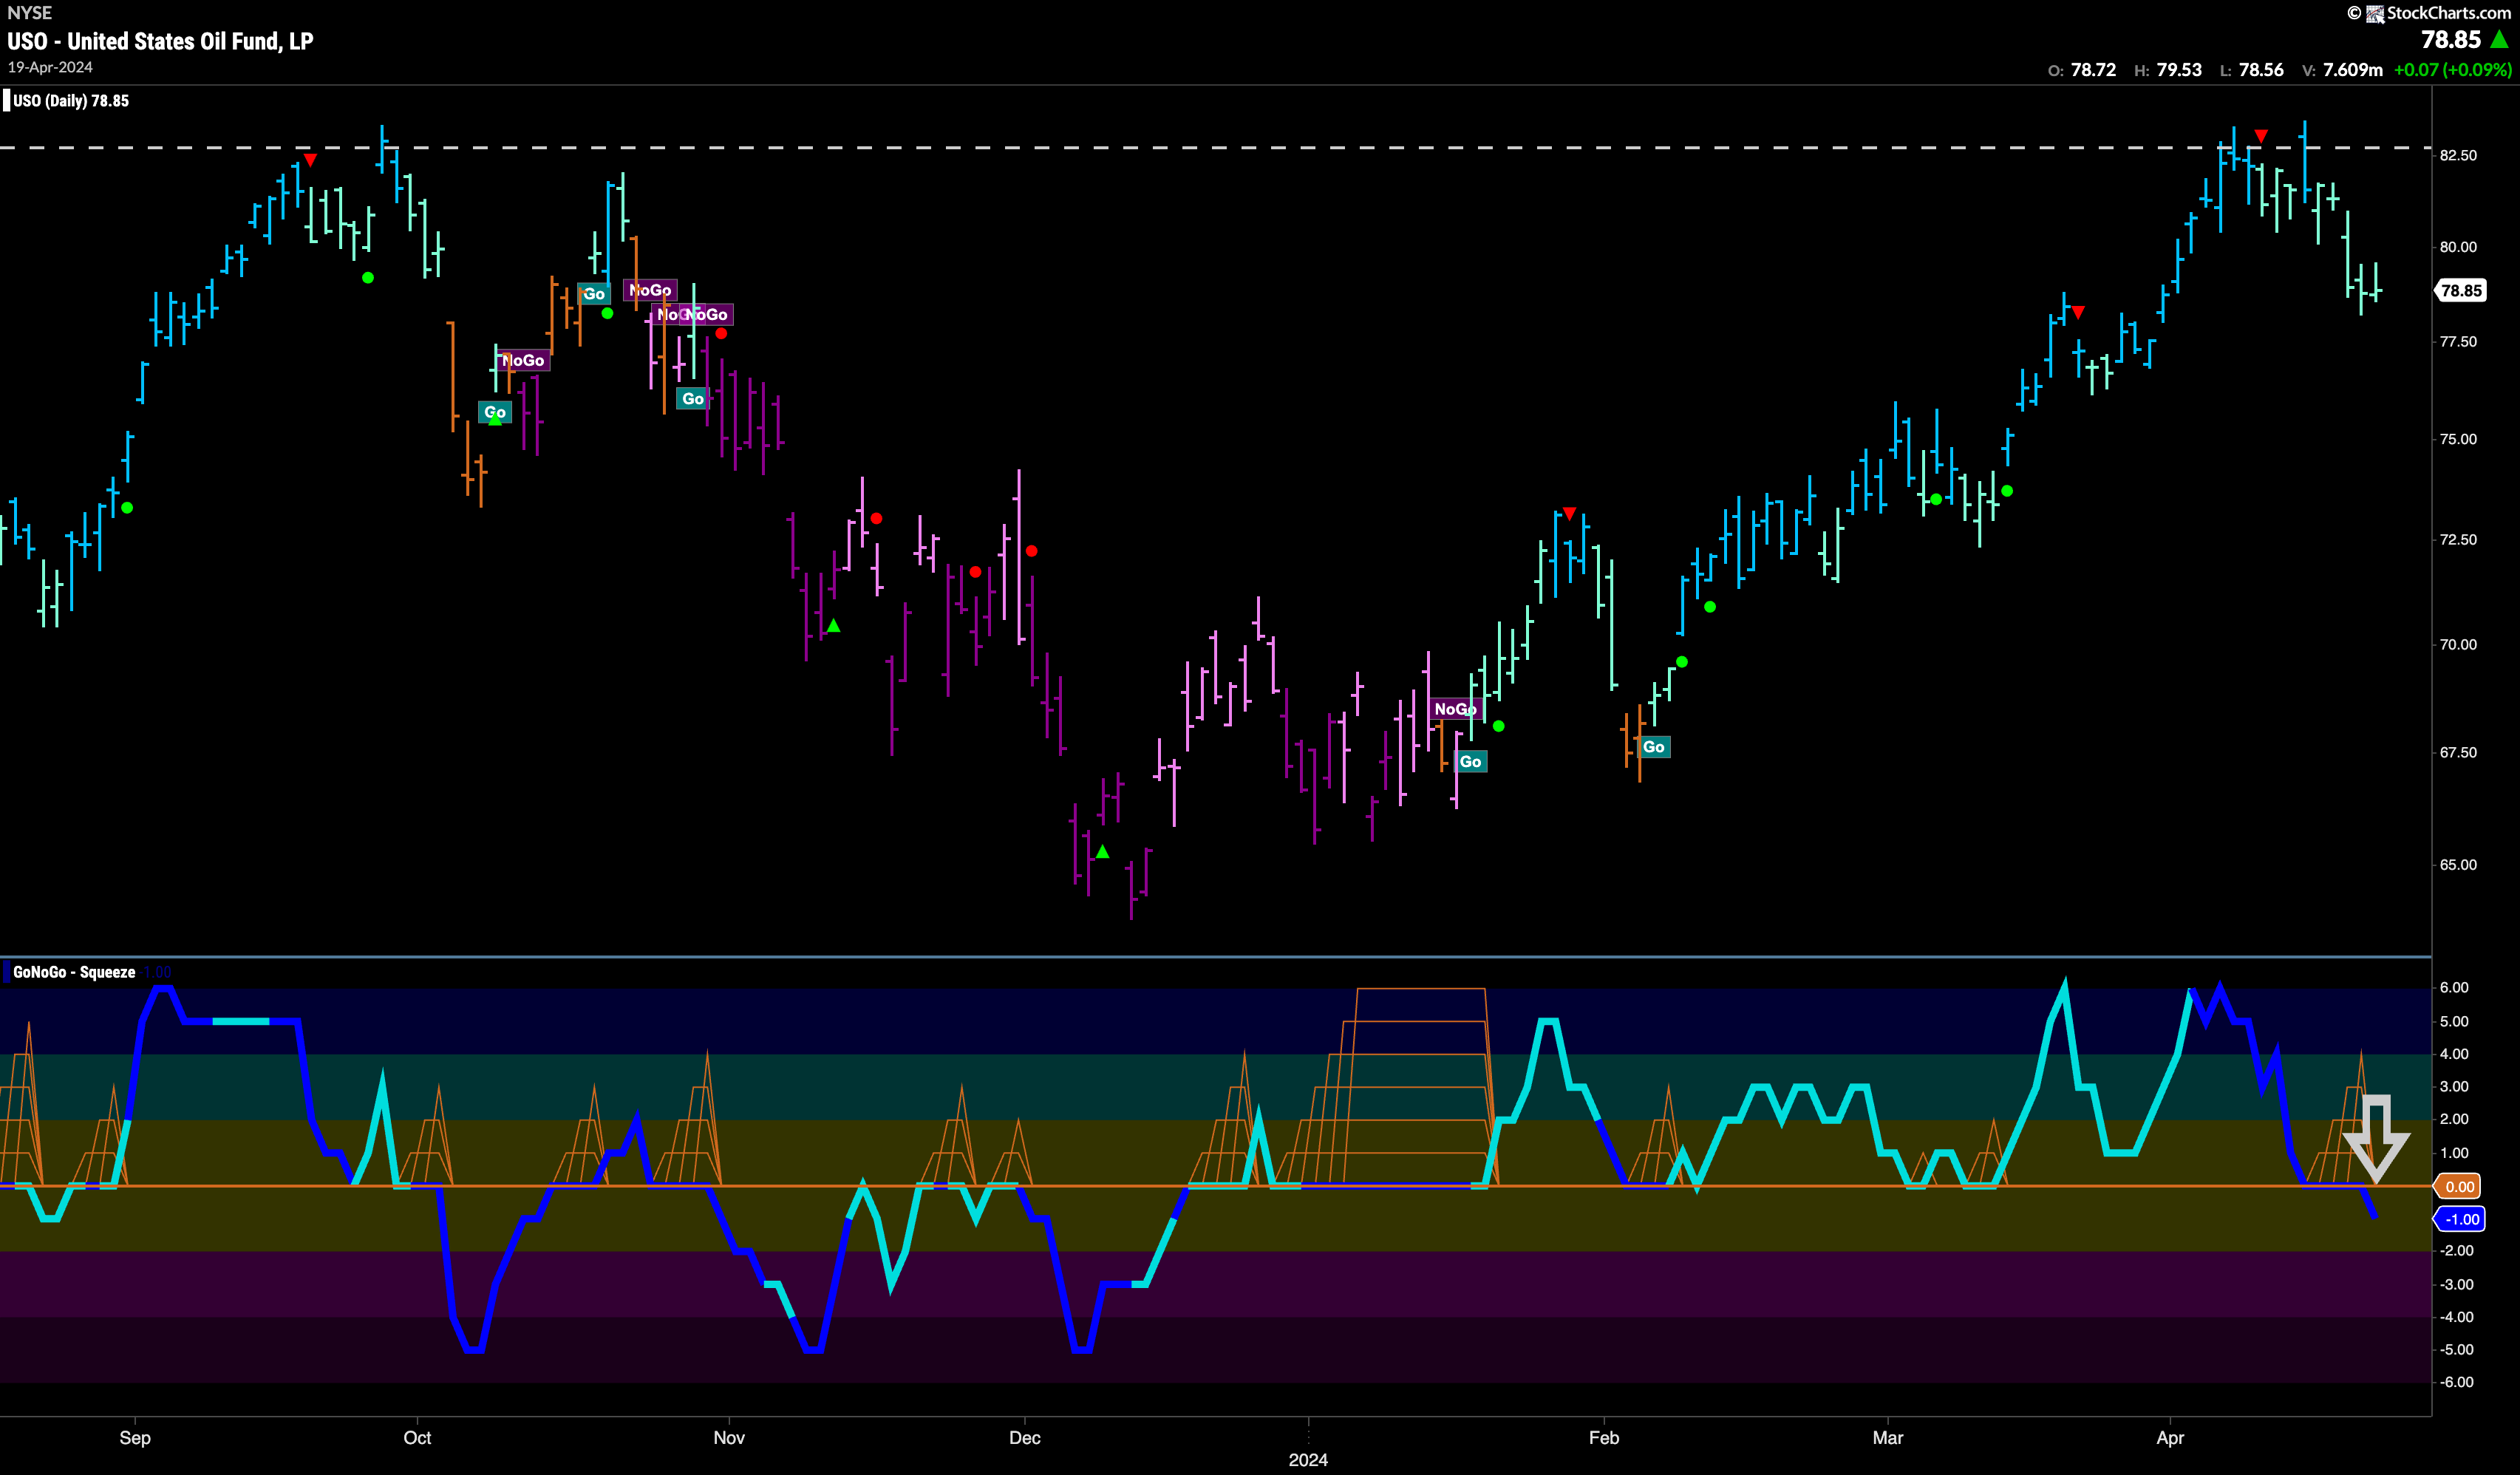
After failing to break above the resistance we see on the chart, price moved lower and GoNoGo Trend showed weakness as it painted a full week of paler aqua bars. The Go Countertrend Correction Icon (red arrow) alerted us to the possibility that price may struggle to go higher and now we ask how damaging this weakness is to the current trend. If we turn our eye to the zero line we can see that this move away from the highs has been accompanied by heavy volume. Volume remains heavy as the oscillator fails to find support at the zero line and moves into negative territory. This is a concern for the “Go” trend. We will need to see it recapture positive territory if the “Go” trend is to remain in place.
Gold Shows Weakness but Remains Close to Highs
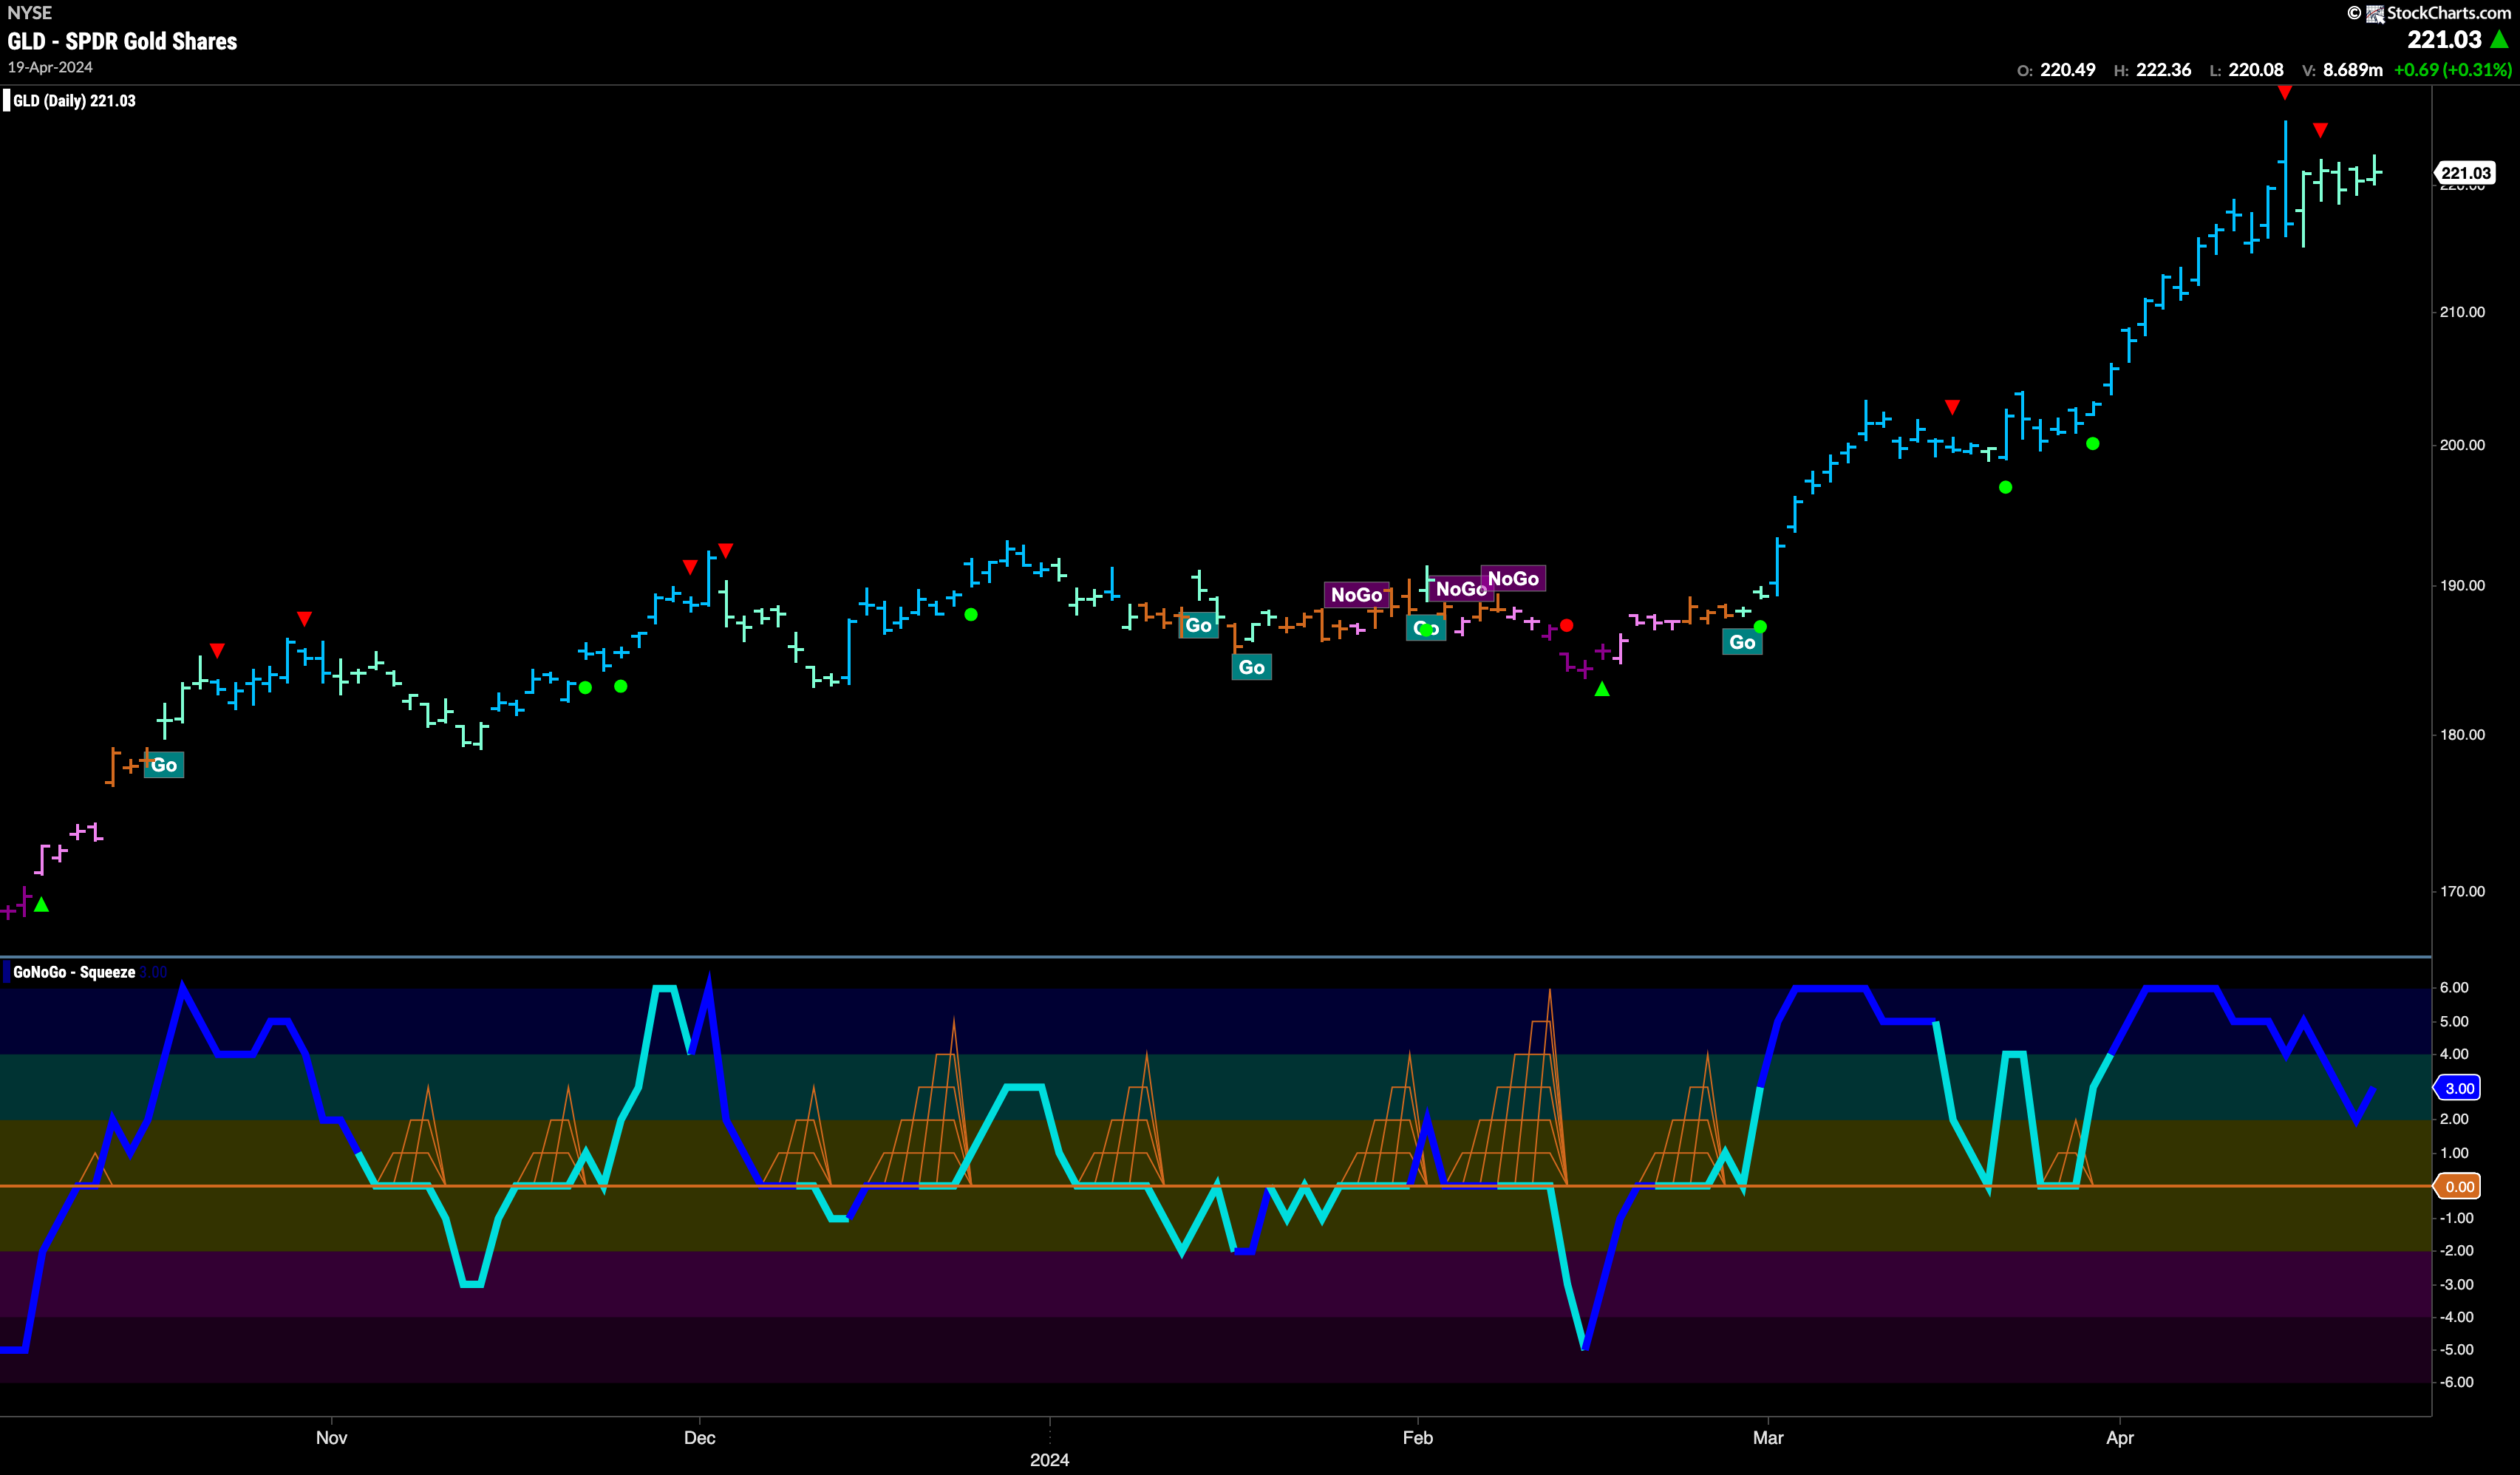
$GLD was able to hold firm after suffering a strong move lower the week before. We see a string of weaker aqua “Go” bars but price managing to hold its ground and consolidating after multiple Go Countertrend Correction Icons. GoNoGo Oscillator shows that there is still much volume in the precious metal ETF and it has halted its fall toward the zero line. If GoNoGo Oscillator stays at or above the zero line we know this is healthy for the “Go” trend and so we will look for possible new higher highs.
The weekly chart shows how fast price took off once it broke above the horizontal resistance we see on the chart. We have seen several months of strong blue “Go” bars and GoNoGo Oscillator shows that market participation is heavy as the oscillator is overbought. We will watch to see if price can continue higher this week or whether there is any cooling of momentum. There will be much support at that horizontal level should it be needed going forward. 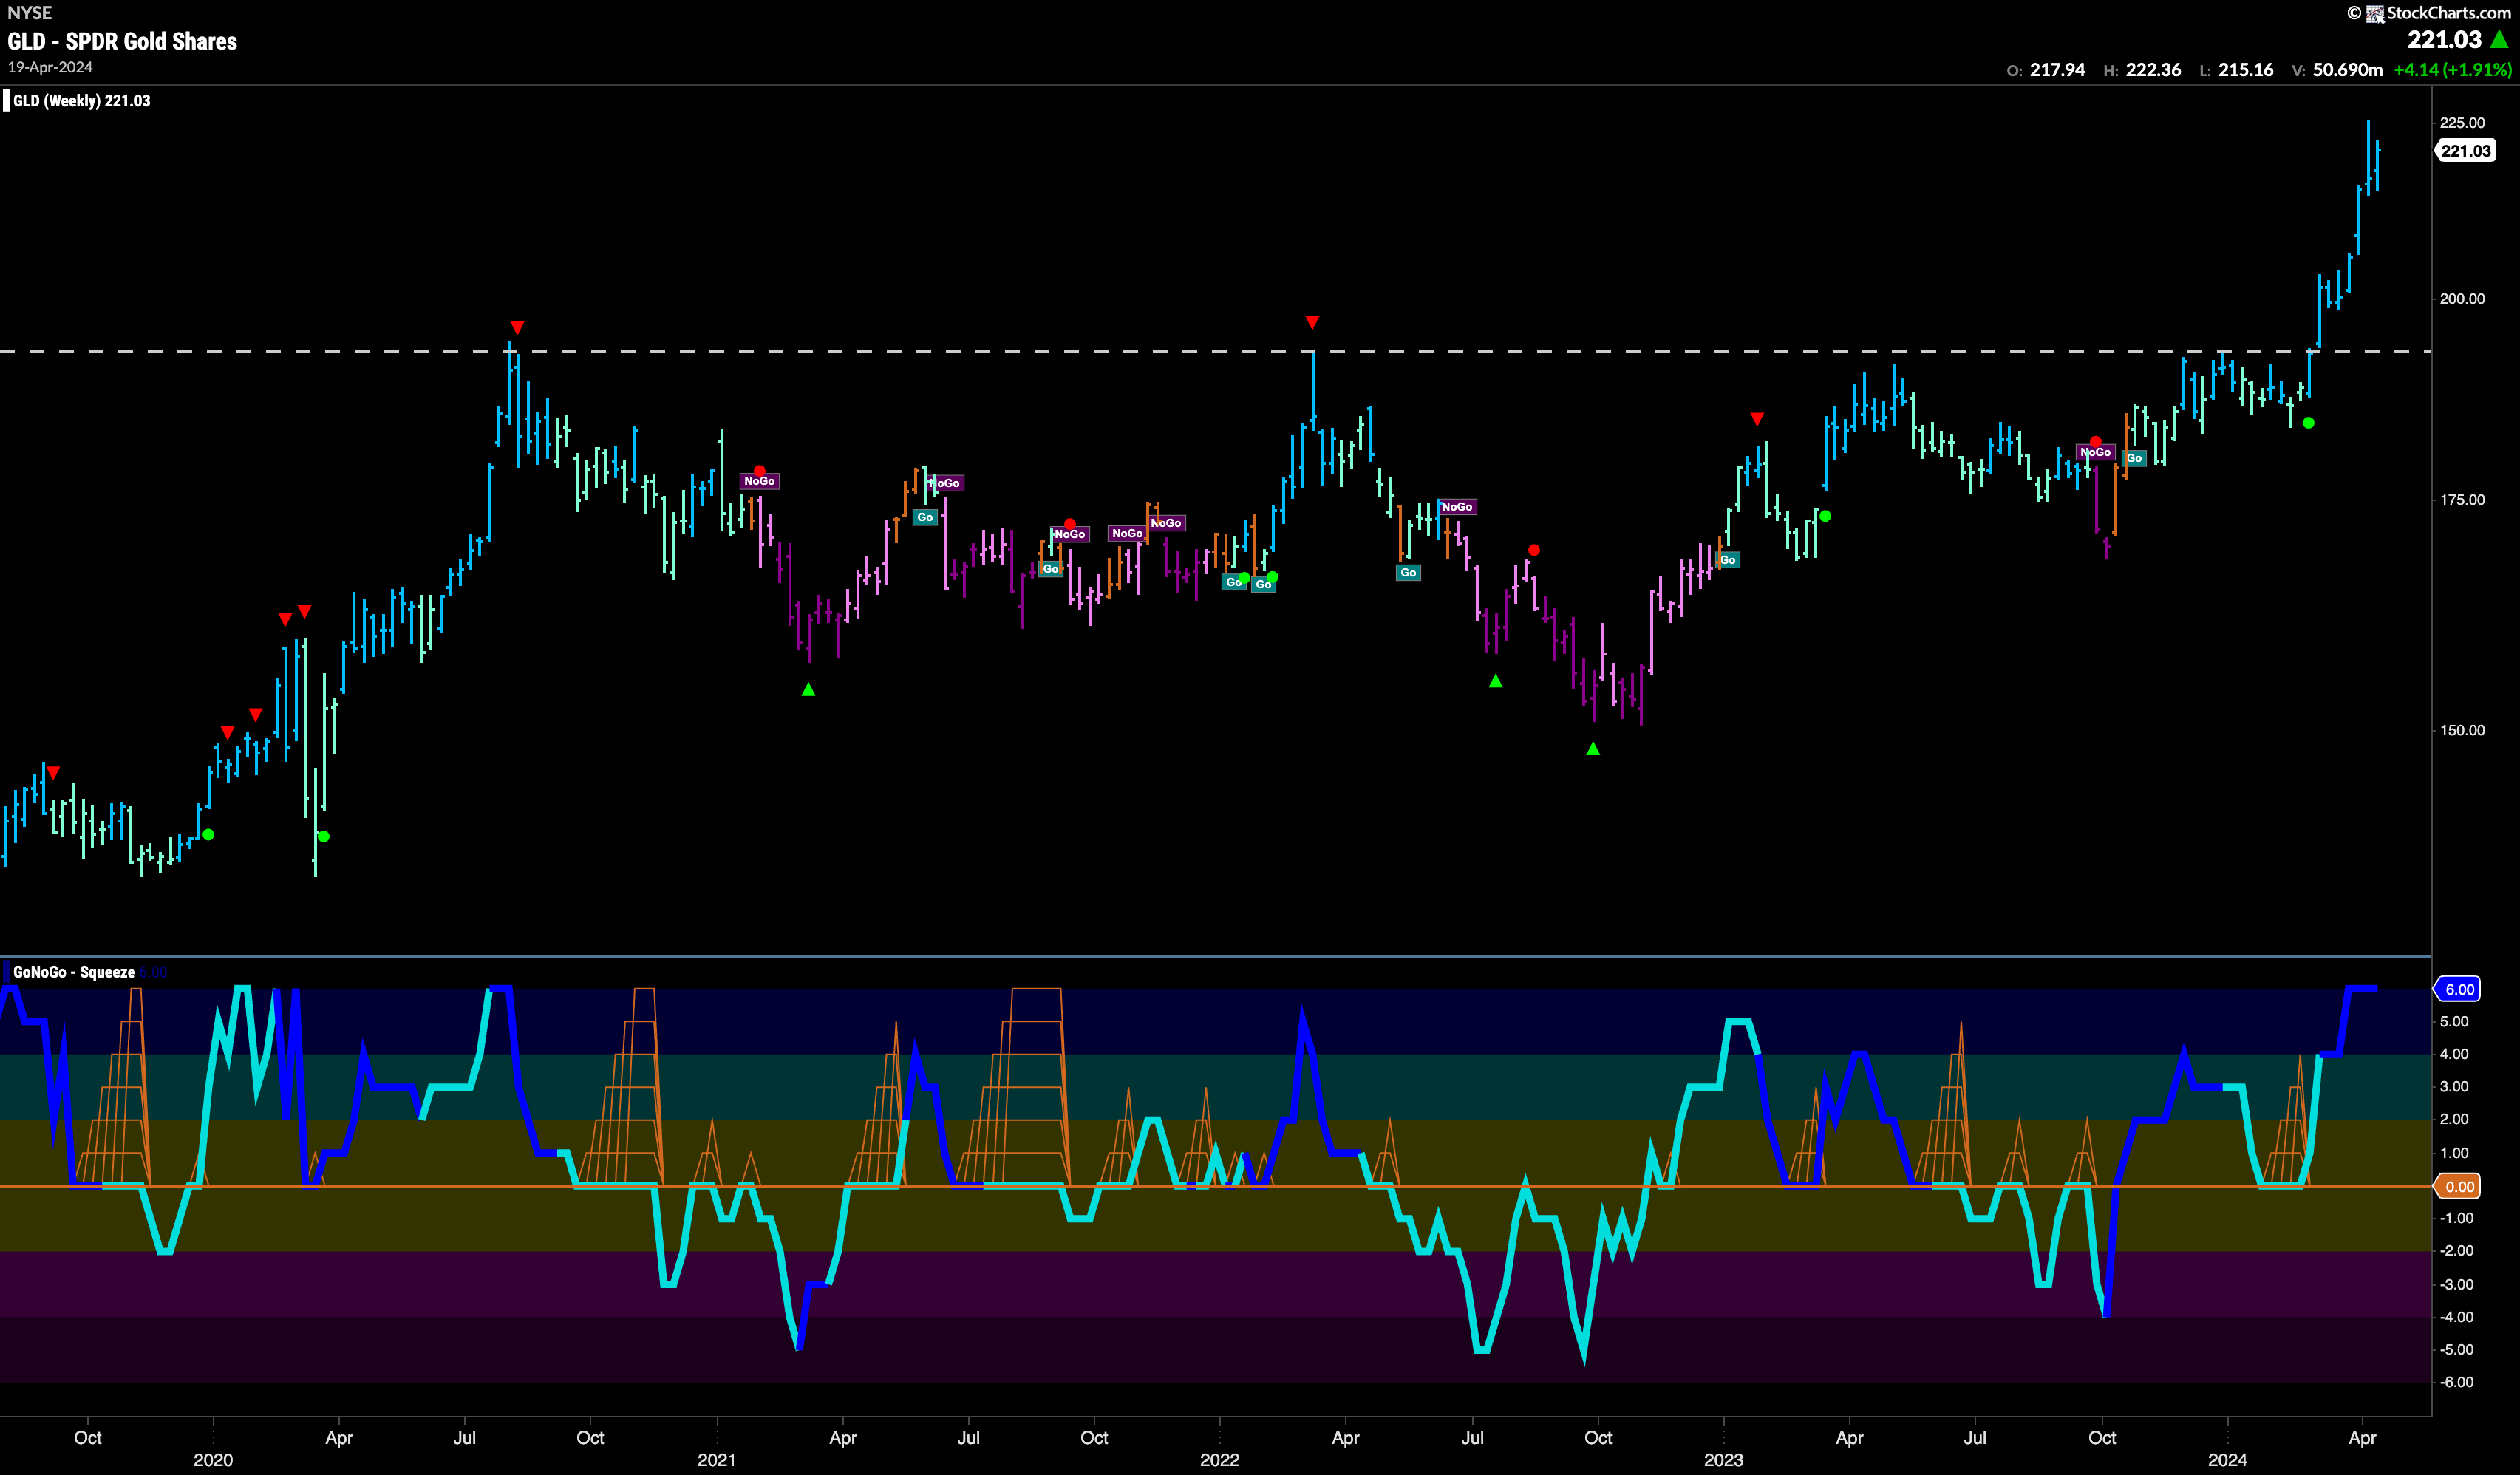
Sector RelMap
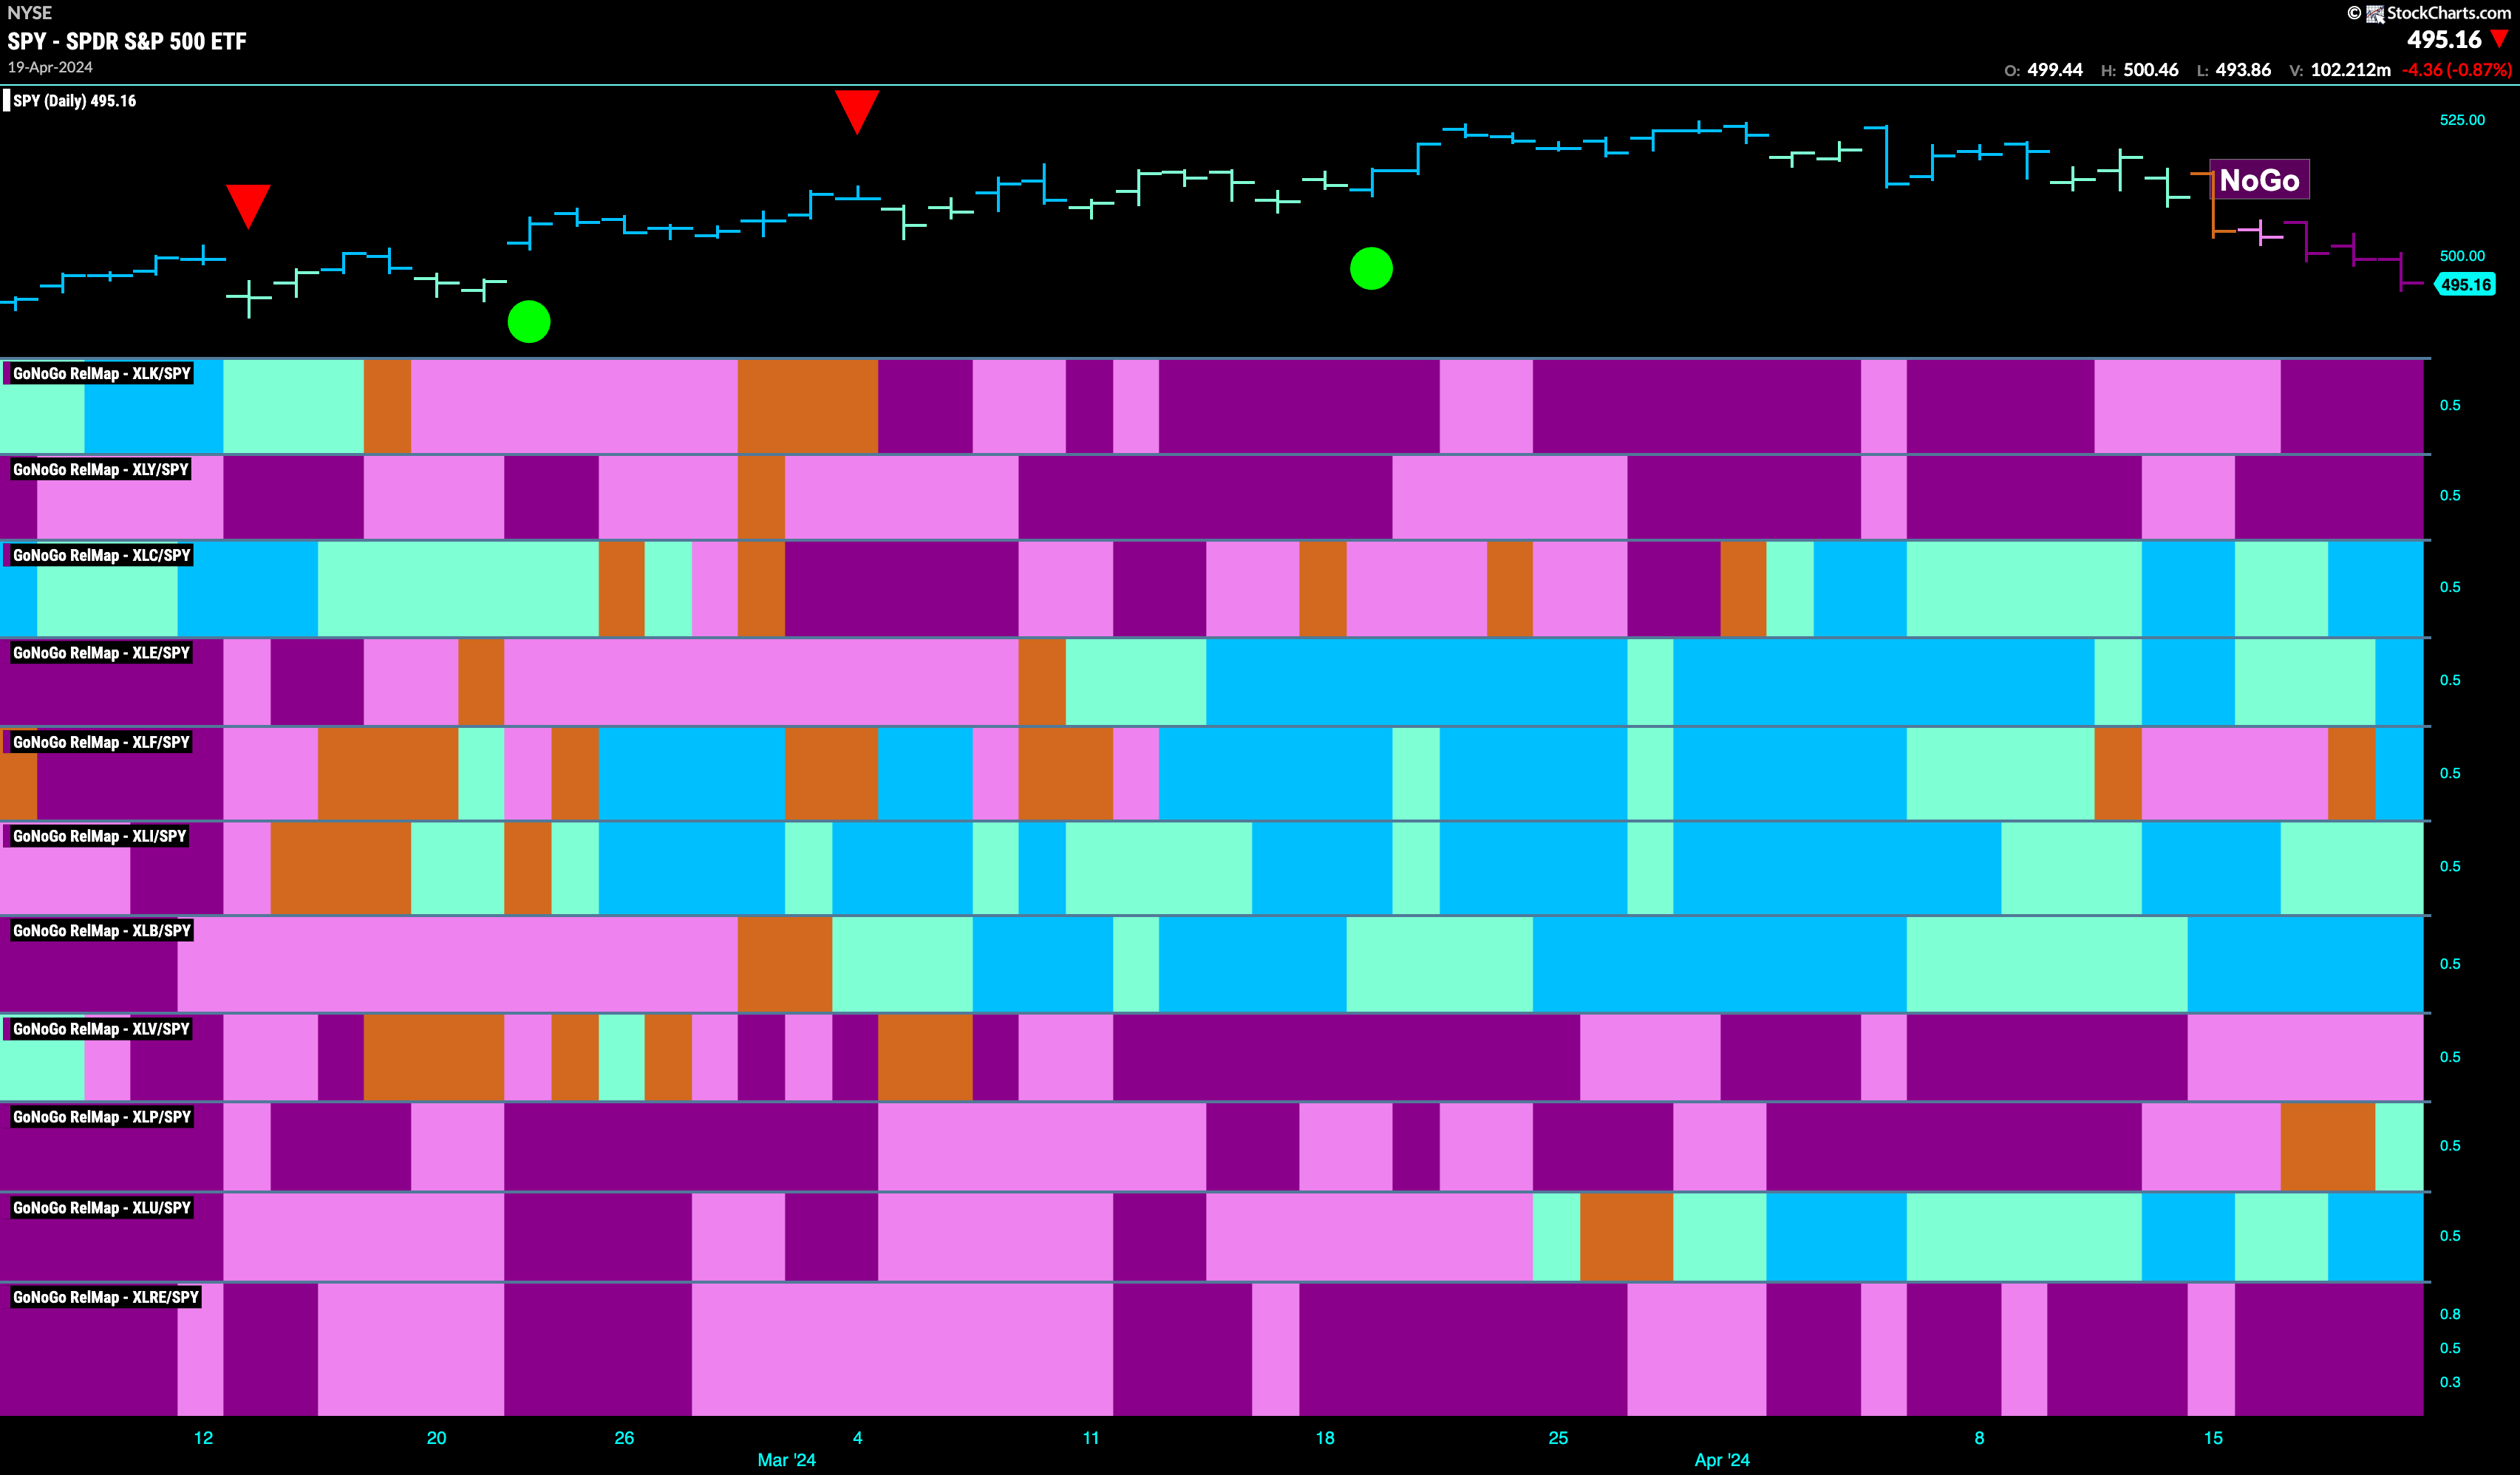
Below is the GoNoGo Sector RelMap. This GoNoGo RelMap applies the GoNoGo Trend to the relative strength ratios of the sectors to the base index. Looking at this map, we can quickly see where the relative outperformance is coming from as well as which sectors are lagging on a relative basis. 7 sectors are outperforming the base index this week. $XLC, $XLE, $XLF,$XLI, $XLB, $XLP, and $XLU are painting relative “Go” bars.
Materials Sub-Group RelMap
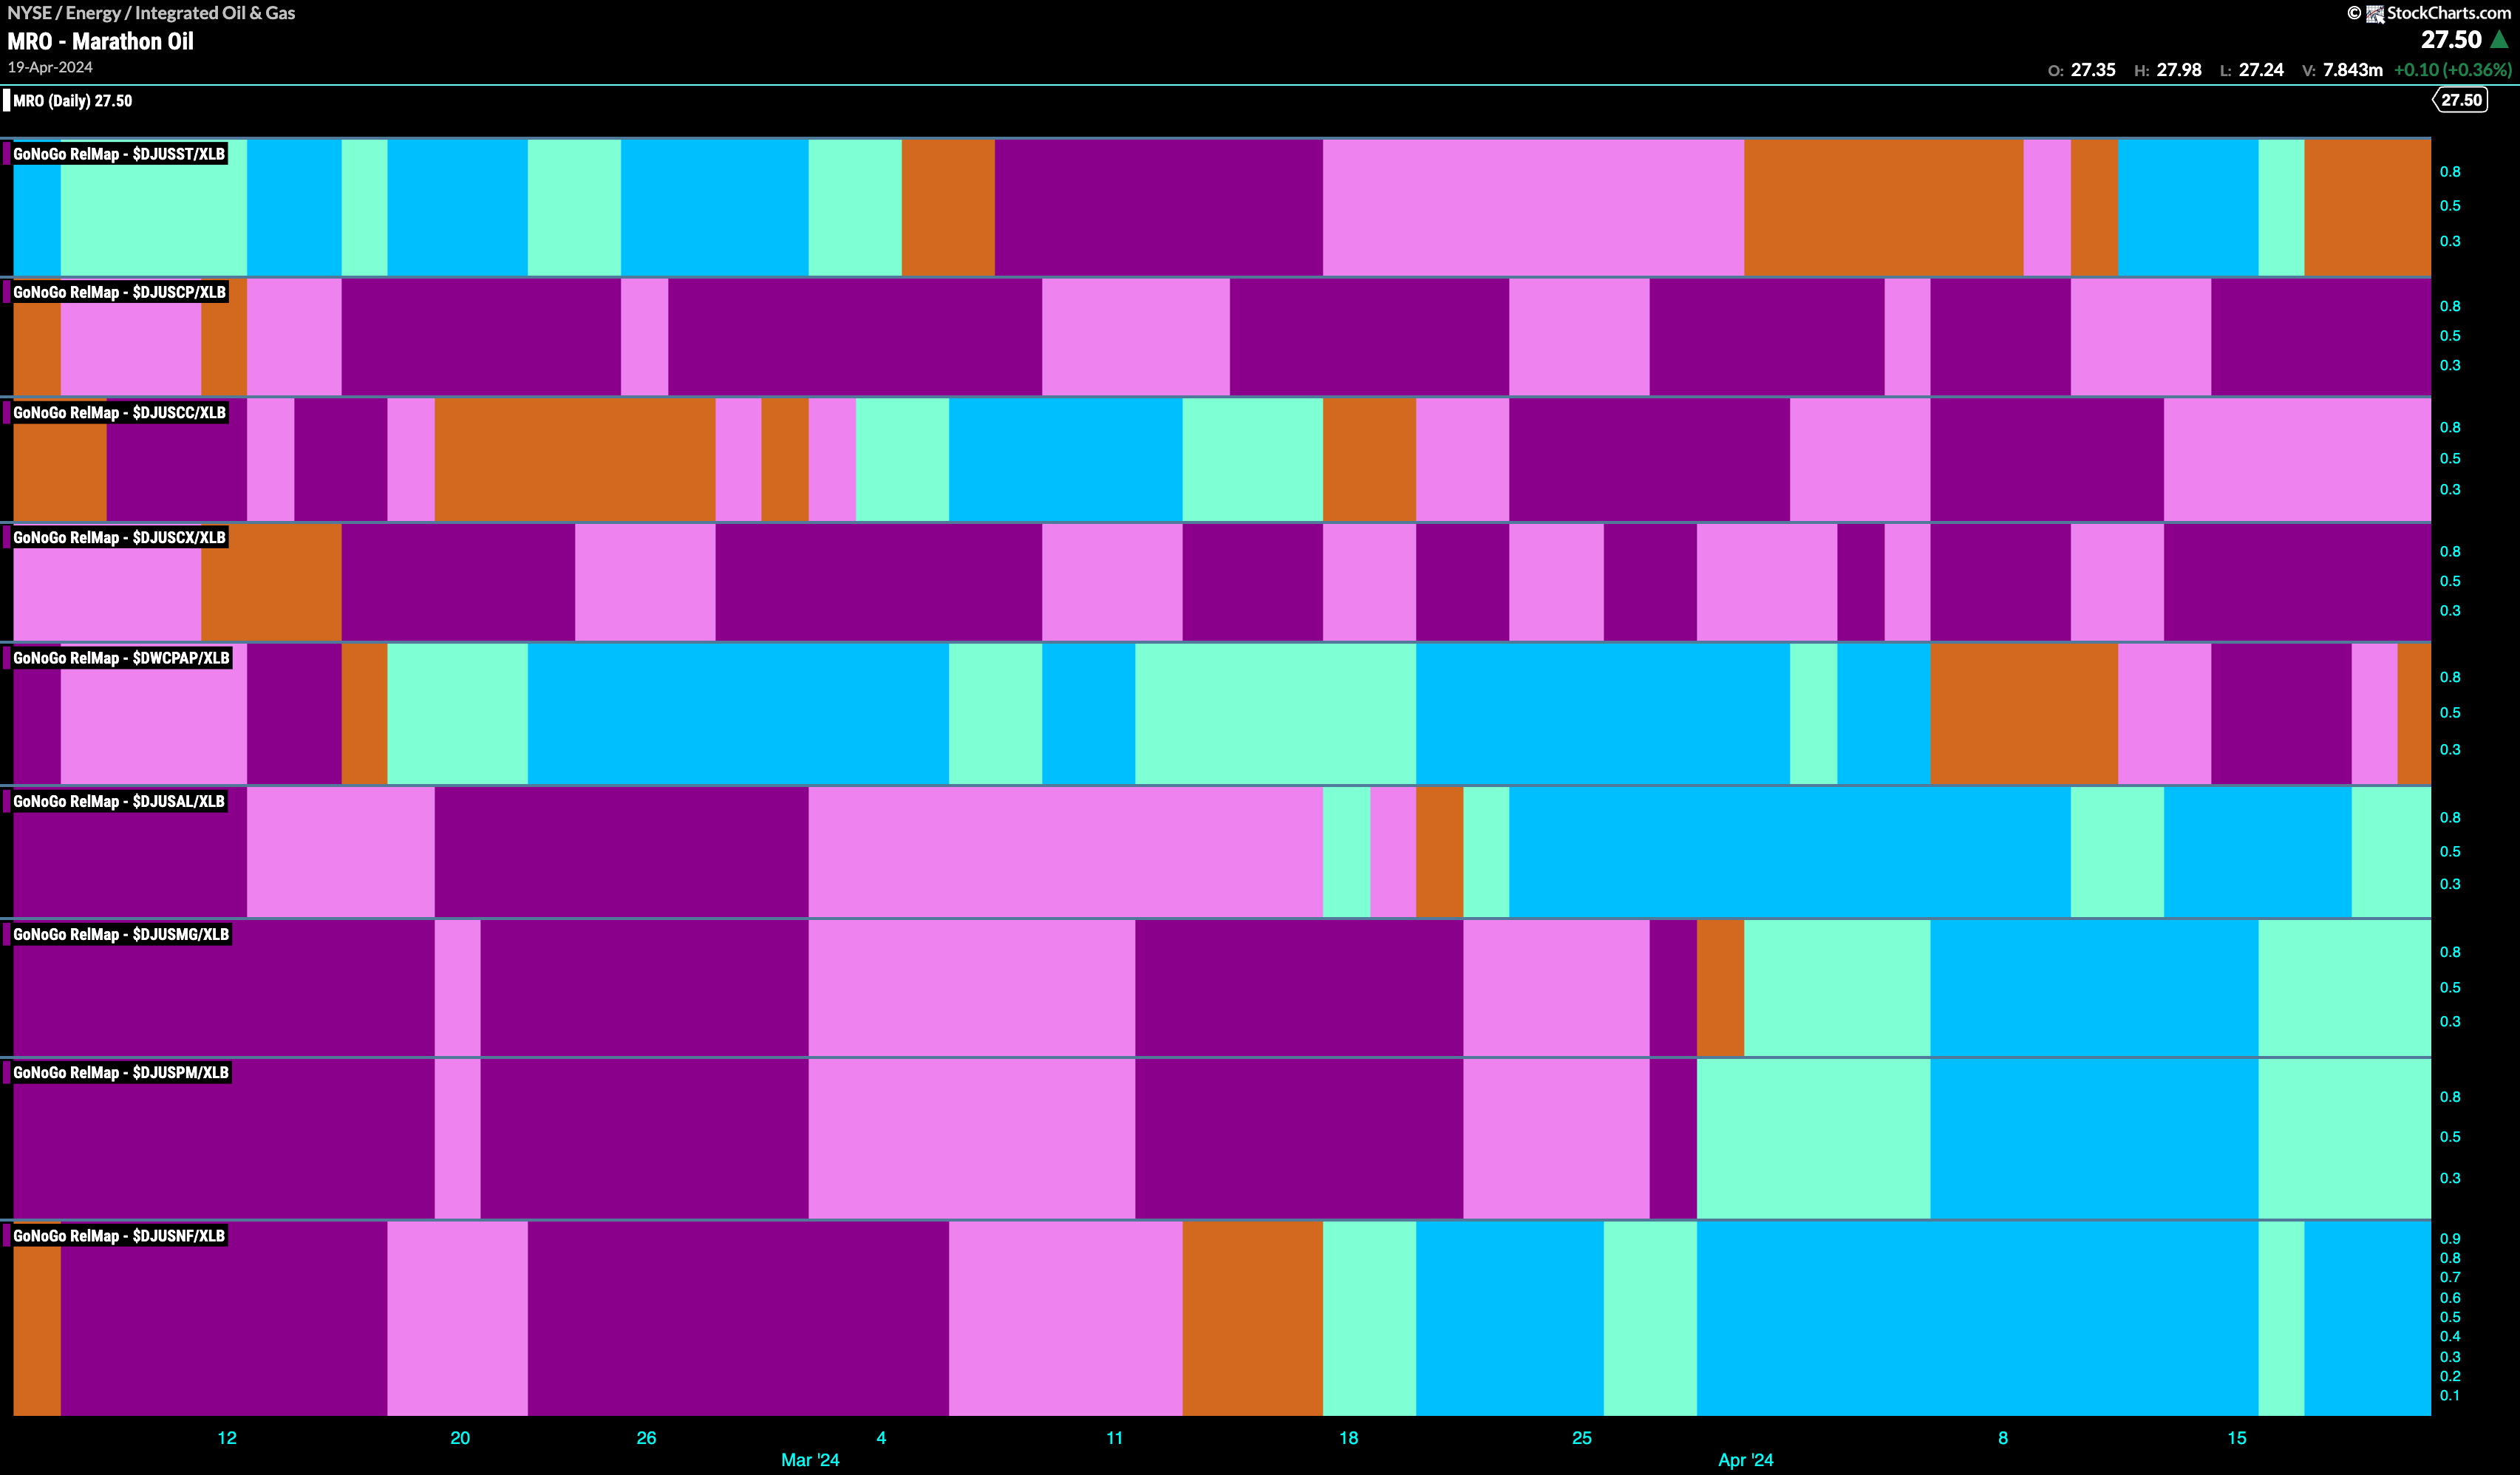
The GoNoGo Sector RelMap above shows that it is the middle section of the chart that continues to demonstrate consistent outperformance on a relative basis to the wider index. The materials sector in the 7th panel continues to show strength and has painted a string of strong blue “Go” bars this past week. We will break down the materials sector below in the GoNoGo Sector Sub-group RelMap. We can see that the outperformance is concentrated in the lower half of this map with relative “Go” trends in the metals and mining sub-groups.
$HMY Shows Signs of Go Trend Continuation
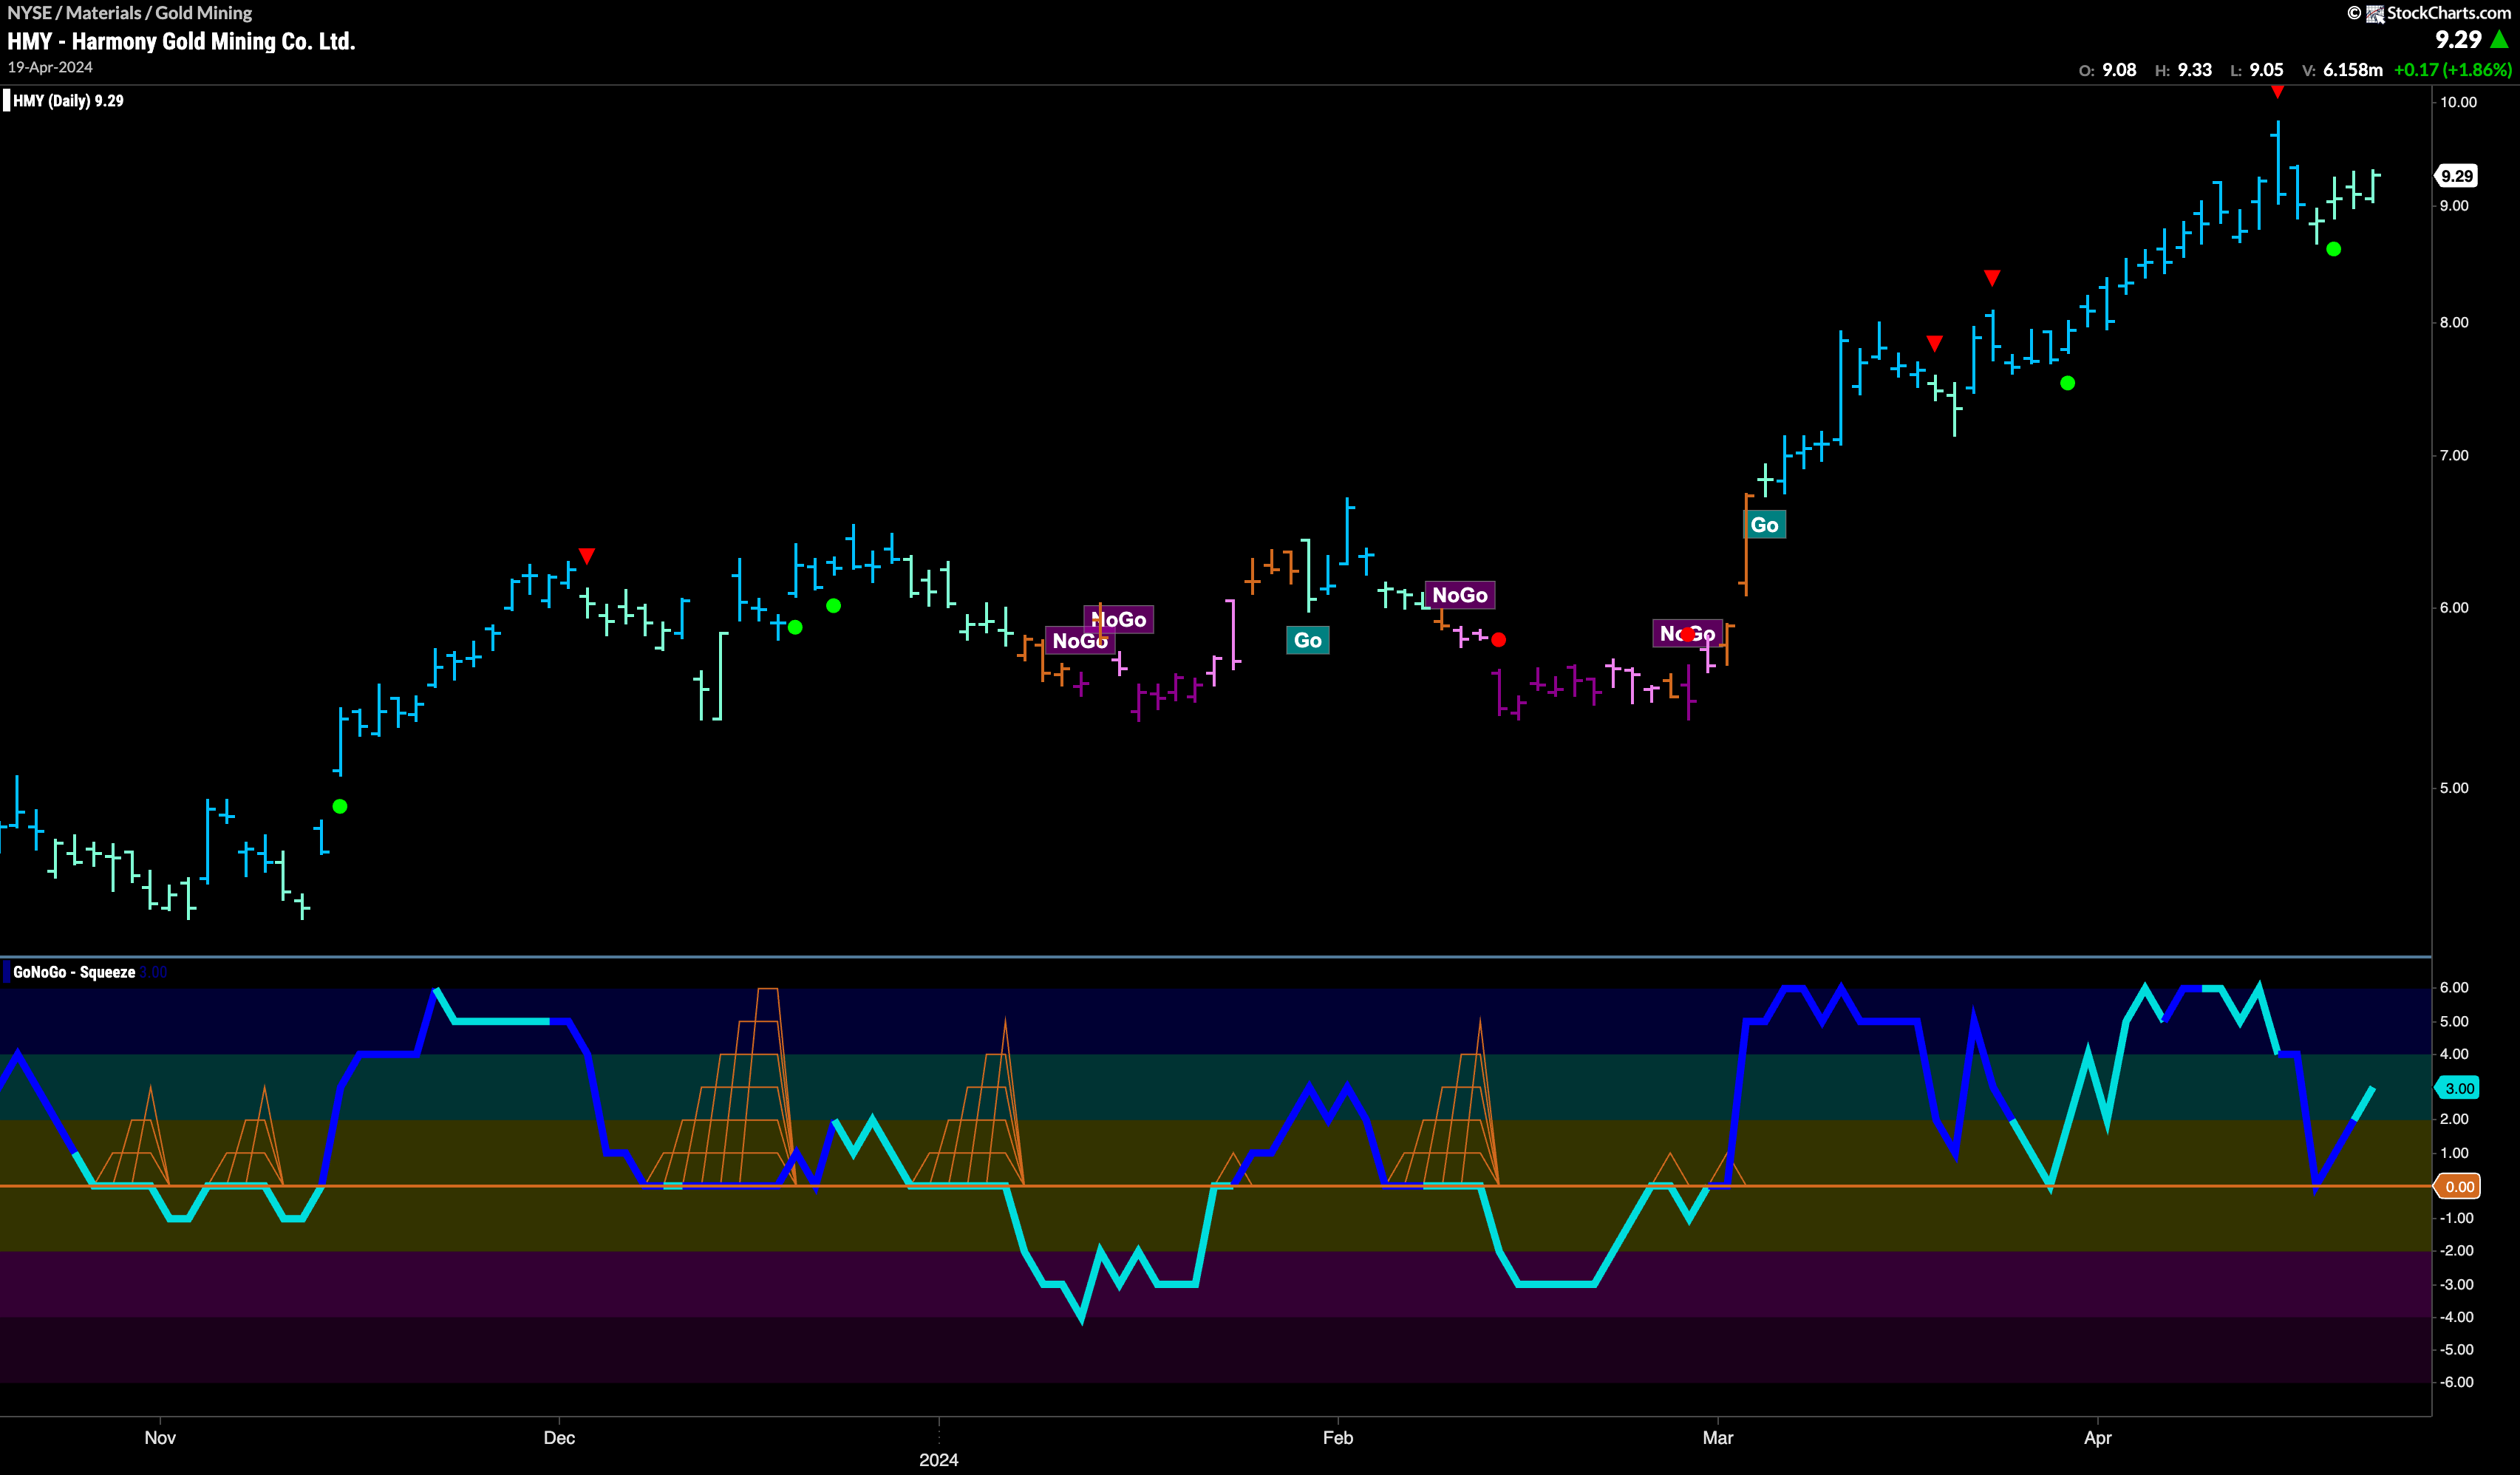
Looking at the chart of $HMY, a gold mining company, we can see that it has risen along with the rise in the value of the precious metal. We saw a new high just a week ago and with it a Go Countertrend Correction Icon (red arrow) that hinted short term struggles for the stock price in its efforts to go higher. GoNoGo Trend painted weaker aqua “Go” bars in recognition but we turn our eye to the oscillator panel and see that it immediately found support at zero when testing that level. This gives us a quick sign of Go Trend Continuation (green circle) and we will therefore expect the trend to continue and look for price to make an attack on new highs.
$FCX Searches for Support
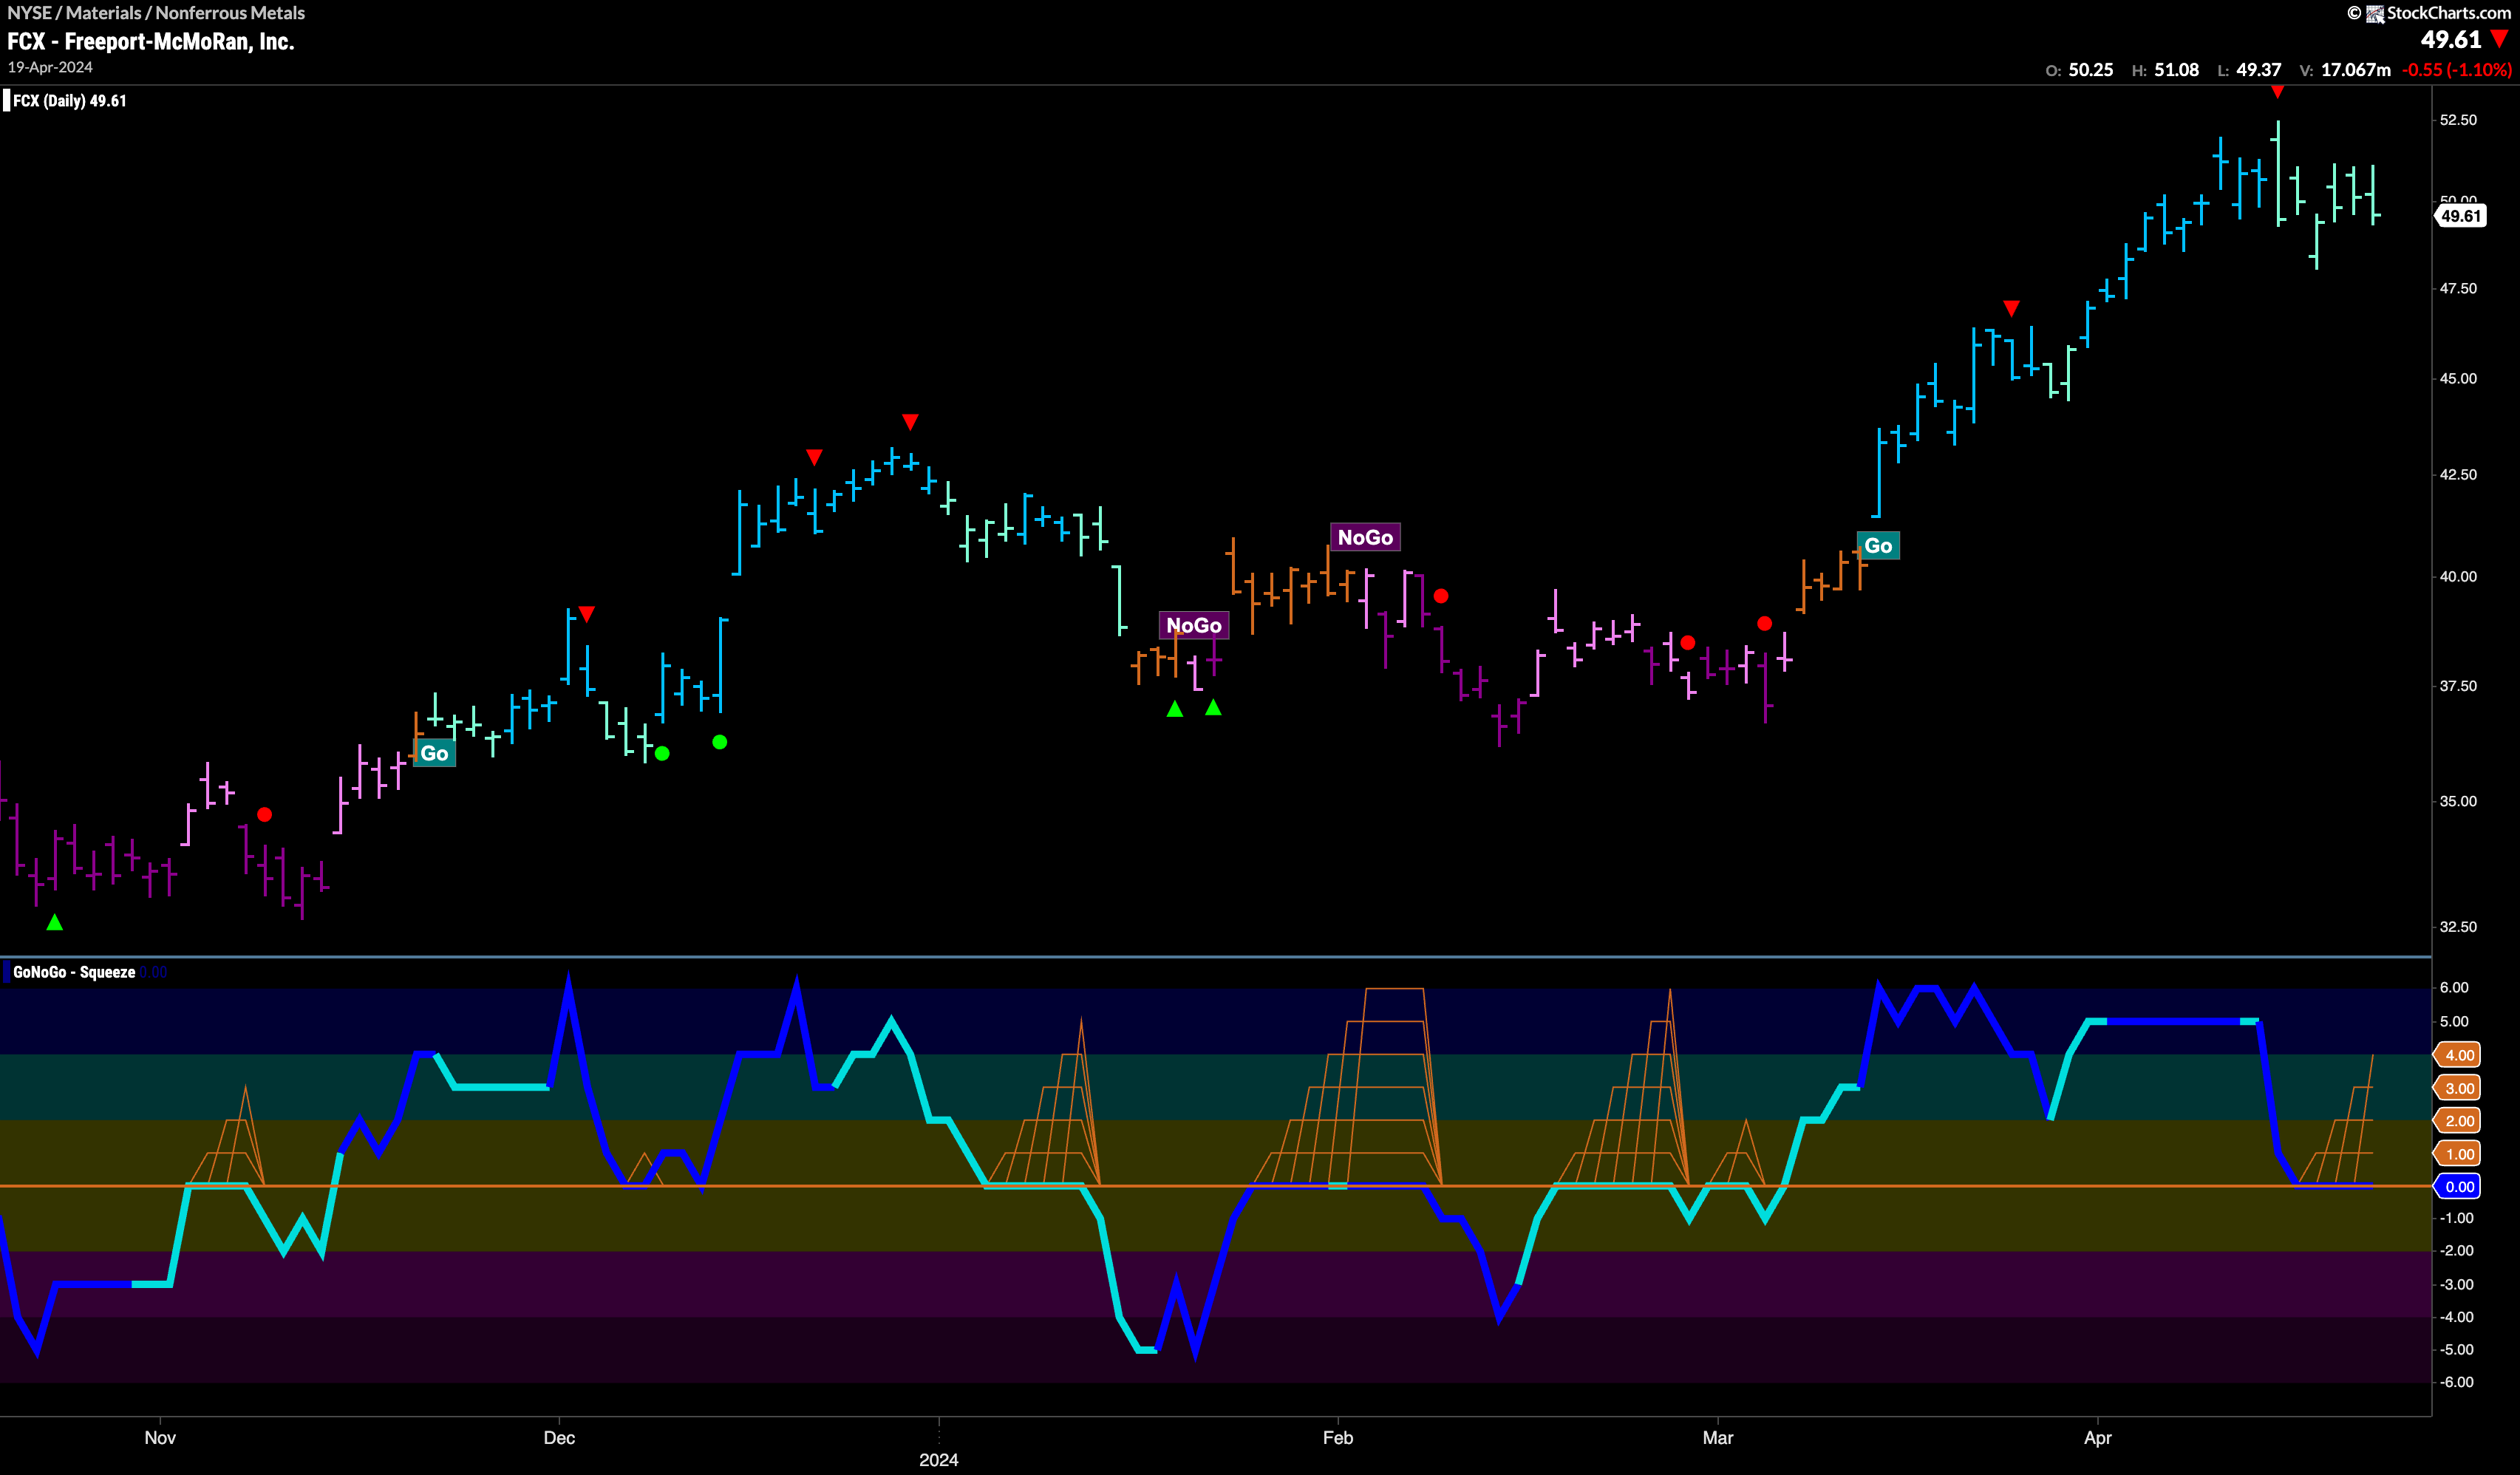
Freeport-McMoRan, Inc, a copper company in the non ferrous metals sub group, has been in a “Go” trend since emerging from its most recent “NoGo” and a string of “Go Fish” bars. A succession of higher highs and higher lows has taken price higher. At the last high, we saw a Go Countertrend Correction Icon (red arrow) that indicated price may struggle to go higher in the short term and indeed we saw GoNoGo Trend show weakness with paler aqua bars. However, as price consolidates, we see that GoNoGo Oscillator has fallen to test the zero line from above. It has remained at that level for a few bars and that has caused the beginnings of the climbing grid of GoNoGo Squeeze. We will watch for the resolution of this tug of war between buyers and sellers at this level. If the GoNoGo Squeeze is broken into positive territory then we will know that momentum is resurgent in the direction of the trend. We will see a Go Trend Continuation Icon (green circle) and expect price to make a push for new higher highs. Of course, if the GoNoGo Squeeze is broken into negative territory, that would be a concern for the underlying “Go” trend.
