
Stocks went lower last week, then they went higher! After falling for much of the week we saw a surge late Friday that left the Dow Jones Industrial Average up 1.4% and the S&P 500 up 1.6% for the week. The technology heavy Nasdaq was down even after Friday’s rally into the bell. We should note that neither the Dow Jones or the S&P are quite at the highs from two weeks ago but any move higher this week would set new highs. As investors struggled to read the choppiness this past week, we saw new coronavirus cases top 76,000 cases which is a return to higher numbers from over a month ago but the vaccine rollout is going ahead full steam. Will the success of the vaccine be enough to stop a significant new wave and allow the economy to reopen and move foreward safely?

The GoNoGo Heat Map® above shows us the daily trend performance of five asset classes: Equities, Bonds, Commodities, Currencies, and Digital Assets from the US perspective. The takeaway remains the same as it has been for several weeks. Equities, commodities, and the cryptocurrency markets are now in established “Go” trends.
Panel 1 – Stocks continue to paint “Go” bars as the trend persists, but only after dipping into Go Fish territory this week. SPDR® S&P 500® ETF Trust seeks to provide investment results that, before expenses, correspond generally to the price and yield performance of the S&P.
Panel 2 – Government bonds, continue to paint “NoGo” bars, as the downtrend remains strong. $IEF tracks a market-value-weighted index of debt issued by the US Treasury with 7-10 years to maturity remaining.
Panel 3 – Commodities painted a “Go Fish” bar to end the week, the first such bar in some time. $USCI tracks an equal-weighted index of 14 commodity futures contracts and holds at least one precious metal, industrial metal, energy, livestock, soft, and grain commodity.
Panel 4 – The US Dollar is now in an established “Go” trend and has strengthened this week. $DXY is an index of the value of the United States Dollar relative to a basket of foreign currencies.
Panel 5 – Bitcoin’s “Go” trend continued this week as it ended the week painting strong blue bars.
SECTOR STRENGTH
The GoNoGo RelMap® below shows the trend performance of each sector relative to the index.
- Materials continue to paint Go bars as the industrial economy comes back online amid hopes of successful vaccine rollout
- The Energy sector recovered this week, ending the week with a strong “Go” bar
- Financials, and Industrials continue to outperform, while Communications paints a neutral amber bar
- Consumer Staples – a defensive sector – that we noted painted an amber bar to close last week has moved into a “Go” trend finishing the week strongly
- Technology continues to underperform

TECHNOLOGY CAN BE TRYING
The daily chart below shows the $QQQ, the Invesco fund that tracks the performance of the Nasdaq 100. We mentioned above that Technology is underperforming, and as we have discussed the rotation away from growth stocks, particularly mega cap technology, let’s look at the GoNoGo Chart to assess the technical environment.
- Price has stalled at levels where there is a clustering of supply and demand
- The trend is a strong “NoGo” as we see the purple bars return
- After crashing through the zero line and retesting it on heavy volume the GoNoGo Oscillator is riding the zero line as price consolidates
- We will look to see if the GoNoGo Oscillator is rejected from the zero line, and if so we’ll expect a move lower in price to test the recent low from earlier this month
- A break above zero would indicate positive momentum and would disrupt the NoGo trend

TROUBLE FOR TESLA
If technology is showing signs of potential struggle, let’s take a look at one of the absolute giants. The GoNoGo chart below shows daily prices for $TSLA. Will the automaker continue to fall from here?
- NoGo trend remains in place as price has set a lower high over the past two weeks
- GoNoGo Trend is painting the strongest purple NoGo bars
- The GoNoGo Oscillator has tested and found resistance at the zero line and now dipped back into negative territory
- We see a low risk NoGo trend continuation icon (red circle) above price, suggesting the likelihood of lower price action

STAPLES SHOWING STRENGTH
We saw on the GoNoGo RelMap earlier that the staples sector was starting to outperform the base index. Below is a GoNoGo chart of the relative strength ratio of $XLP/SPY showing that relationship.
- This past week saw the GoNoGo Trend identify a Go trend after months of solid underperformance
- The end of the week saw the GoNoGo Trend paint a strong blue Go bar as price consolidated above horizontal resistance
- After finding resistance at zero throughout the NoGo trend, GoNoGo Oscillator lead trend by breaking into positive territory slightly ahead of the GoNoGo Trend color change
- The Go trend now appears to be strengthening, on heavy volume

Having looked at the ratio of Staples to the S&P500, the GoNoGo chart below shows the pure GoNoGo chart of daily prices for the consumer staples sector ETF $XLP.
- Price rallied strongly this week to break resistance from prior highs
- The price action caused the GoNoGo Trend to paint strong blue Go bars
- GoNoGo Oscillator confirmed the move higher with a sharp rally into positive territory
- Volume has been strong as the GoNoGo Oscillator now reaches an overbought extreme

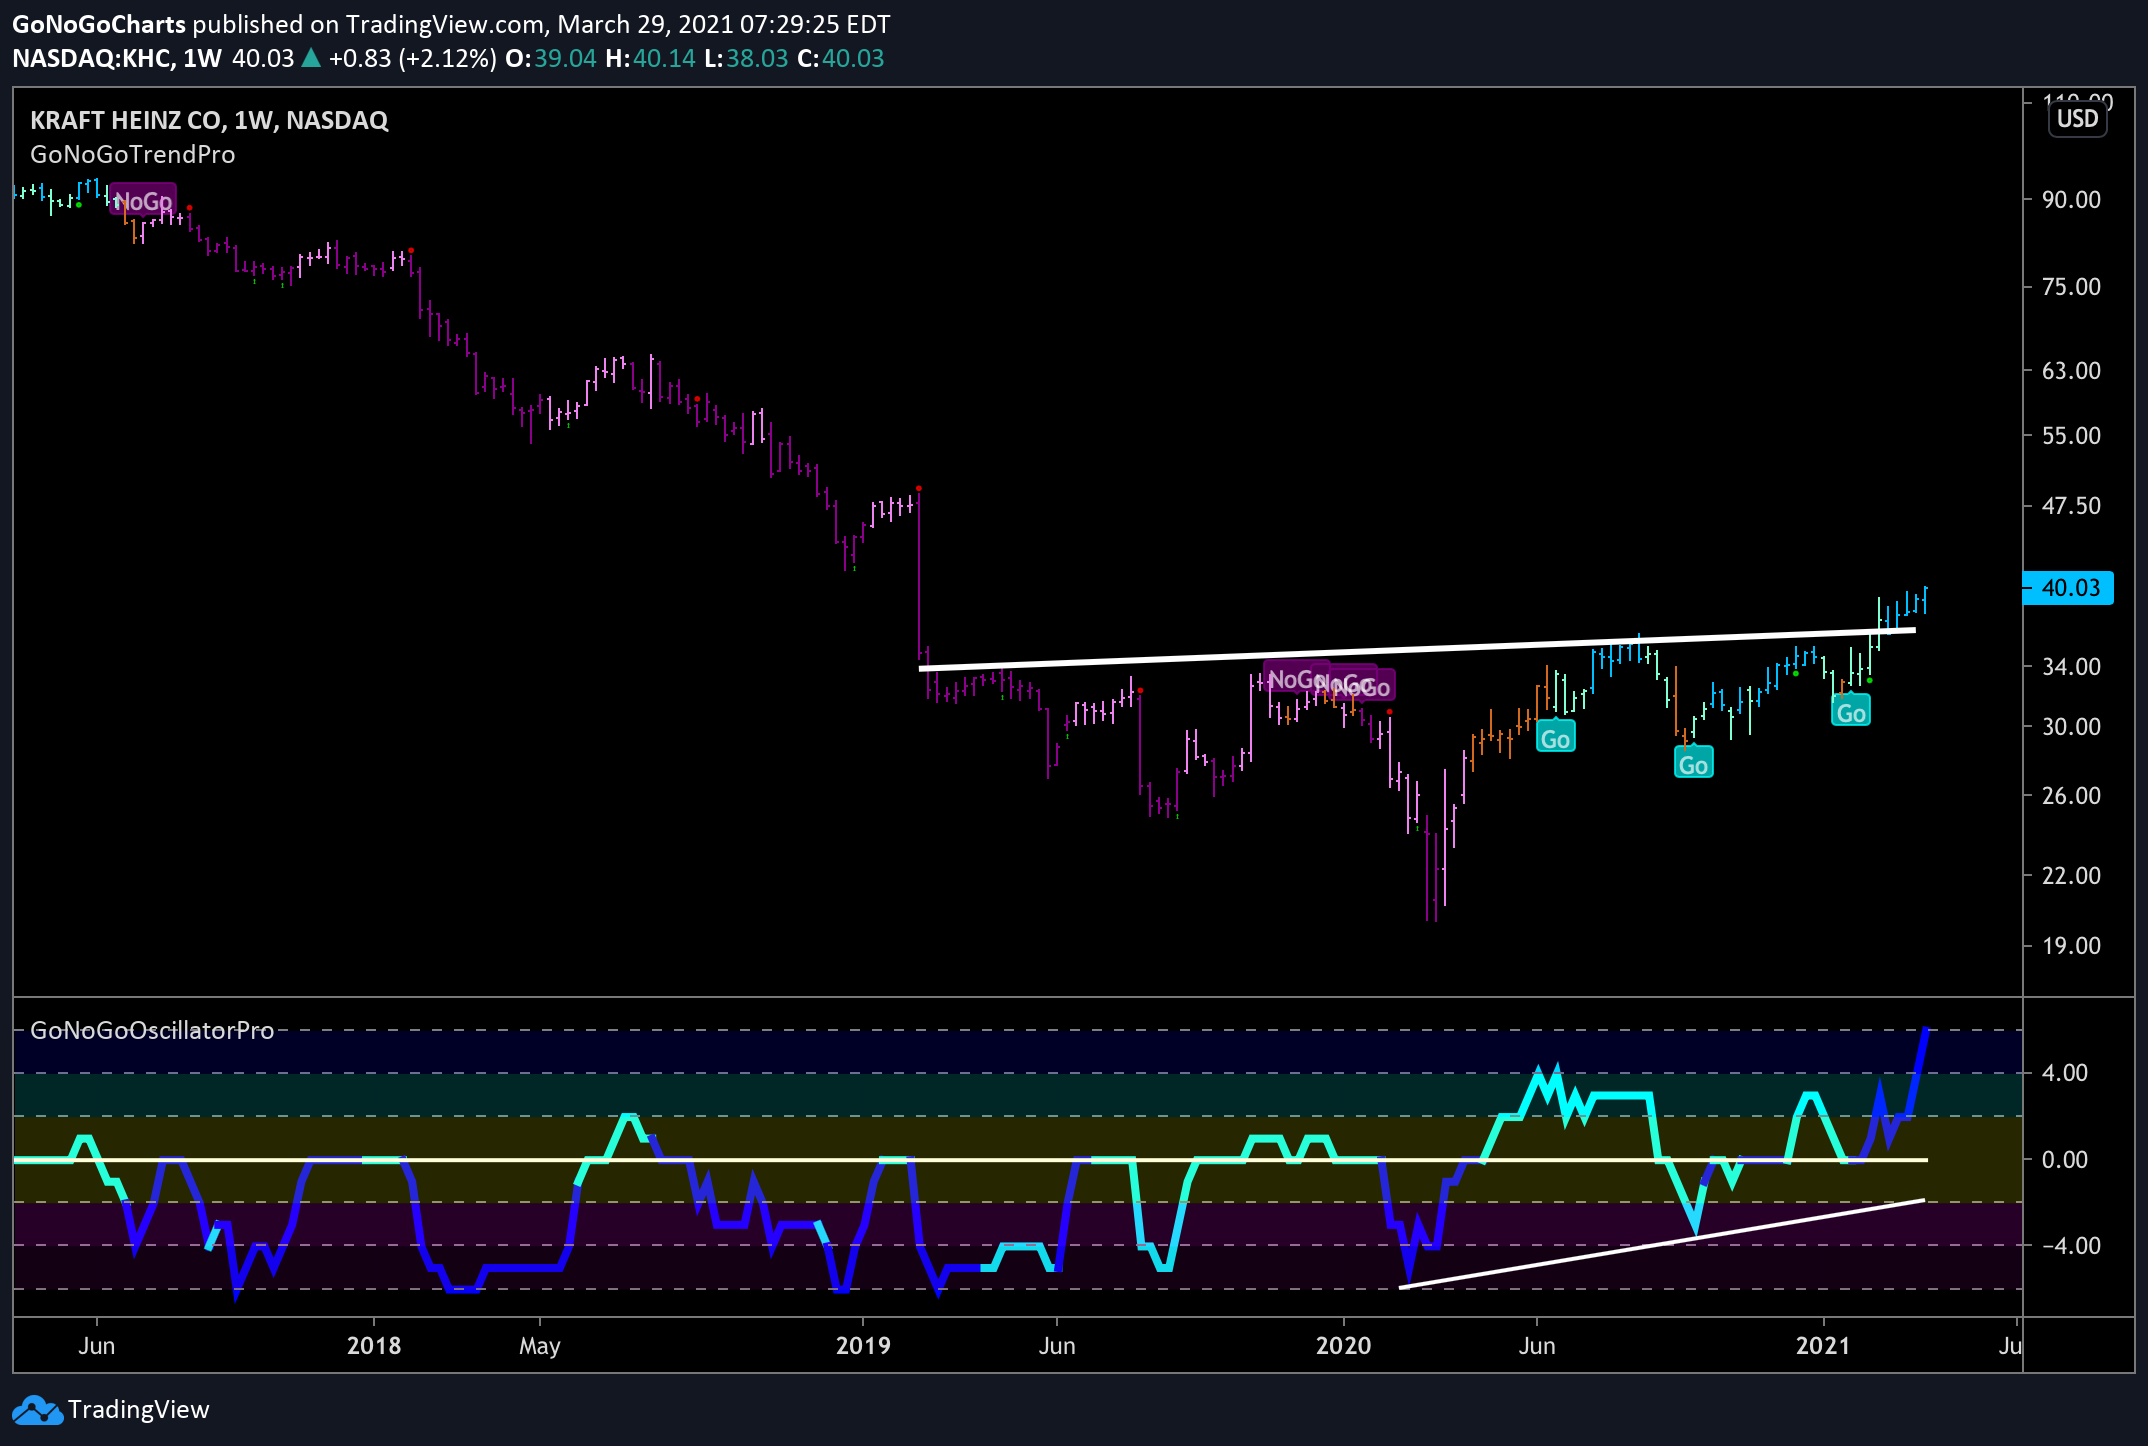
TIME TO KETCH-UP?
As the Consumer Staples sector shows strength, let’s turn to an individual company within that sector to try to capture alpha. Kraft Heinz is a familiar name and we’ll look to see how well positioned the food producer and distributor is for further gains. The GoNoGo chart below shows weekly prices.
- We can see that $KHC has been building a huge base for a few years and set an ultimate pandemic low during March of 2020
- Since that low, the long term trend has been taking hold and we are now seeing strong blue Go bars as price climbs above long term resistance levels
- This is a familiar setup for GoNoGo users, as the new GoNoGo Trend colors take hold in the right side of the pattern
- GoNoGo Oscillator has confirmed the trend change by setting higher lows and now finding support and storming into positive territory on heavy volume
- A measured move suggests a target around $50

Given that we see strong probability that there is a long term Go trend that is in place from the weekly GoNoGo chart, let’s dive into the daily chart to see if there is an opportunity to enter the trend.
- The Go trend is in place on the daily chart and currently painting a strong blue Go bar
- Horizontal resistance and rising lows shows buying pressure over the last several weeks
- After running up against overhead supply several times during this pattern we now see price closing higher
- GoNoGo Oscillator has found support at the zero line since first breaking into positive territory ahead of the trend change in the upper panel
- A strong setup is suggested as there have been several low risk trend continuation icons (green circles) under price during the pattern
- The current bar has produced a low risk entry icon (green circle)


