Good morning and welcome to this week’s Flight Path. Let’s take a look at the GoNoGo Asset map below. Equities were able to maintain a “Go” trend this week but we see more weakness as the week ends with aqua bars. Treasury bond prices solidified their change to a “NoGo” by painting strong purple bars. Commodities continued to struggle as the dollar found its feet in a new “Go’ trend.
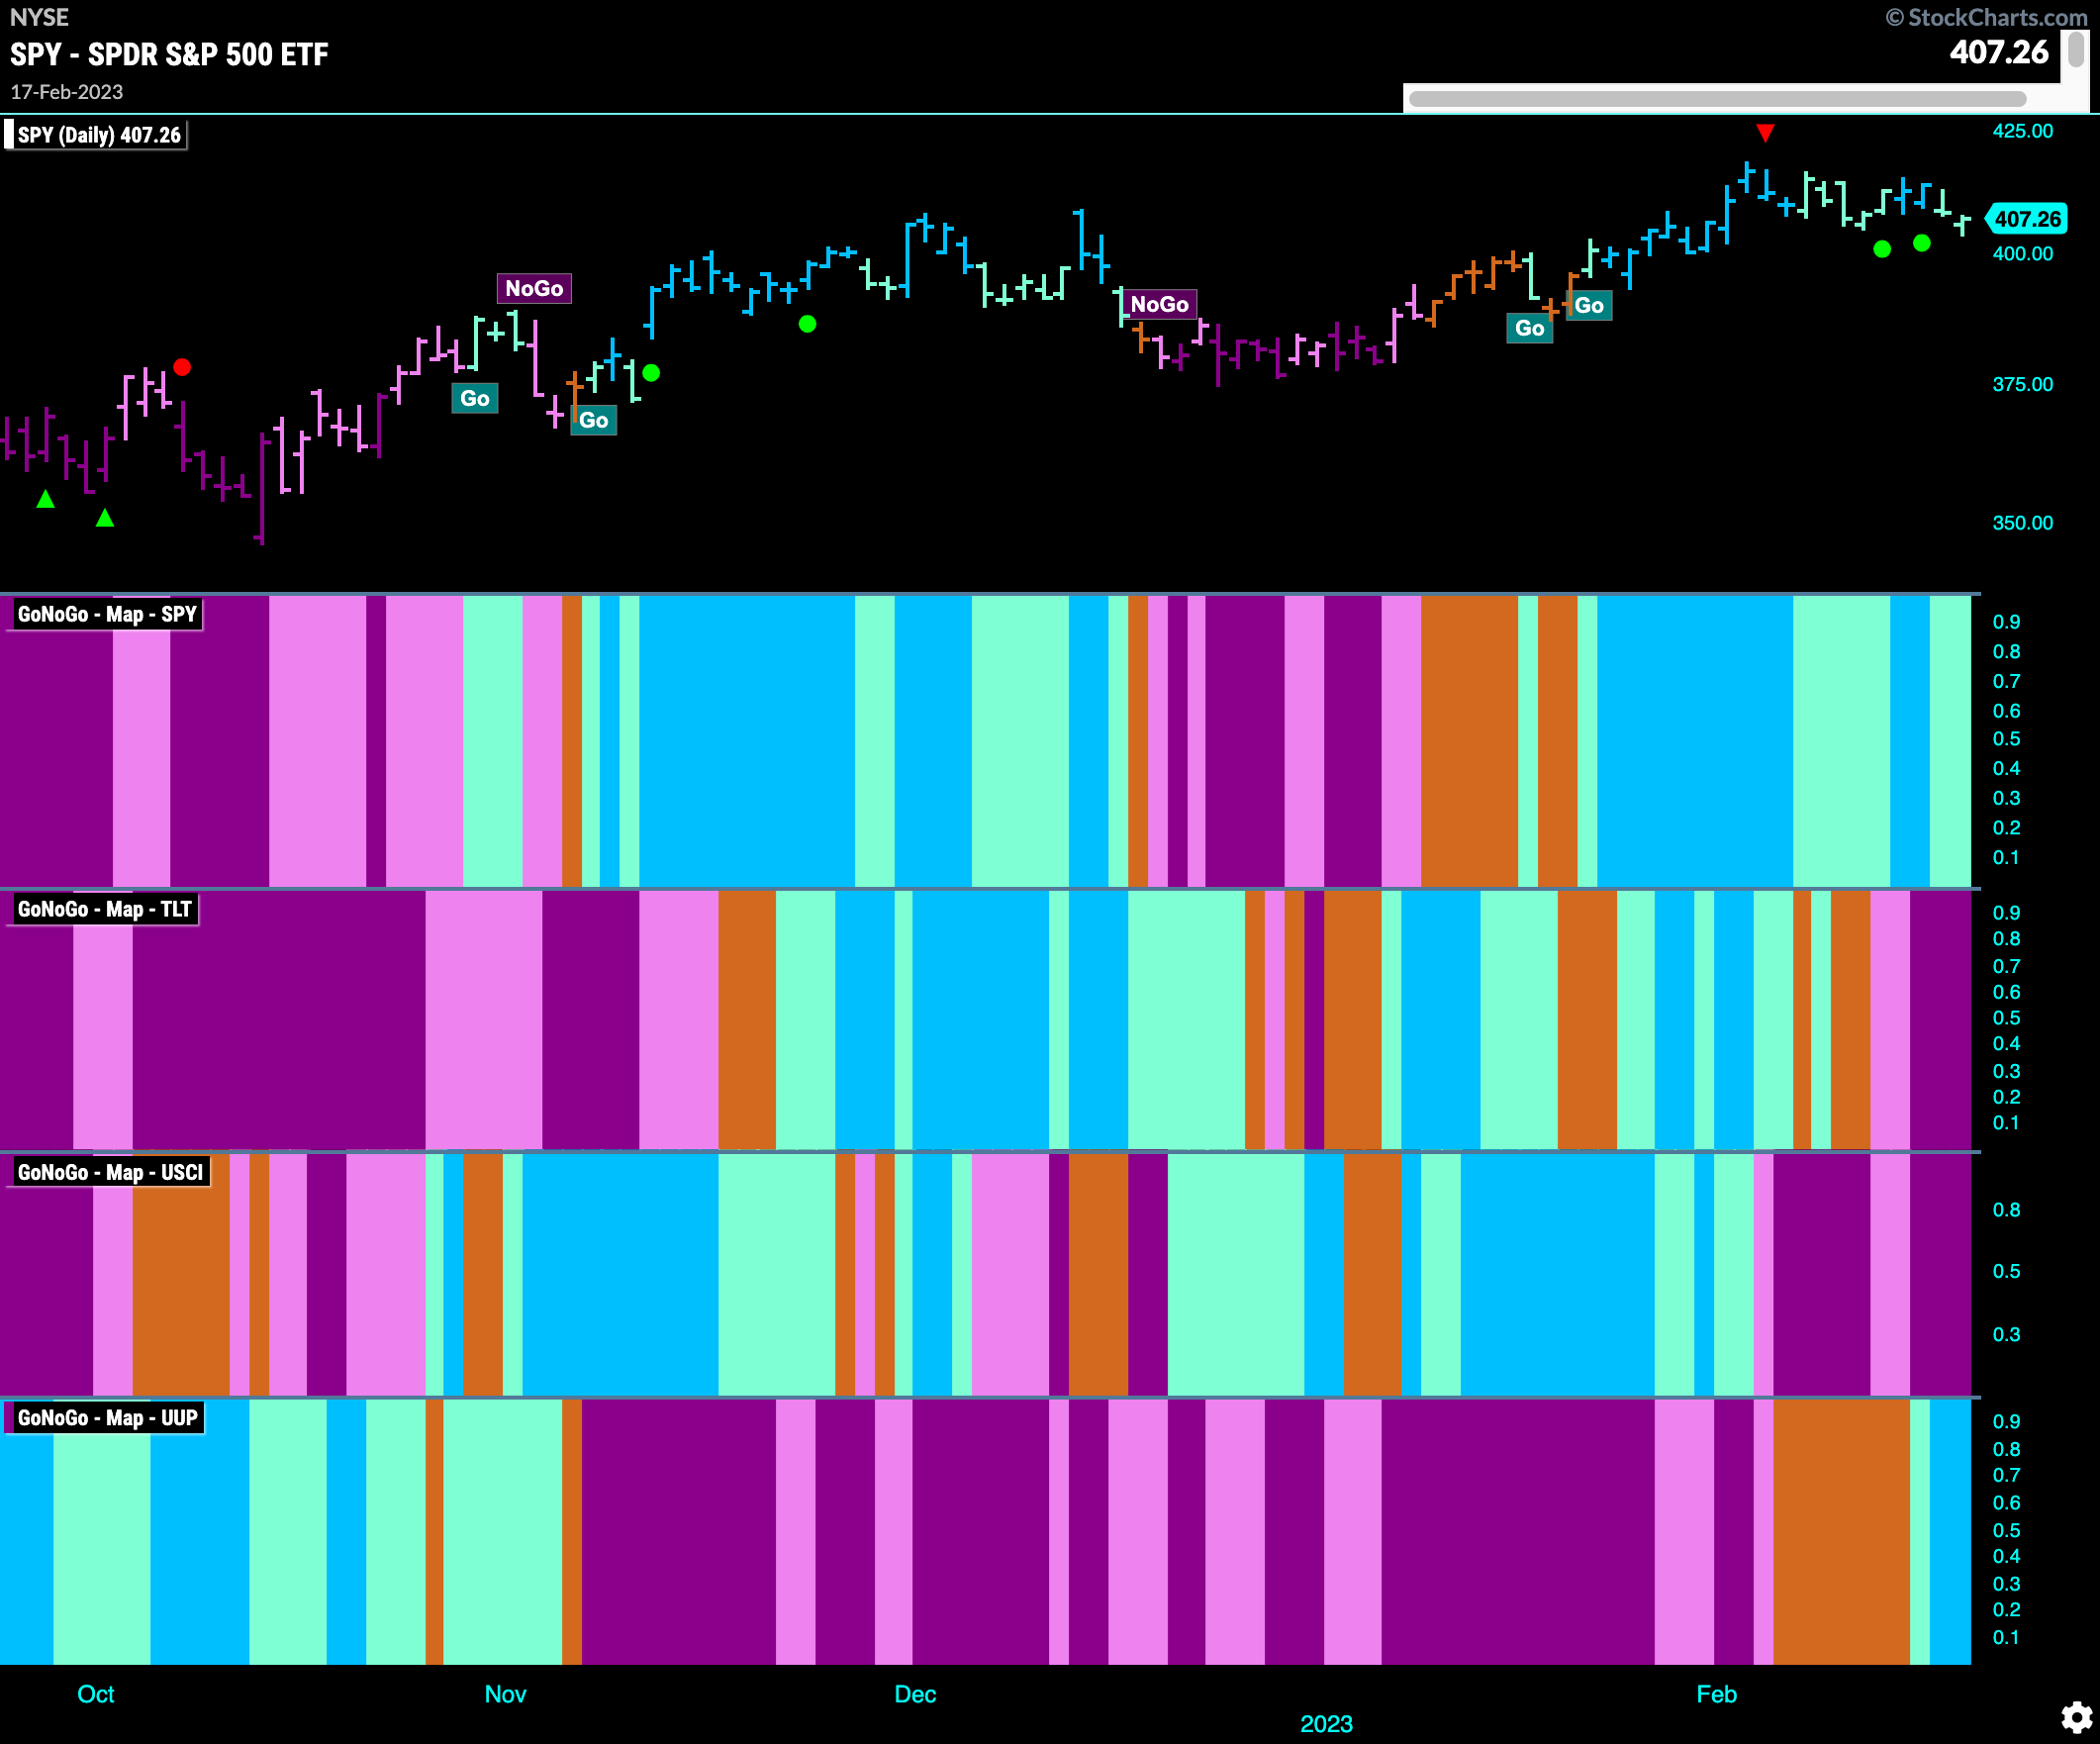
Equities Continue to Pull Back From Recent High
GoNoGo Trend shows that the “Go” trend remains however we have seen price fall into paler aqua bars at week’s end. We are testing support from November highs and so we will watch to see if the correction stops here. GoNoGo Oscillator is once again at the zero line where we will need to see it find support if the “Go” trend is to continue. 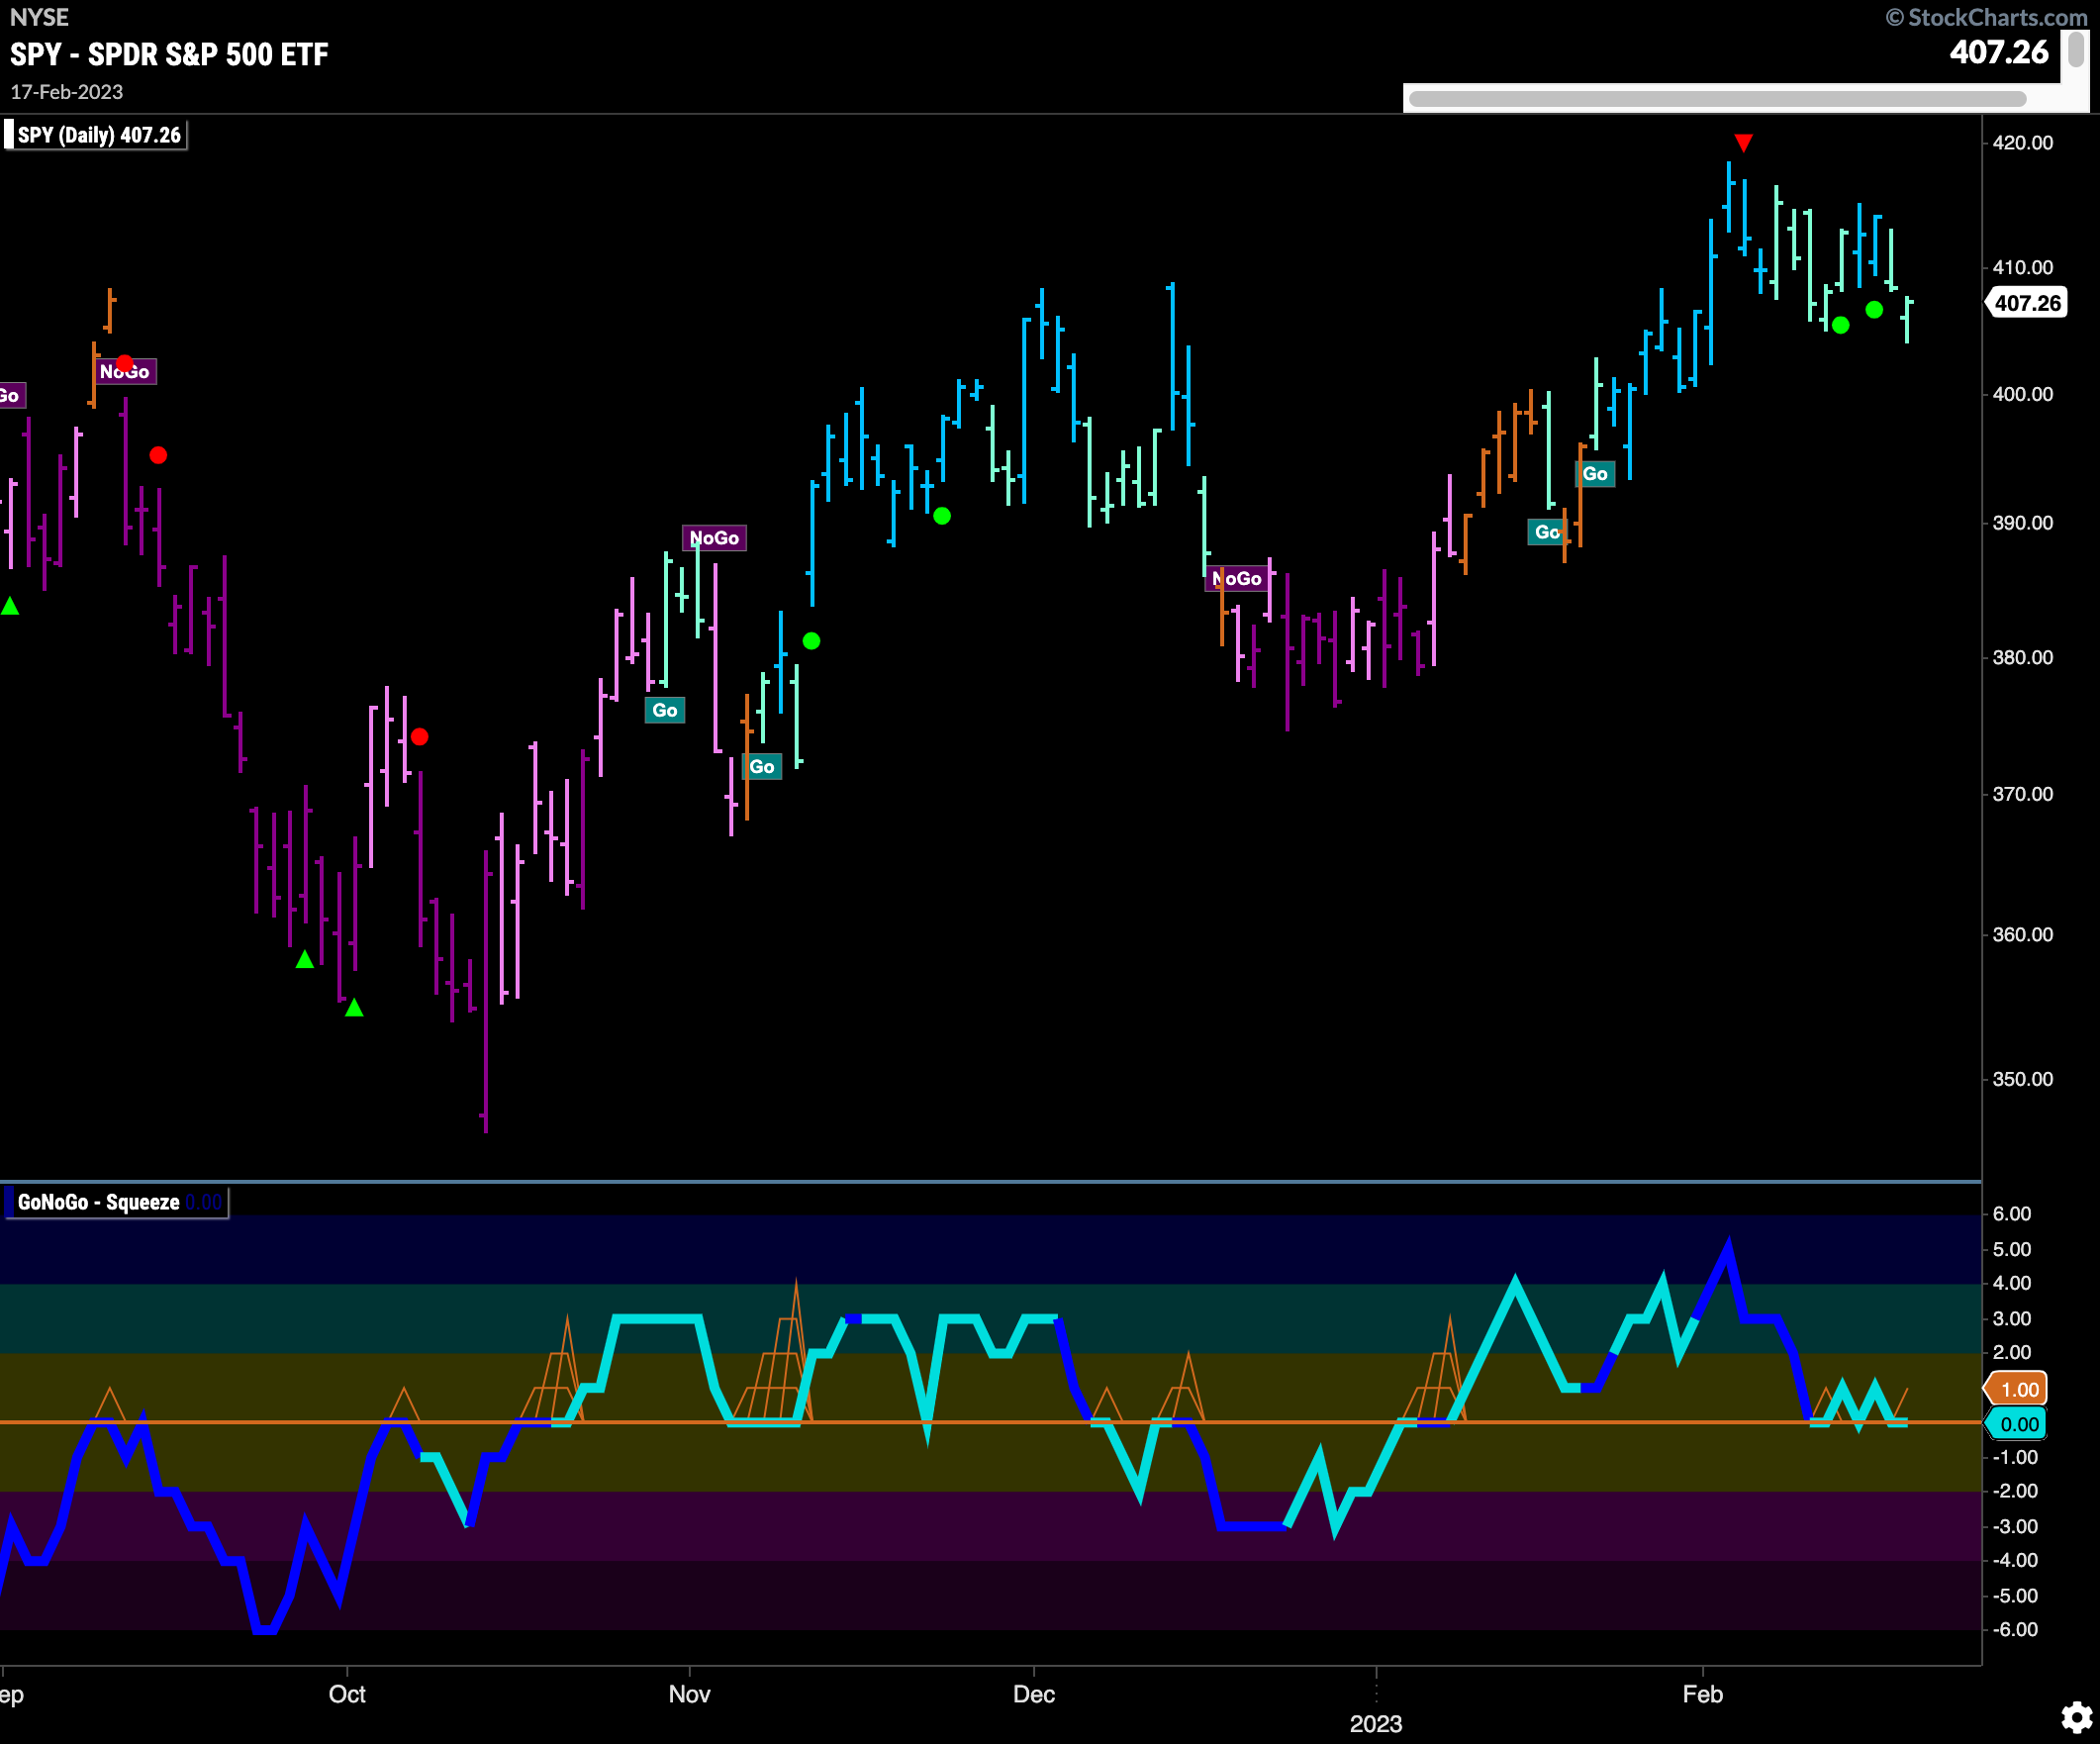
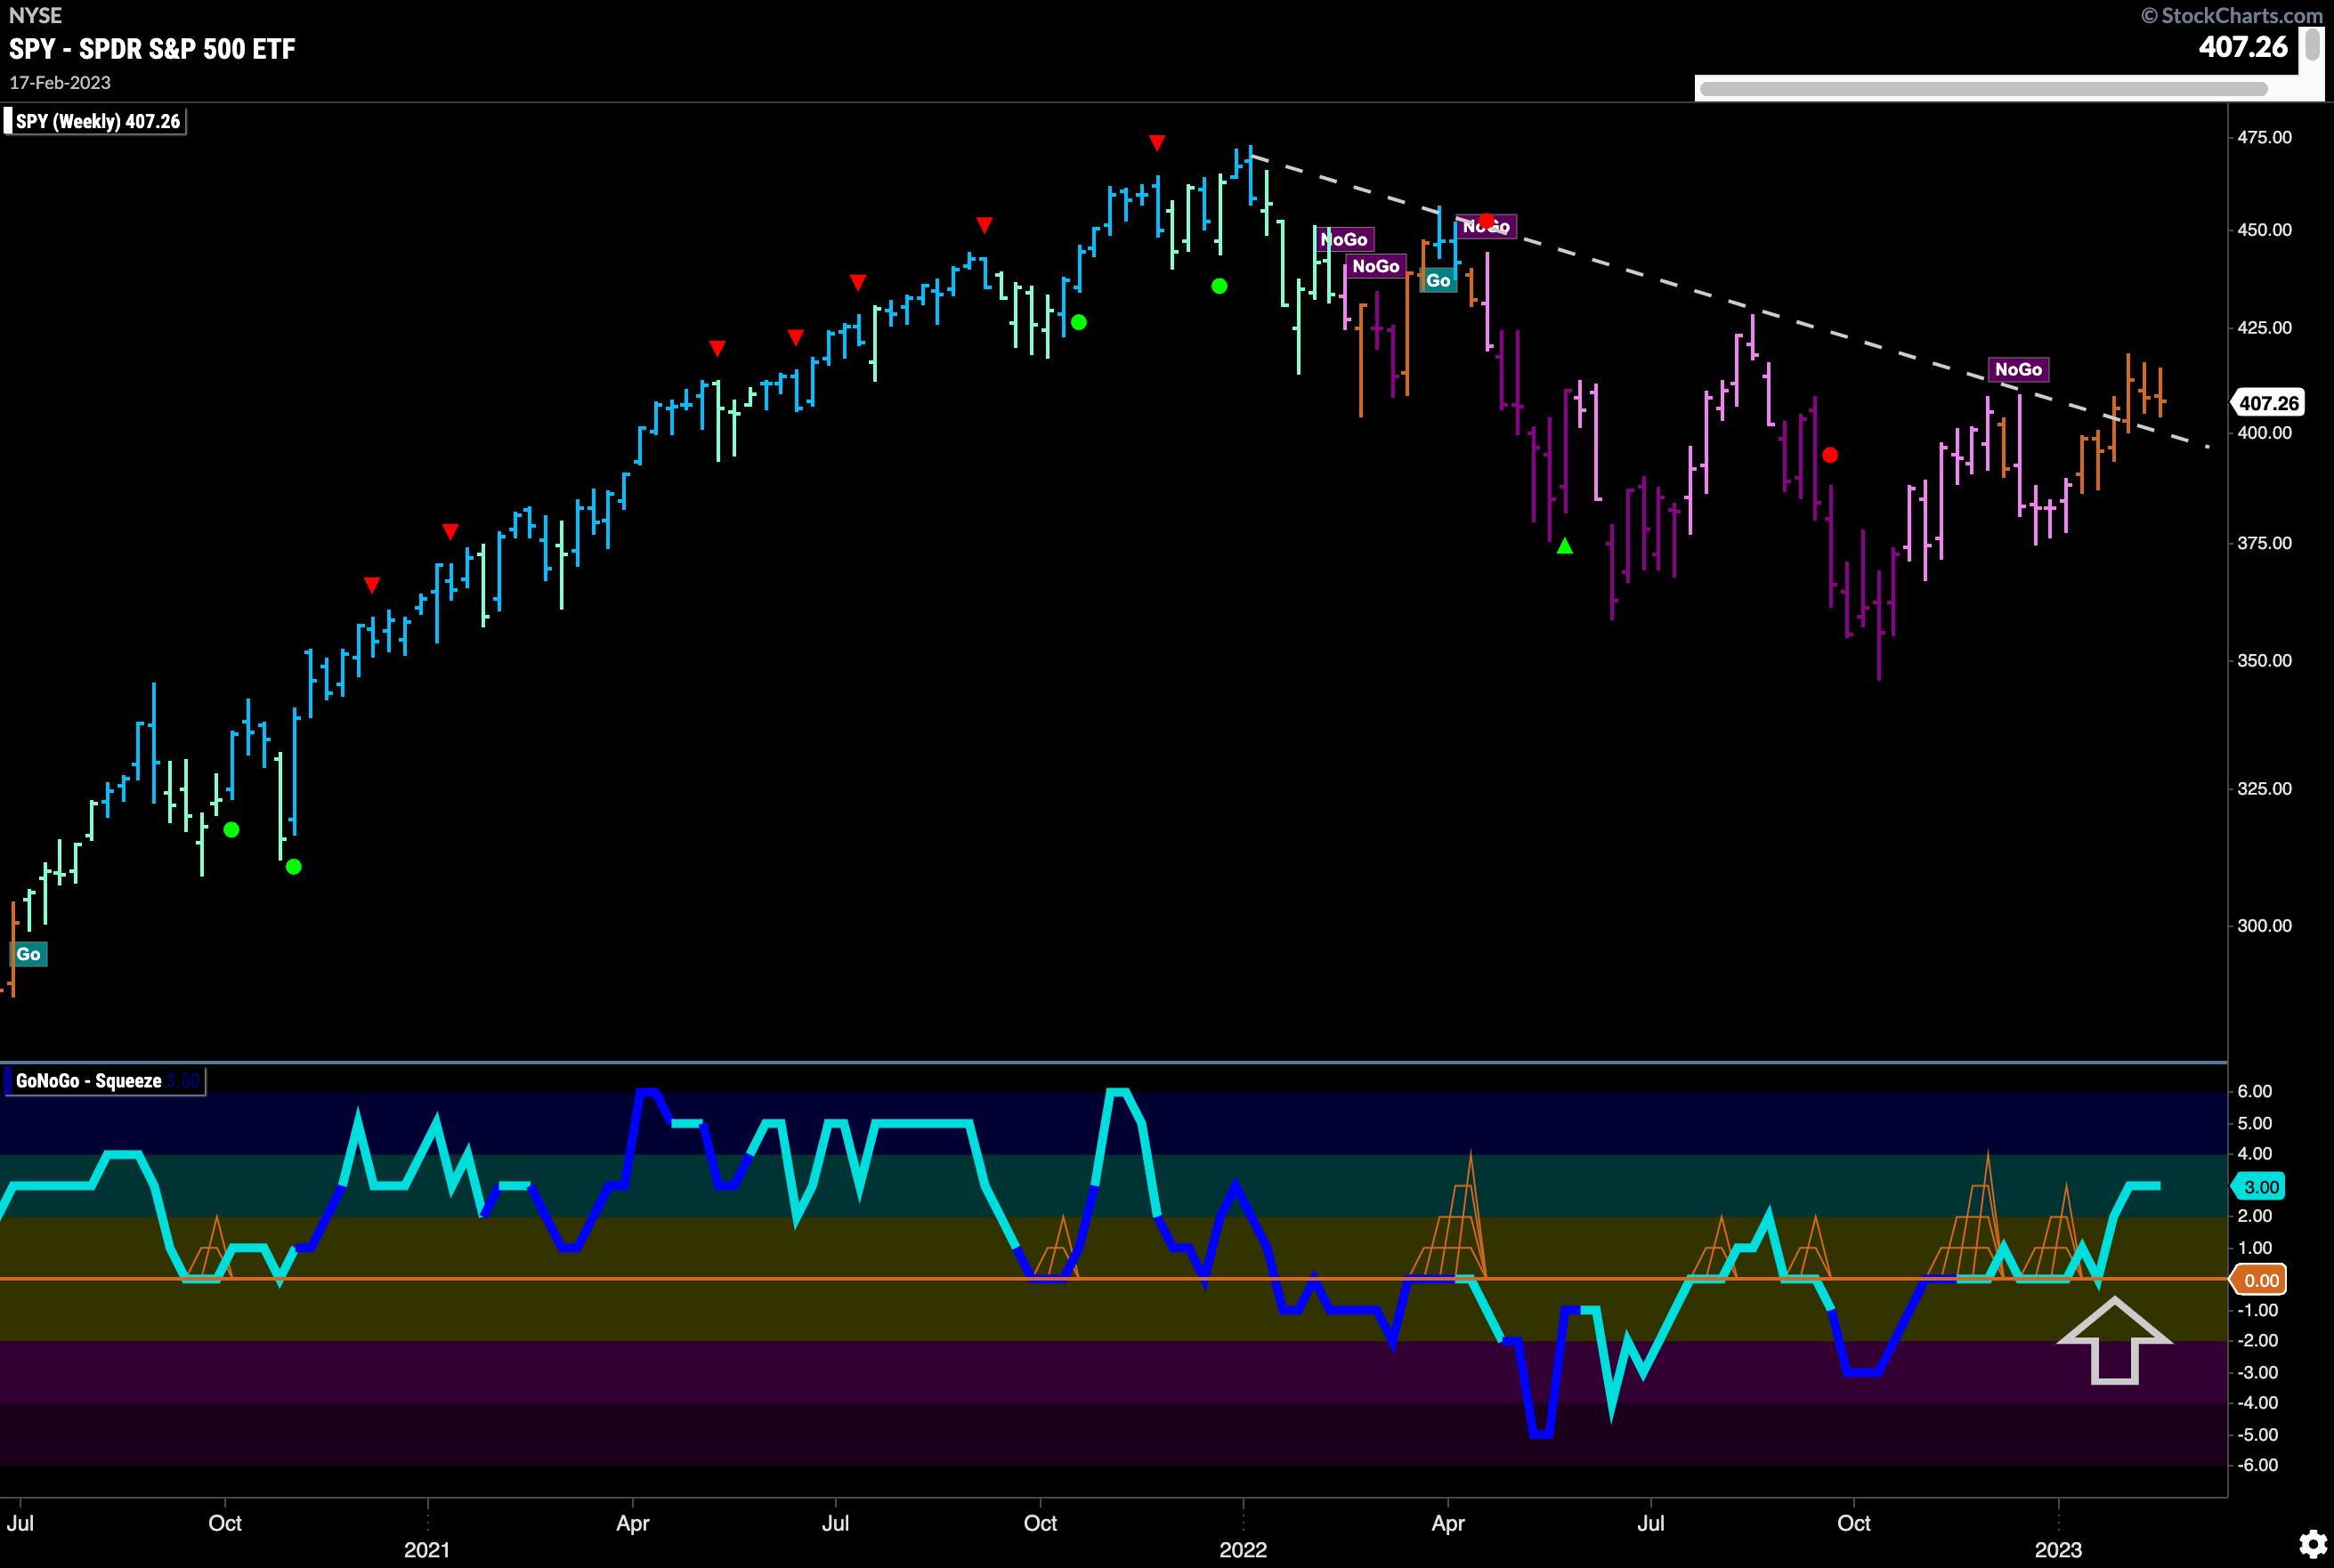
The longer term weekly chart shows another amber “Go Fish” bar! This has been quite a string of uncertainty as price is able to climb above the downward sloping trend line and consolidate above. GoNoGo Oscillator remains in positive territory but not overbought after rallying off the zero line a few weeks ago.
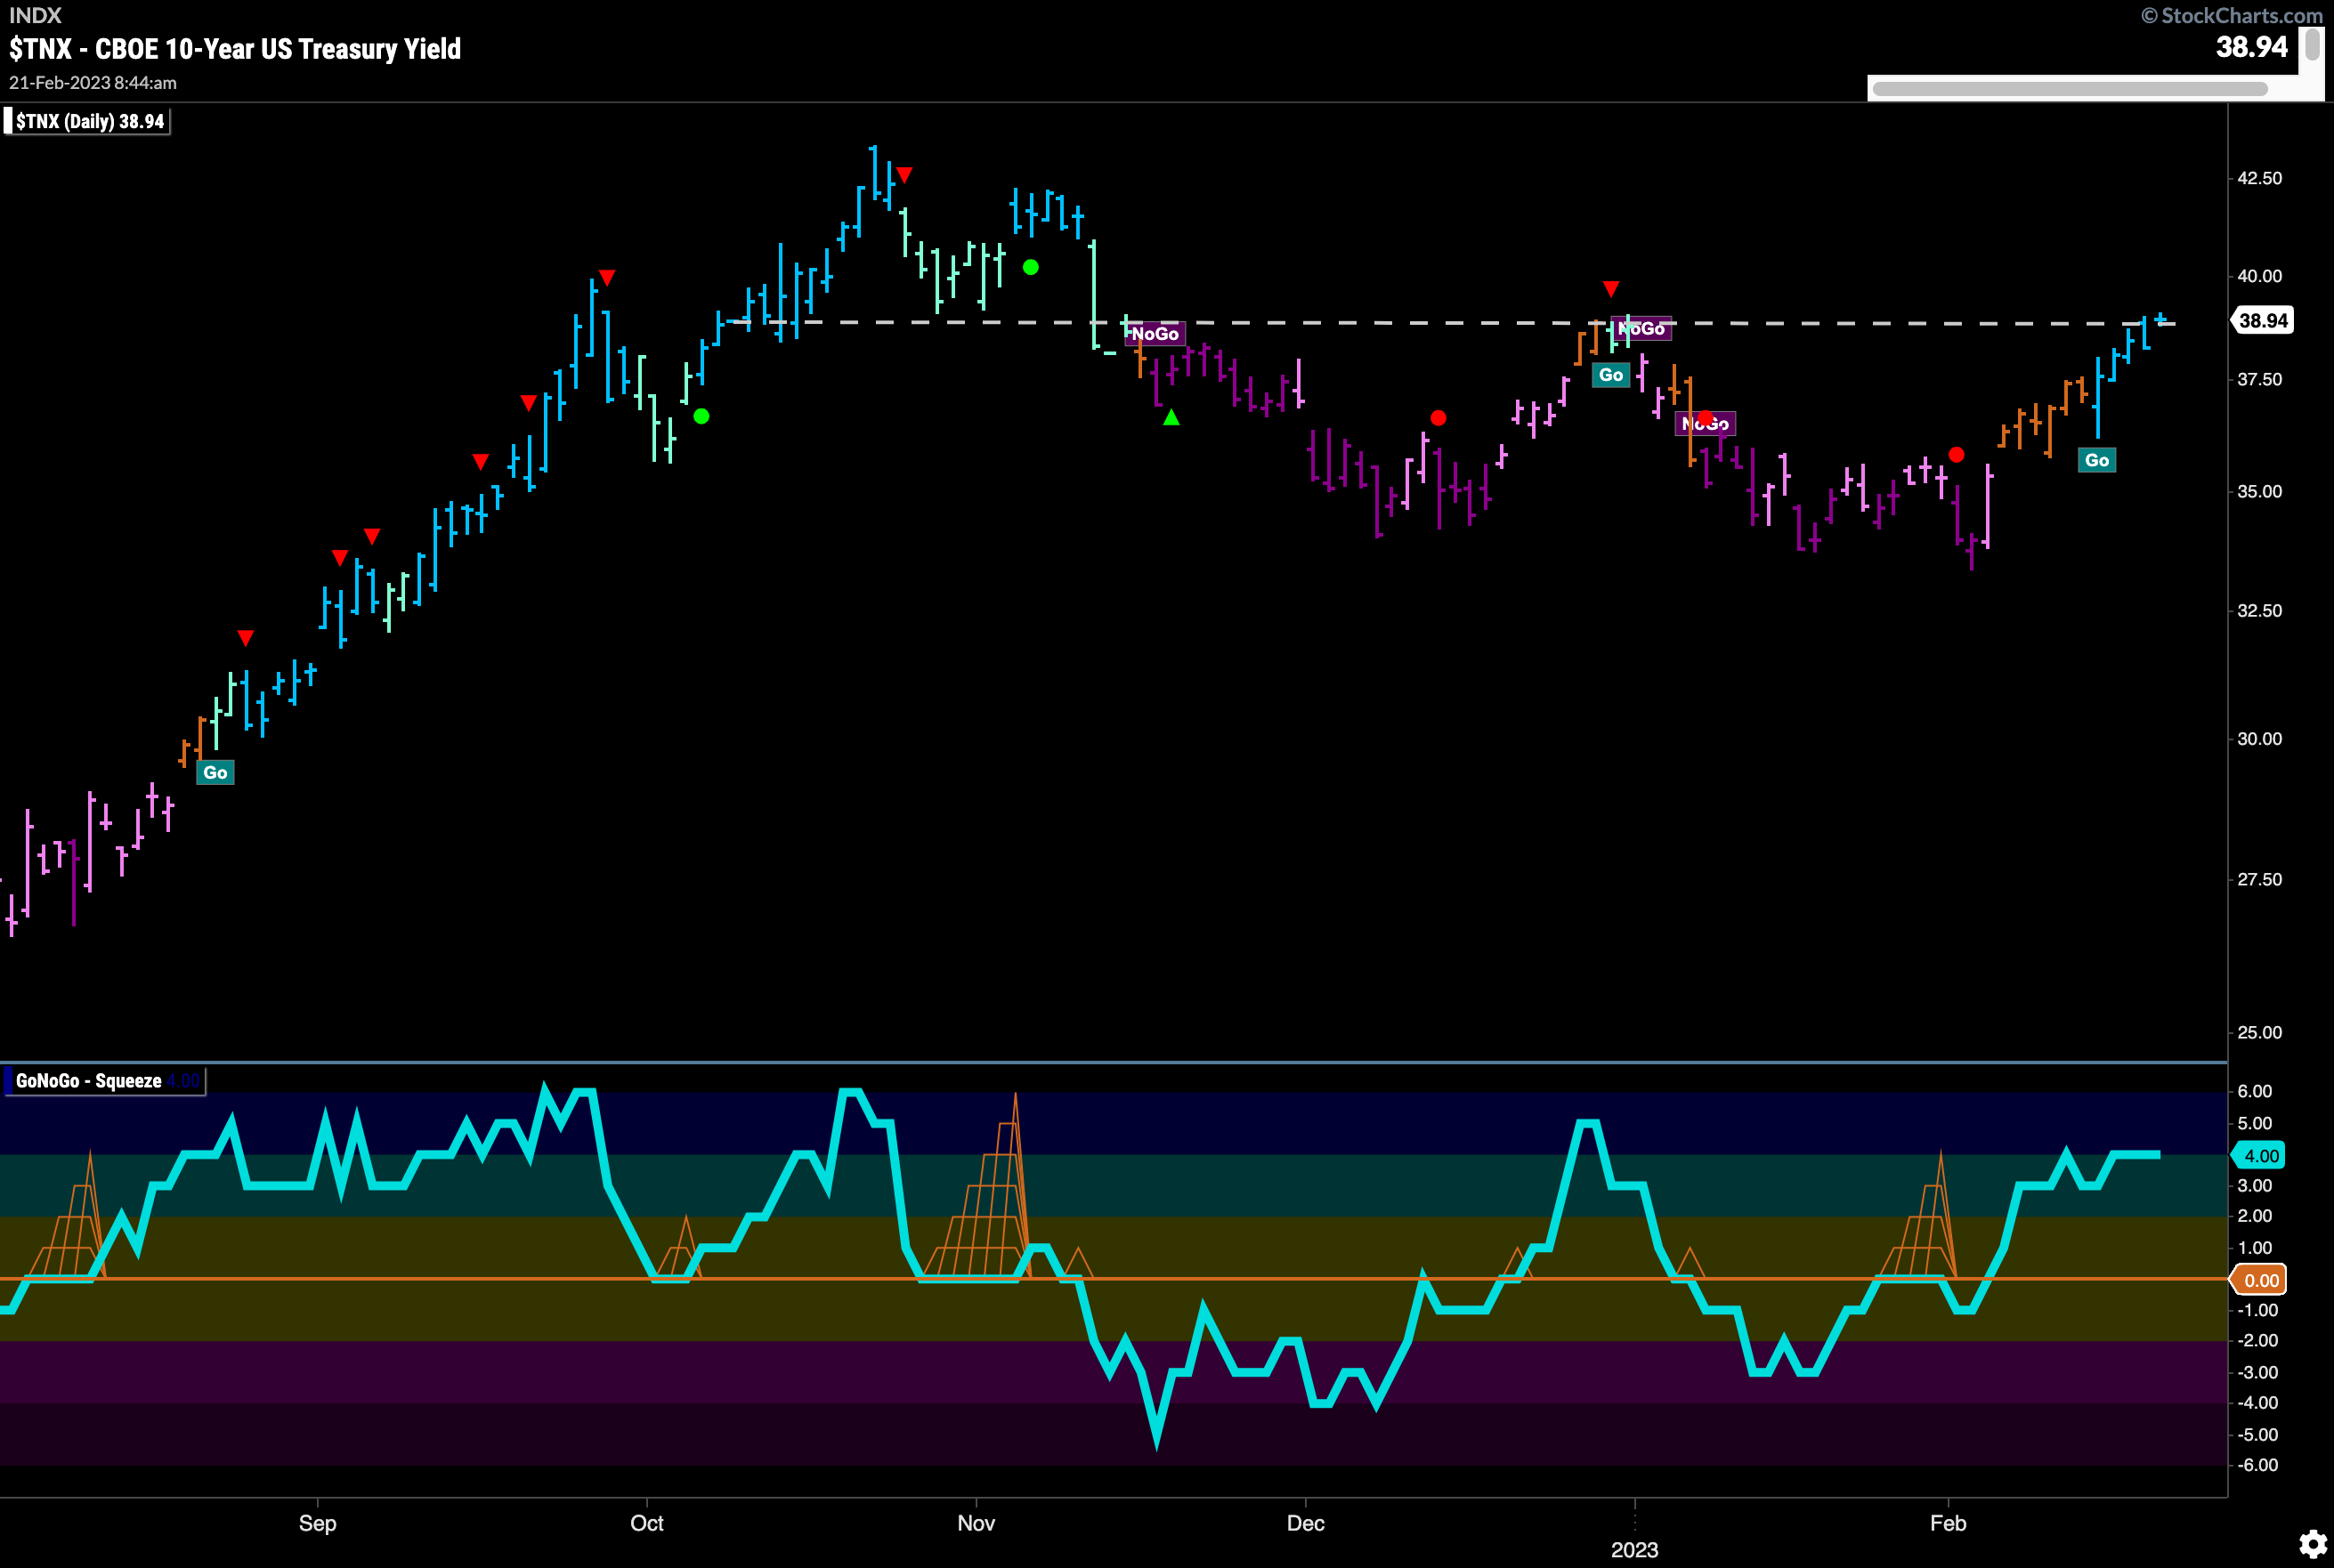
Treasury Rates Back in “Go” Trend
Treasury rates continued to rally and GoNoGo Trend was able to paint strong blue “Go” bars this week as price rises to test resistance from prior high. We will be noting whether this stops rates in its tracks or if we will set a new high as GoNoGo Oscillator shows positive momentum.
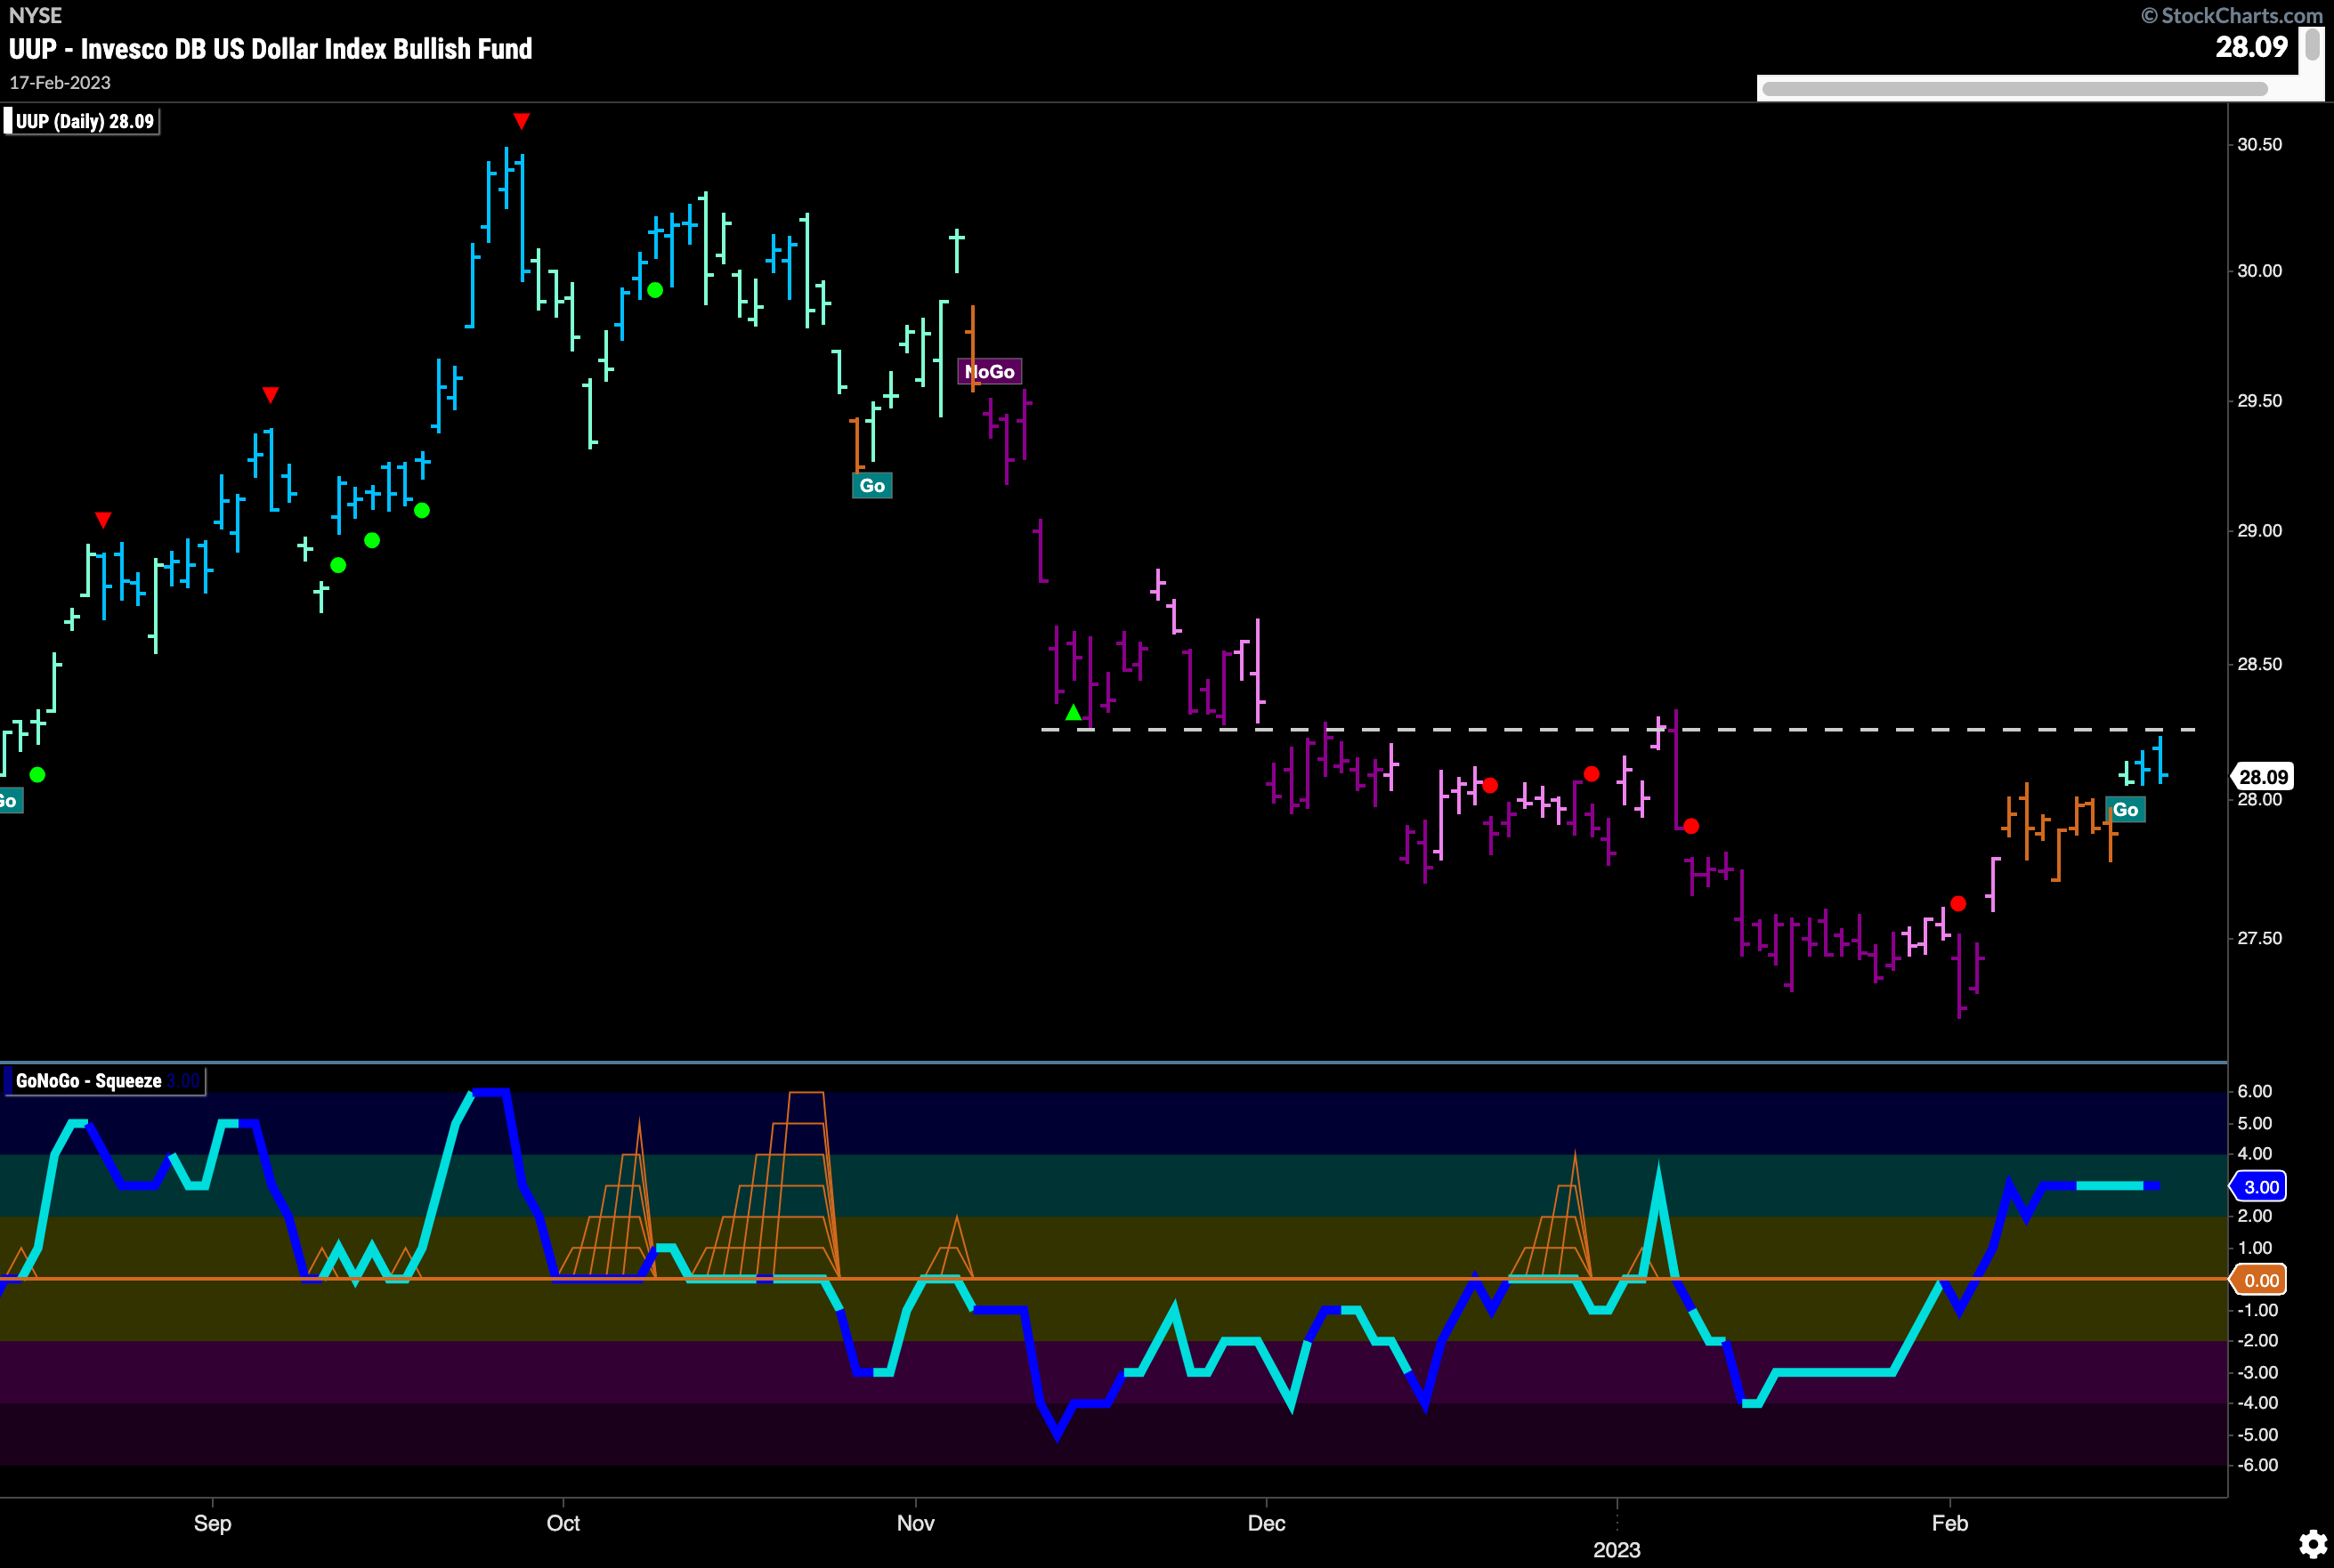
The Dollar Enters “Go” Trend
Almost in lockstep with treasury rates, we see the U.S. dollar entering a “Go” trend this week after a period of uncertainty. We are now dealing with some overhead resistance that we can see on the chart in the form of the horizontal line. GoNoGo Oscillator is in positive territory but not overbought and volume is heavy. We can expect a little struggle here but if price moves above resistance this could signal further gains for the greenback.
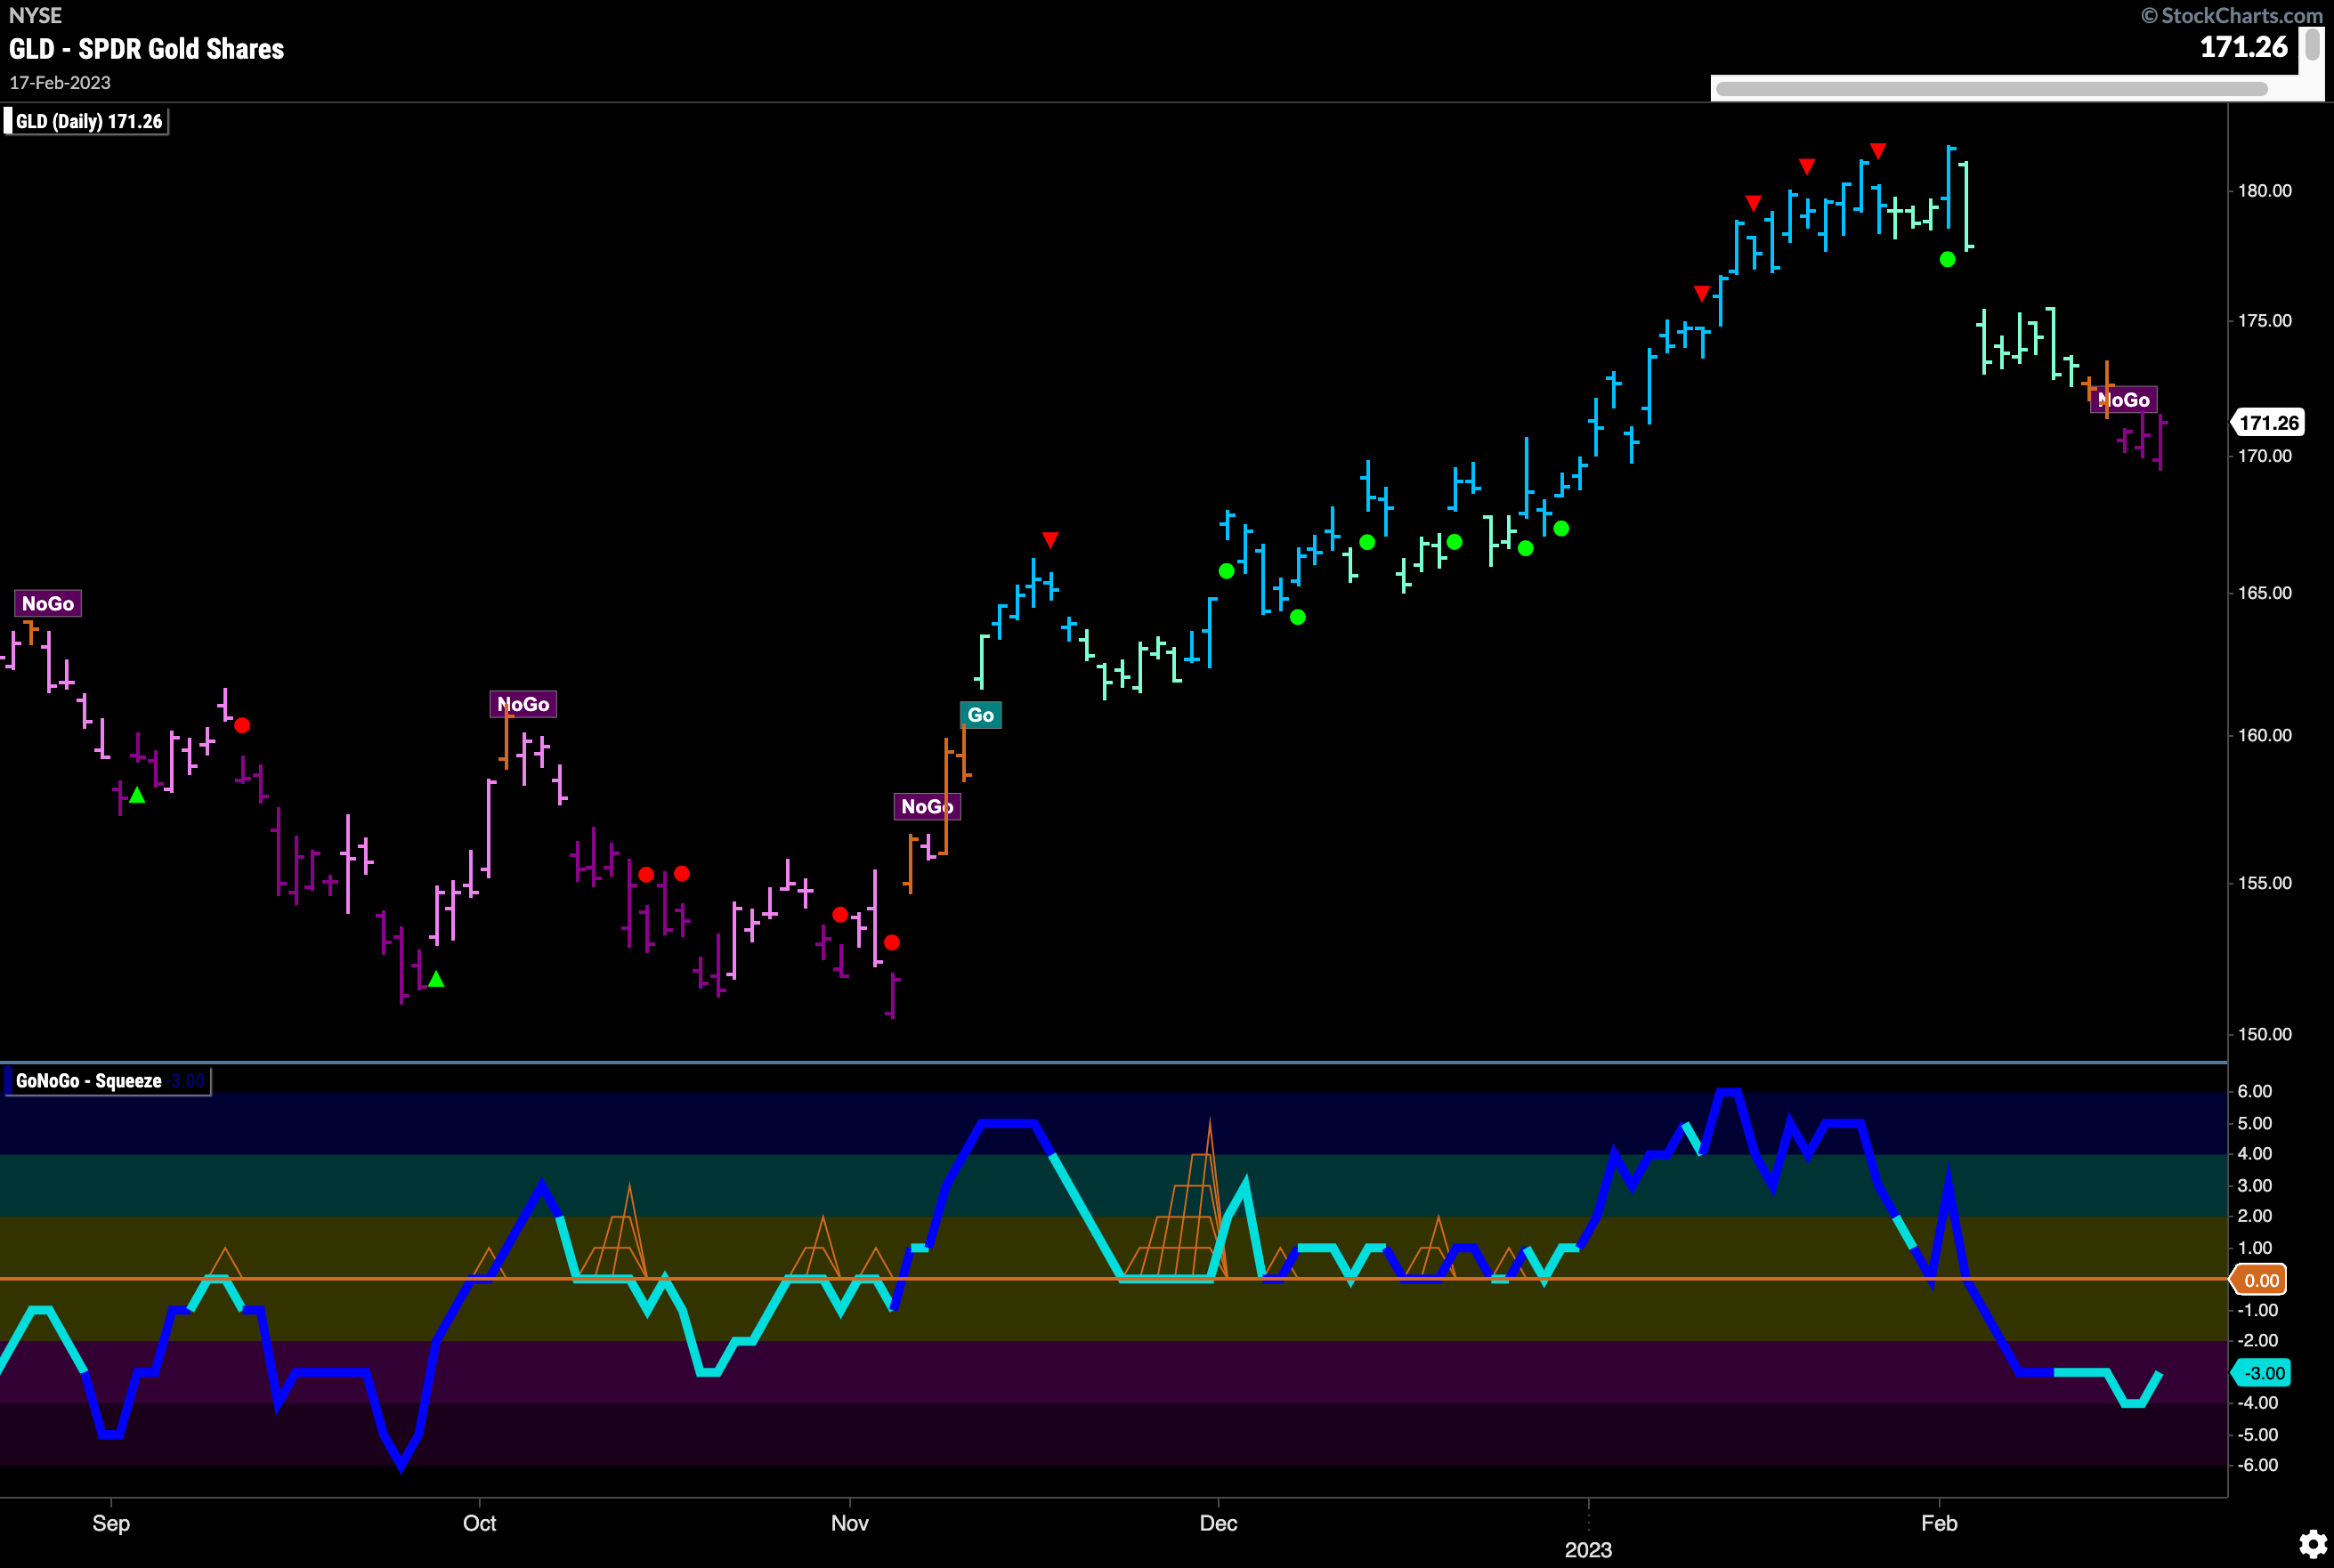
Gold Turns Tail and Enters “NoGo”
Gold prices moved lower this week and GoNoGo Trend painted strong purple “NoGo” bars. This trend change came after GoNoGo Oscillator broke below the zero line on heavy volume a few weeks ago. Currently, GoNoGo Oscillator shows that momentum is in negative territory but not yet oversold. With no obvious support at these levels we could see $GLD fall a little further.
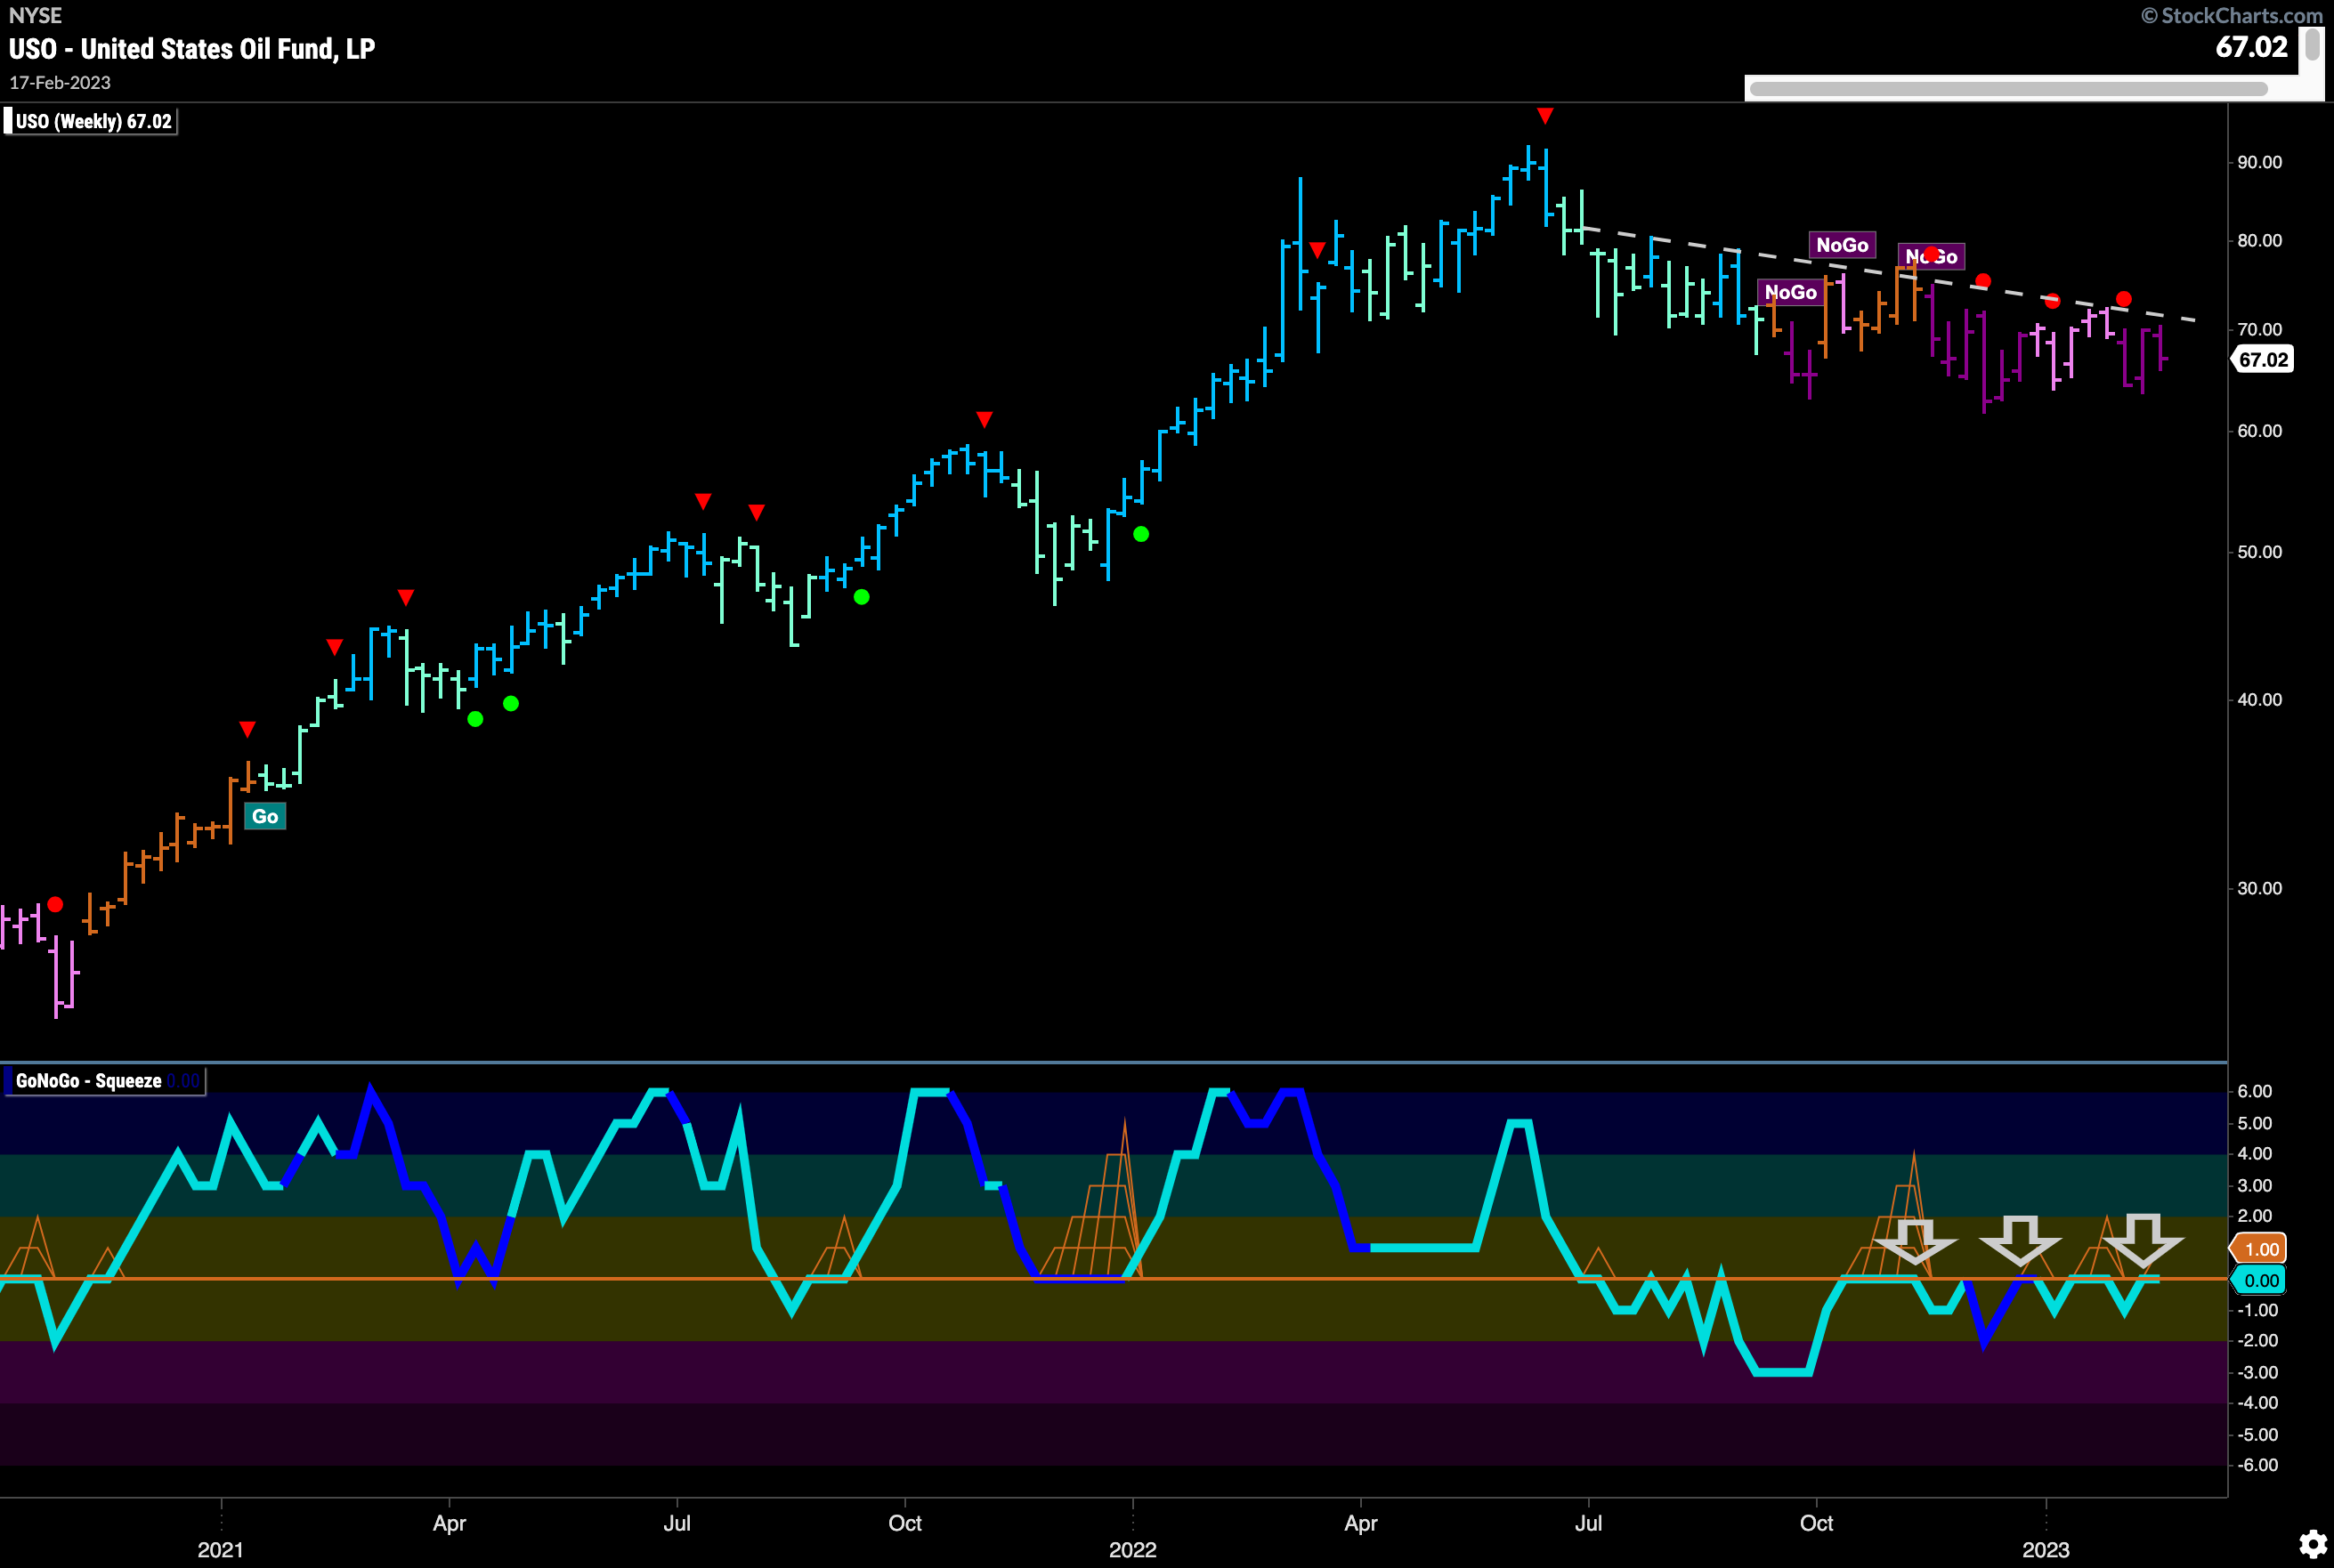
Oil’s Slowly Grinds Lower
$USO on a weekly chart shows all of the choppy movement on the daily chart has not done much to change the fact that the larger time frame trend remains a “NoGo” and we see prices move slowly lower respecting the downward sloping trend line. GoNoGo Oscillator has had all manner of difficulty getting far away from the zero line but has not yet been able to break into positive territory. We will watch to see if it gets rejected again at this level.
 Sector RelMap
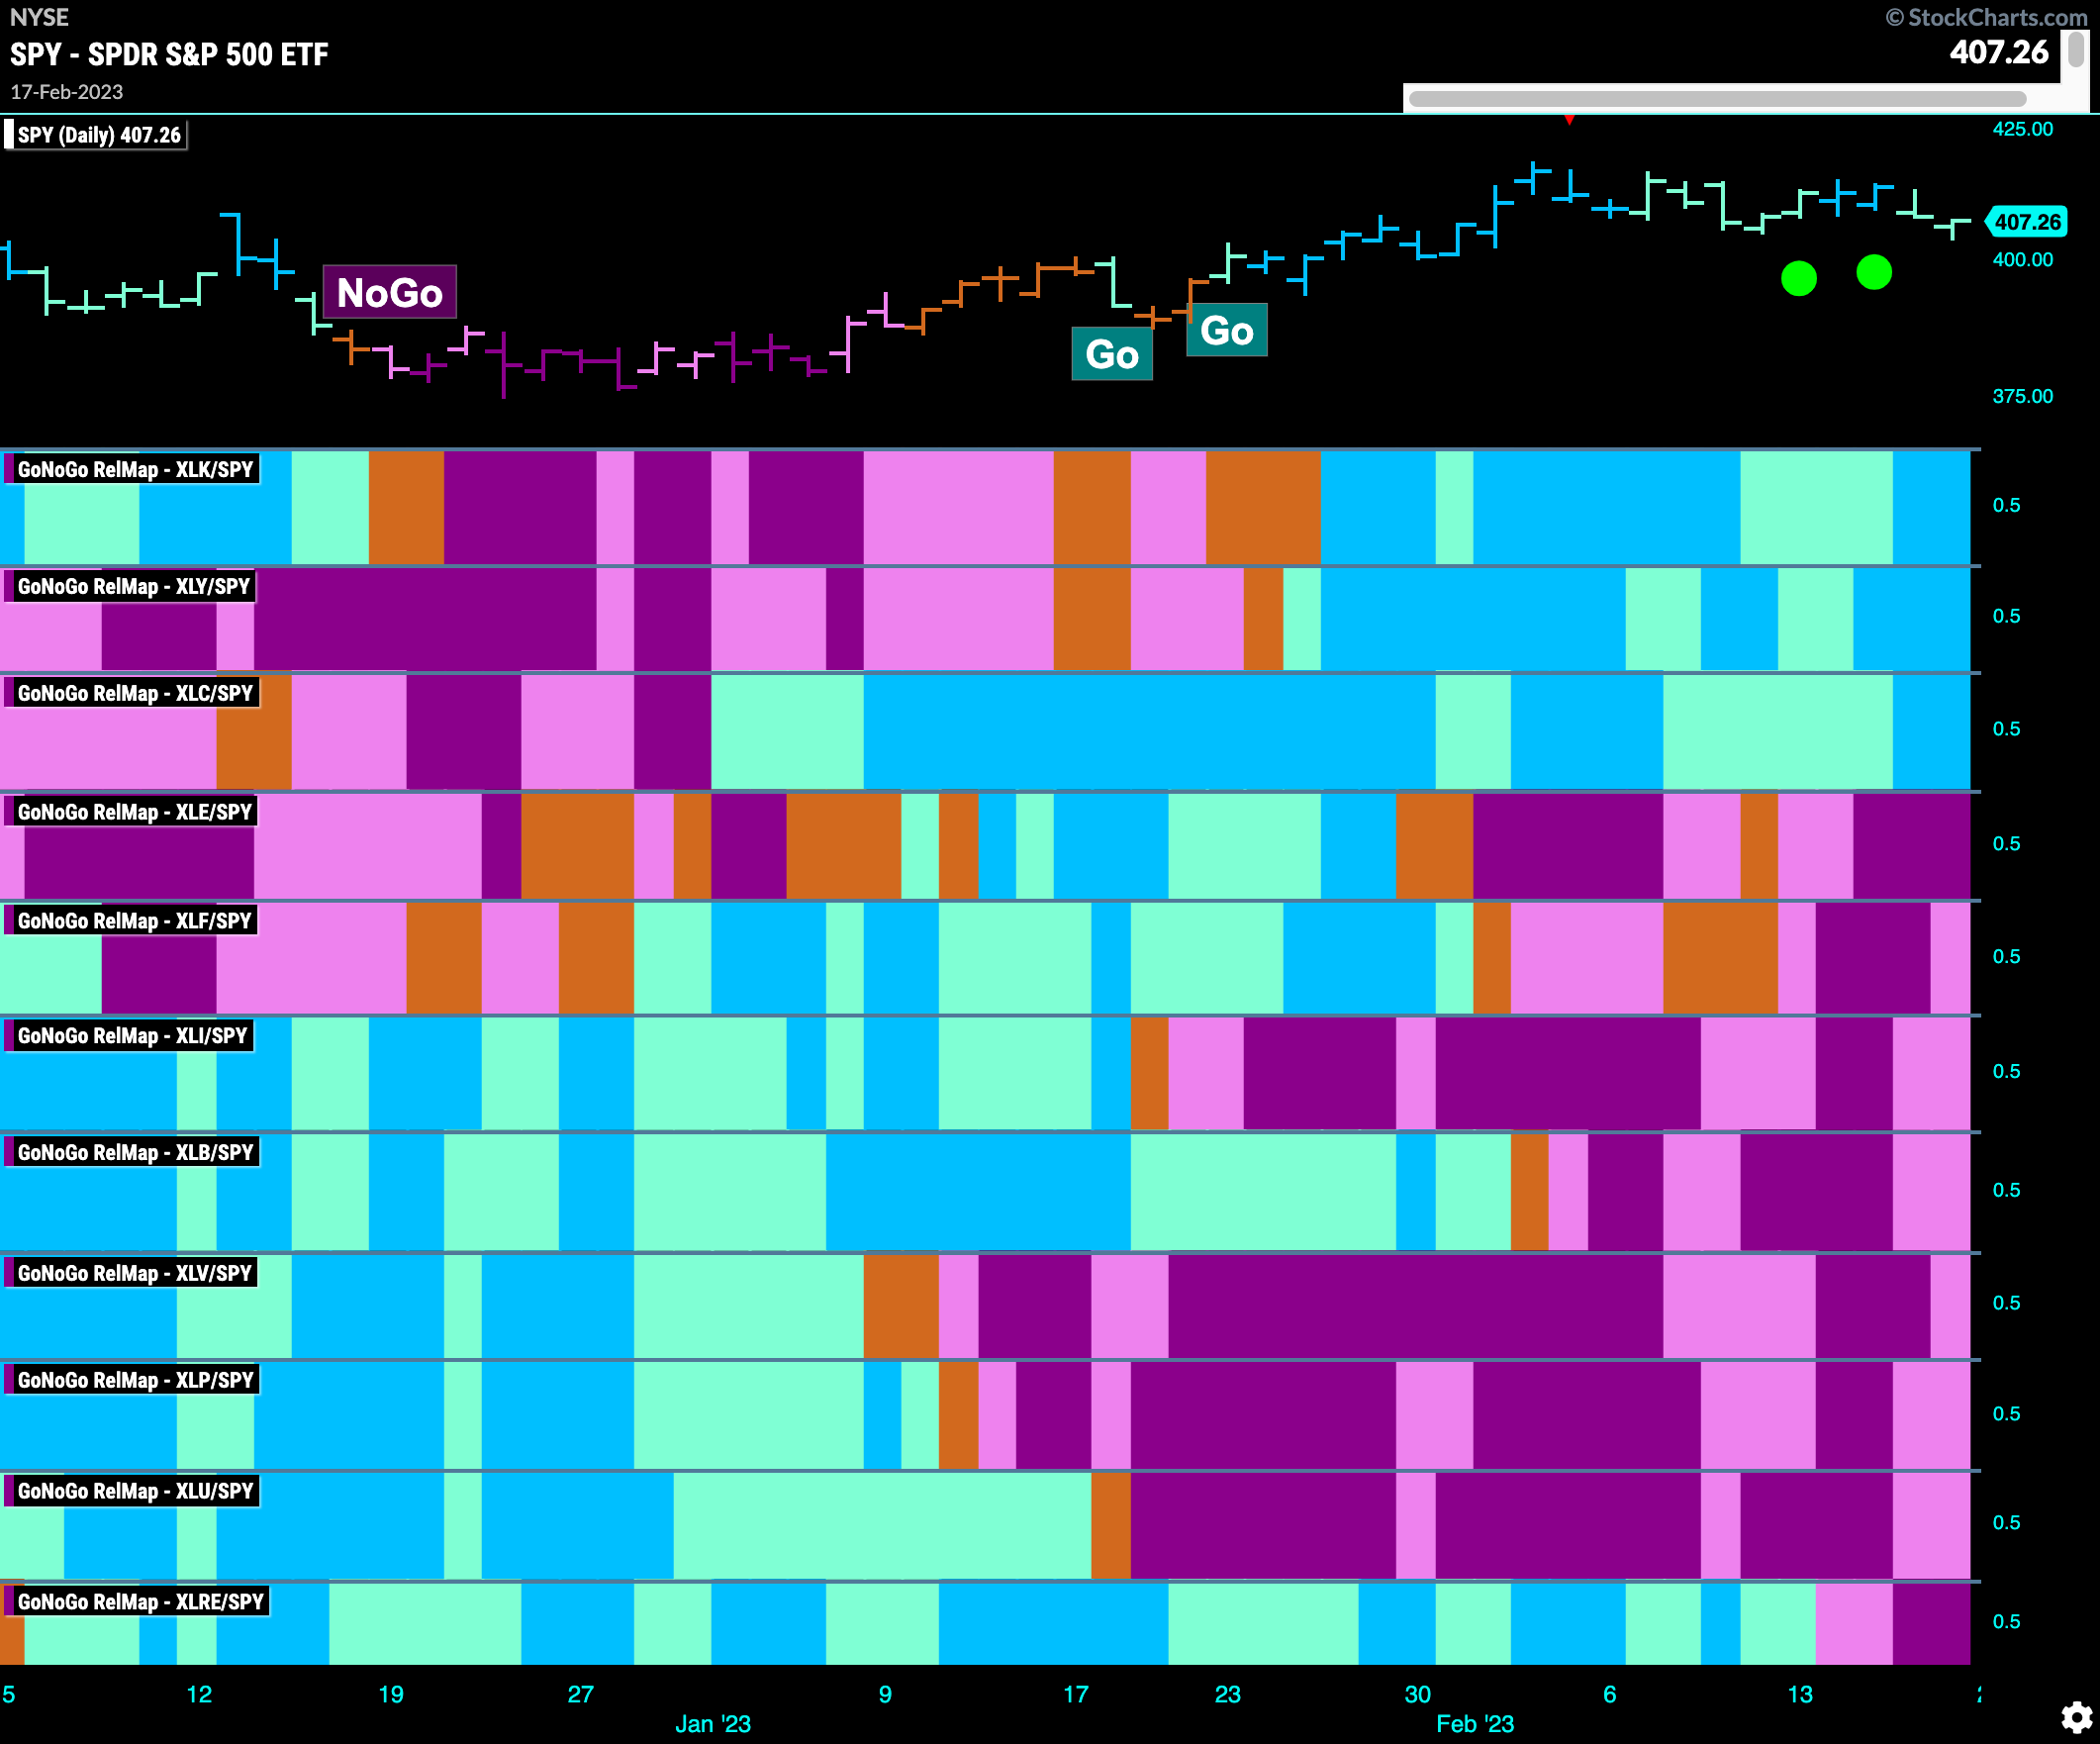
Below is the GoNoGo Sector RelMap. This GoNoGo RelMap applies the GoNoGo Trend to the relative strength ratios of the sectors to the base index. Looking at this map, we can quickly see where the relative outperformance is coming from as well as which sectors are lagging on a relative basis. Only 3 sectors are outperforming the base this week. $XLK, $XLY, $XLC are painting “Go” bars. Relative outperformance is still being driven by the growth sectors.
Technology Falls Again to Test Support
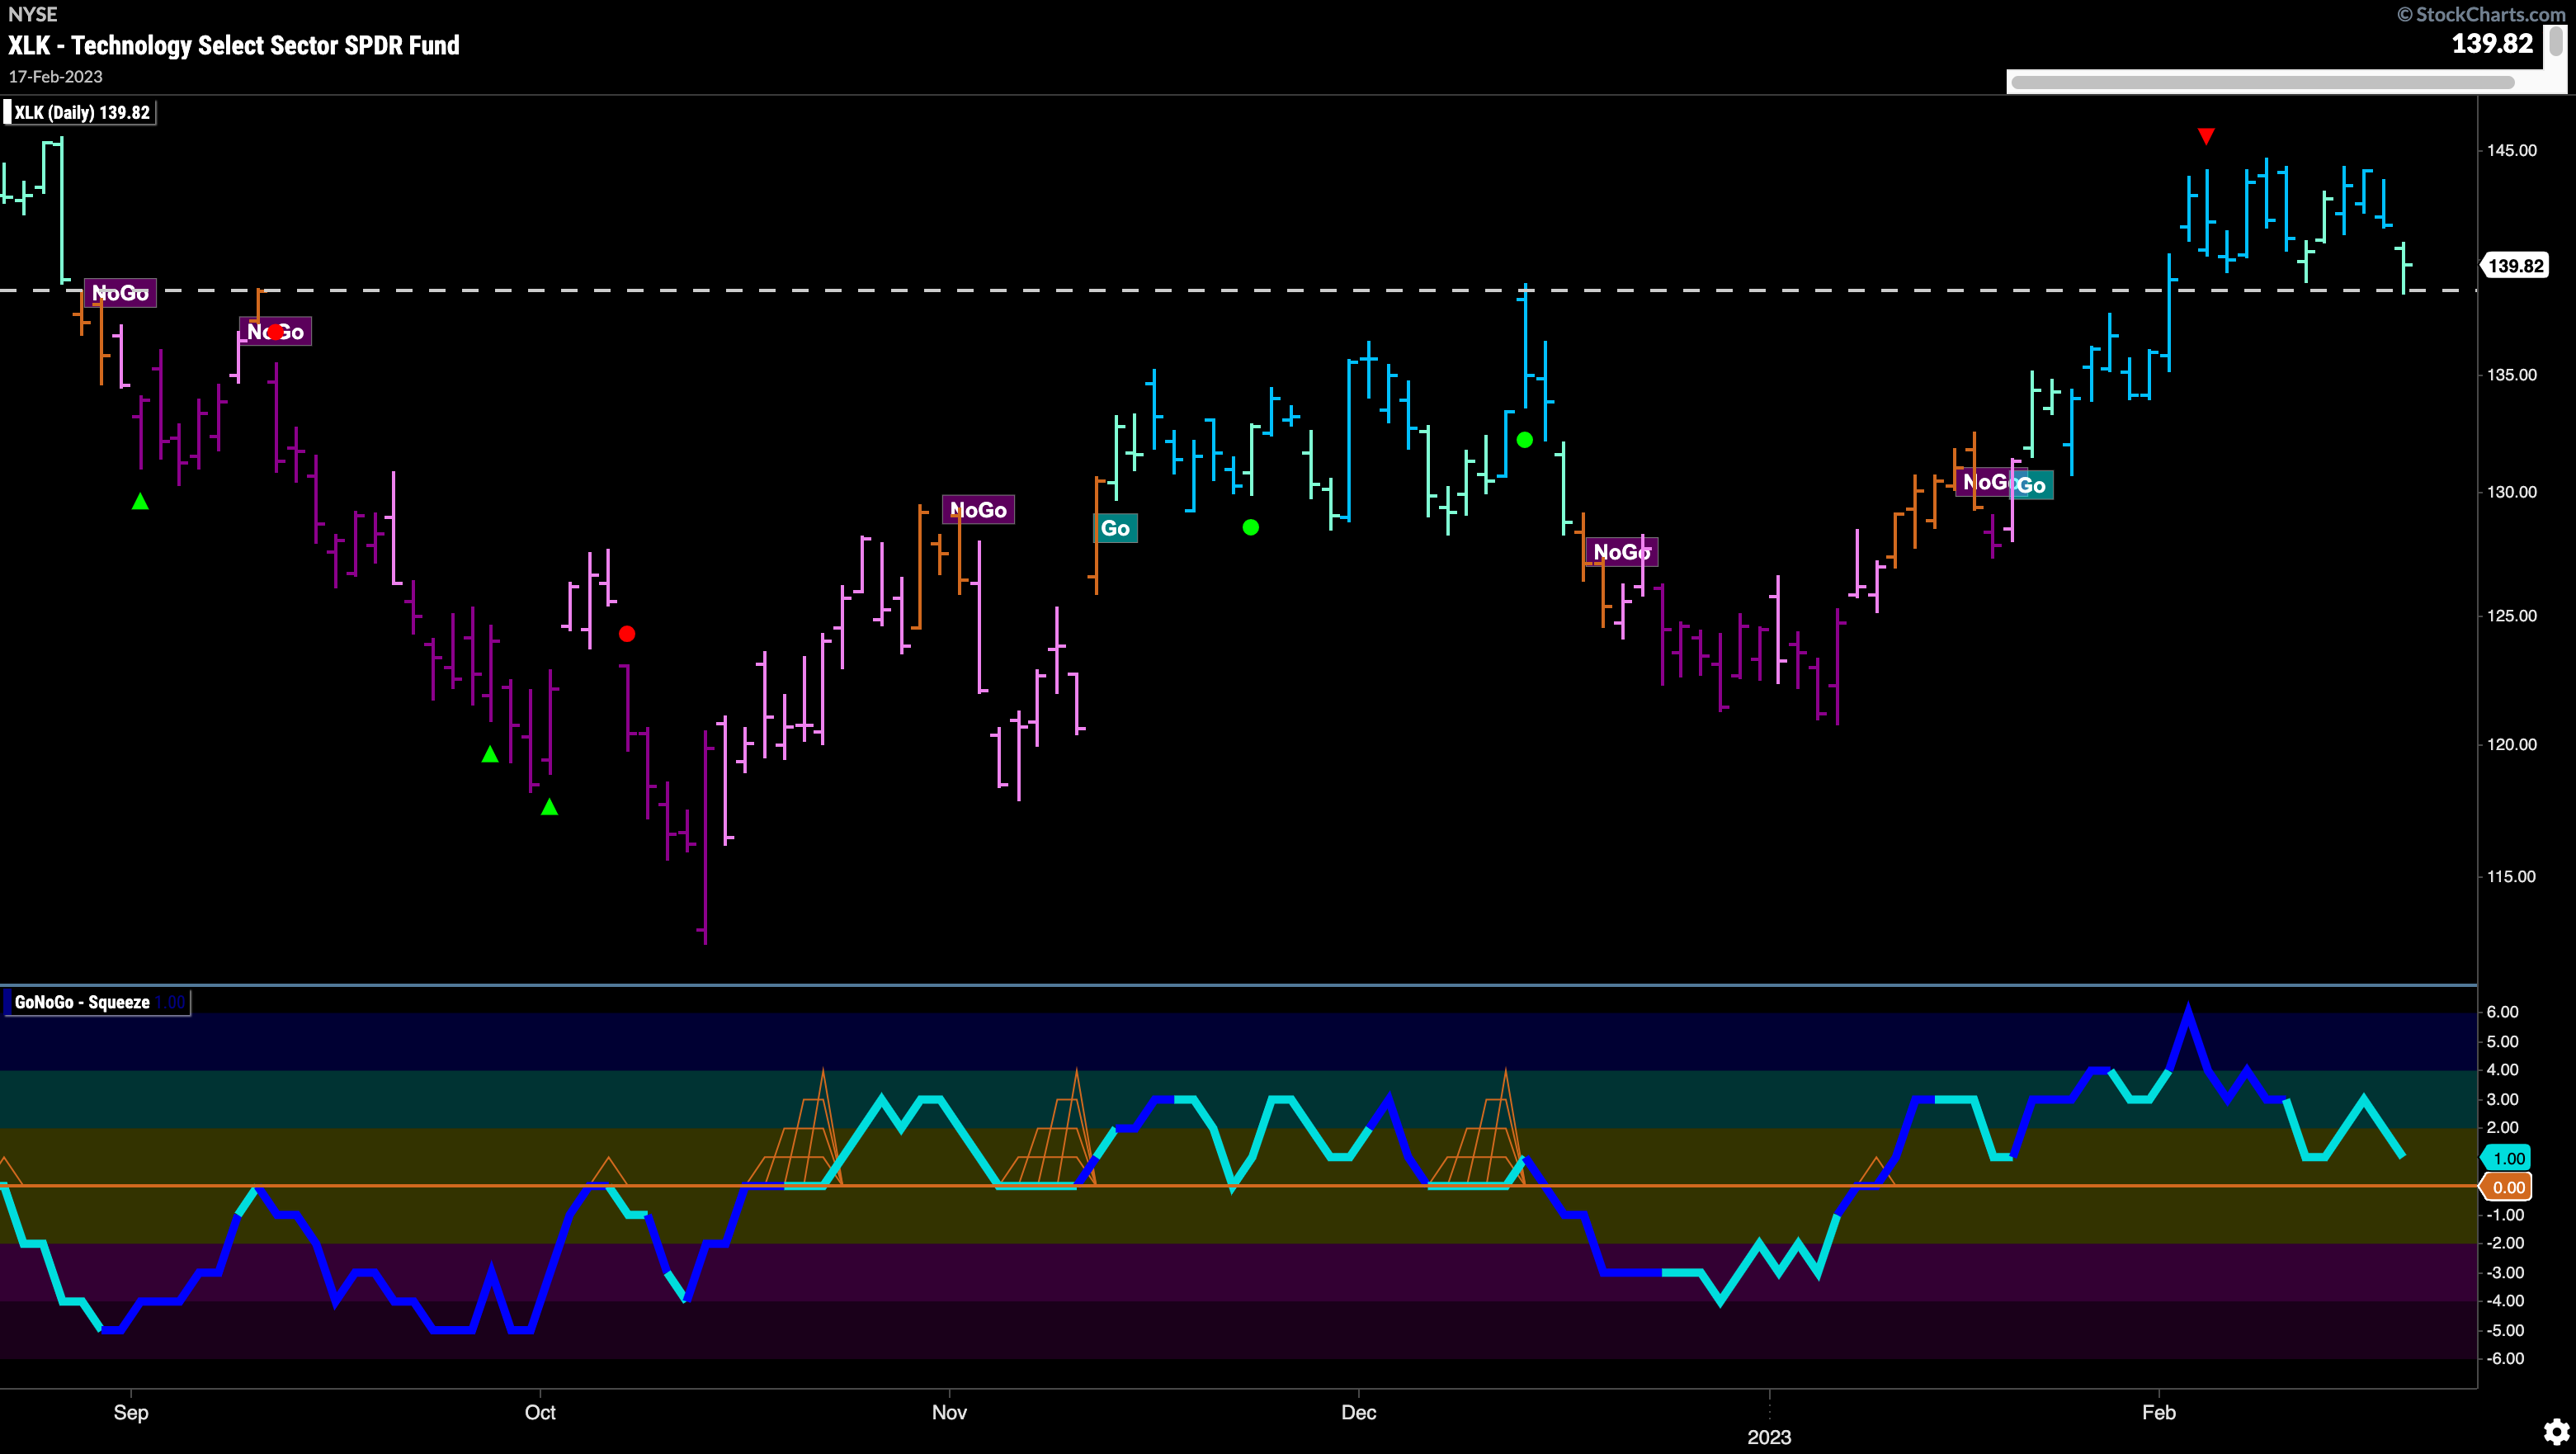
The chart below shows the “Go” trend remains in place but this week saw no new high in price. We see a correction back away from the highs to levels that has been support already in this new “Go” trend. We will look to see if this continues. If support can be found here, GoNoGo Oscillator will not move below the zero line and any surge in momentum could see price test those highs from a few weeks ago.
$AMD Desperately Needs Support
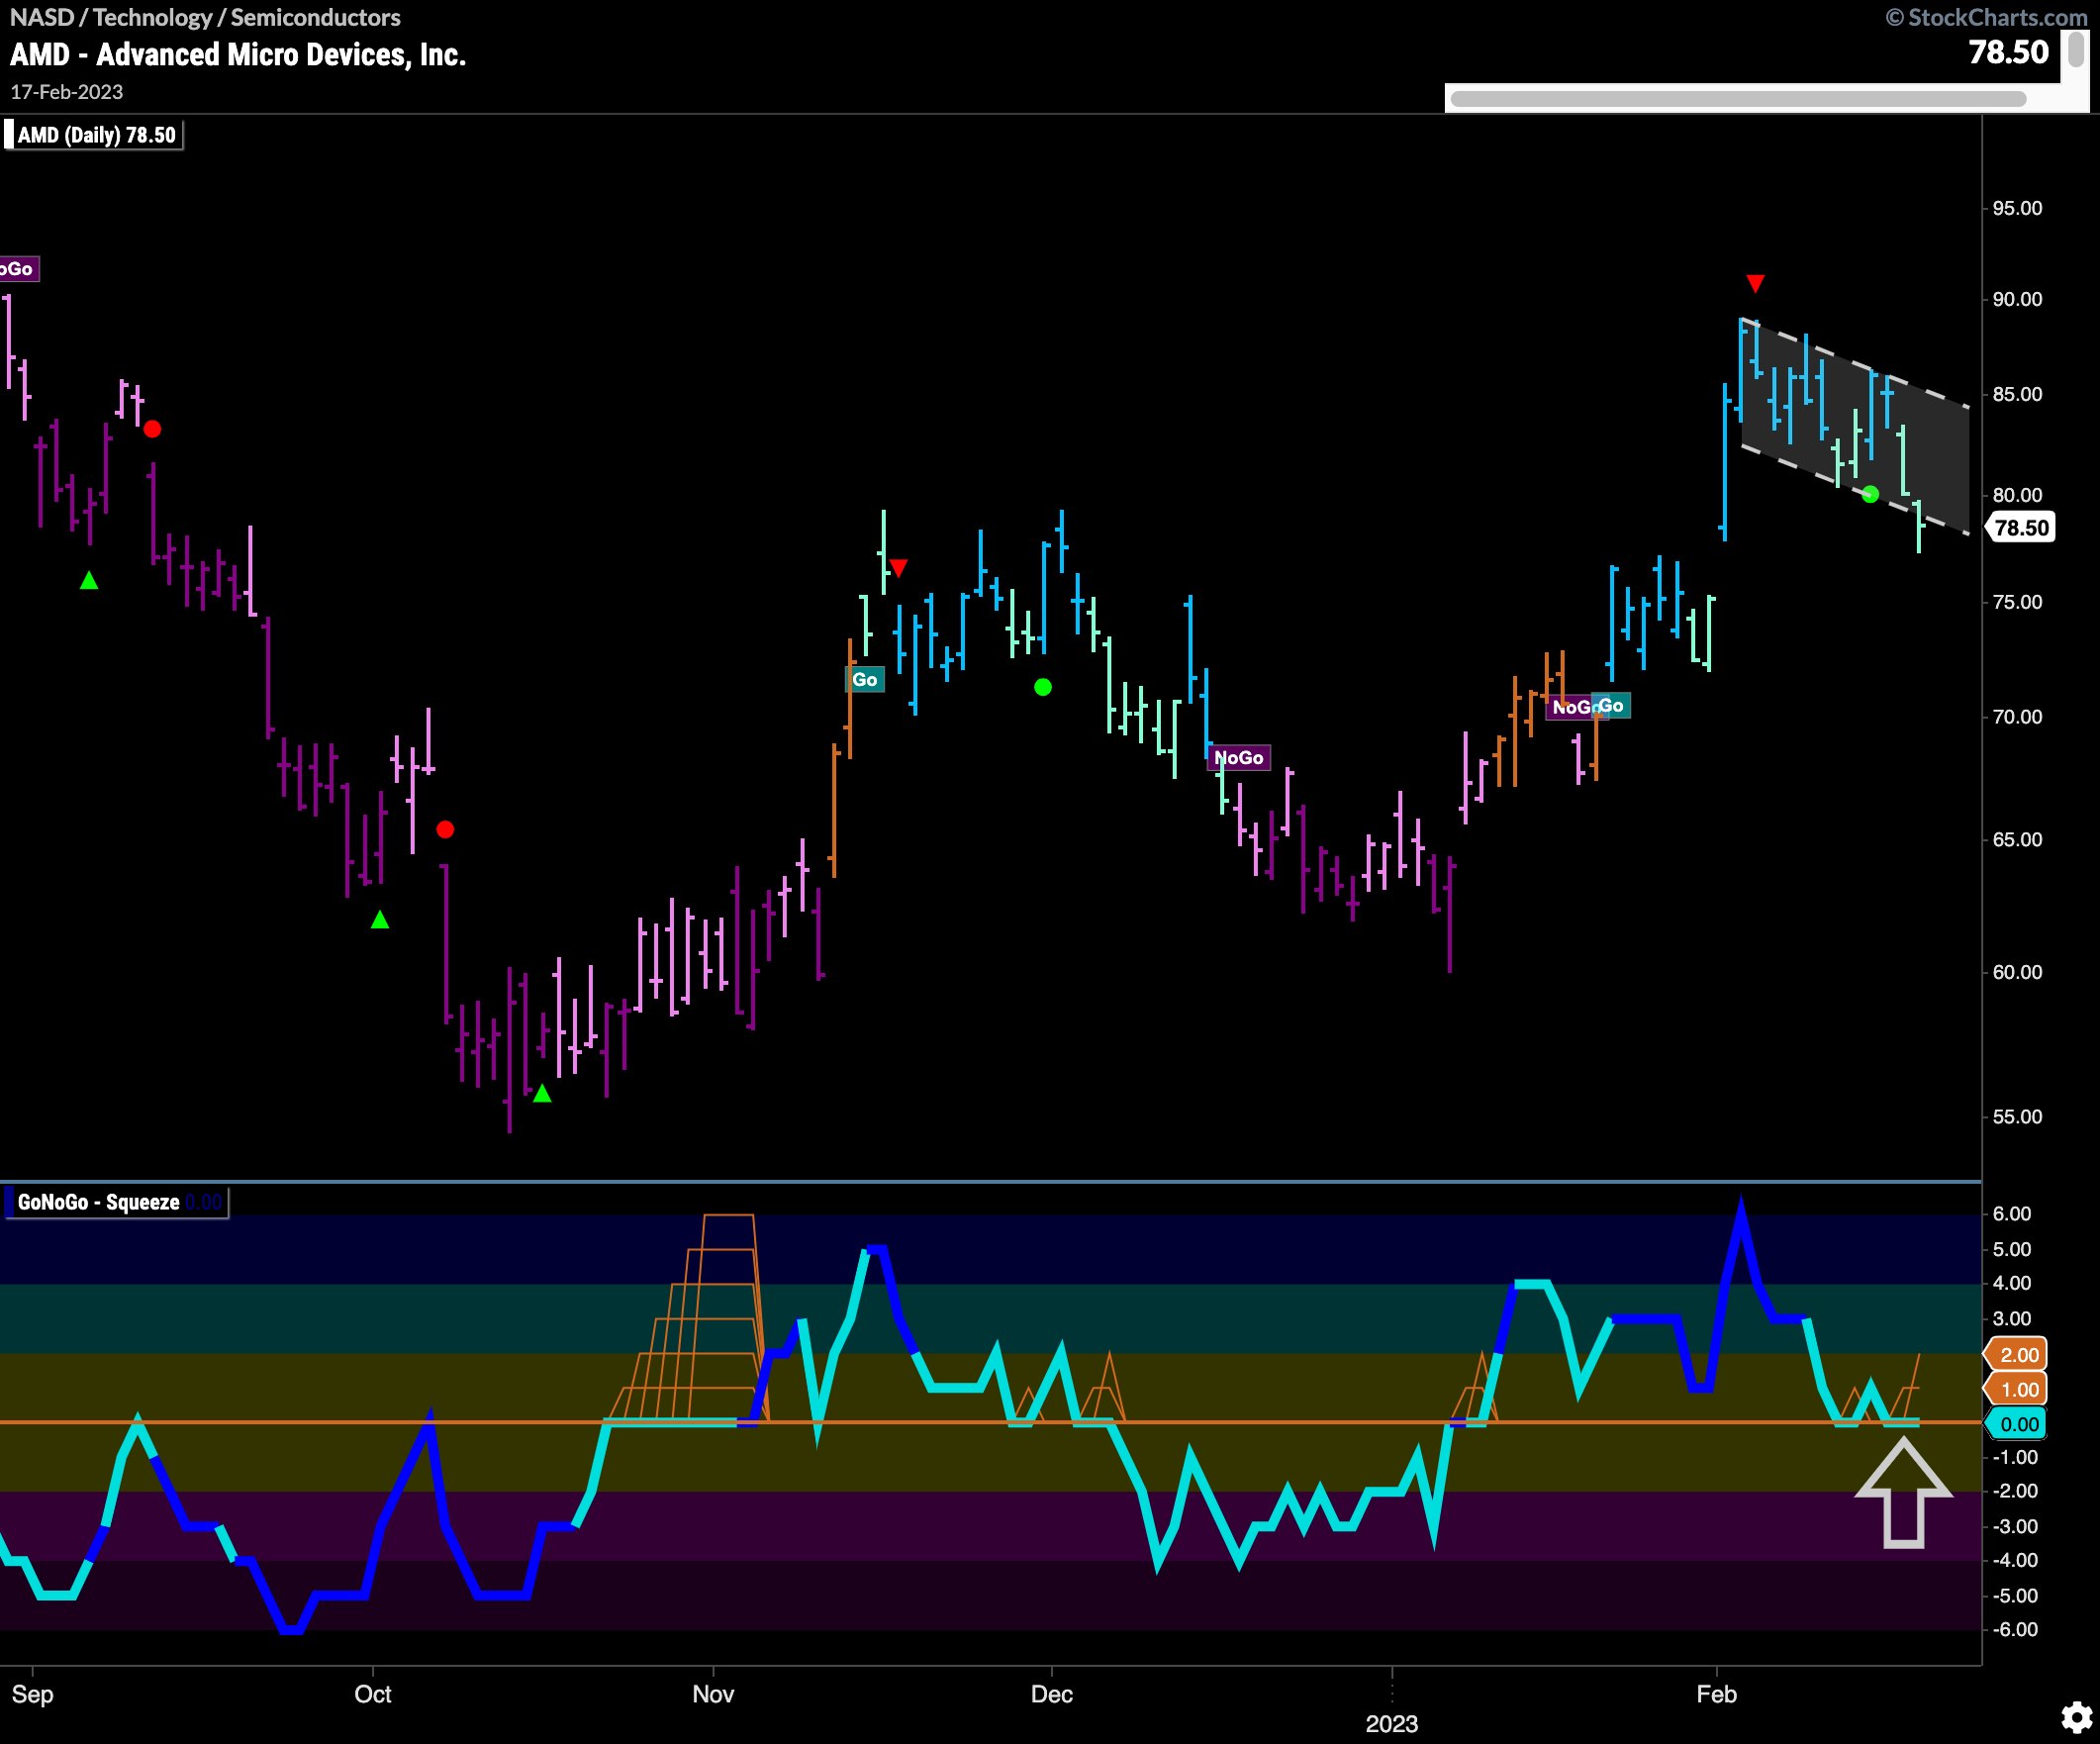
We have seen in recent weeks the relative outperformance of the semiconductors sub group within the technology sector. $AMD is in dire need of support here. We have been watching this ticker for the possibility of a break higher as GoNoGo Oscillator continues to look to hold the zero line. We ended the week right back at the lower bound of the pattern, and GoNoGo Oscillator fell again to zero. We will be looking for a rally back into positive territory and a possible price move out of the flag. If we don’t get the support at zero on the oscillator then that will be a threat to the “Go” trend.
$ROKU Shows How its Done
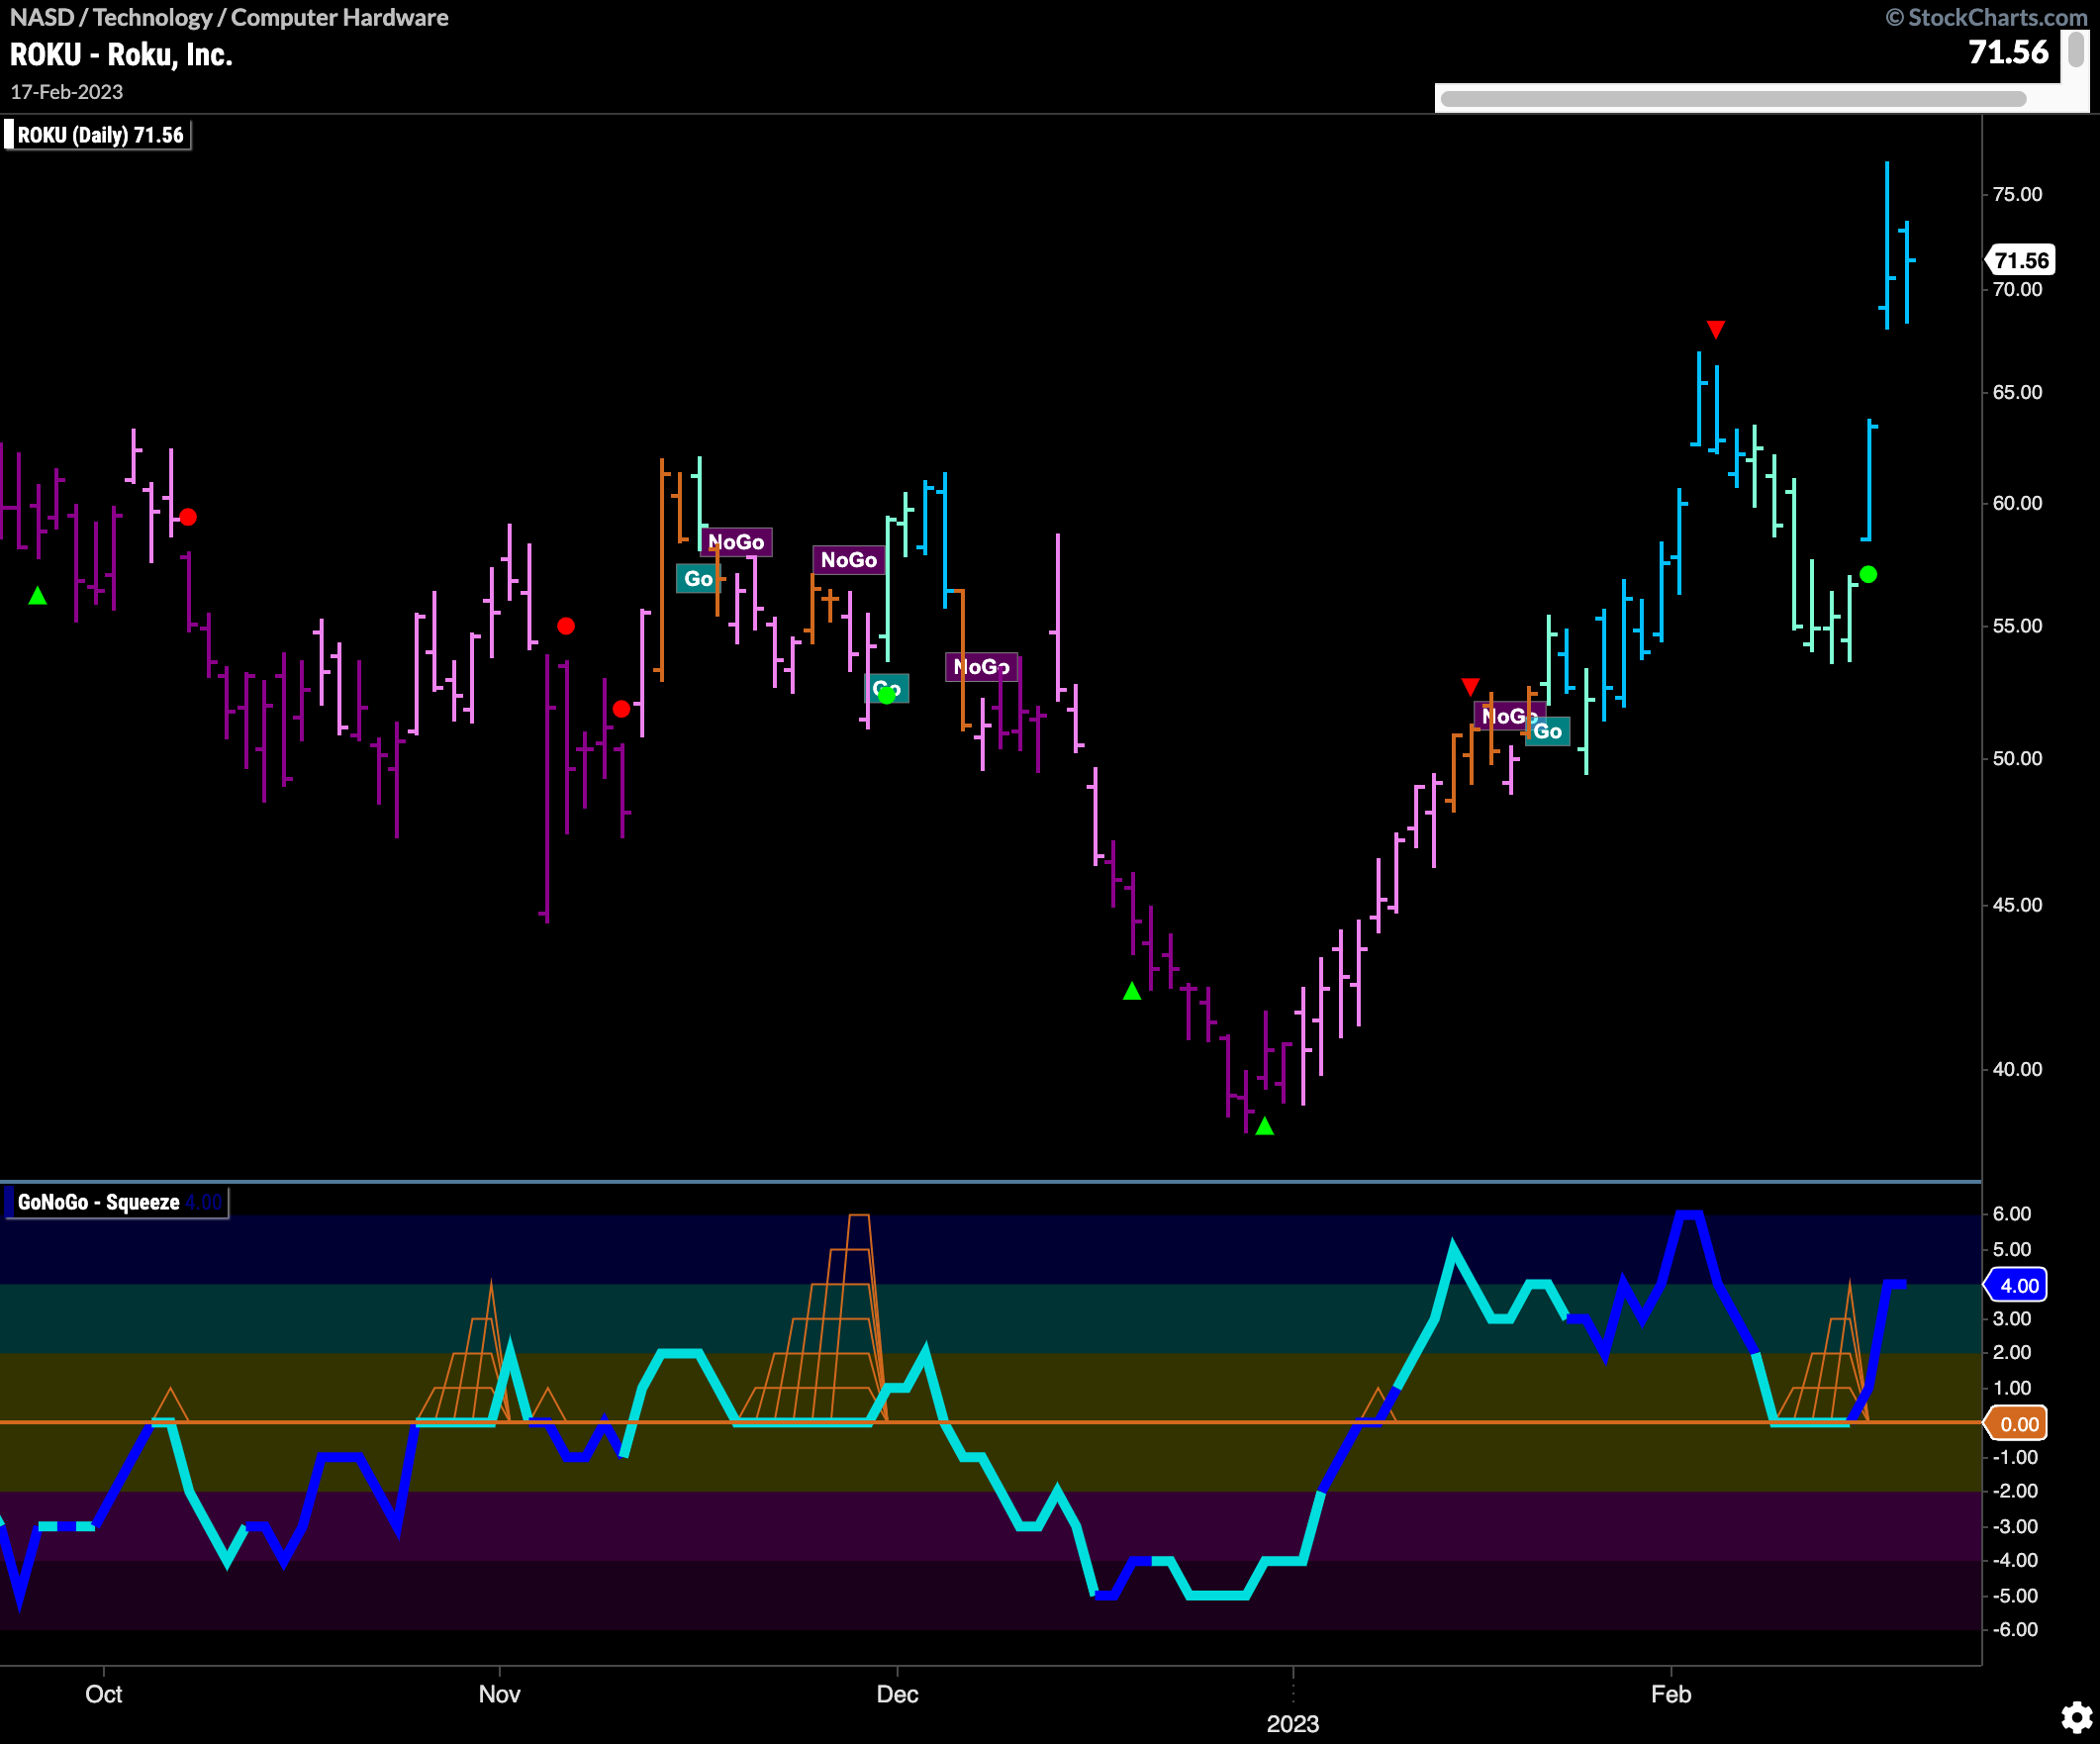
$ROKU is a security in the other outperforming sub group, computer hardware. This is what we would be looking to see from $AMD above. GoNoGo Trend shows that the “Go” trend is in place and as price corrected on paler aqua bars after the Go Countertrend Correction Icon (red arrow) we saw GoNoGo Oscillator fall to the zero line. After riding the zero line for a few bars, the oscillator broke out of the small GoNoGo Squeeze back into positive territory giving price the push it needed to break out higher.
$NFLX On The Other Hand
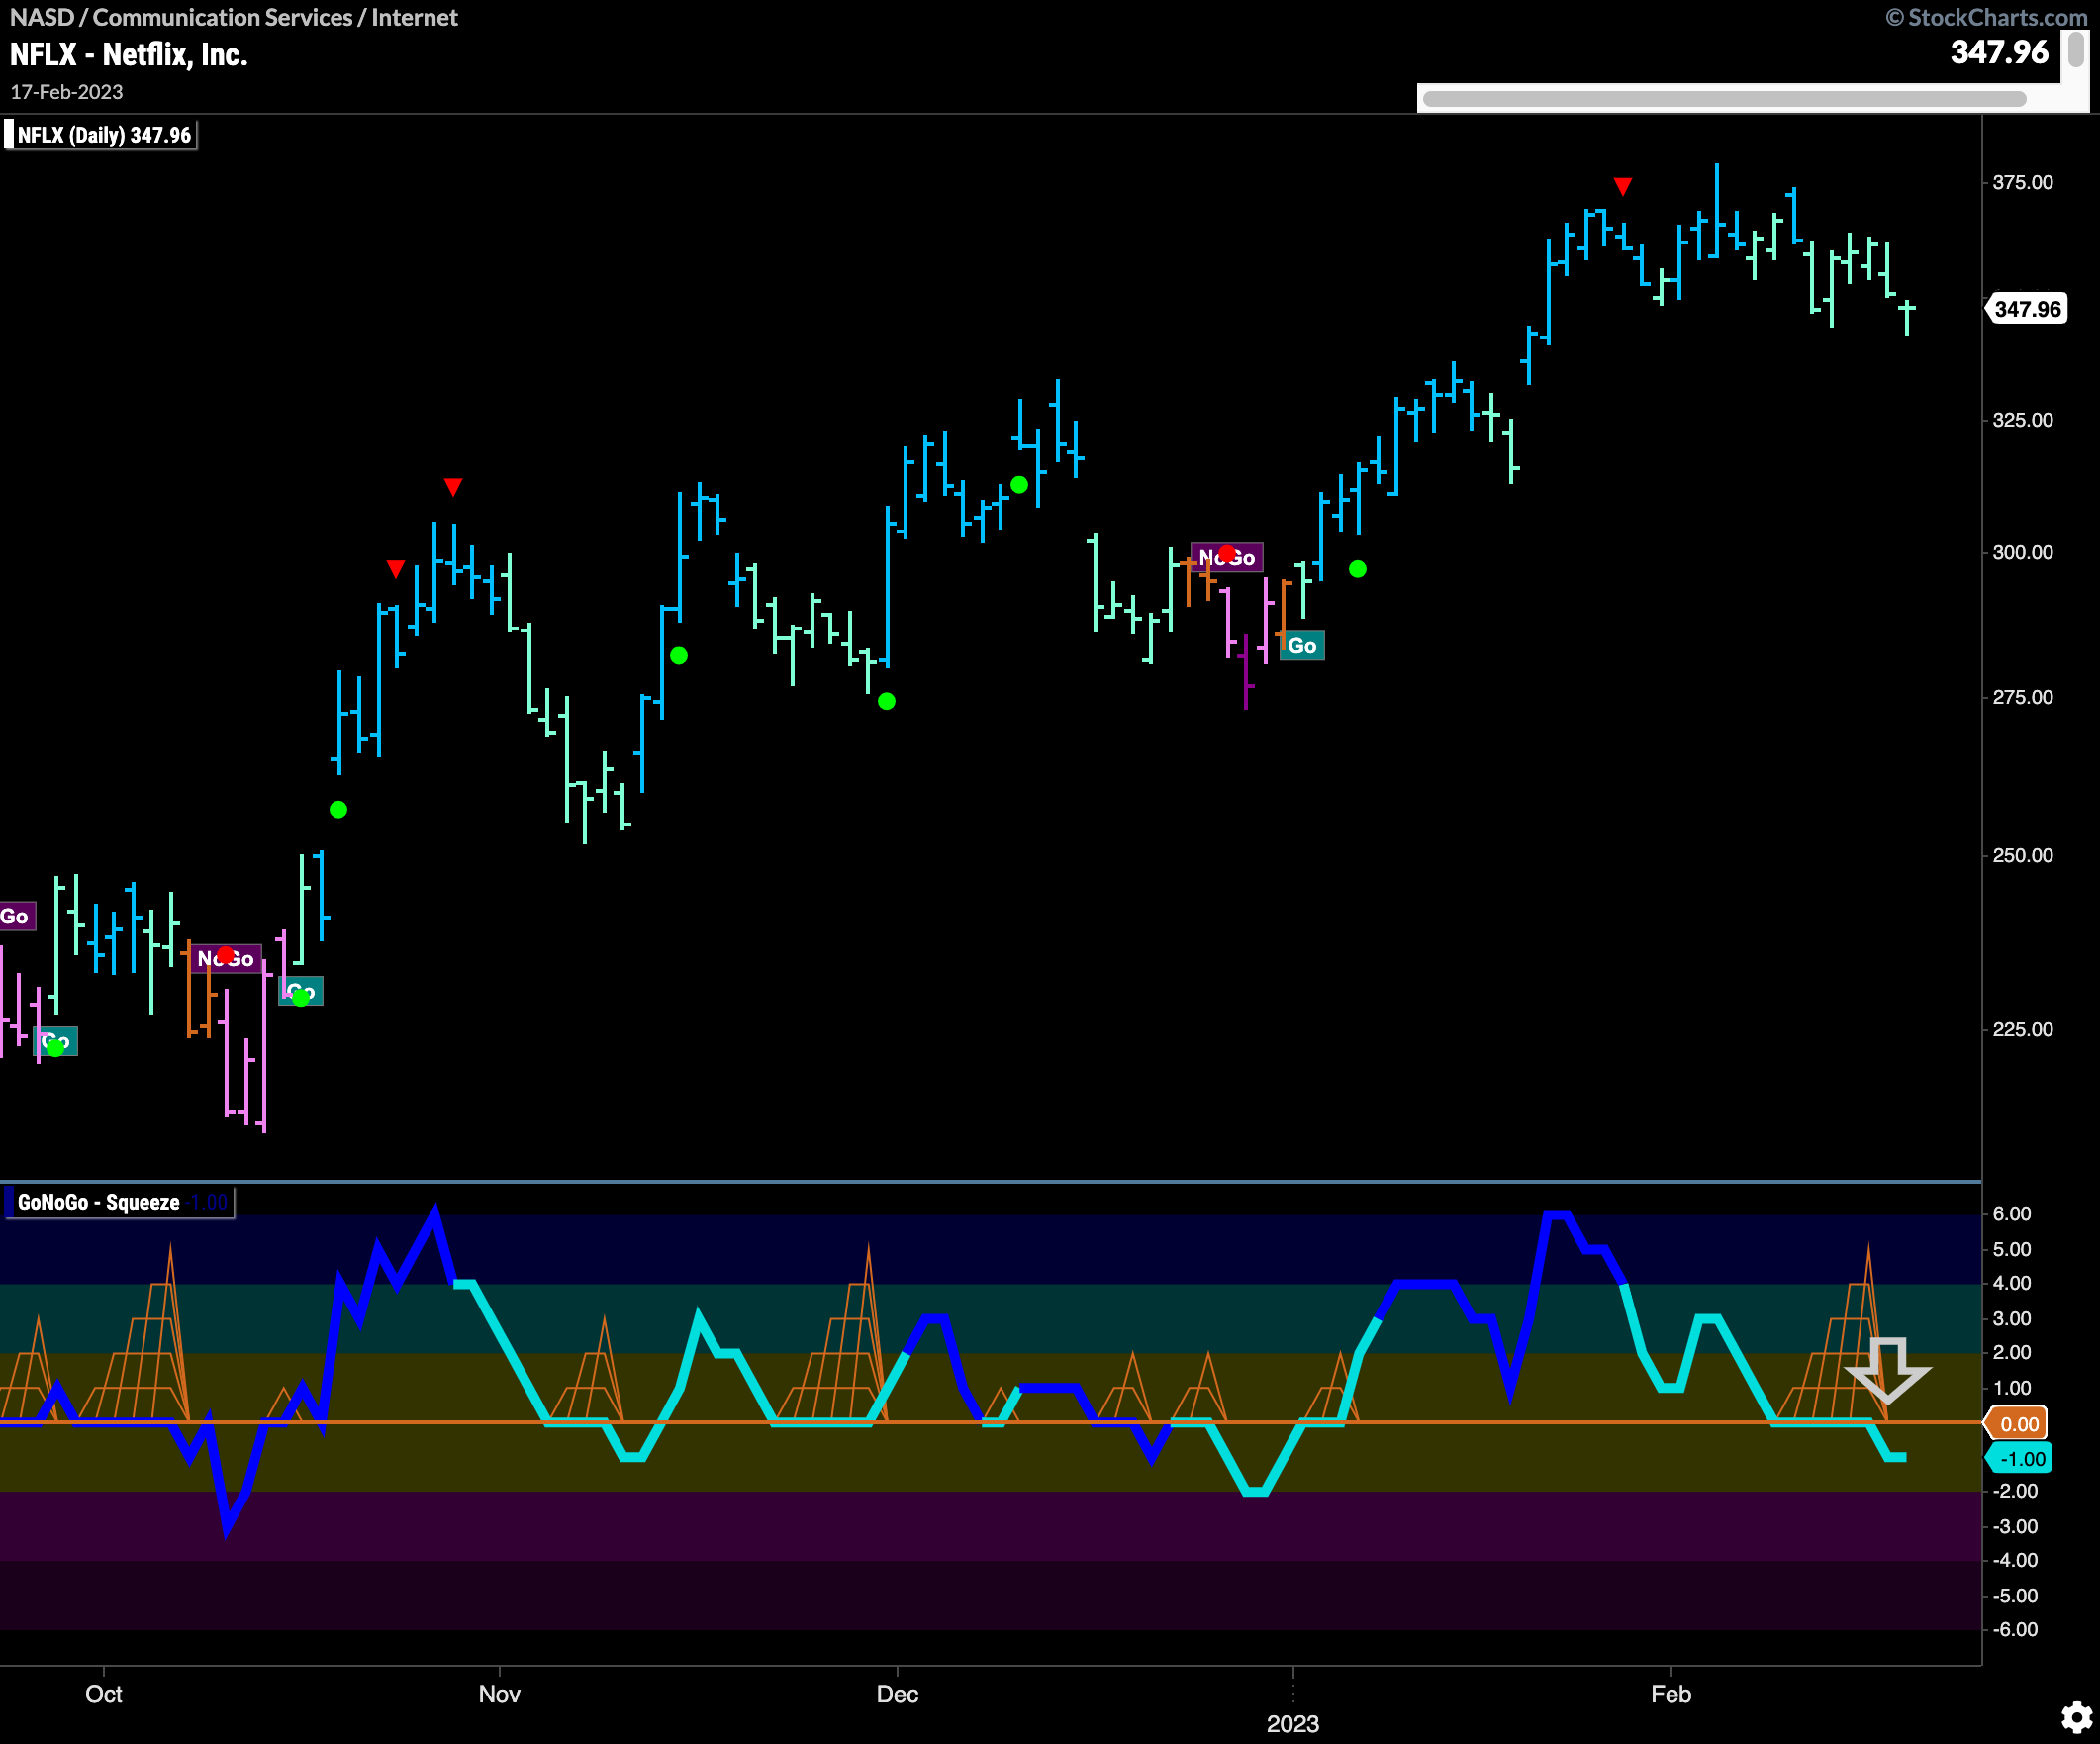
$NFLX is showing a slow breakdown as price continues to consolidate/correct against the “Go” trend. We saw a Go Countertrend Correction Icon (red arrow) back in January. Since then price has moved slightly lower and we now see GoNoGo Trend painting weaker aqua bars. GoNoGo Oscillator fell to test the zero line on the correction and then broke out of the GoNoGo Squeeze into negative territory. This is a concern for the “Go” trend as we know that momentum should remain on the same side as the prevailing trend. We will need to see GoNoGo Oscillator move back quickly into positive territory or this could be a sign of further price deterioration.
