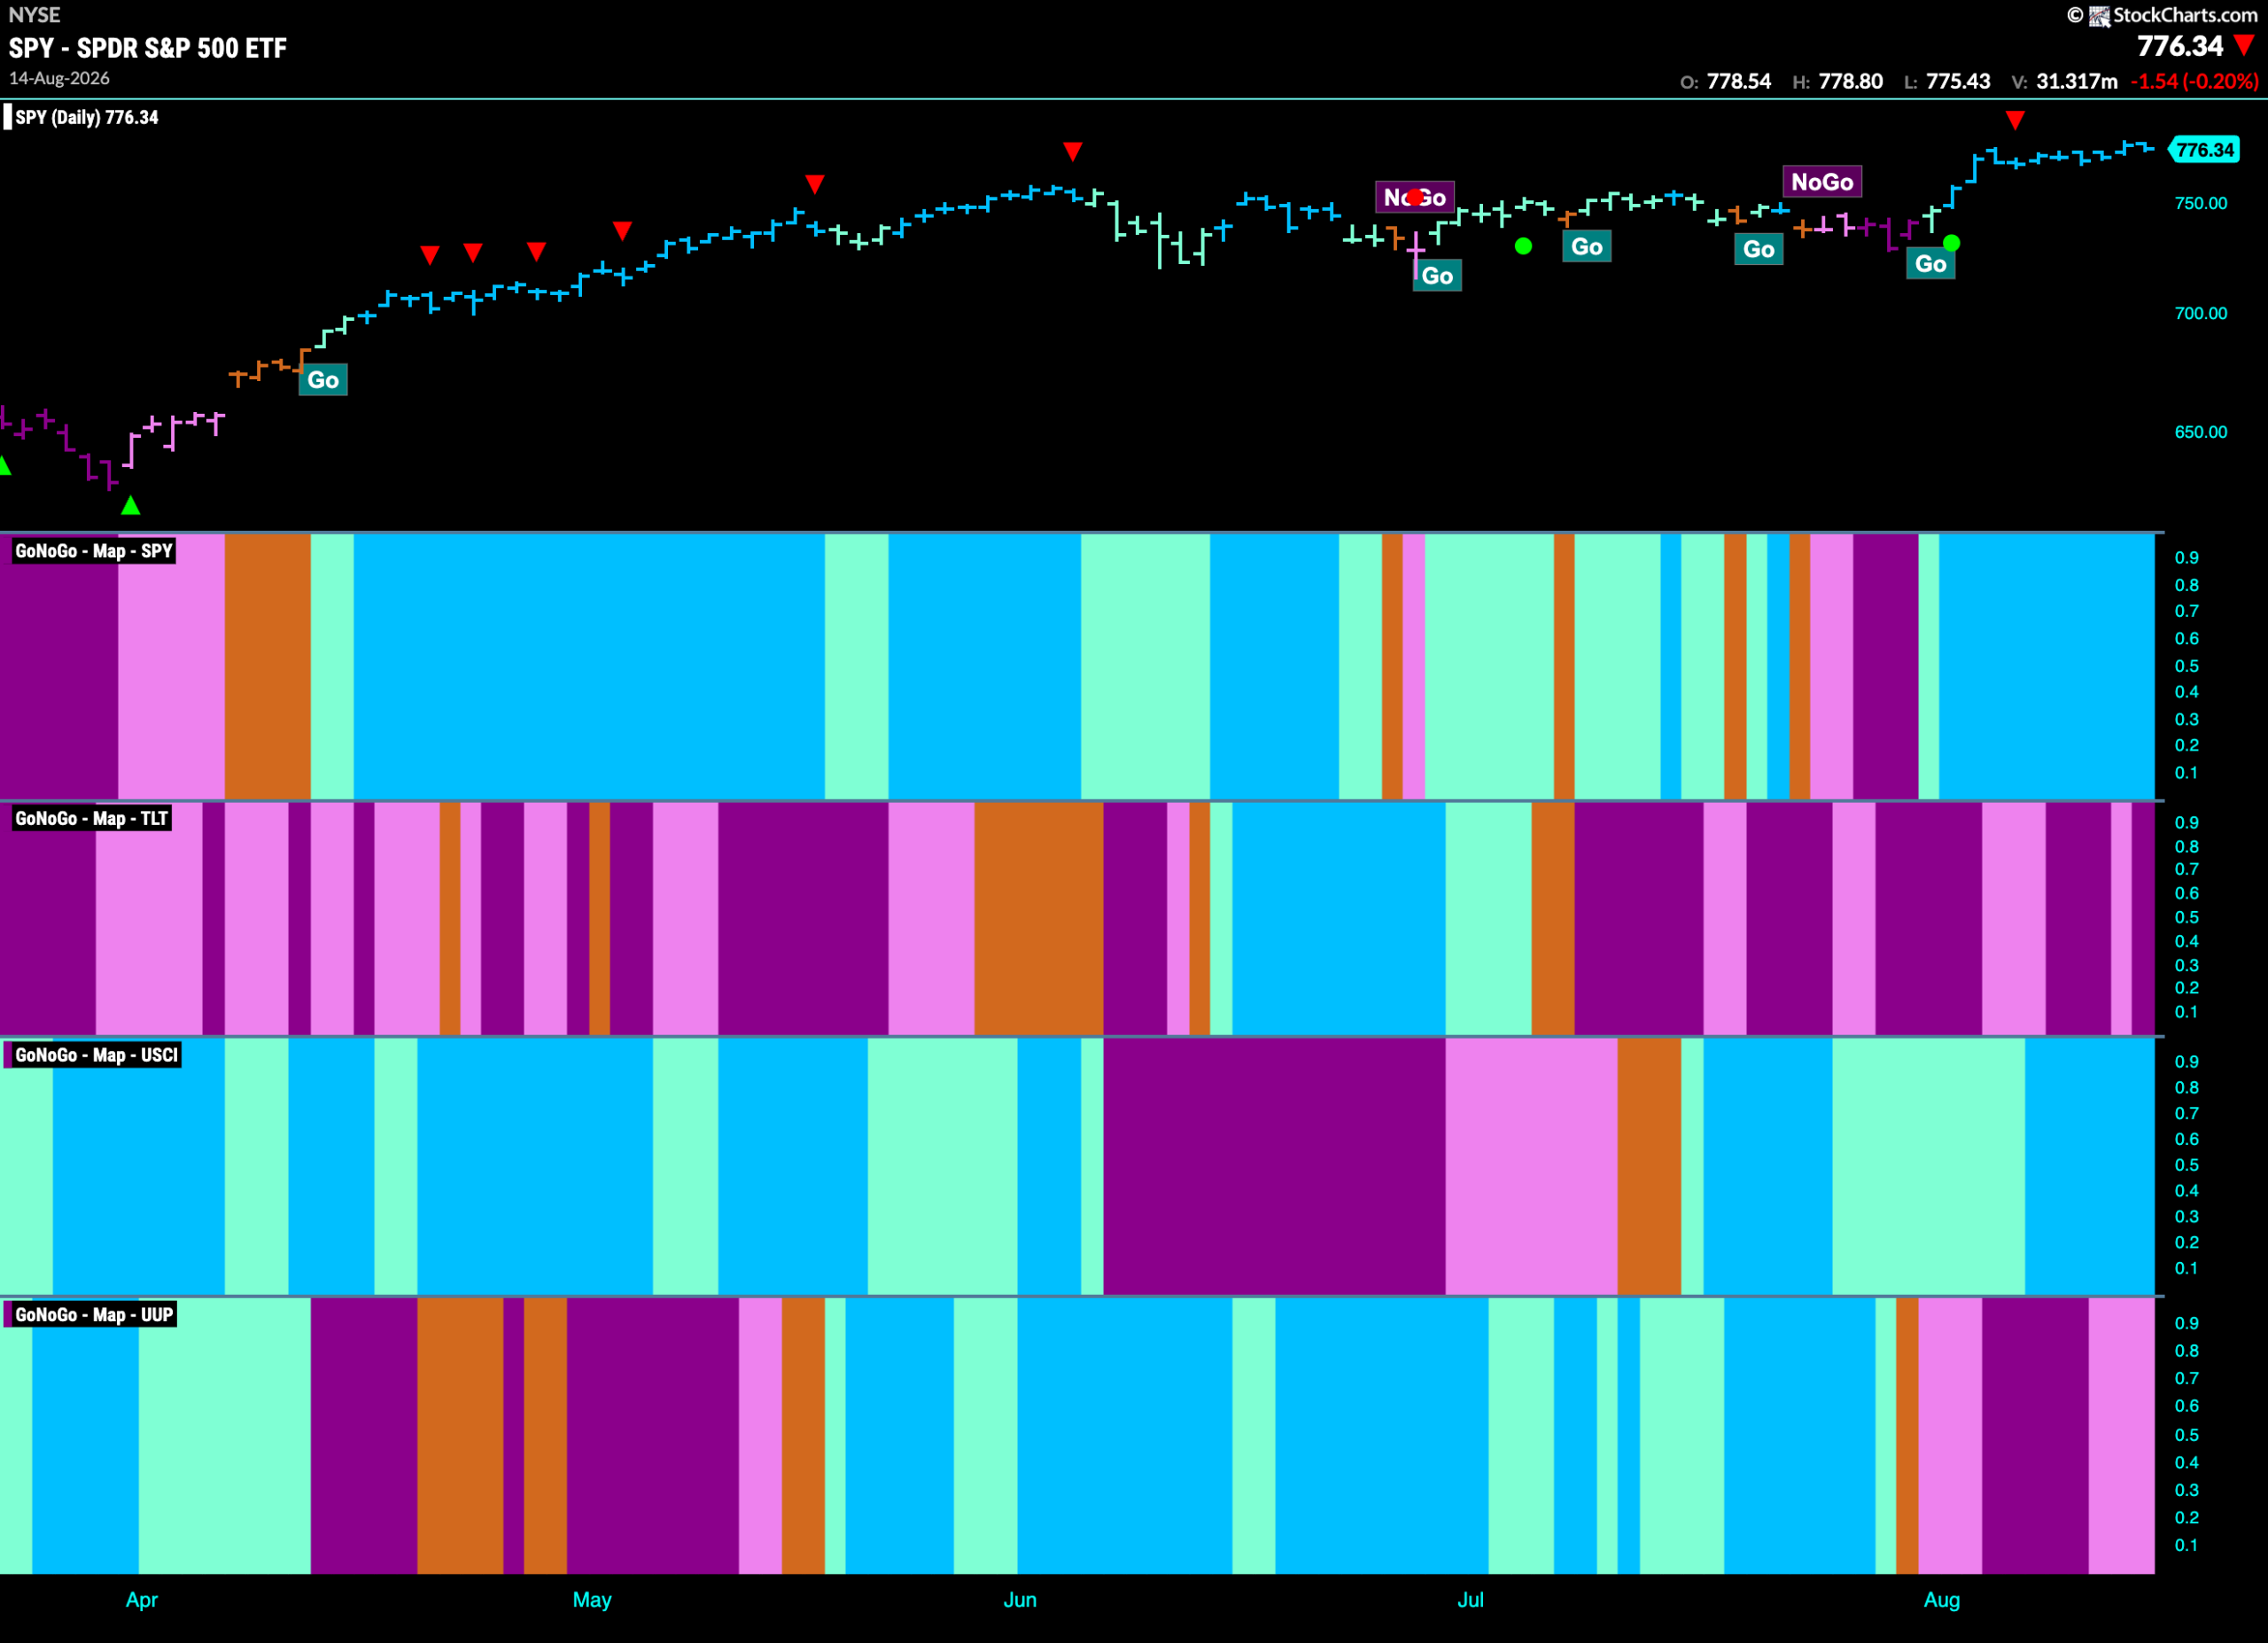
Good morning and welcome to this week’s Flight Path. The equity trend remained strong this week as we saw a run of uninterrupted bright blue “Go” bars with price at the highs. Treasury bond prices remained in a “NoGo” and at the end of the week we saw strength return with a purple bar. U.S. commodities painted a run of bright blue “Go” bars as the “Go” trend showed strength. The dollar remained in its “NoGo” trend however we do see weakness with paler pink bars the second half of the week.
$SPY Remains Strong as Price Clings to Highs
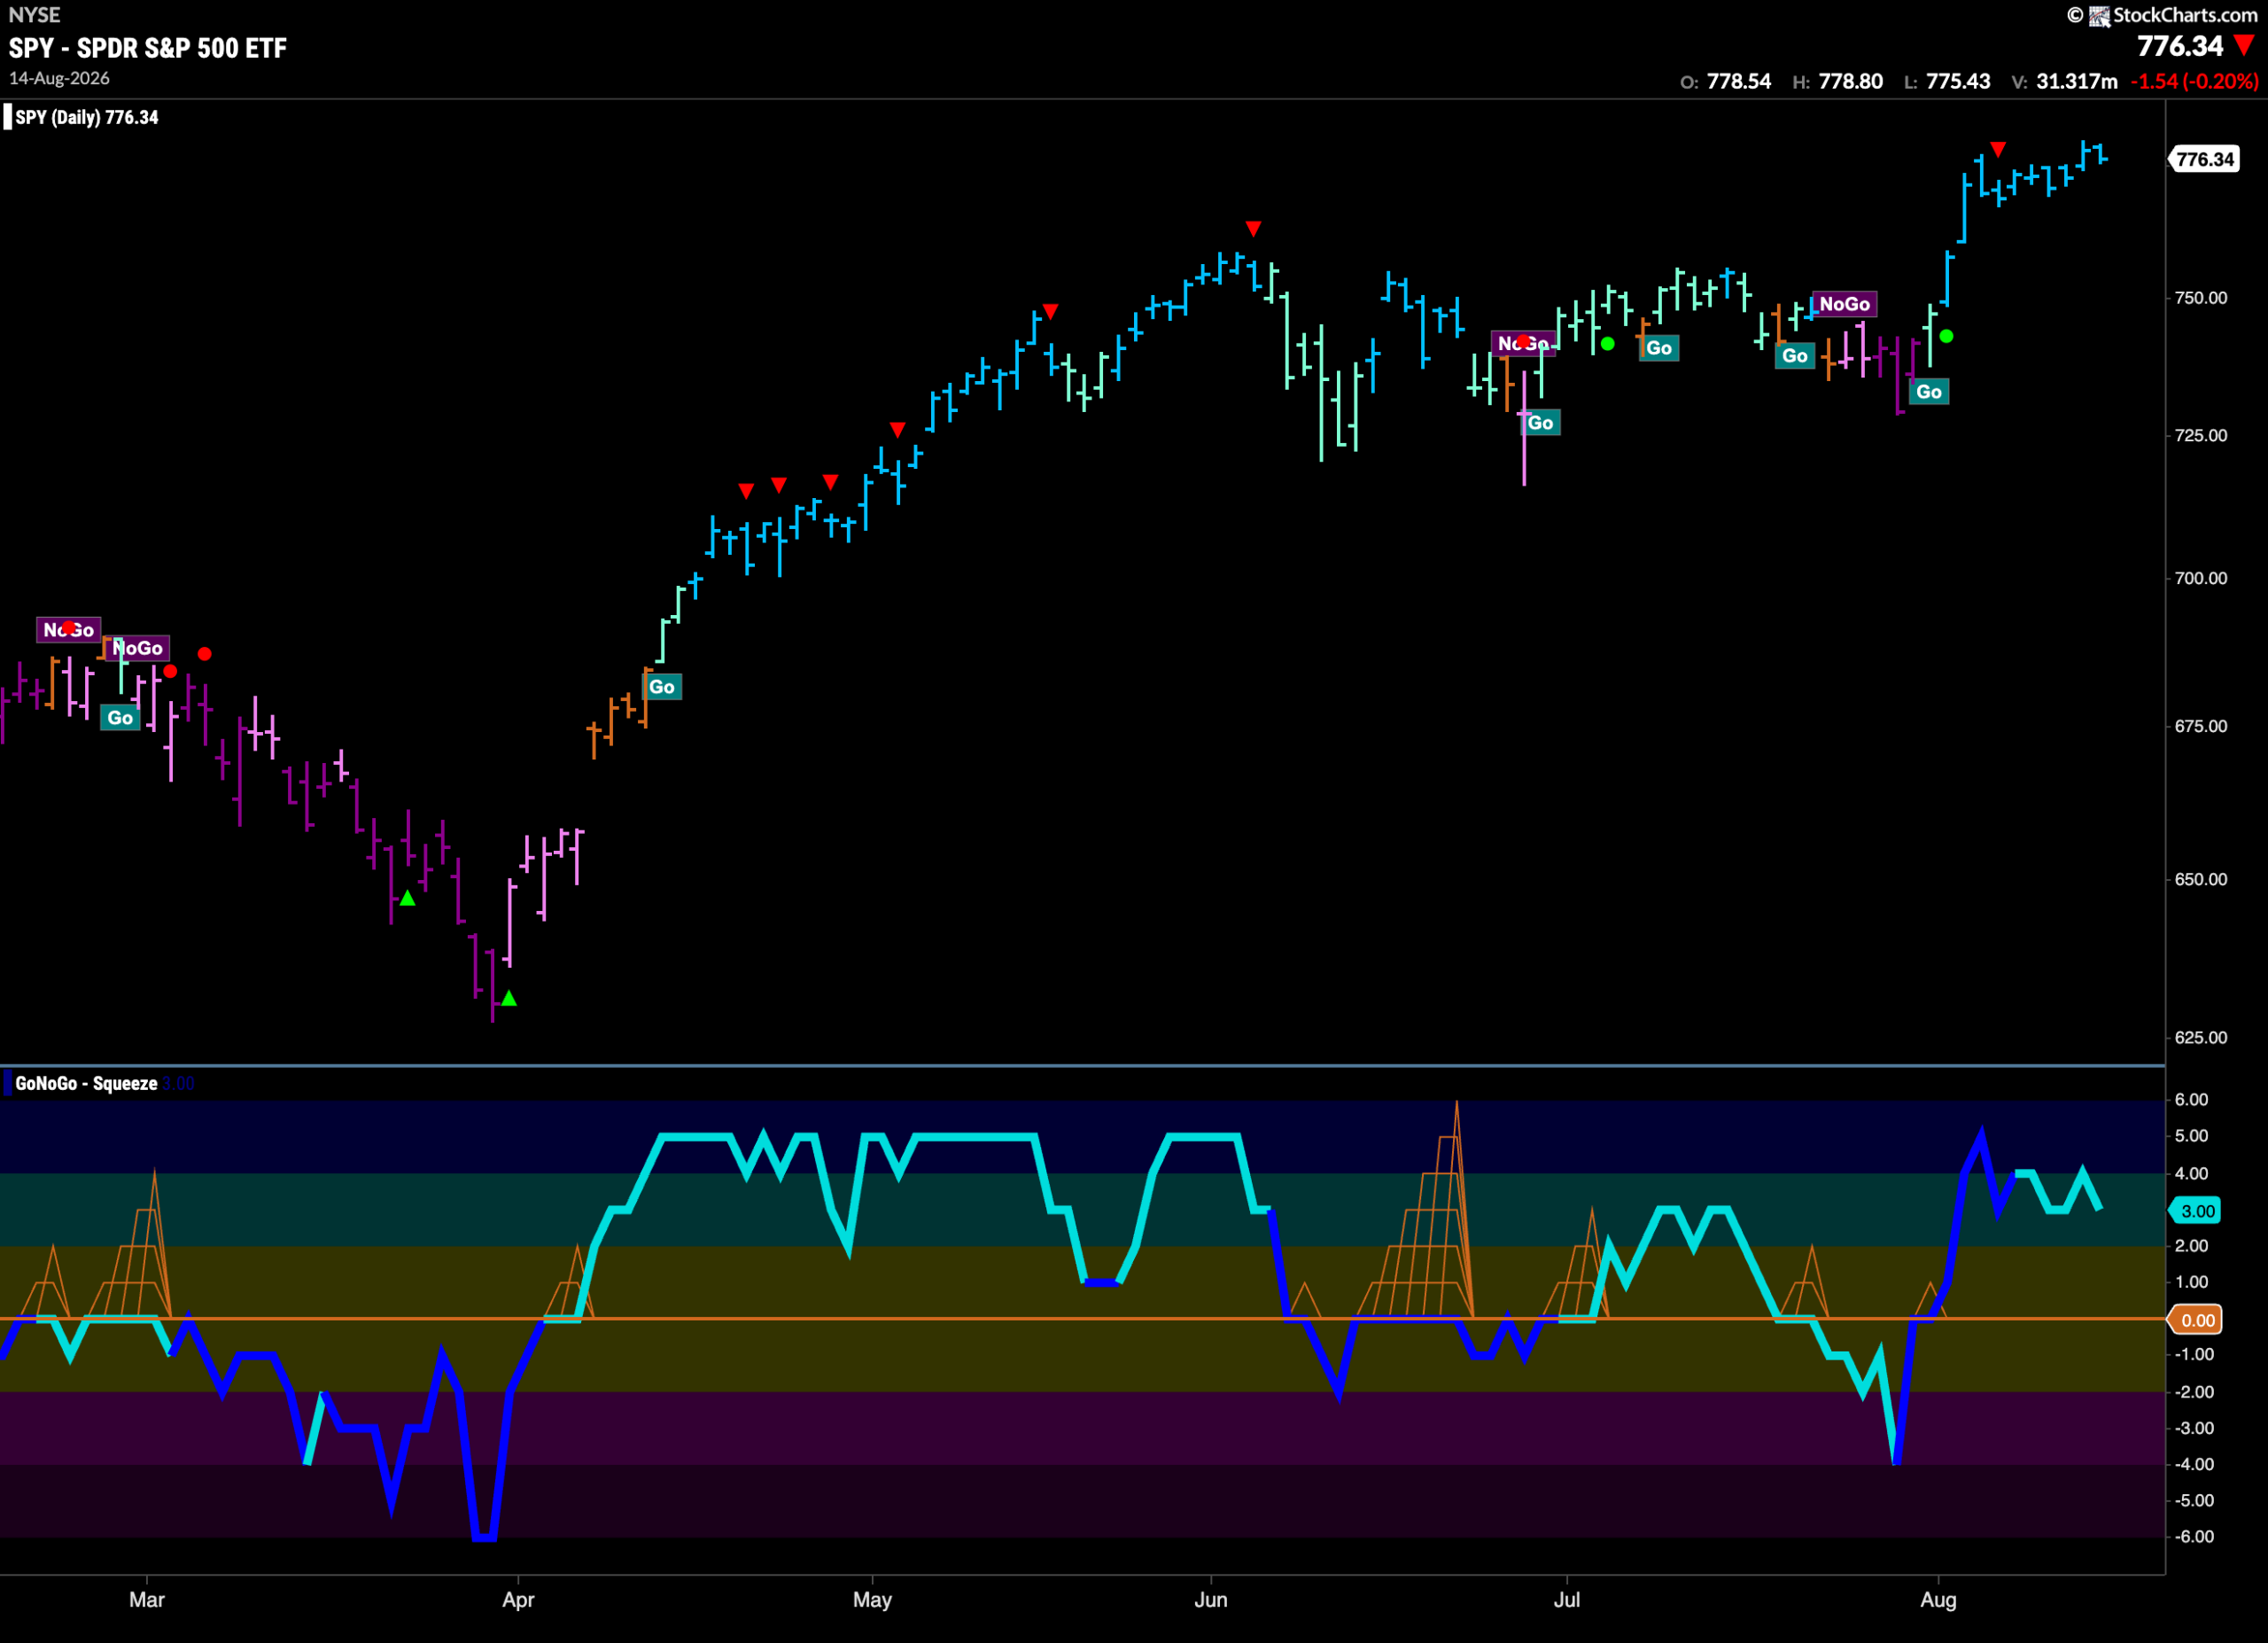
The GoNoGo chart below shows that the “Go” trend stayed strong this past week as the indicator painted nothing but bright blue bars and price remained elevated, even creeping to new higher highs. If we look at the oscillator panel we see that momentum is in positive territory but no longer overbought. This tells us that the market supports the price action.
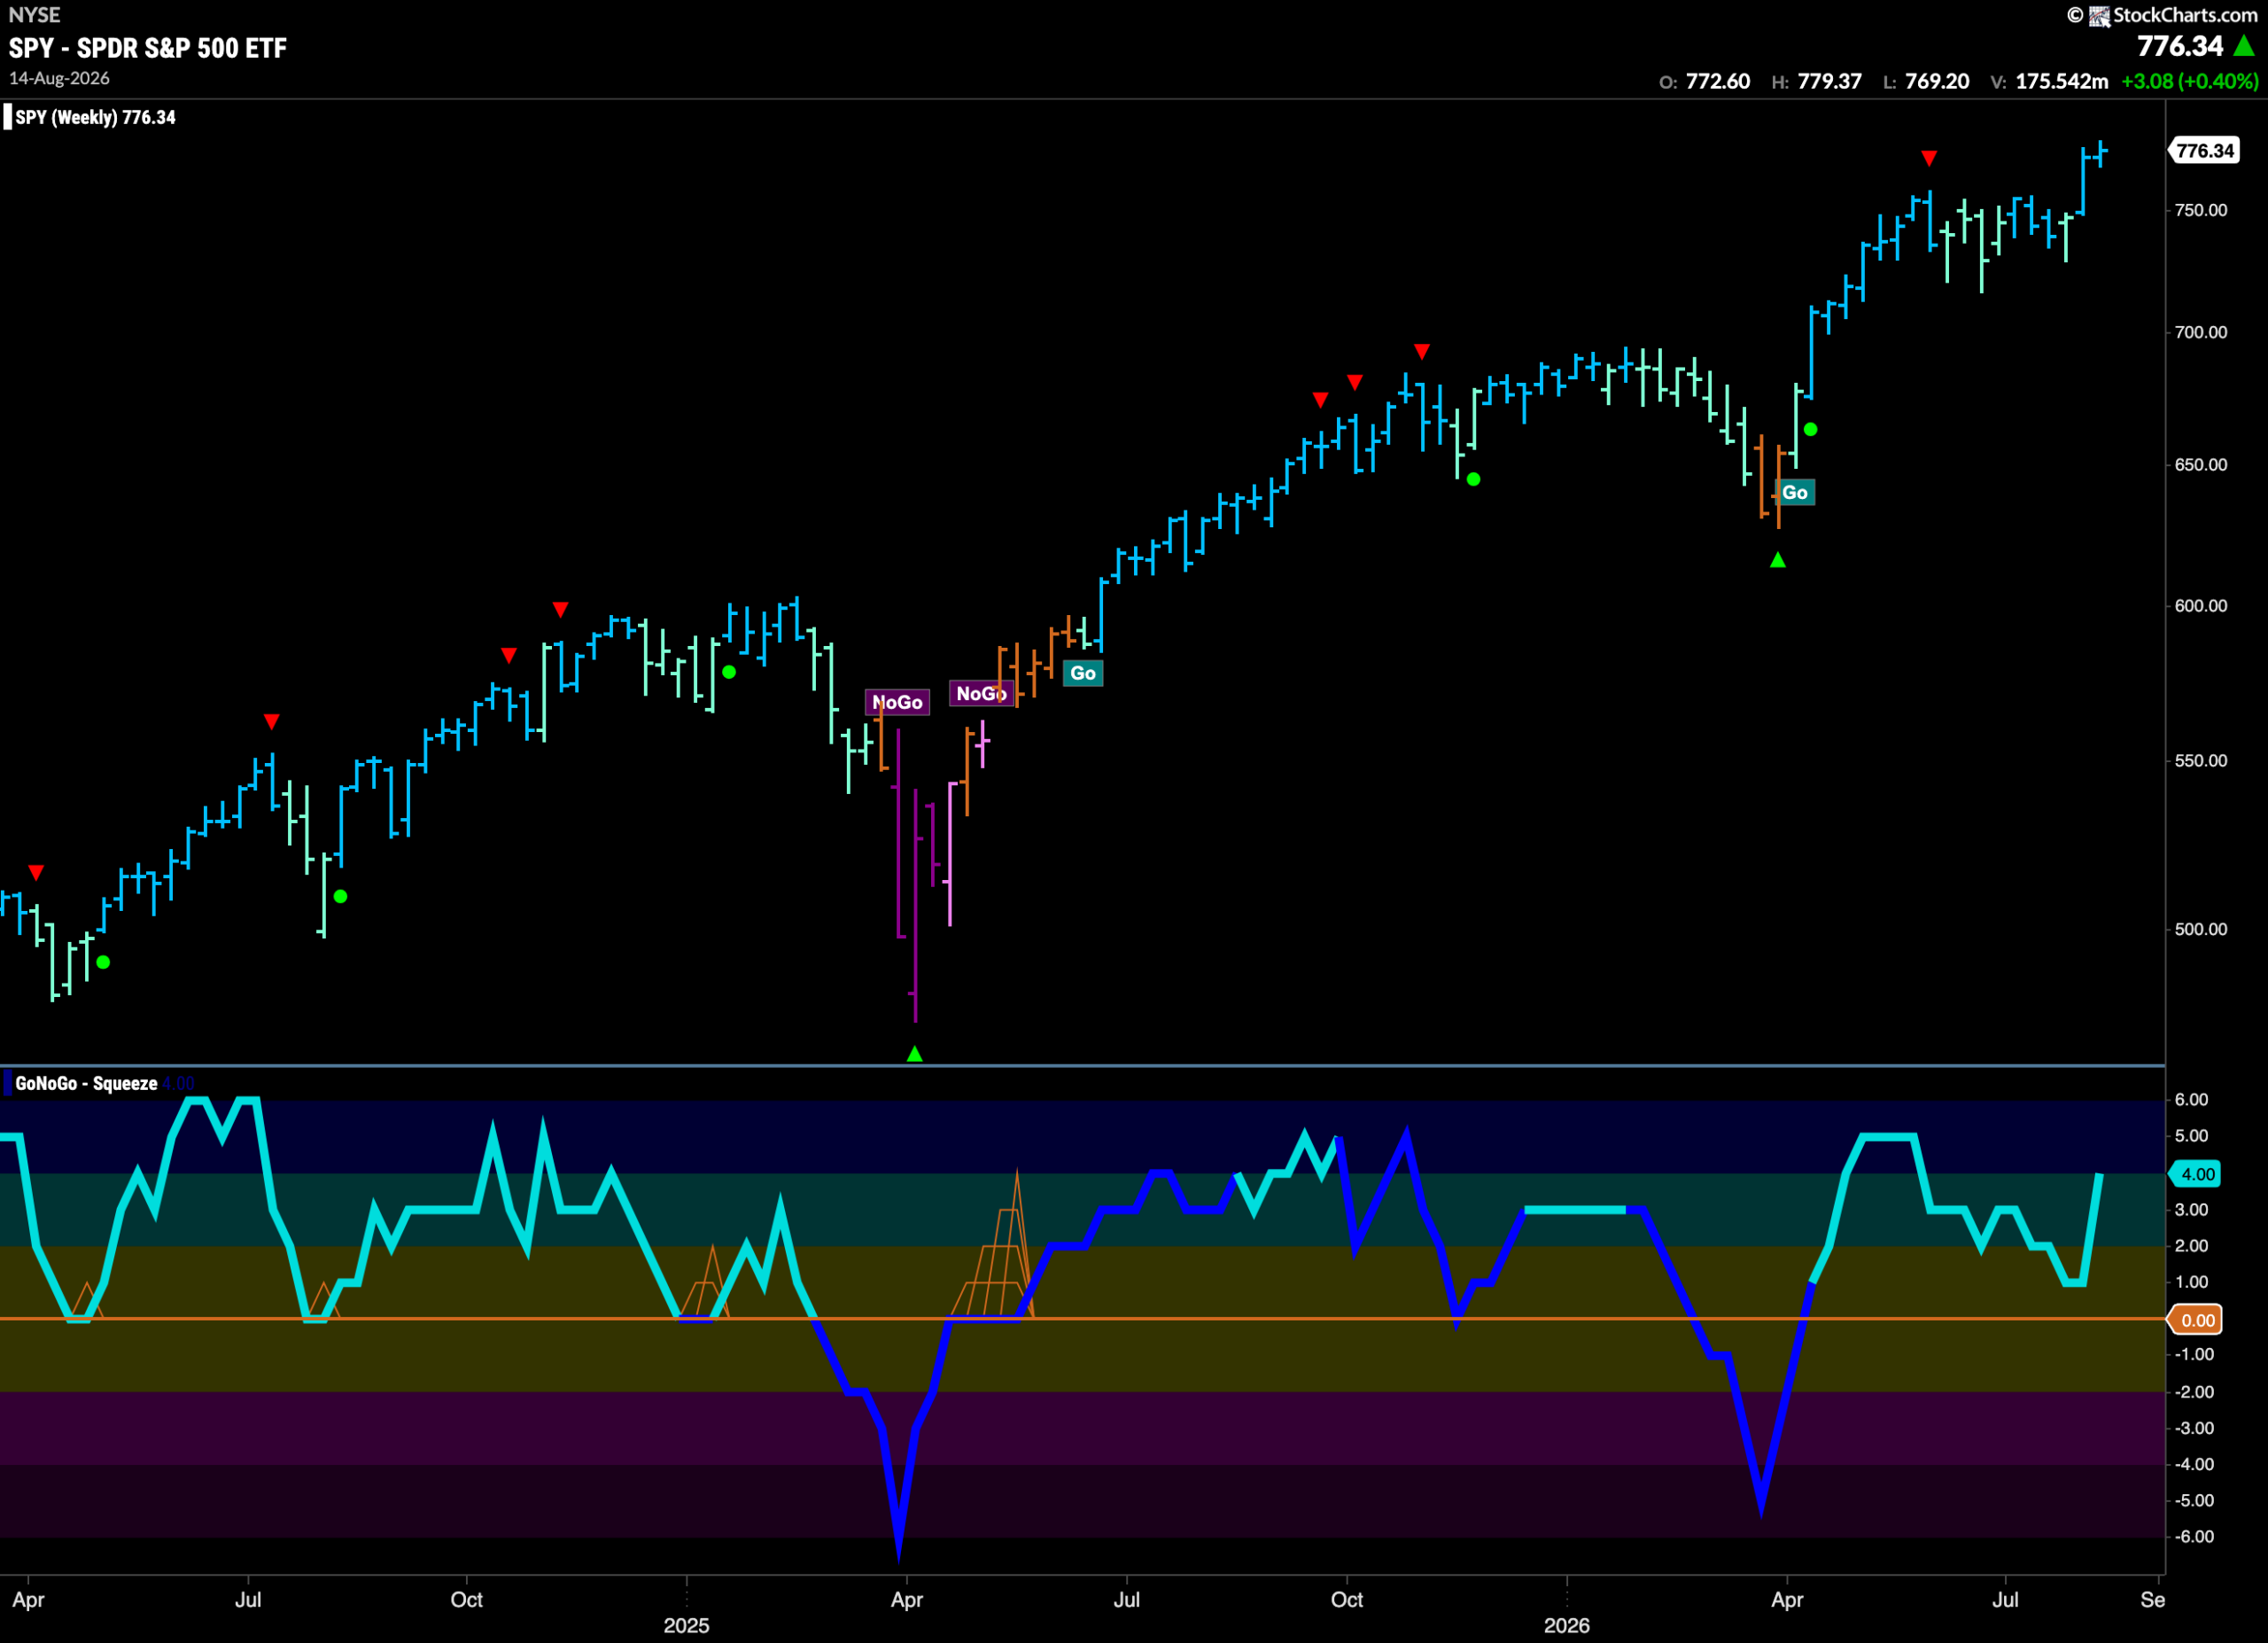
The weekly chart shows that the “Go” trend continues and we saw another strong blue “Go” bar and a slightly higher weekly close. GoNoGo Oscillator rallied after having fallen close to the zero line and is now surging back toward overbought territory. This shows strong market enthusiasm for the moves we are seeing in price.
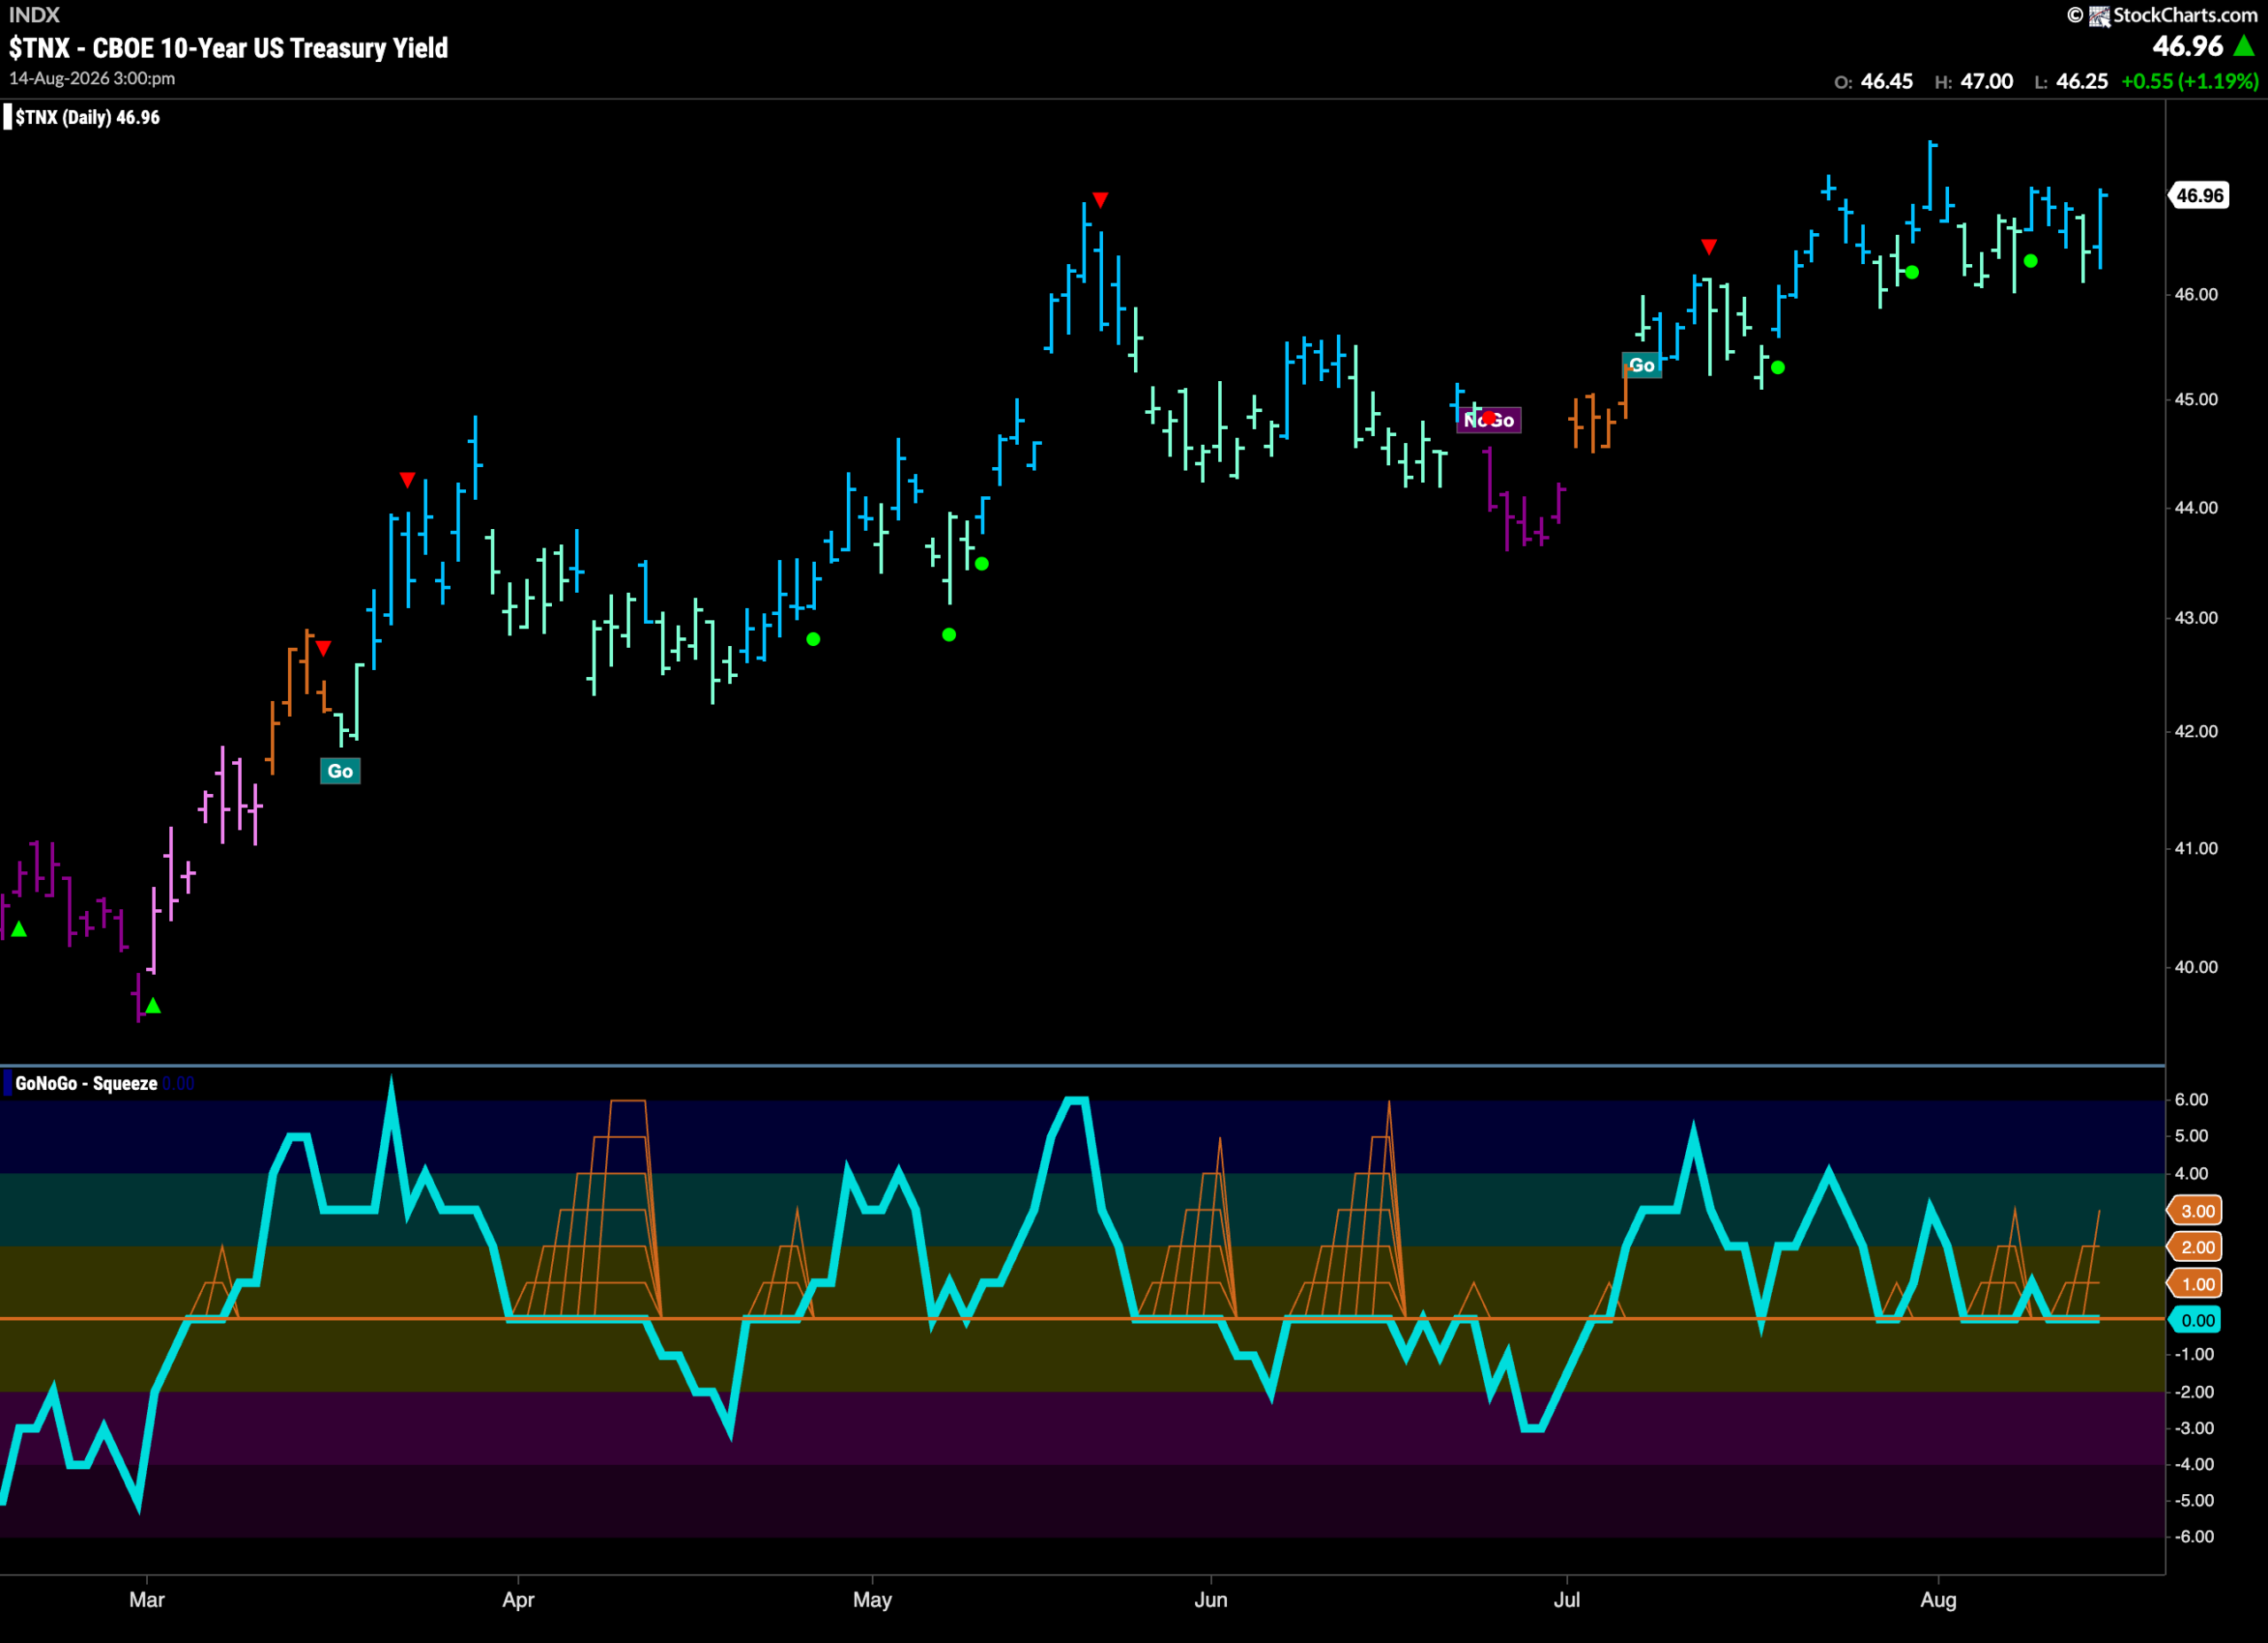
Treasury Rates Remain in “Go” Trend and Paint Strength
GoNoGo Trend shows that the “Go” trend is doing its best to hang around as the indicator paints strong blue bars even as price fails to hit a higher high this past week. GoNoGo Oscillator is riding the zero line again and we see the beginnings of a GoNoGo Squeeze as momentum is neutral. We have seen lower highs in momentum of late and we will watch to see if the oscillator is able to remain at or above zero.
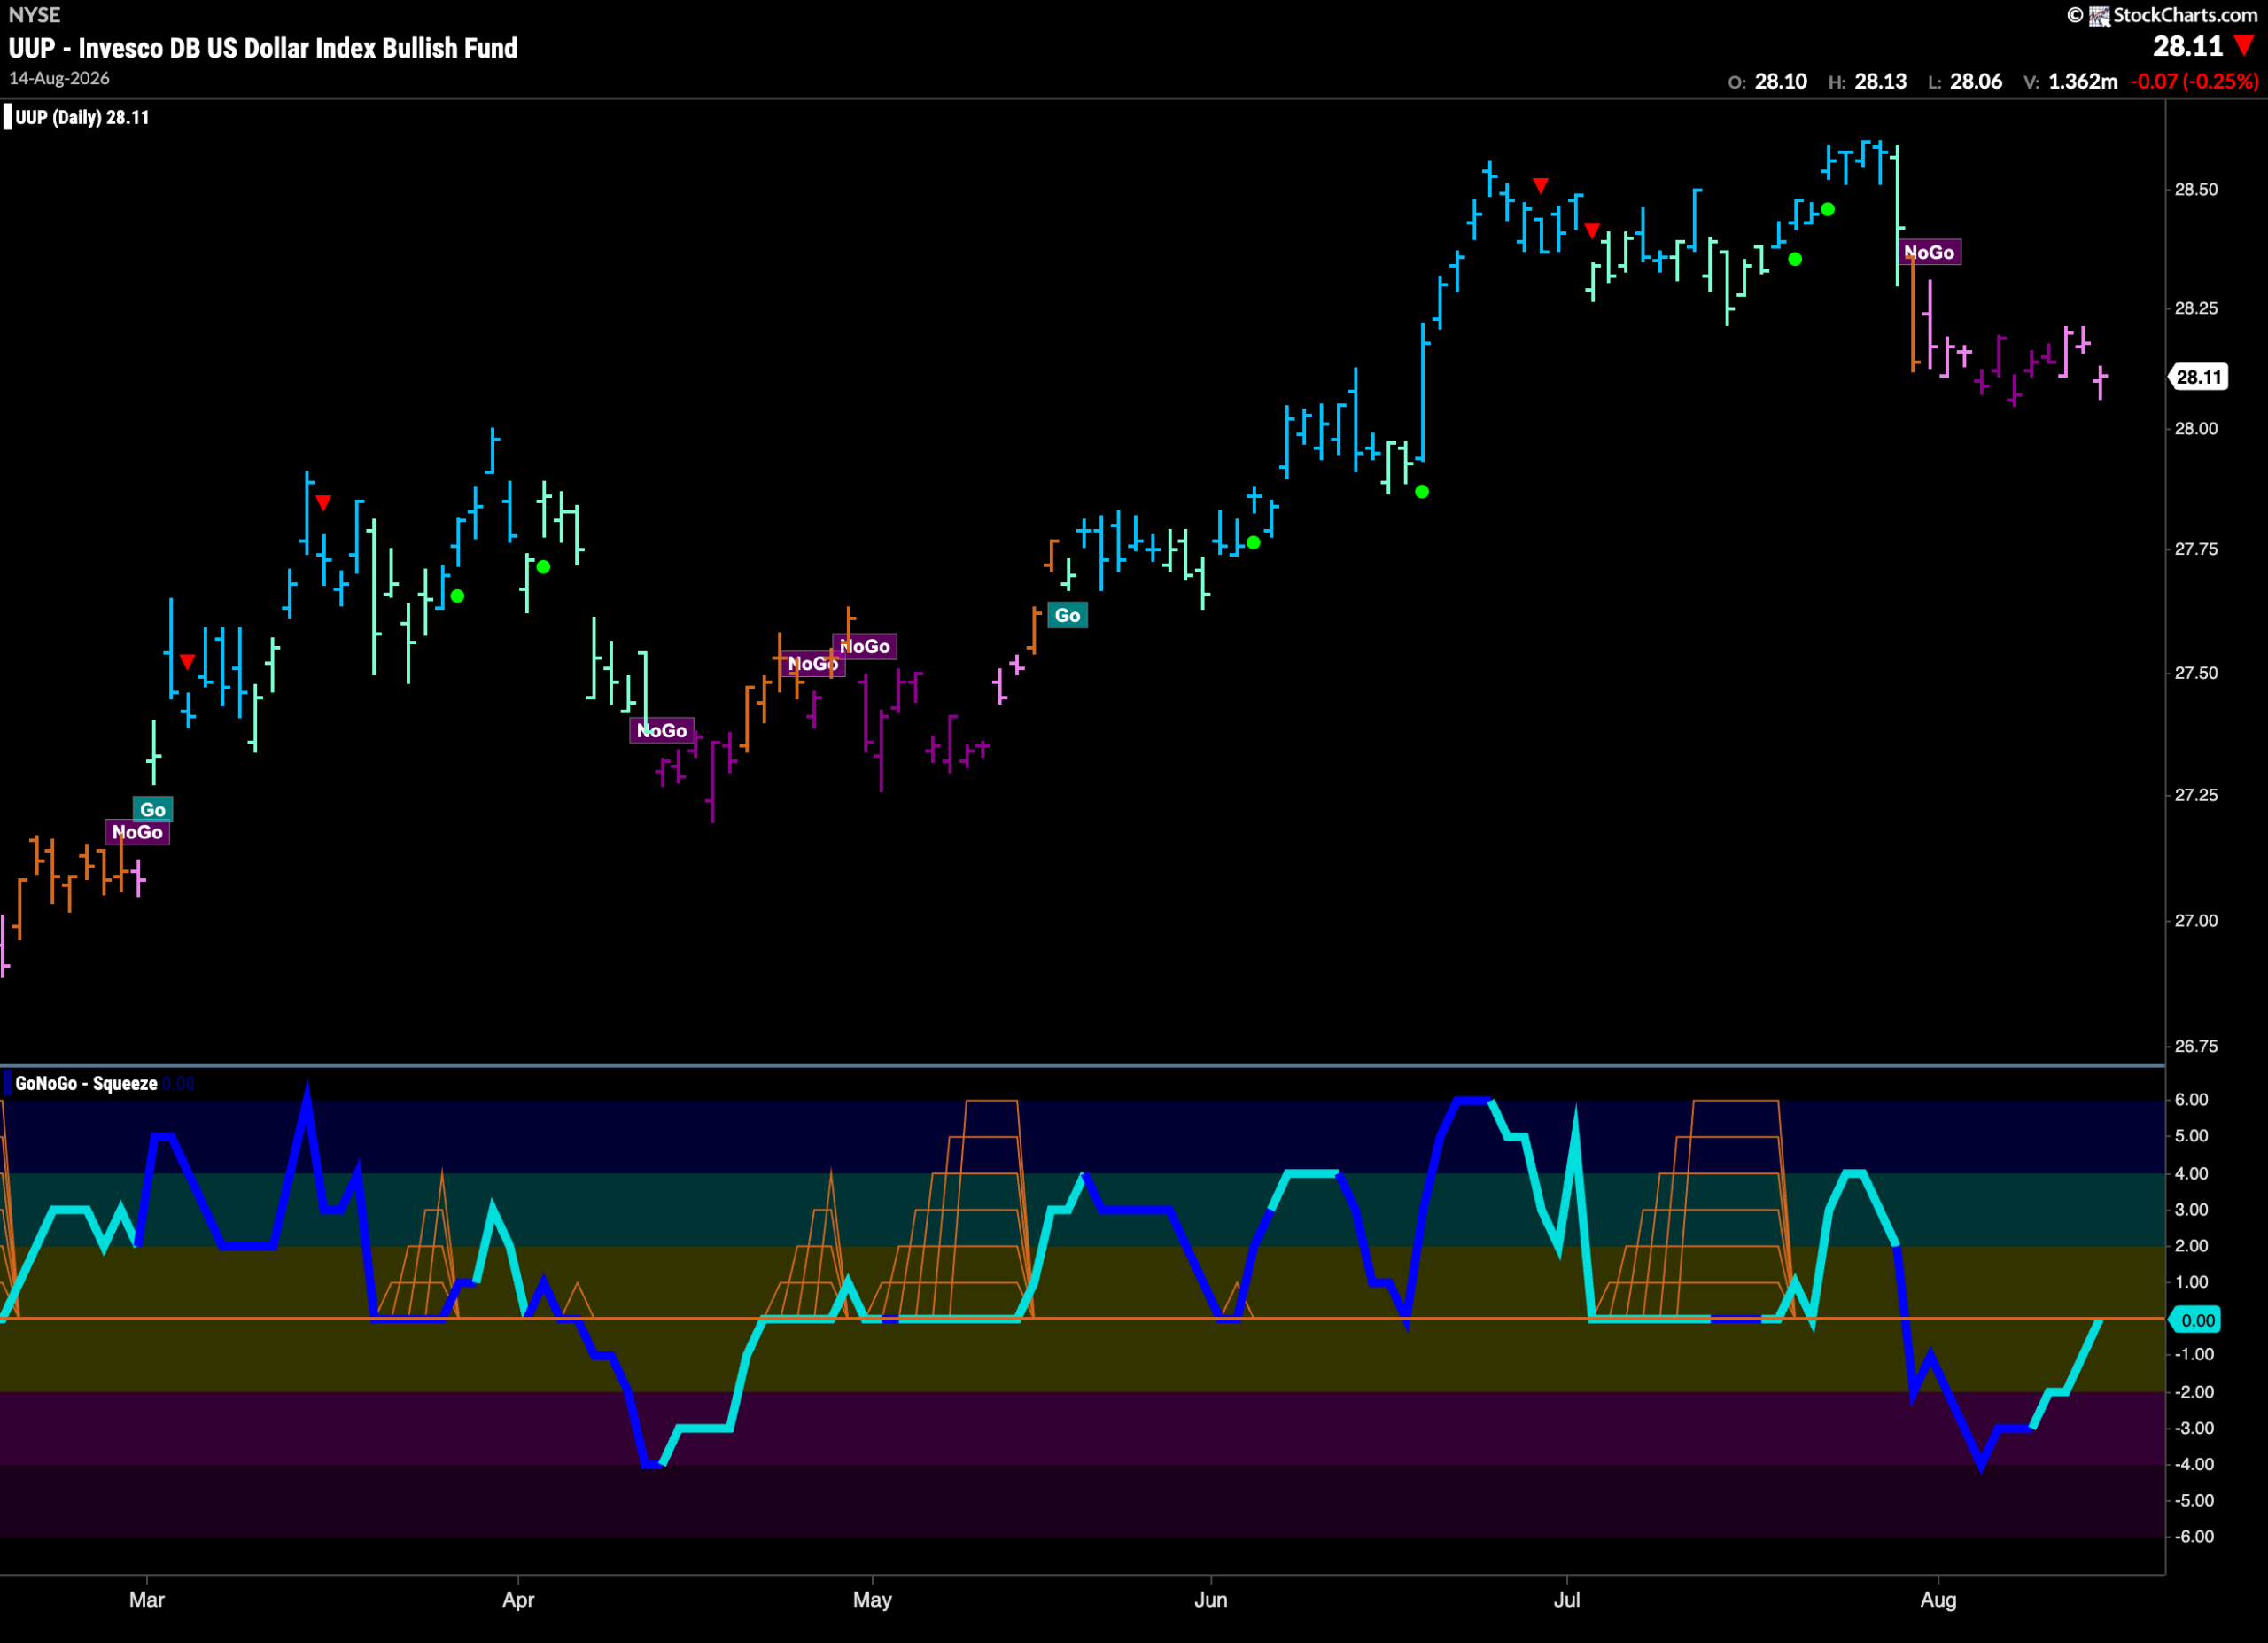
Dollar ($UUP) New “NoGo” Weakens
The chart below shows that the “NoGo” trend has weakened at the end of last week as GoNoGo Trend paints consecutive pink bars. GoNoGo Oscillator is testing the zero line from below where we will watch to see if it finds resistance. Should it get turned away from the zero line then we would know that momentum is resurgent in the direction of the “NoGo” and we would look for further downside pressure on price.
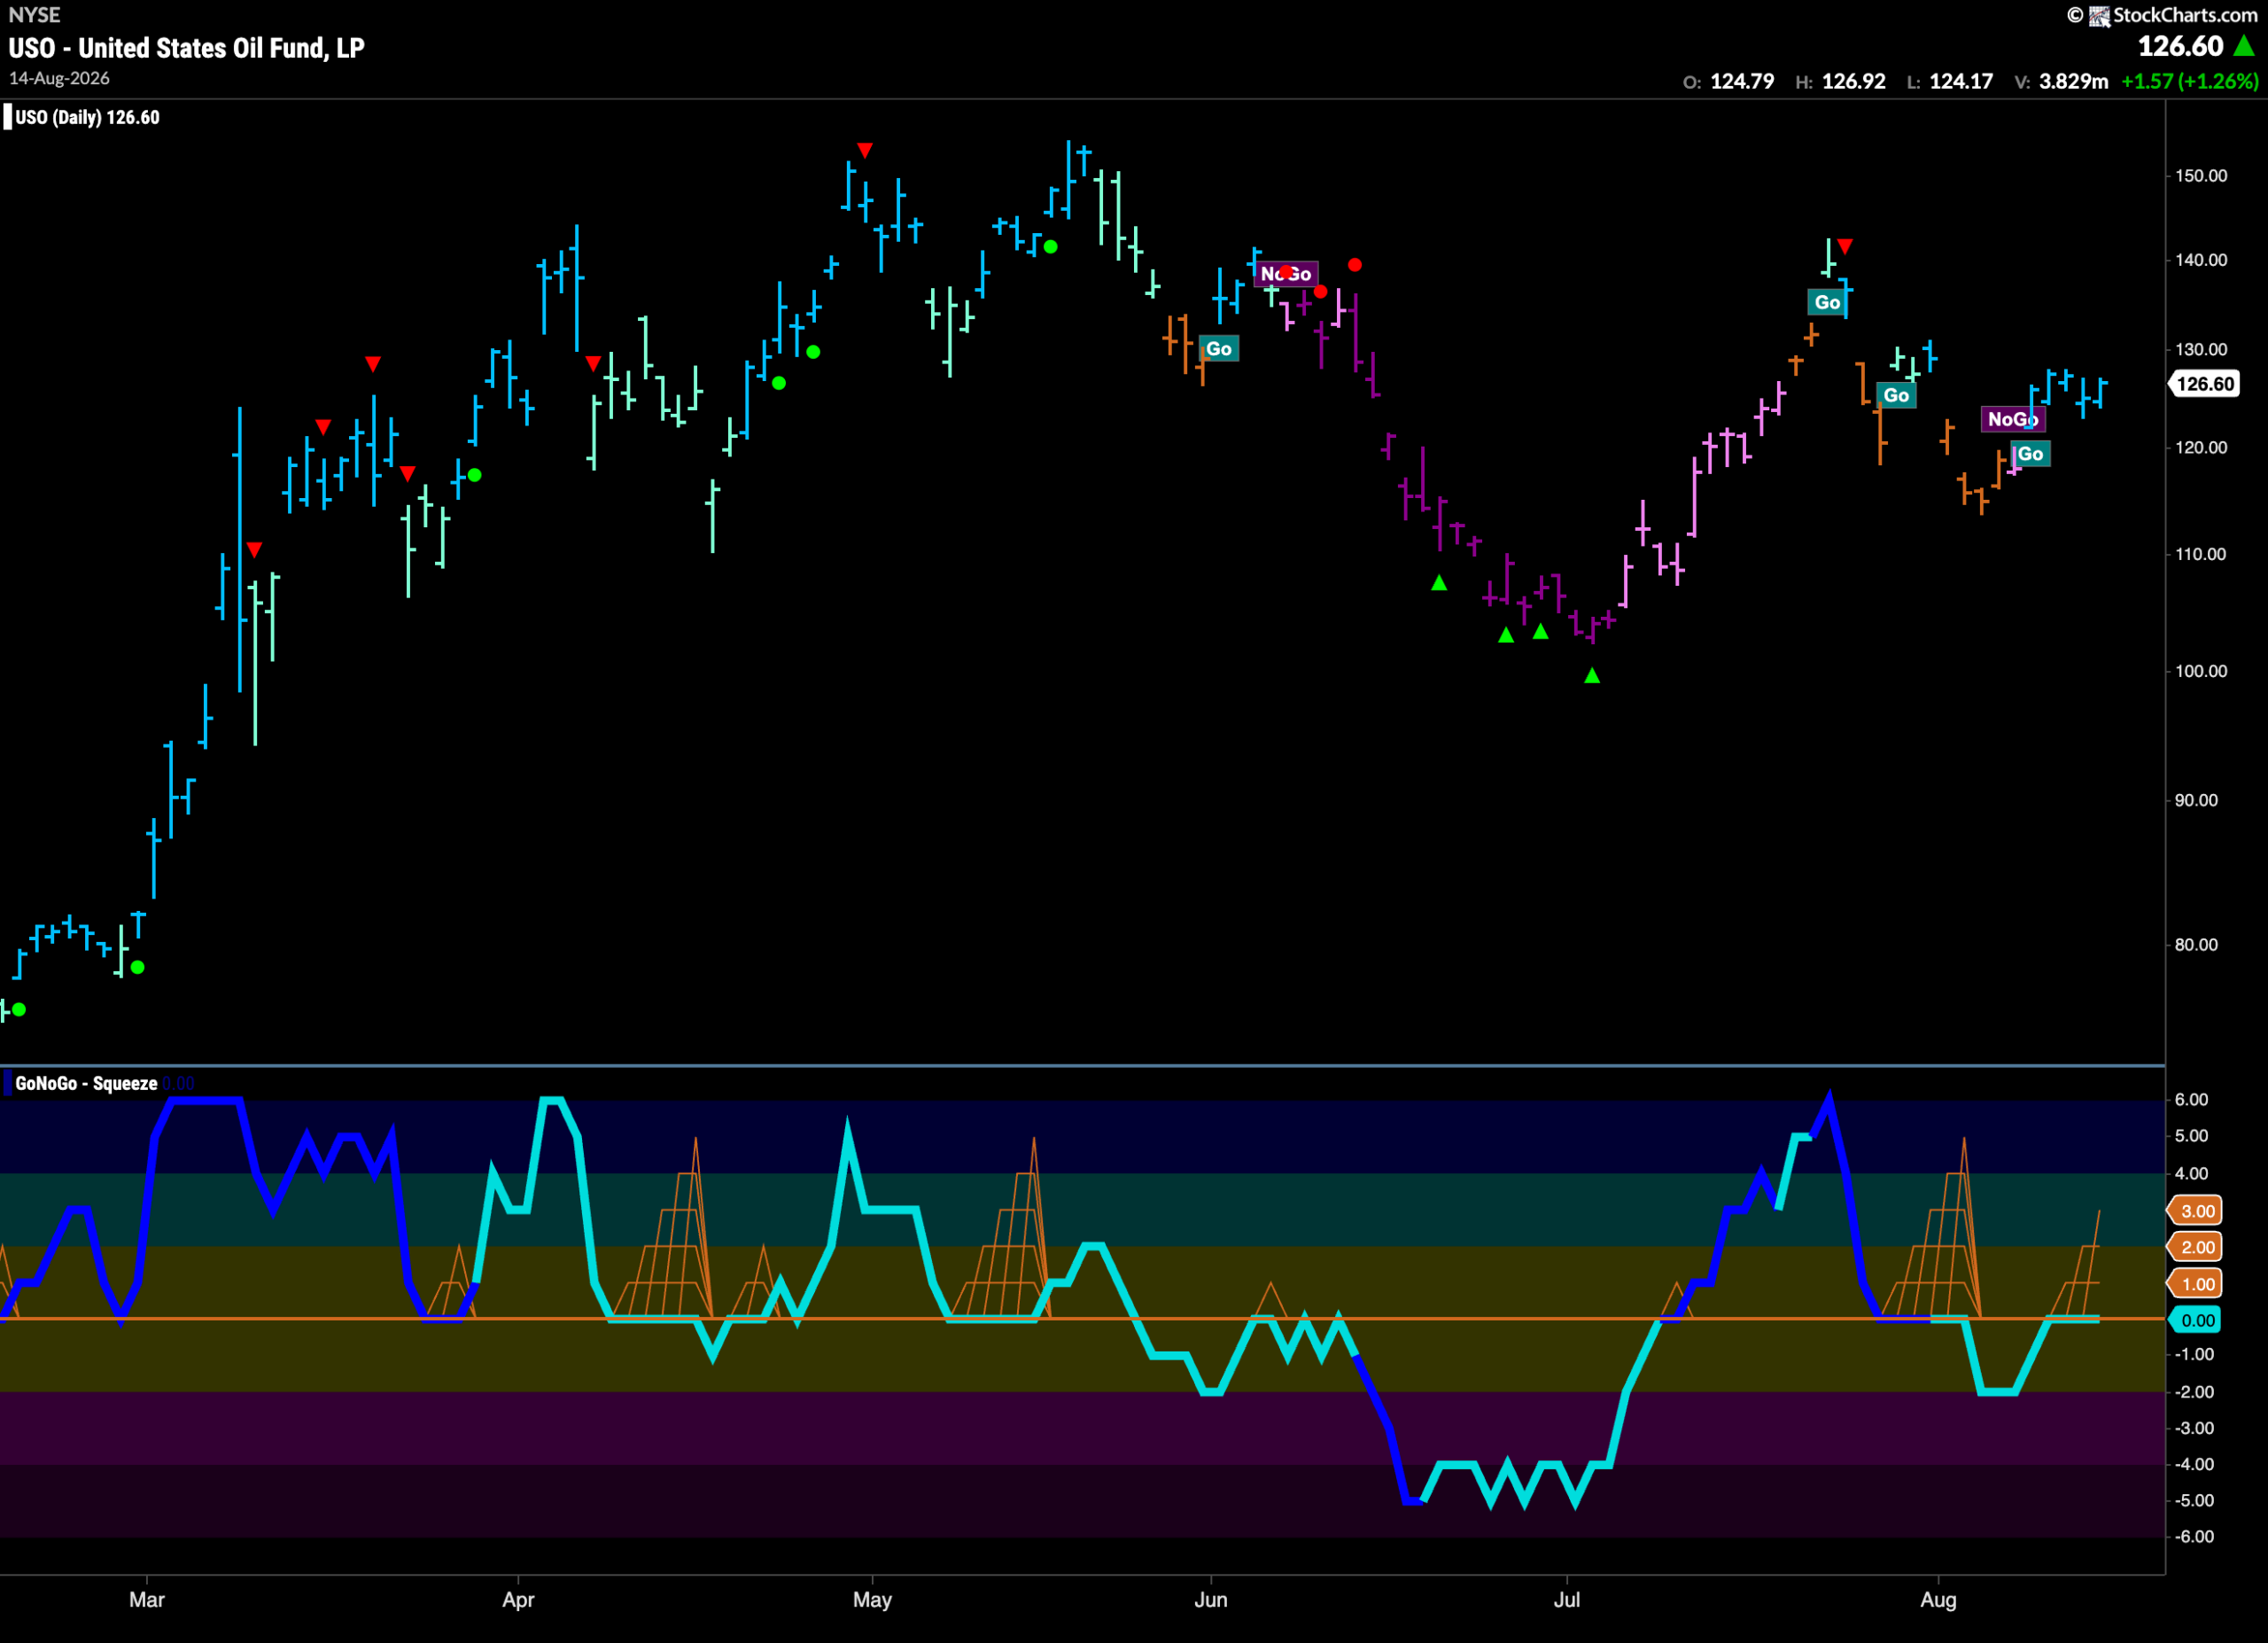
$USO Sees New “Go” Trend Hold
GoNoGo Trend shows that there was a new “Go” trend last week as the indicator painted a string of bright blue bars having seen price set a higher low the week before. GoNoGo Oscillator is riding the zero line having risen from below and we will watch to see if it can regain positive territory this week. If it can, that would offer support for the “Go” trend that we see in the price panel.
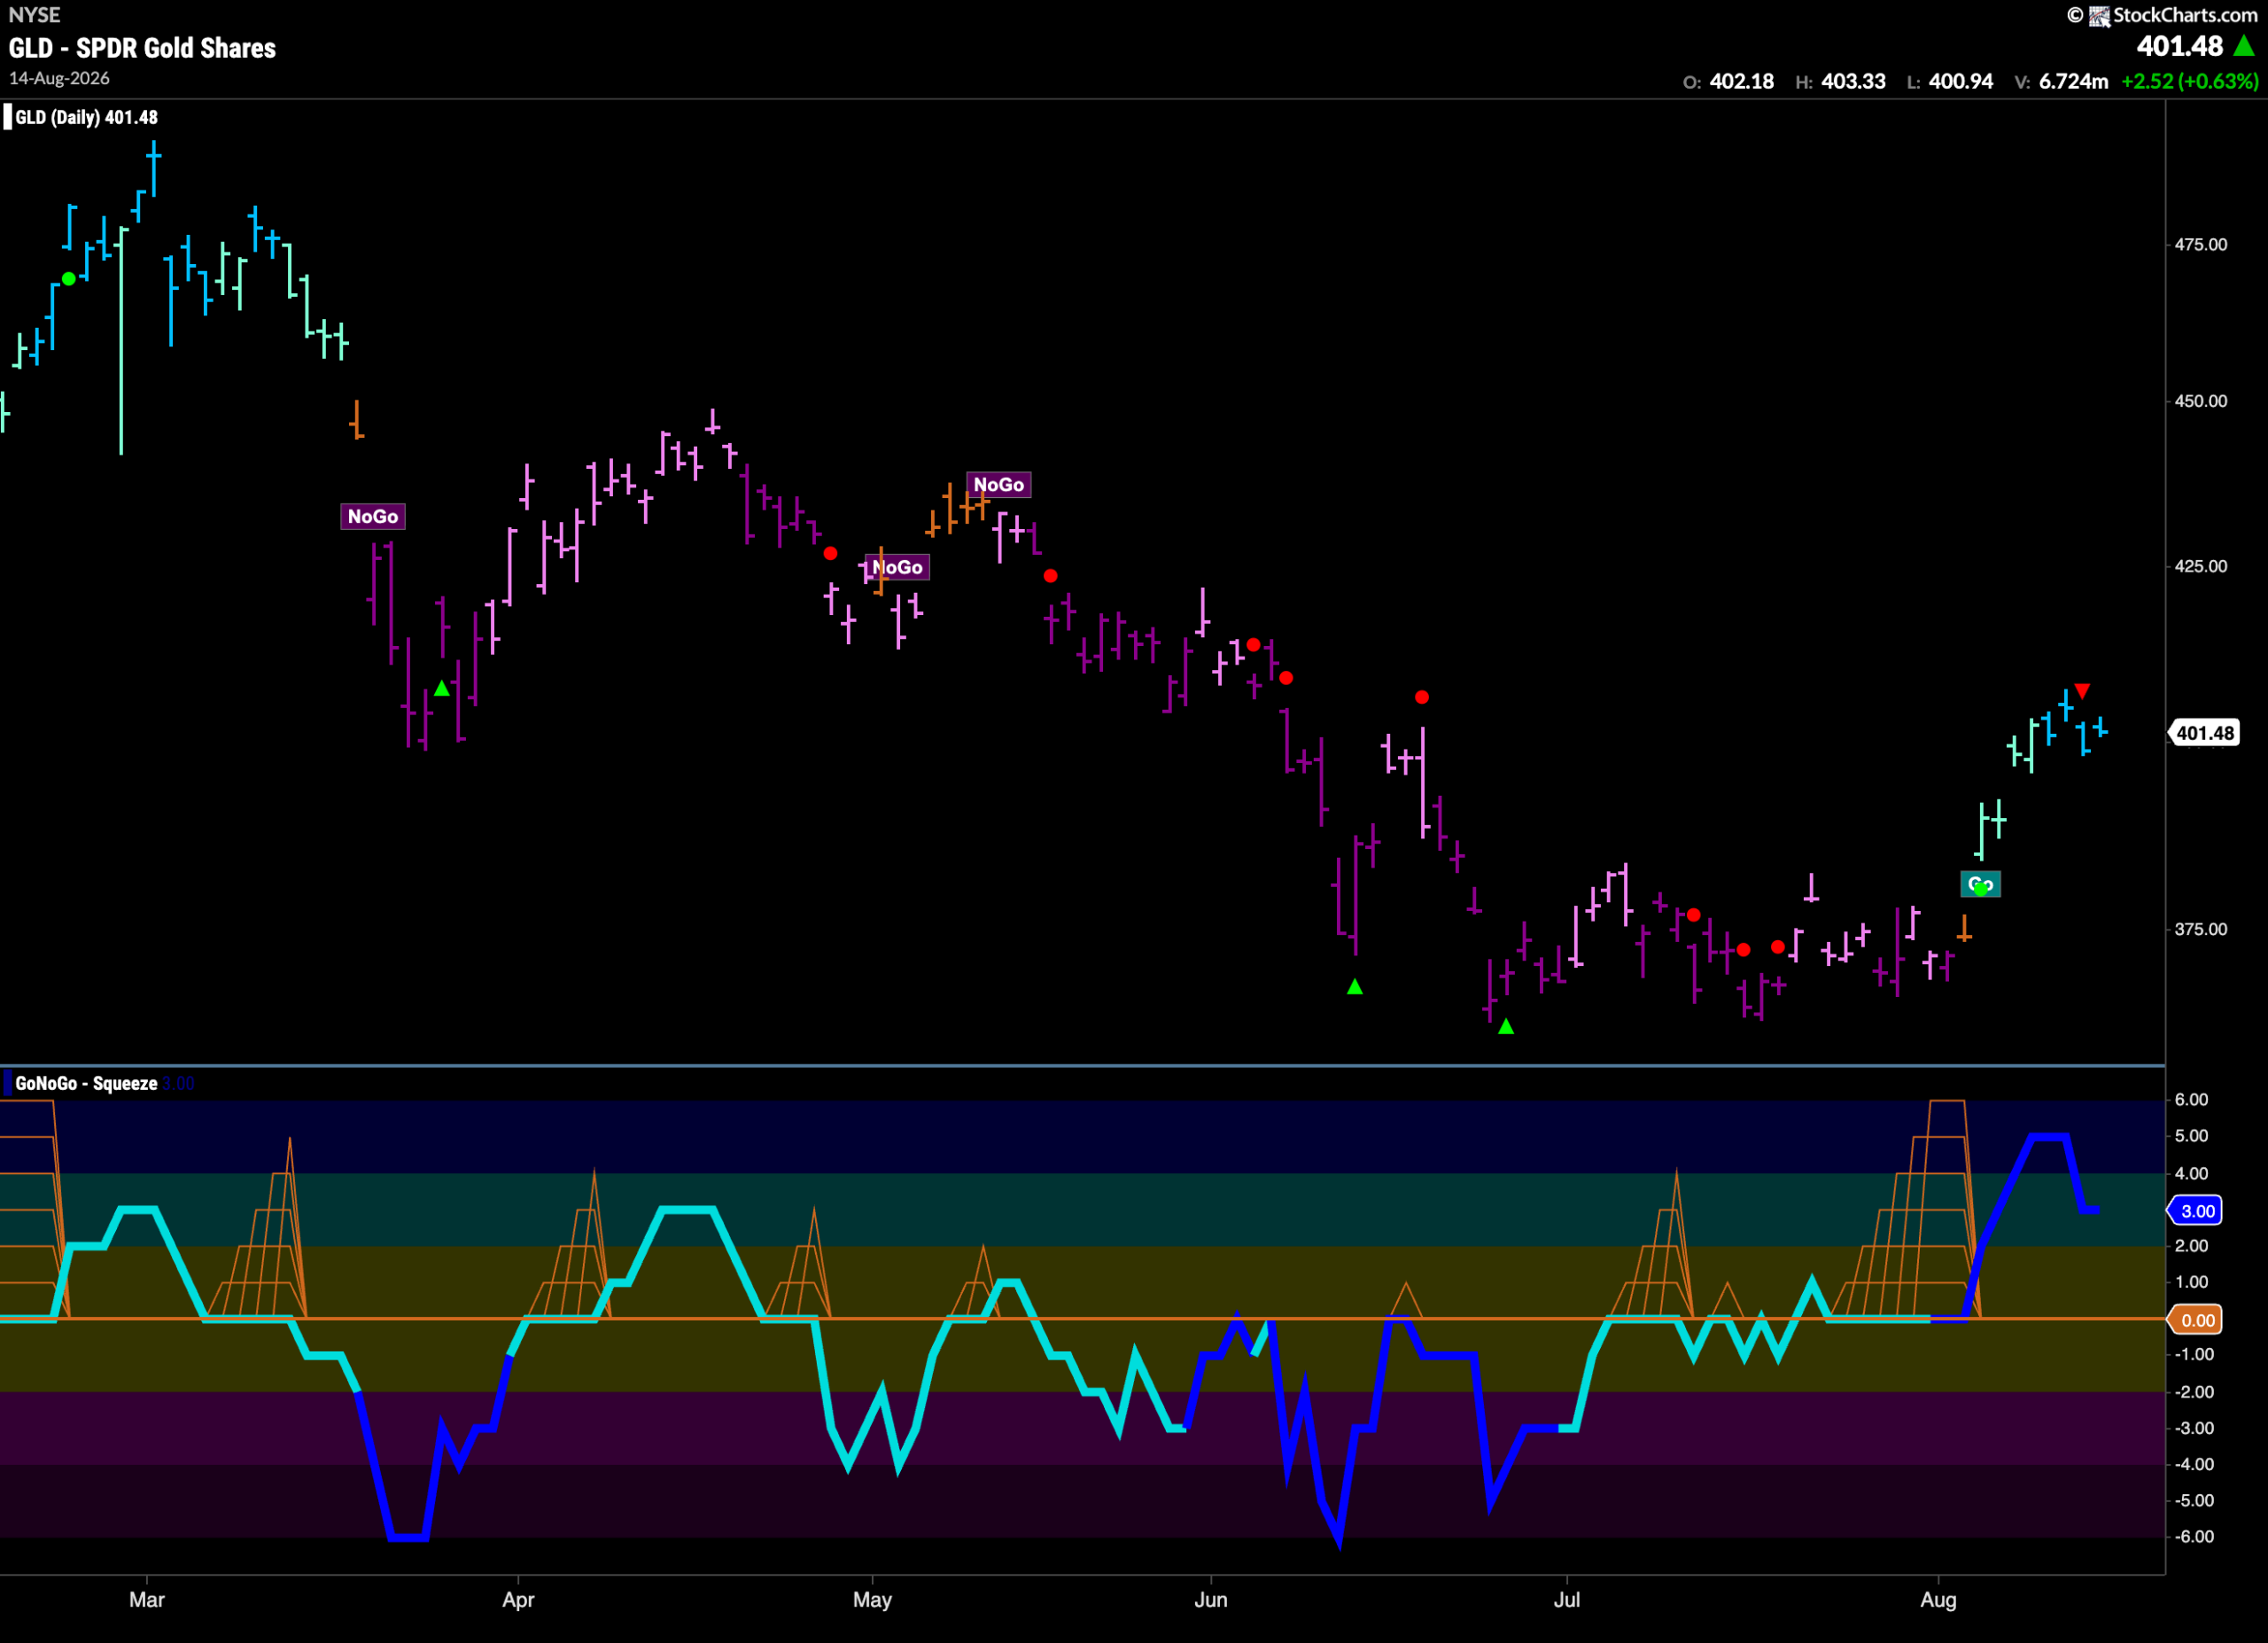
Gold ($GLD) New “Go” Trend Strengthens
The new “Go” trend shows strength last week as we saw bright blue bars and a new high in price. GoNoGo Oscillator has fallen out of overbought territory and so it may be difficult for price to go higher in the short term this week due to waning momentum. We will watch to see if the oscillator can remain above the zero line to offer support for the “Go” trend that we are seeing in price.
Sector RelMap
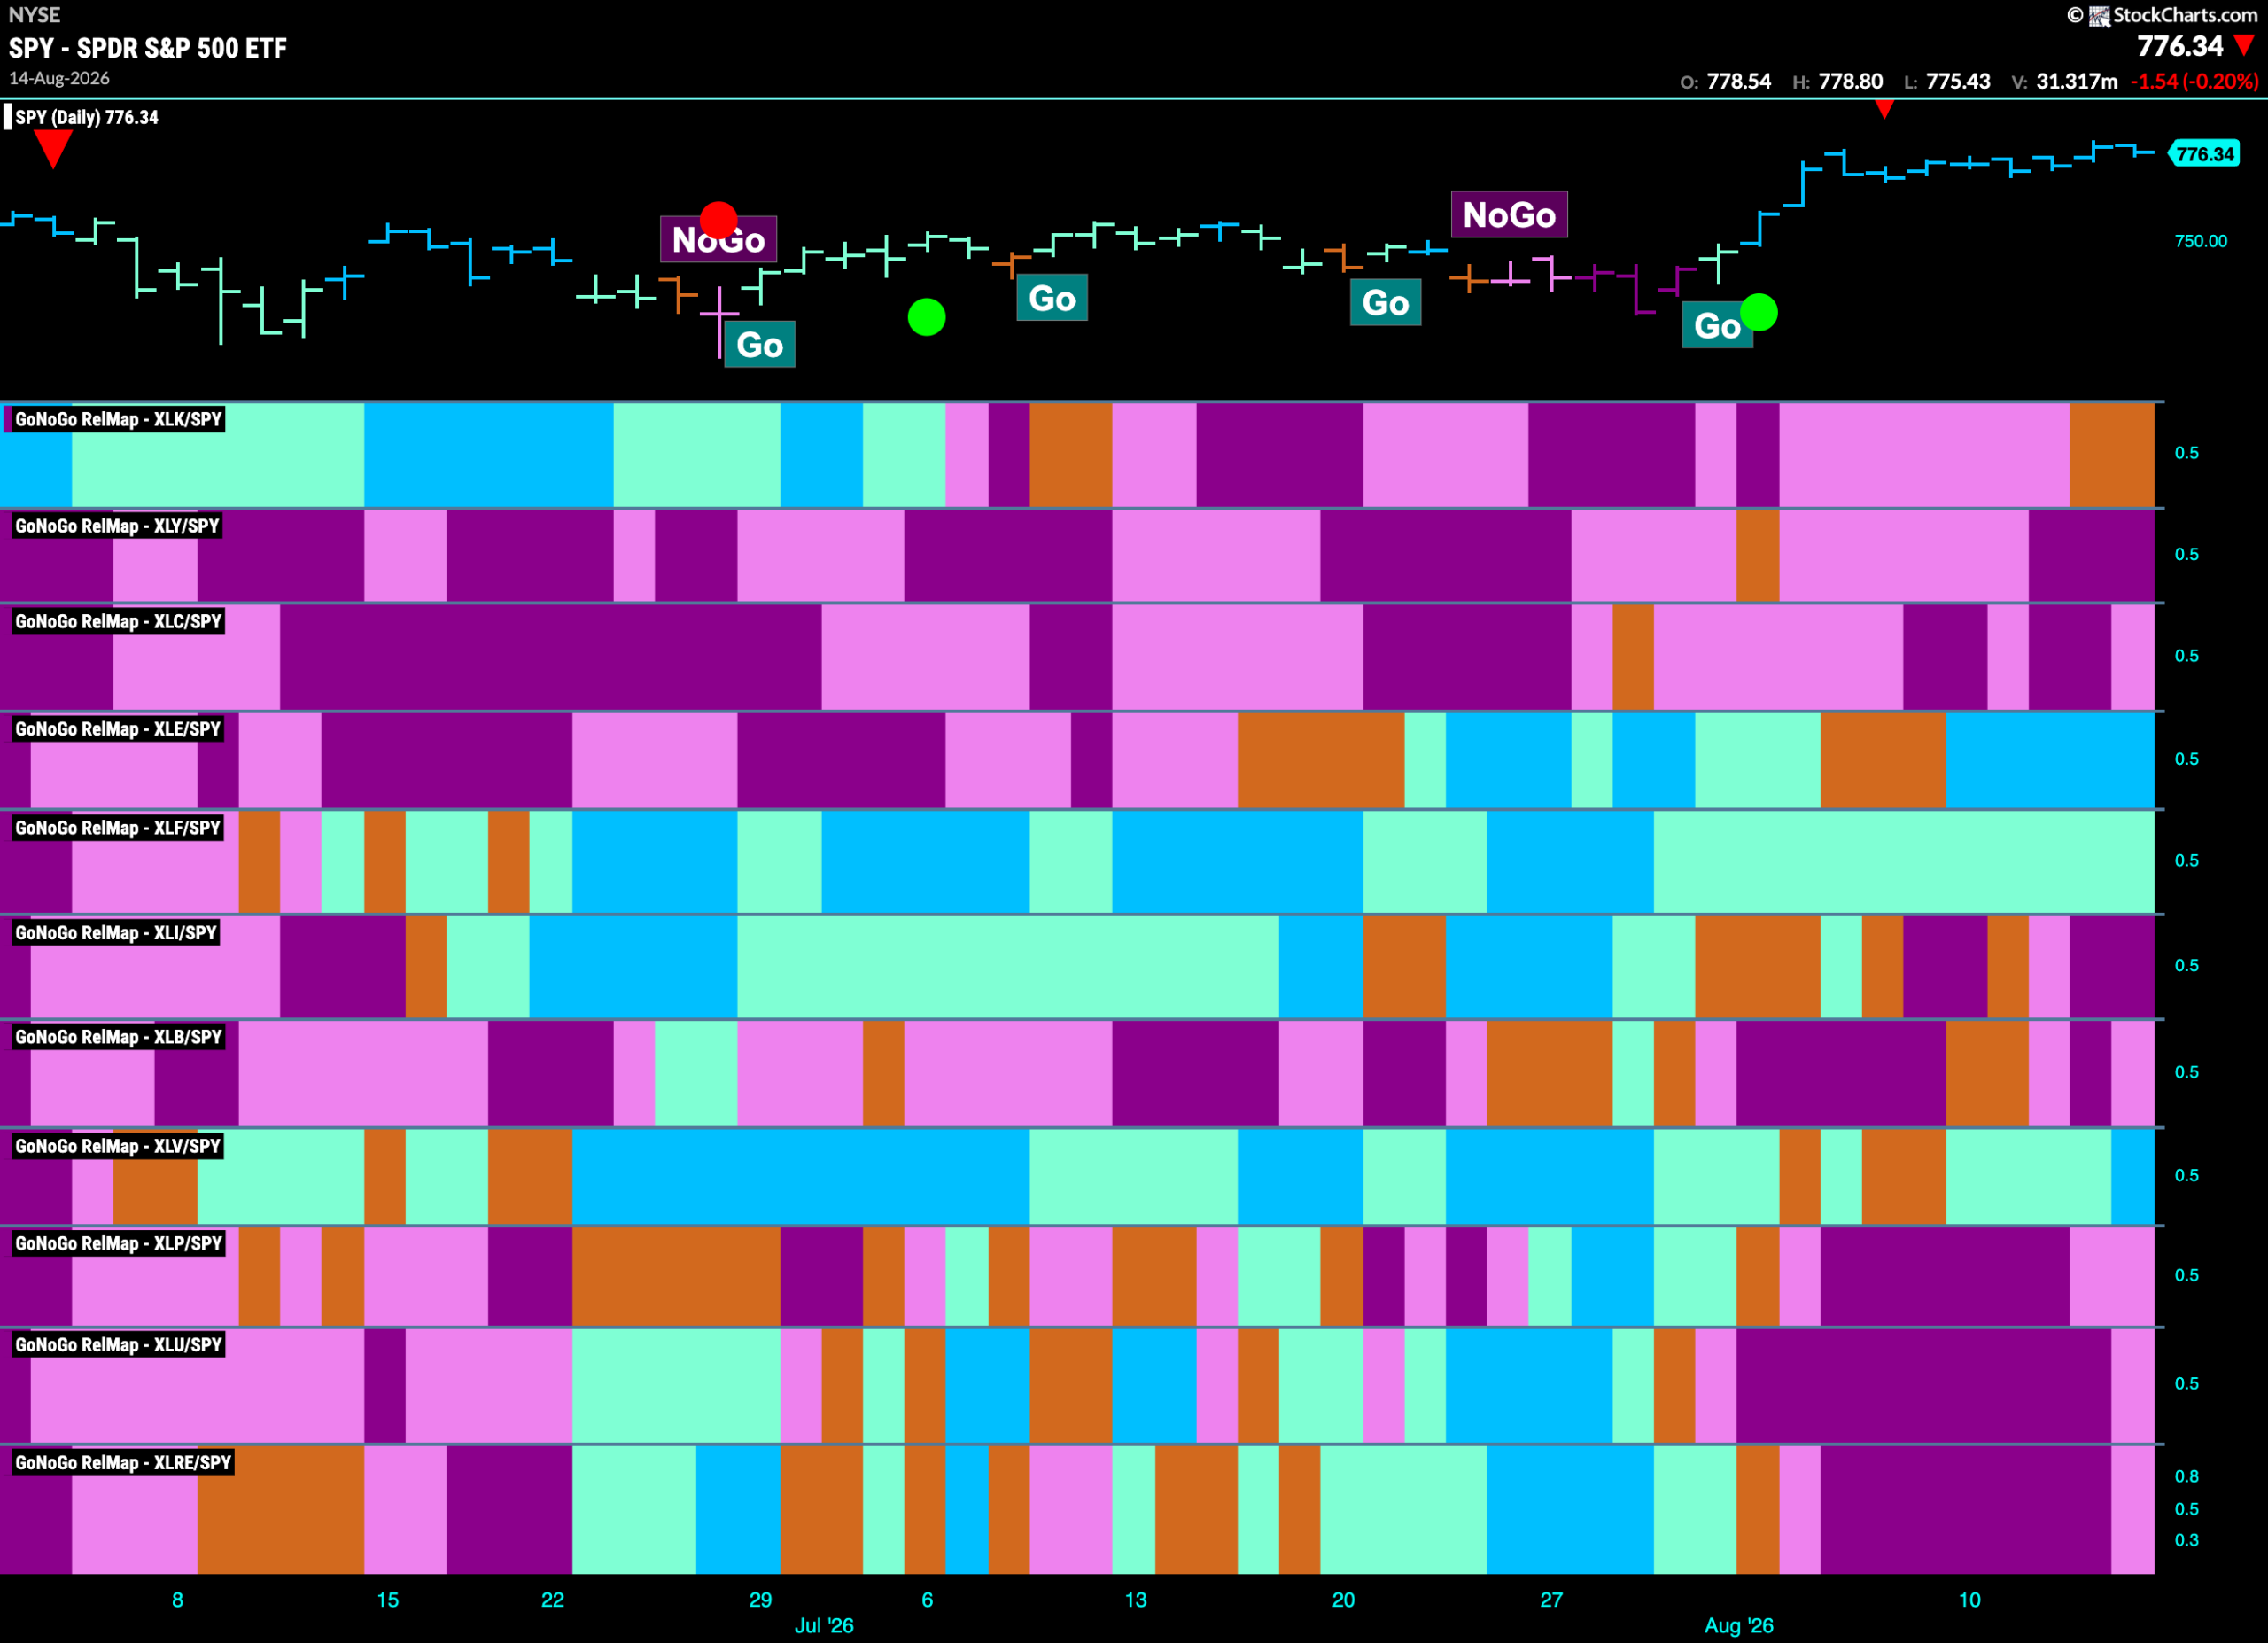
Below is the GoNoGo Sector RelMap. This GoNoGo RelMap applies the GoNoGo Trend to the relative strength ratios of the sectors to the base index. With this view we can get a sense of the relative out performance and relative underperformance of the sectors. 3 sectors is in a relative “Go” trend. $XLE, $XLF, and $XLV are painting blue relative “Go” bars.
Energy Sub-Group RelMap
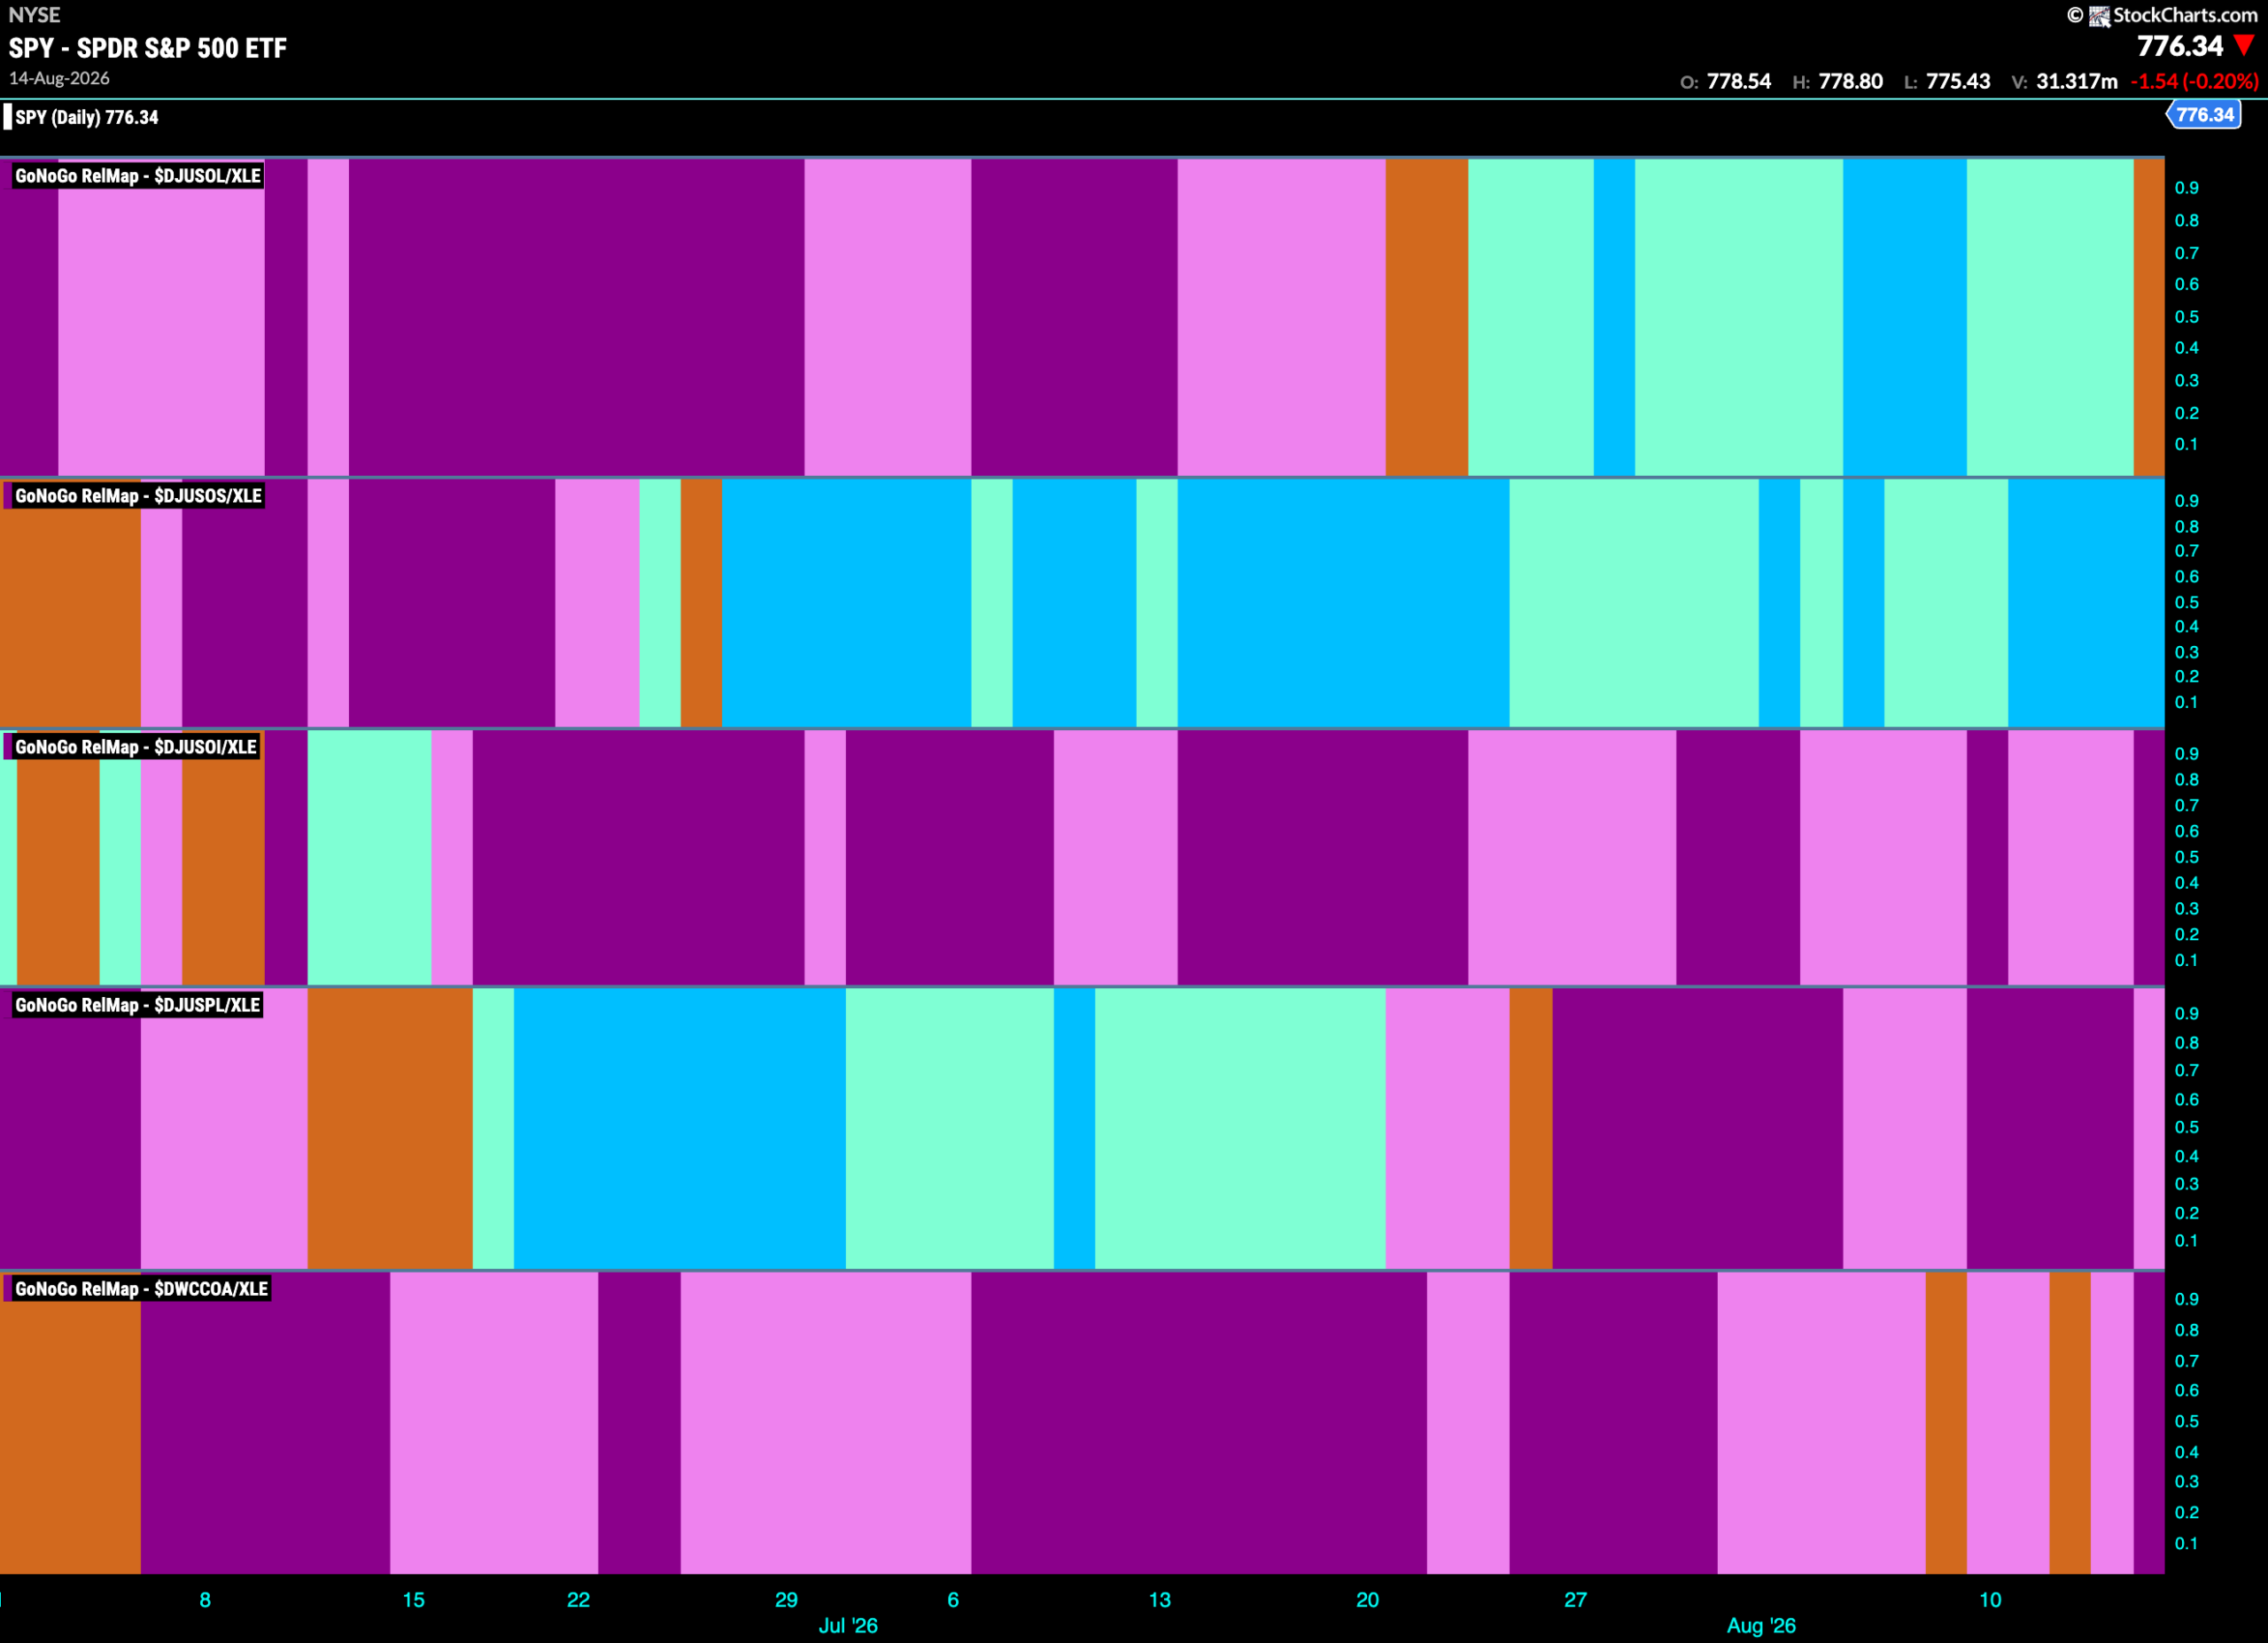
The chart below shows a relative trend breakdown of the sub groups within the financials sector this week. The Sub-Group RelMap plots the GoNoGo Trend of each sub index to the $XLE. We saw in the above GoNoGo Sector HeatMap that $XLE is painting relative “Go” bars. When we look at the below RelMap we can see that the exploration and production index in the 2nd panel has been painting “Go” bars on a relative basis for the longest time.
$GTE Looks for New Highs
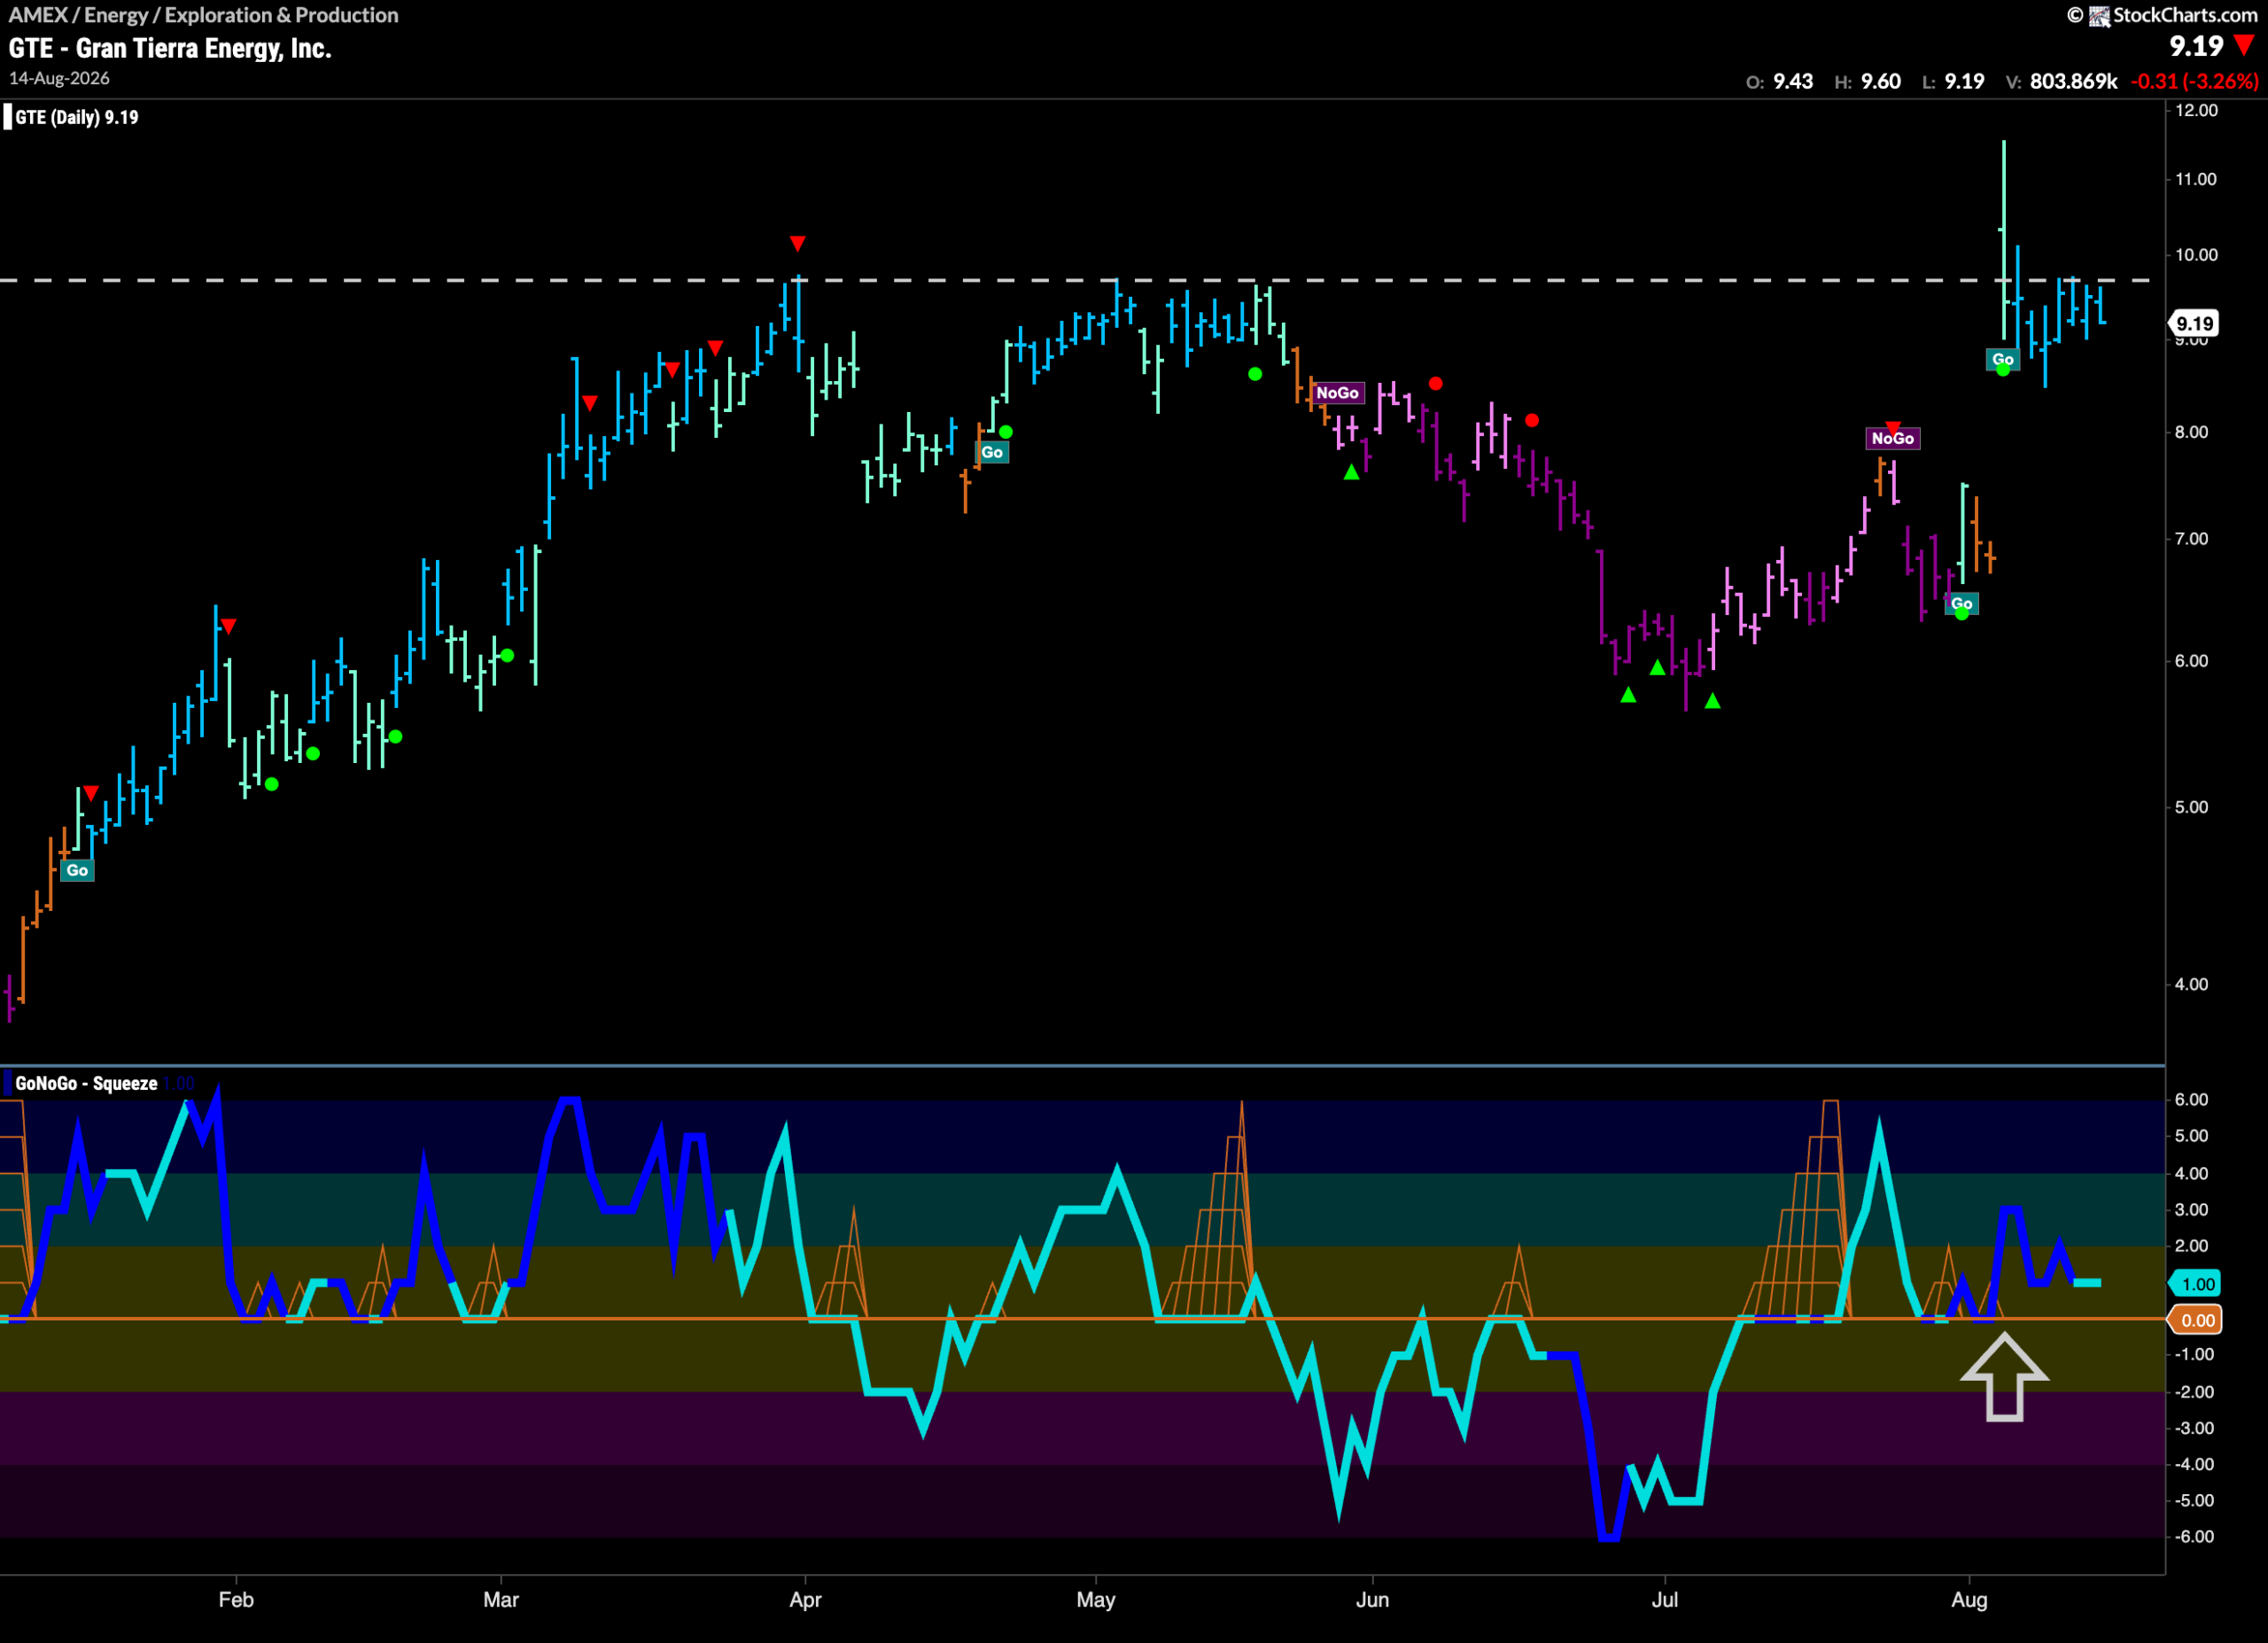
The GoNoGo Chart below shows that $GTE has gapped into a “Go” trend but is running into resistance from prior highs. Having failed to close above these prior highs we know that price will need some help from momentum to break through. We look at the oscillator panel and we see that the indicator remains in positive territory and is close to the zero line. We will want to see support at this level if tested to help propel price to new highs.
$SUN Sees Signs of Trend Continuation
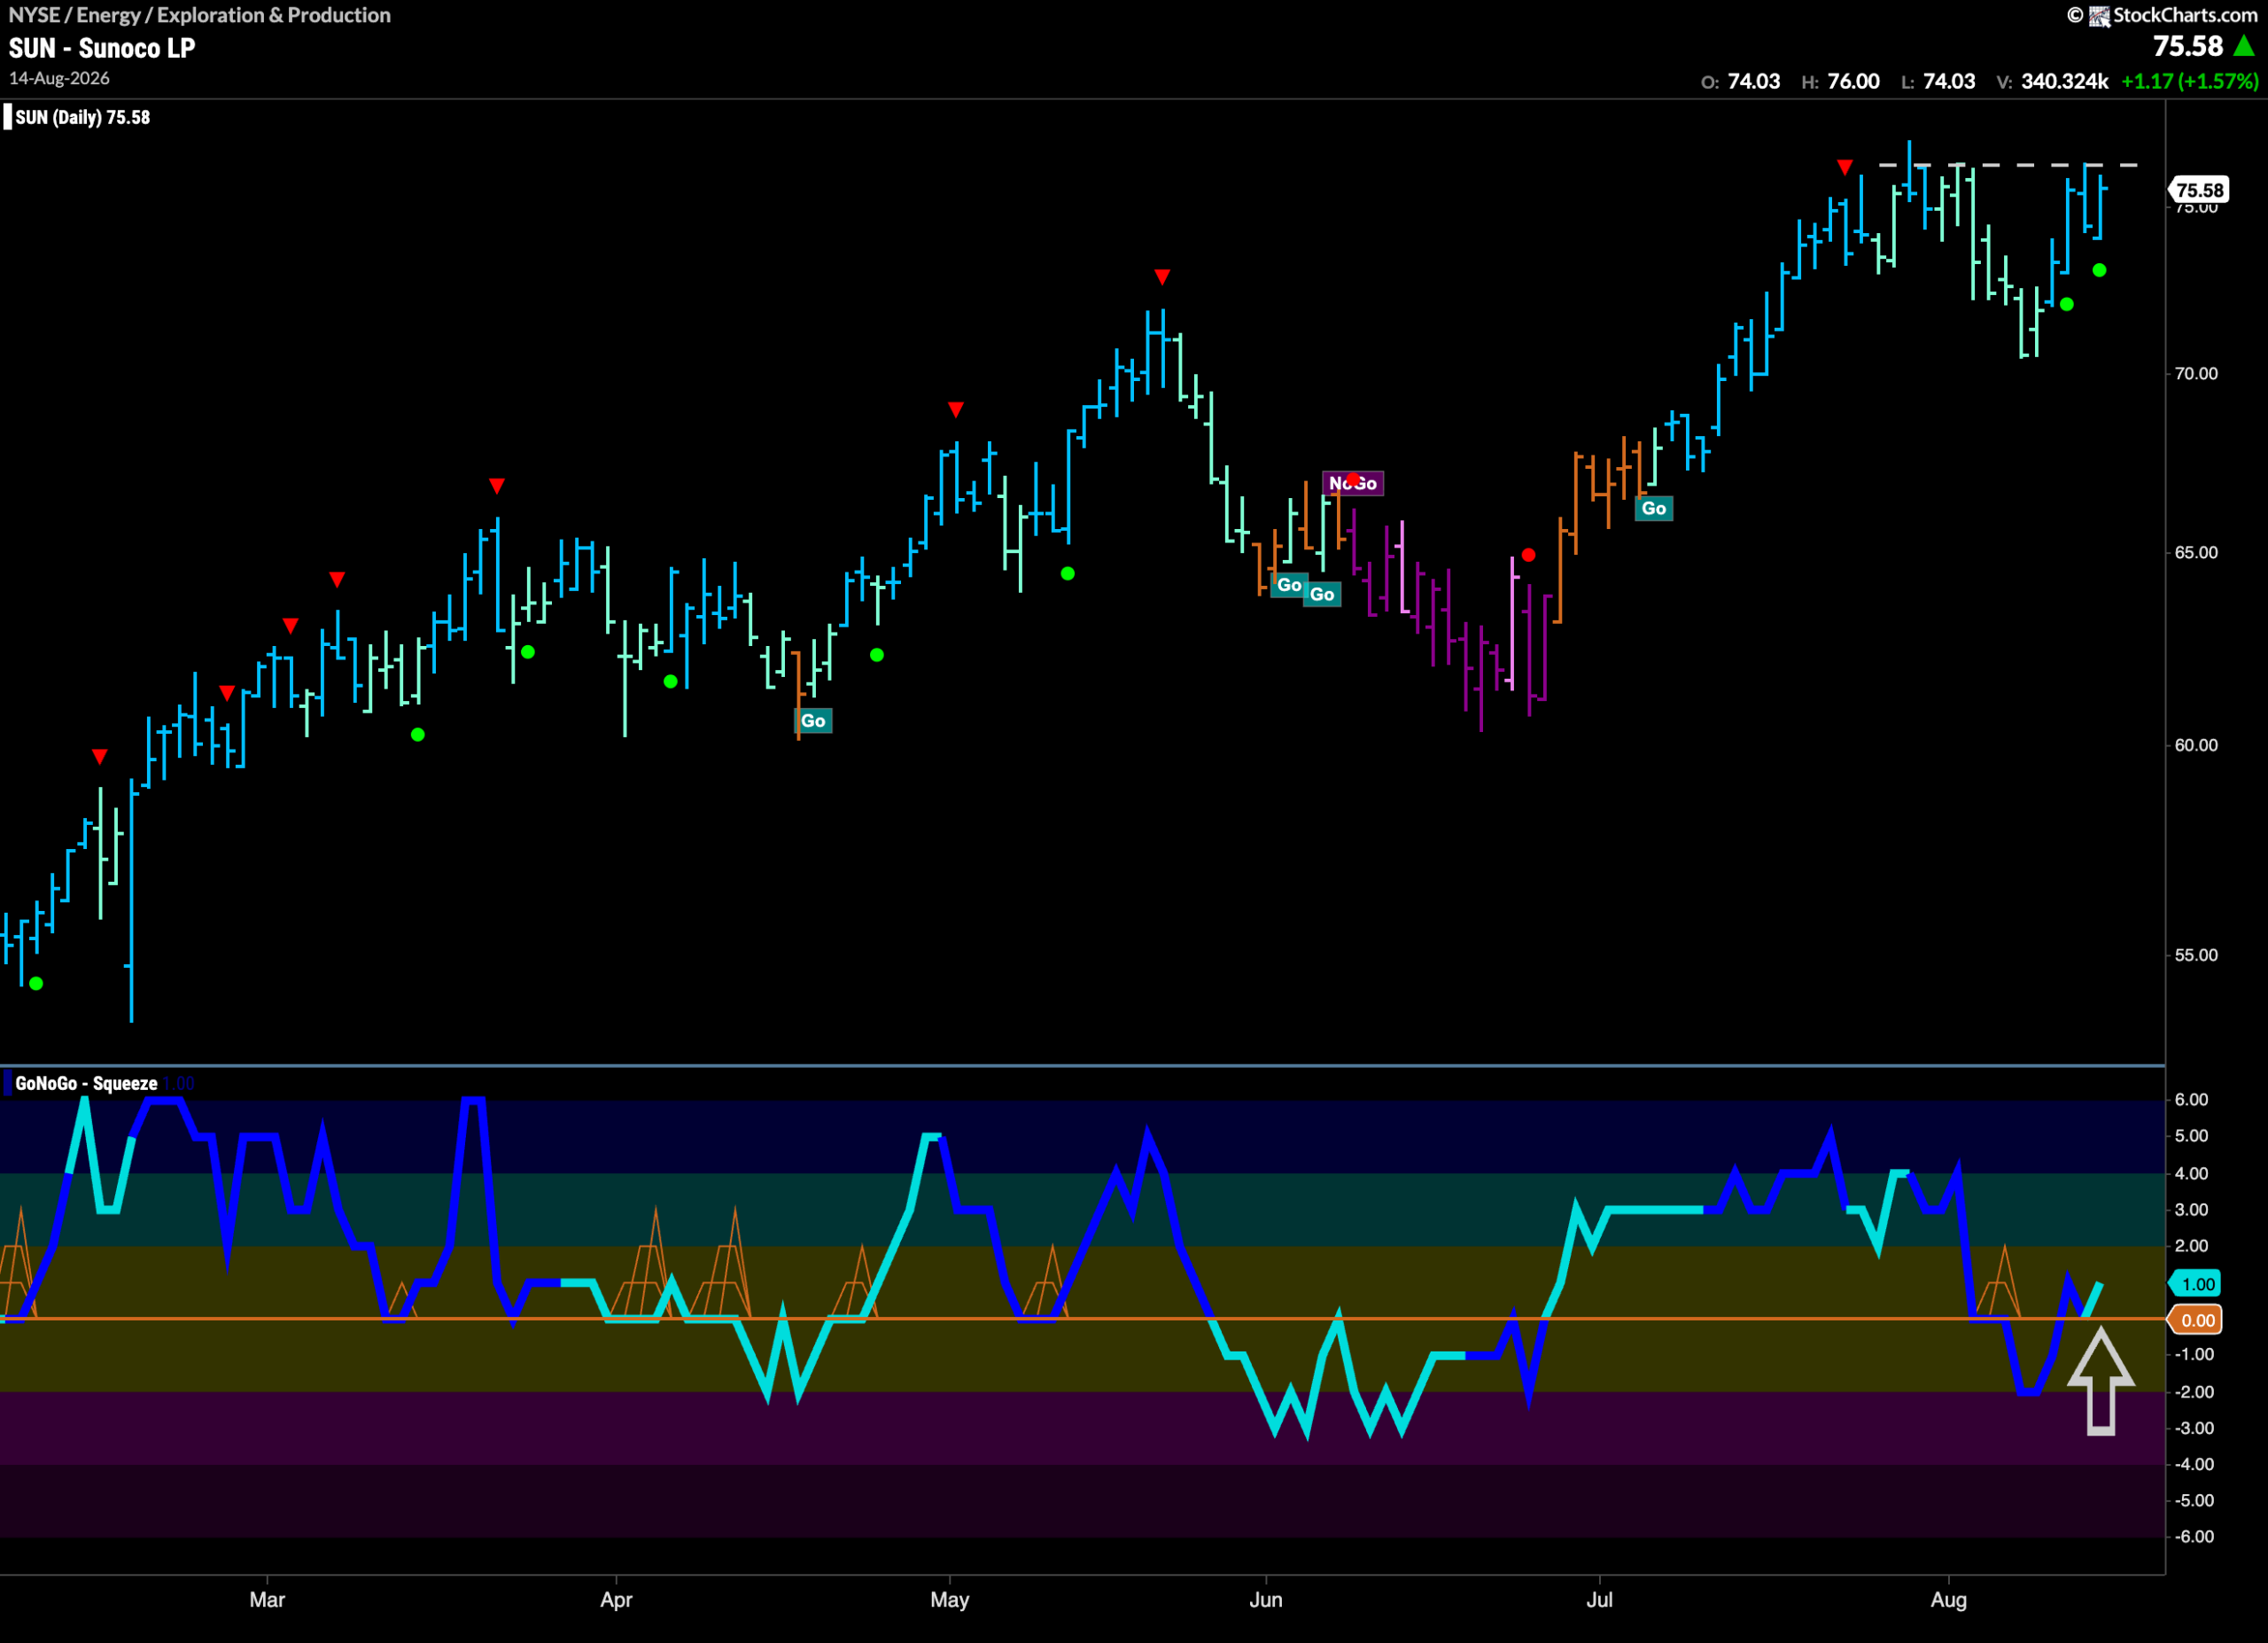
The chart below shows $SUN has been in a “Go” trend and is testing for new highs. There is resistance from the prior high but we see that GoNoGo Oscillator has broken back into positive territory and is offering a momentum boost. We will watch to see if this is enough to get price to a new high in the coming days.