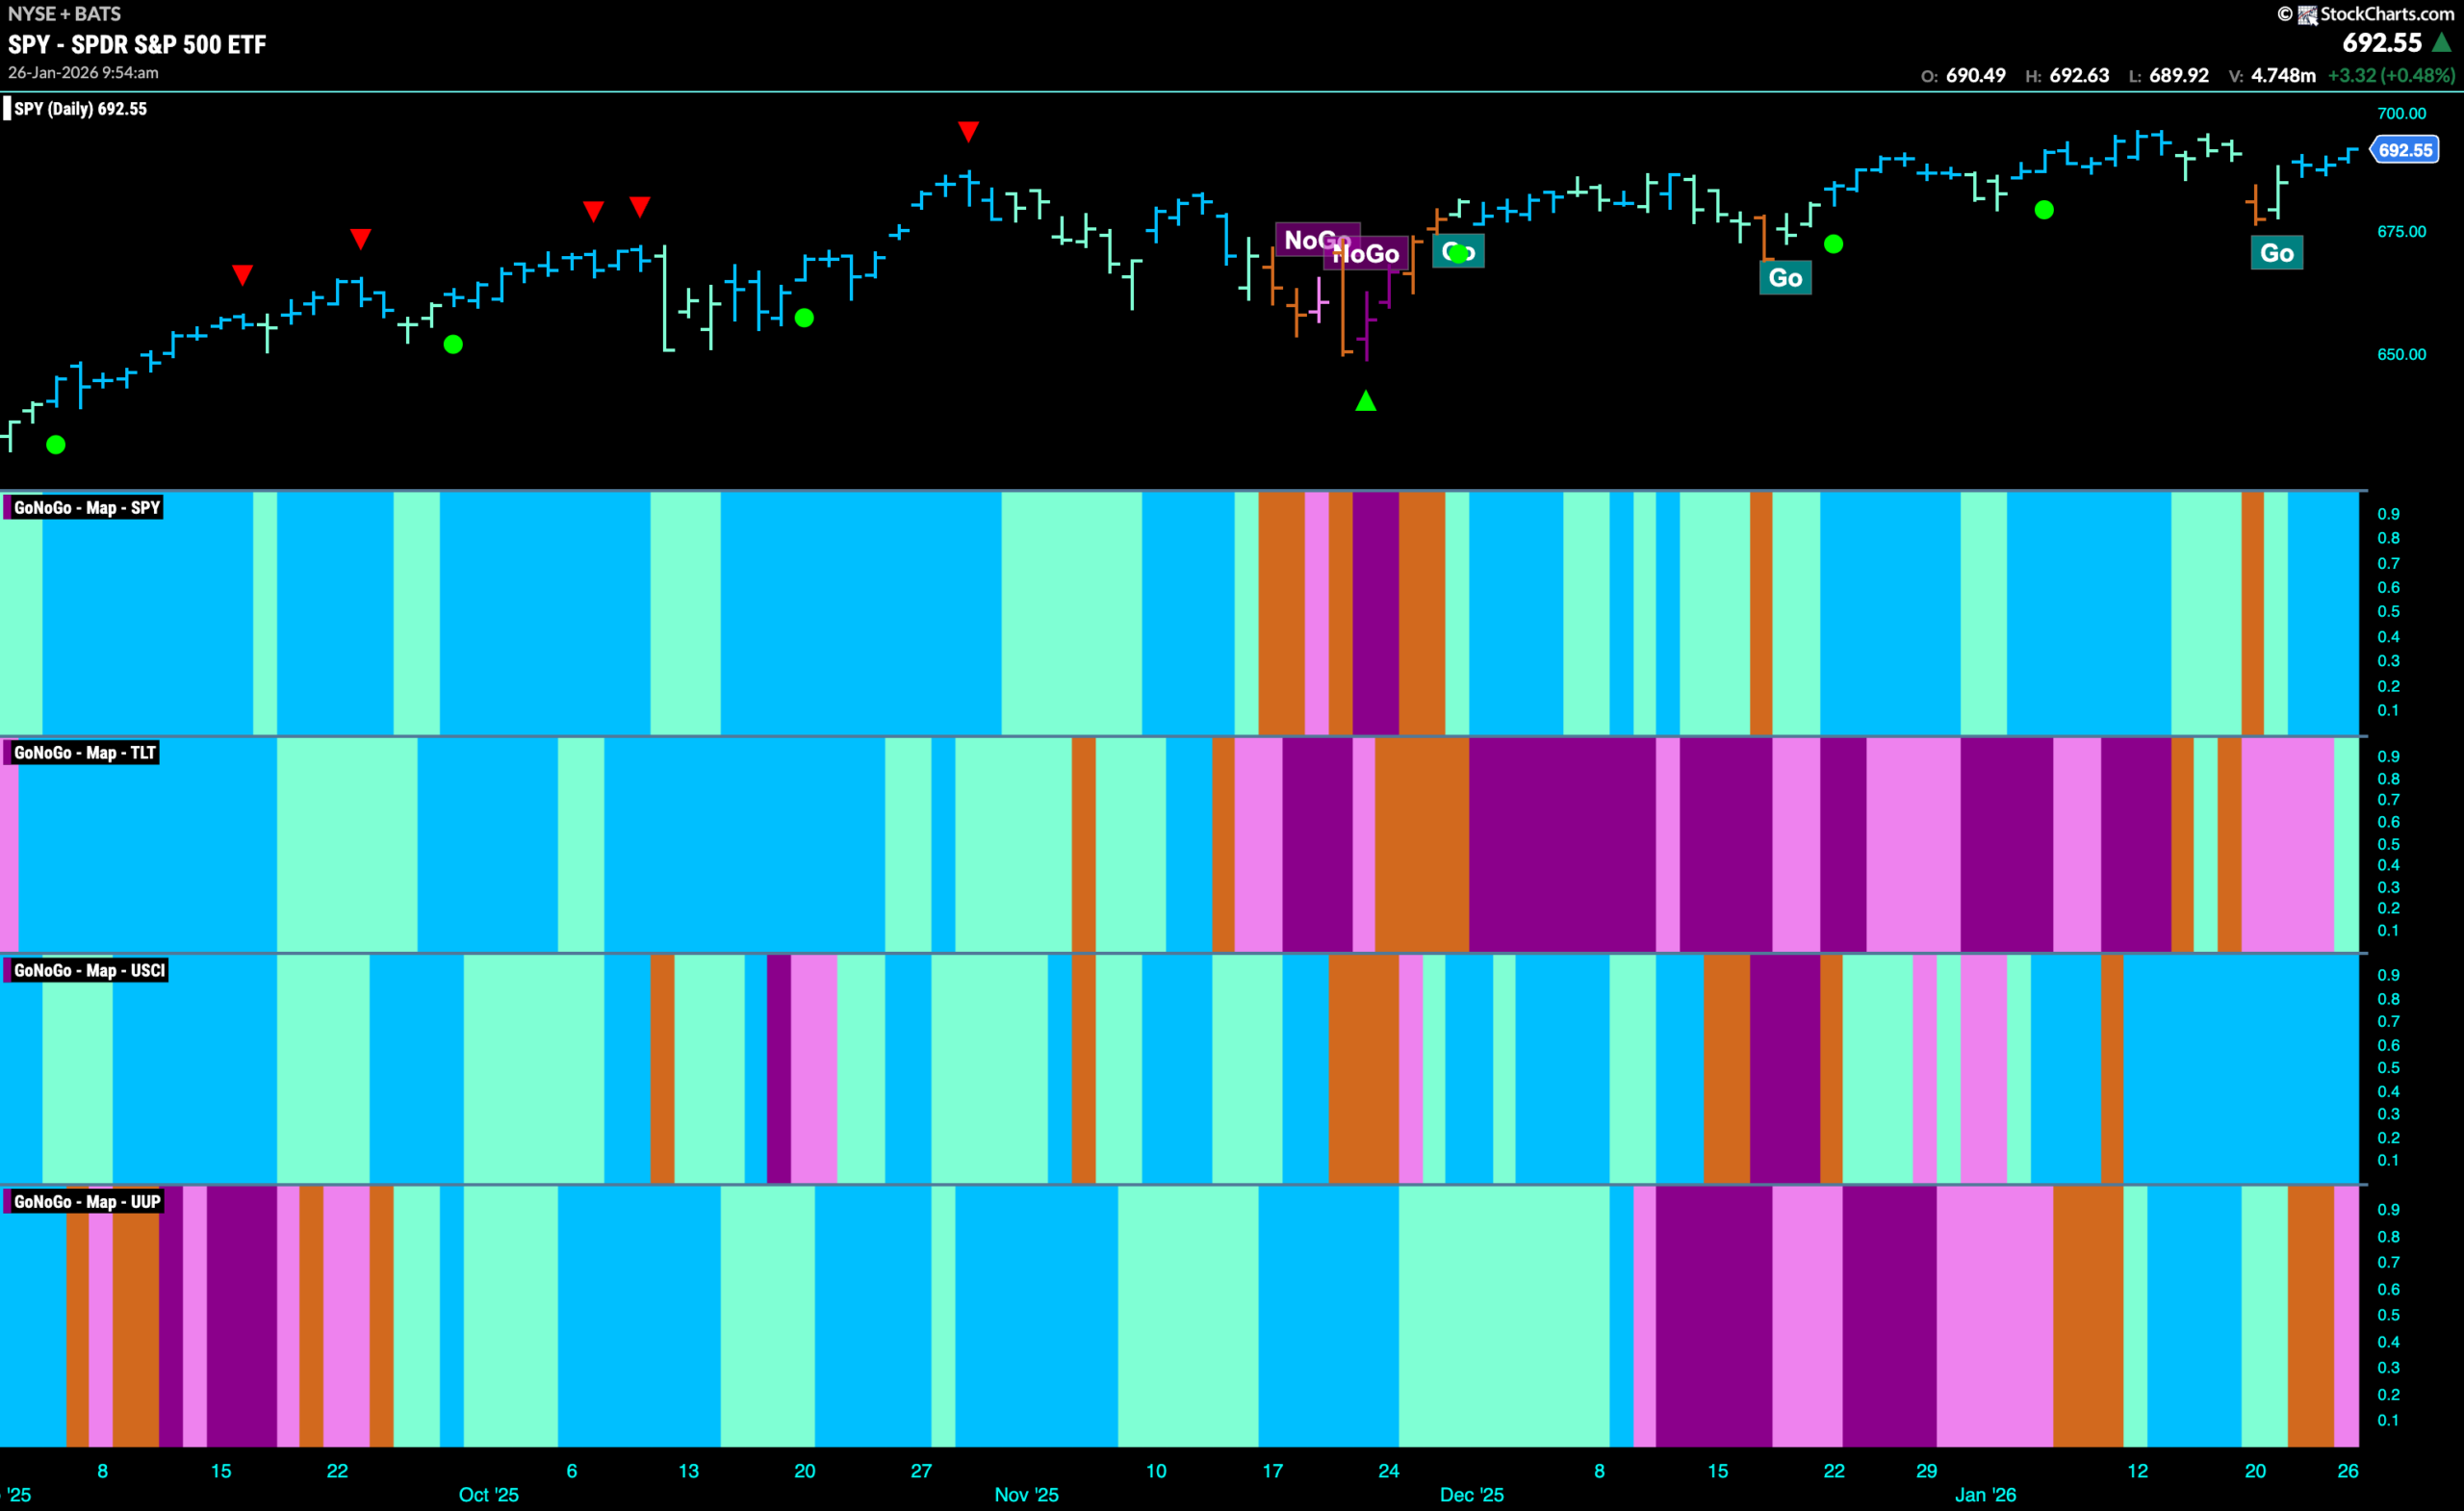
Good morning and welcome to this week’s Flight Path. Equities remain in a “Go” trend and after a single amber “Go Fish” bar at the beginning of the week that reflected uncertainty, we saw strength return as the indicator now paints strong blue bars. Treasury bond prices saw a new aqua “Go” bar after several pink “NoGo” bars last week. U.S. commodities remain in a strong “Go” trend with an uninterrupted string of bright blue bars. The dollar has seen a quick reversal after a couple of amber “Go Fish” bars we are now seeing a pink “NoGo” bar.
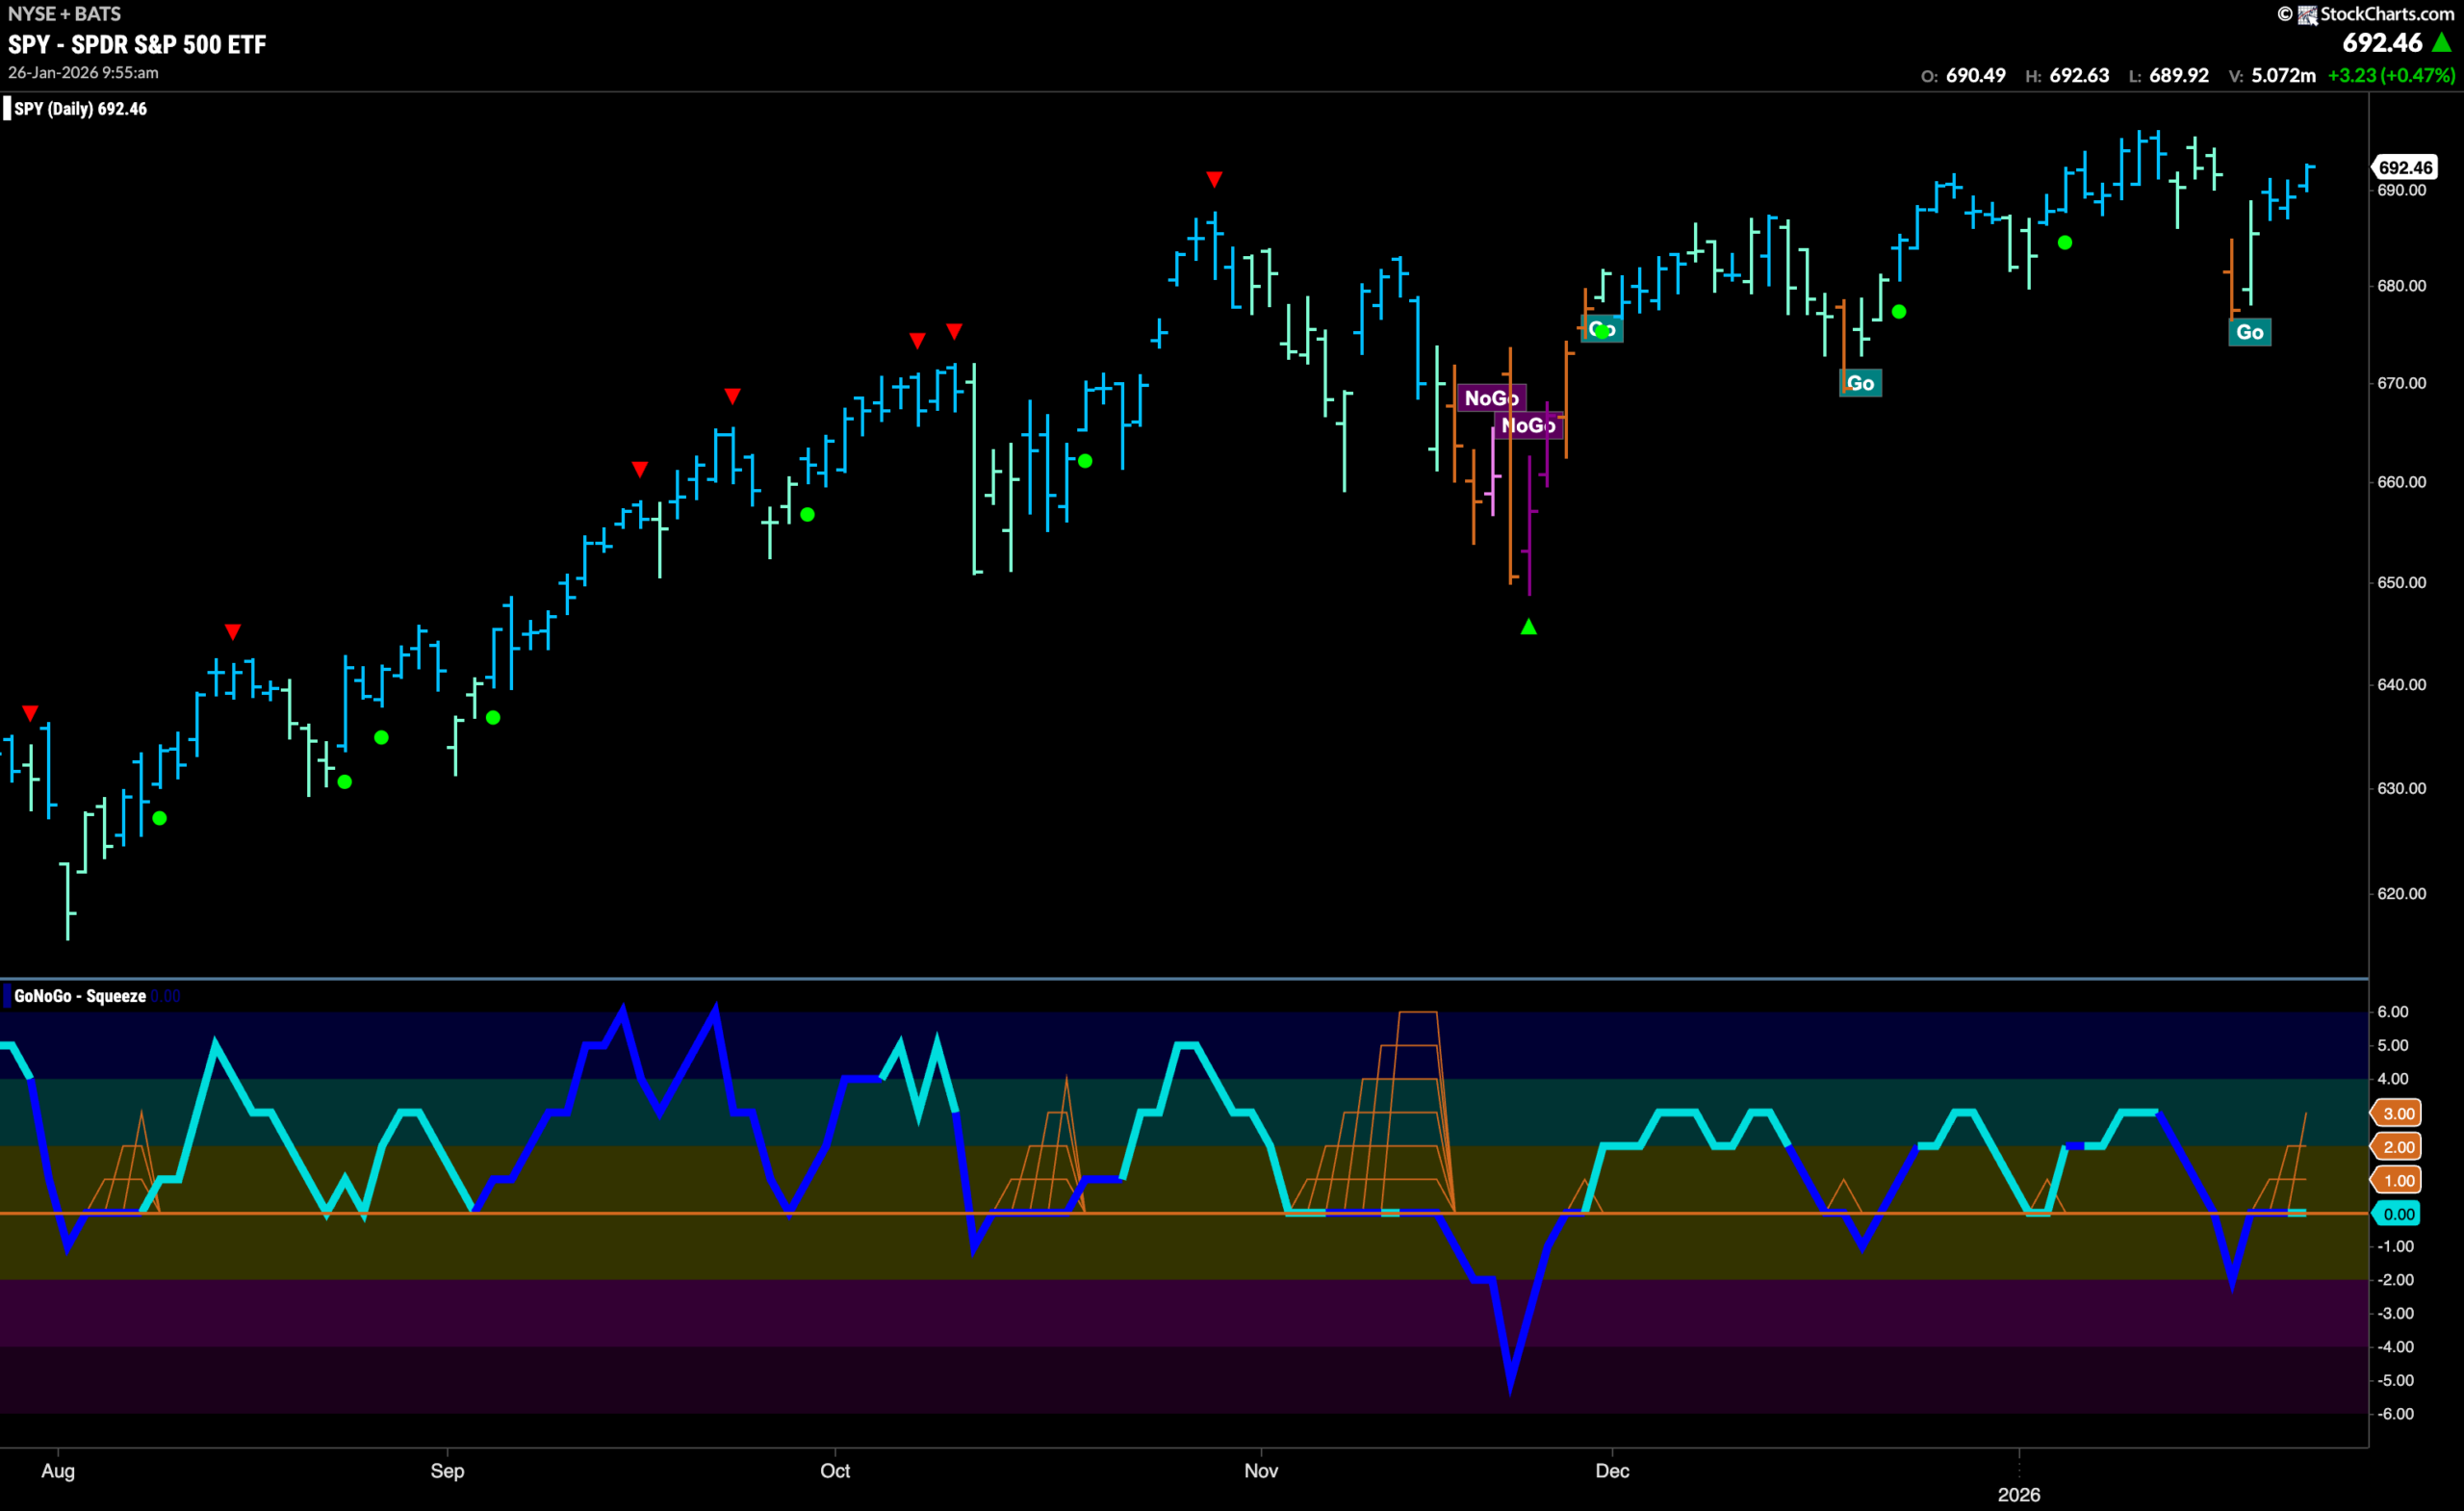
$SPY Recovered after “Go Fish” Bar
The GoNoGo chart below shows that the “Go” was able to rebound after a gap lower on an amber “Go Fish” bar. We saw a strong rally following that session and now we see GoNoGo Trend painting consecutive blue “Go” bars. GoNoGo Oscillator is riding the zero line and we see the beginnings of a GoNoGo Squeeze. We will watch to see if the oscillator can regain positive territory. If so, we would know that momentum was in line with the trend.
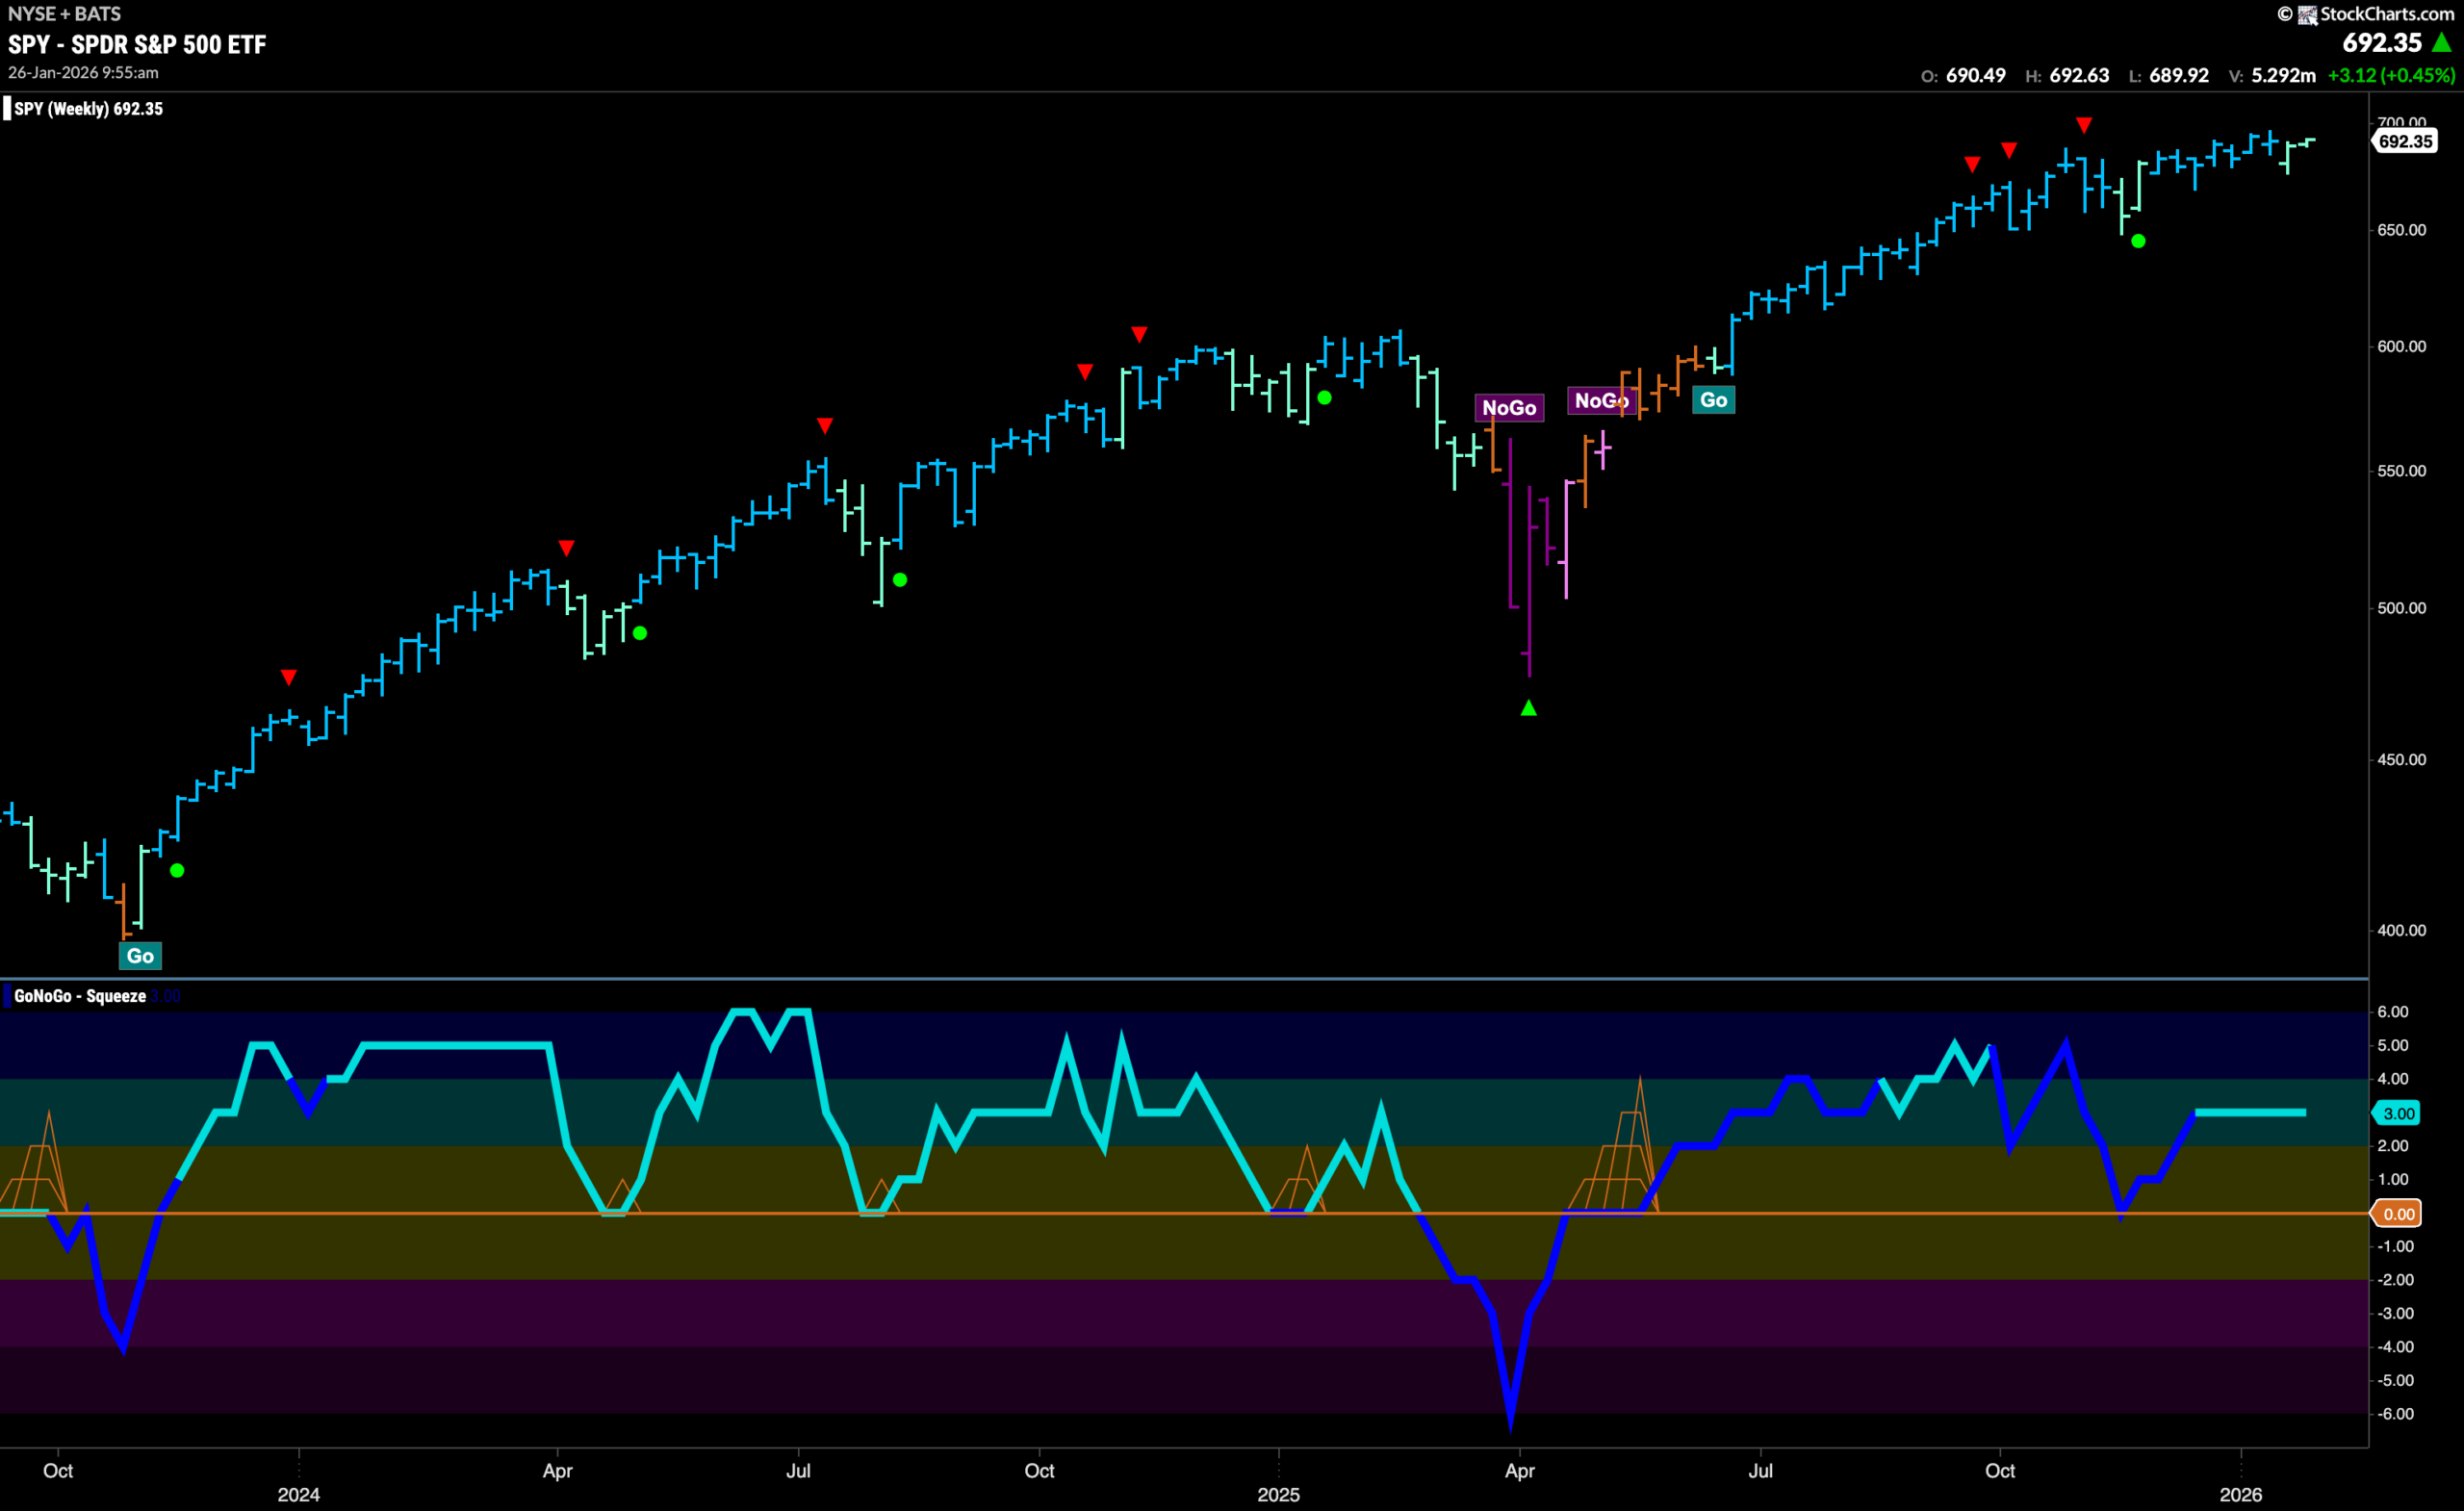
The weekly chart shows that on the longer time frame the trend has weakened. We see aqua bars now as price moves sideways having been unable to close higher for several weeks in a row. The trend remains in place but the GoNoGo Trend indicator is painting weakness. GoNoGo Oscillator remains flat at a level of 3 which confirms the “Go” trend in price. We will watch to see if the Oscillator finds support at zero should it need it in the coming weeks.
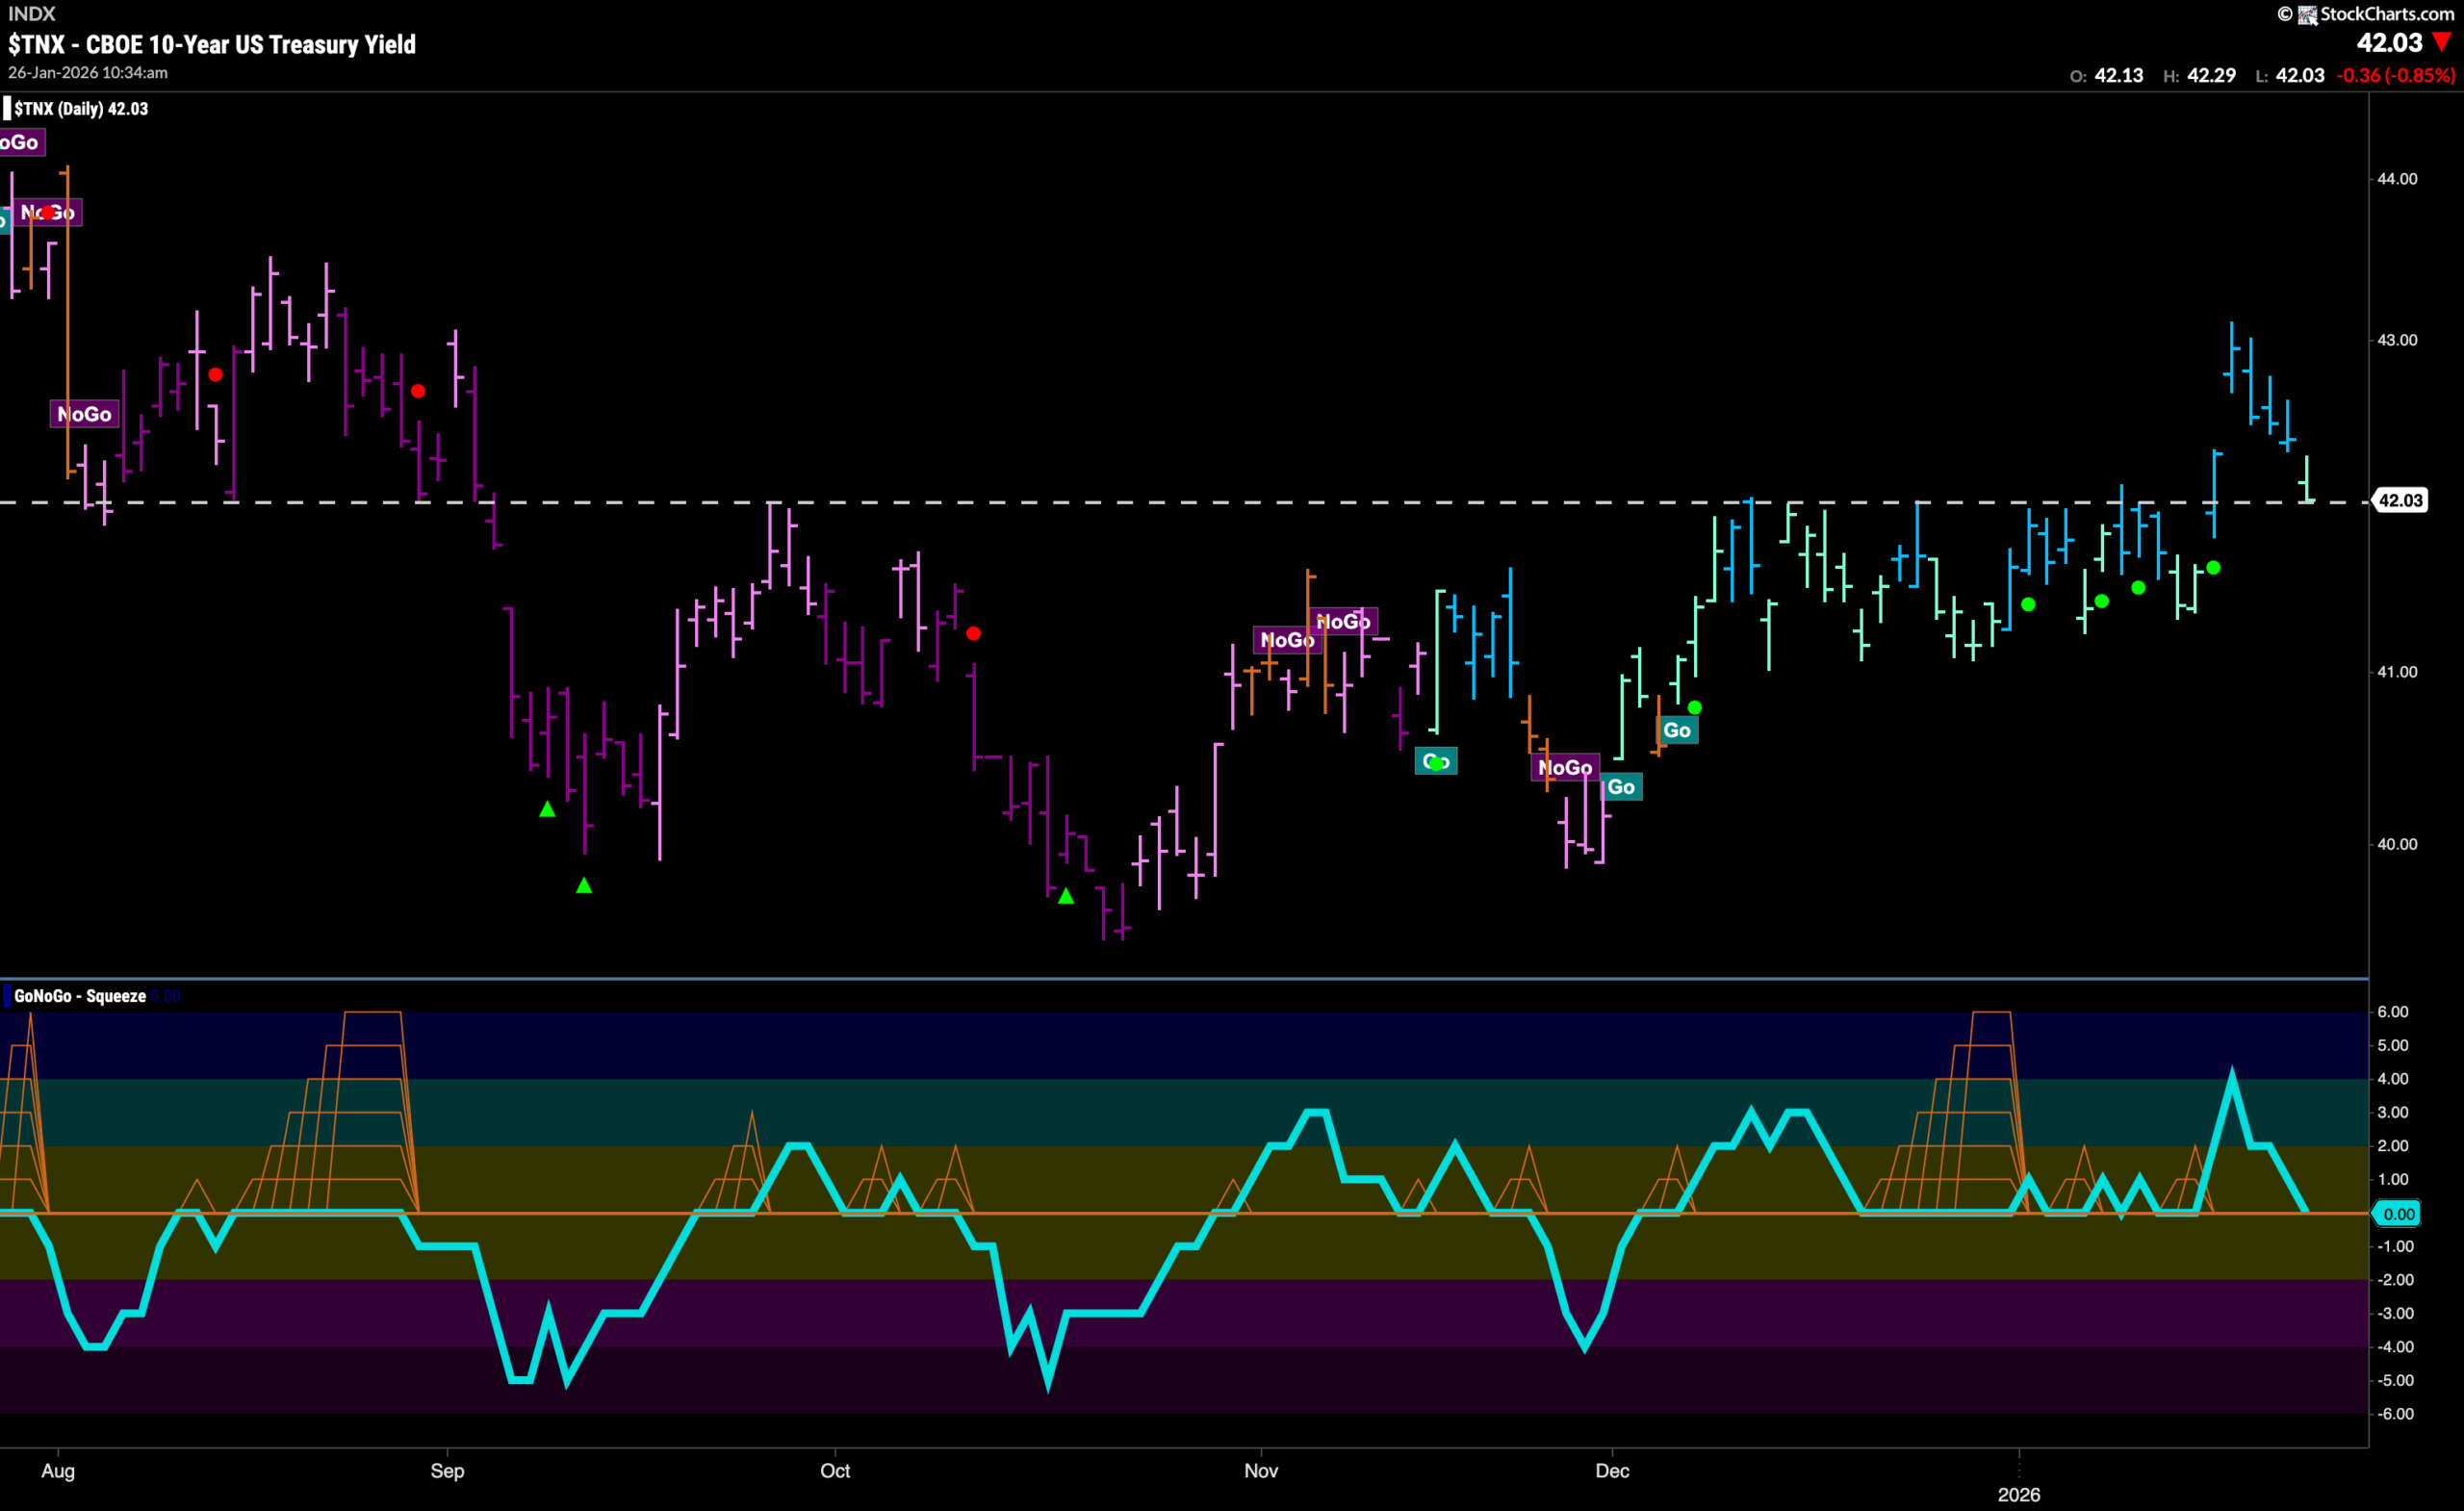
Treasury Rates Look For Support
GoNoGo Trend shows the trend remains in place but rates fall and we see a weaker aqua bar. We are now testing horizontal support that comes from prior highs. We can see that this level has proven significant for some time and so we will watch closely to see if support is found here. GoNoGo Oscillator is testing the zero line from above and if this level holds as well then that will likely propel rates higher. If these levels are broken to the downside we could see rates fall from here.
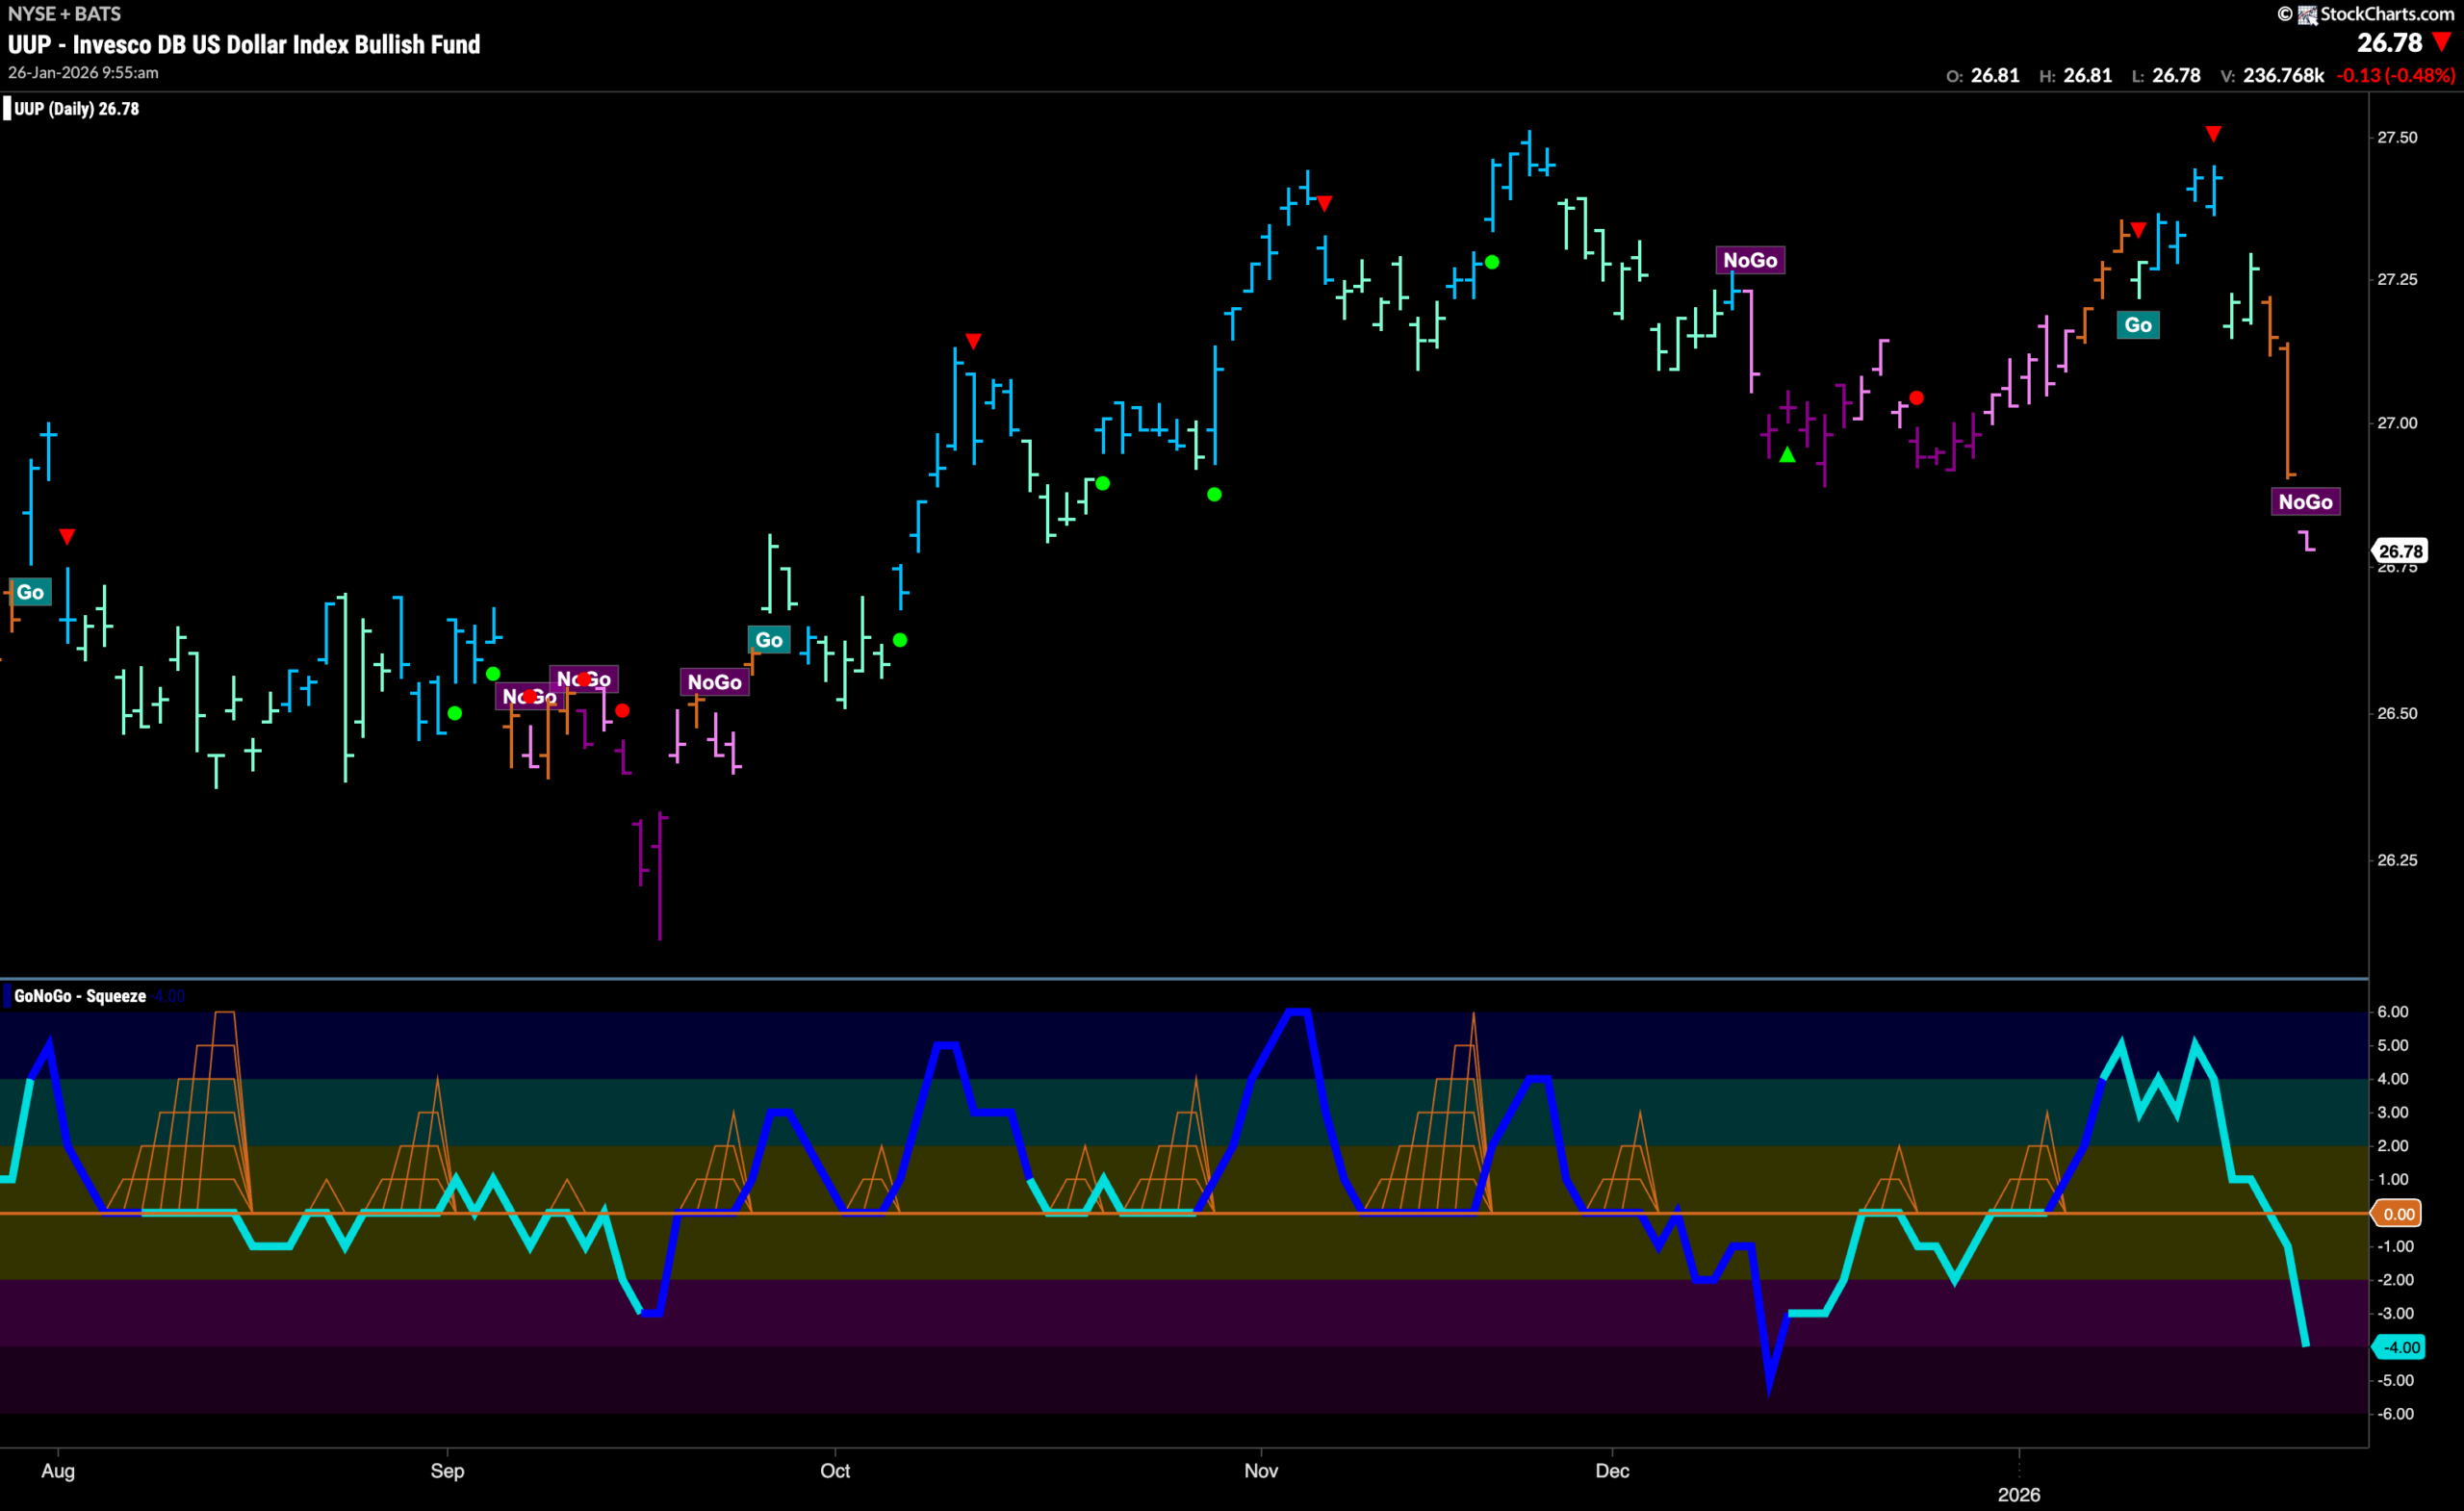
Dollar Fails Hard at Resistance
As suggested last week, the dollar approached significant resistance from prior highs. We saw a Go Countertrend Correction Icon (red arrow) at that high suggesting price may struggle to go higher in the short term and indeed we saw a fast fall. As price fell through two amber “Go Fish” bars we now see a new pink “NoGo” bar at new lows suggesting the trend has well and truly changed. GoNoGo Oscillator has crashed through the zero line and is fast approaching oversold territory at a value of -4.
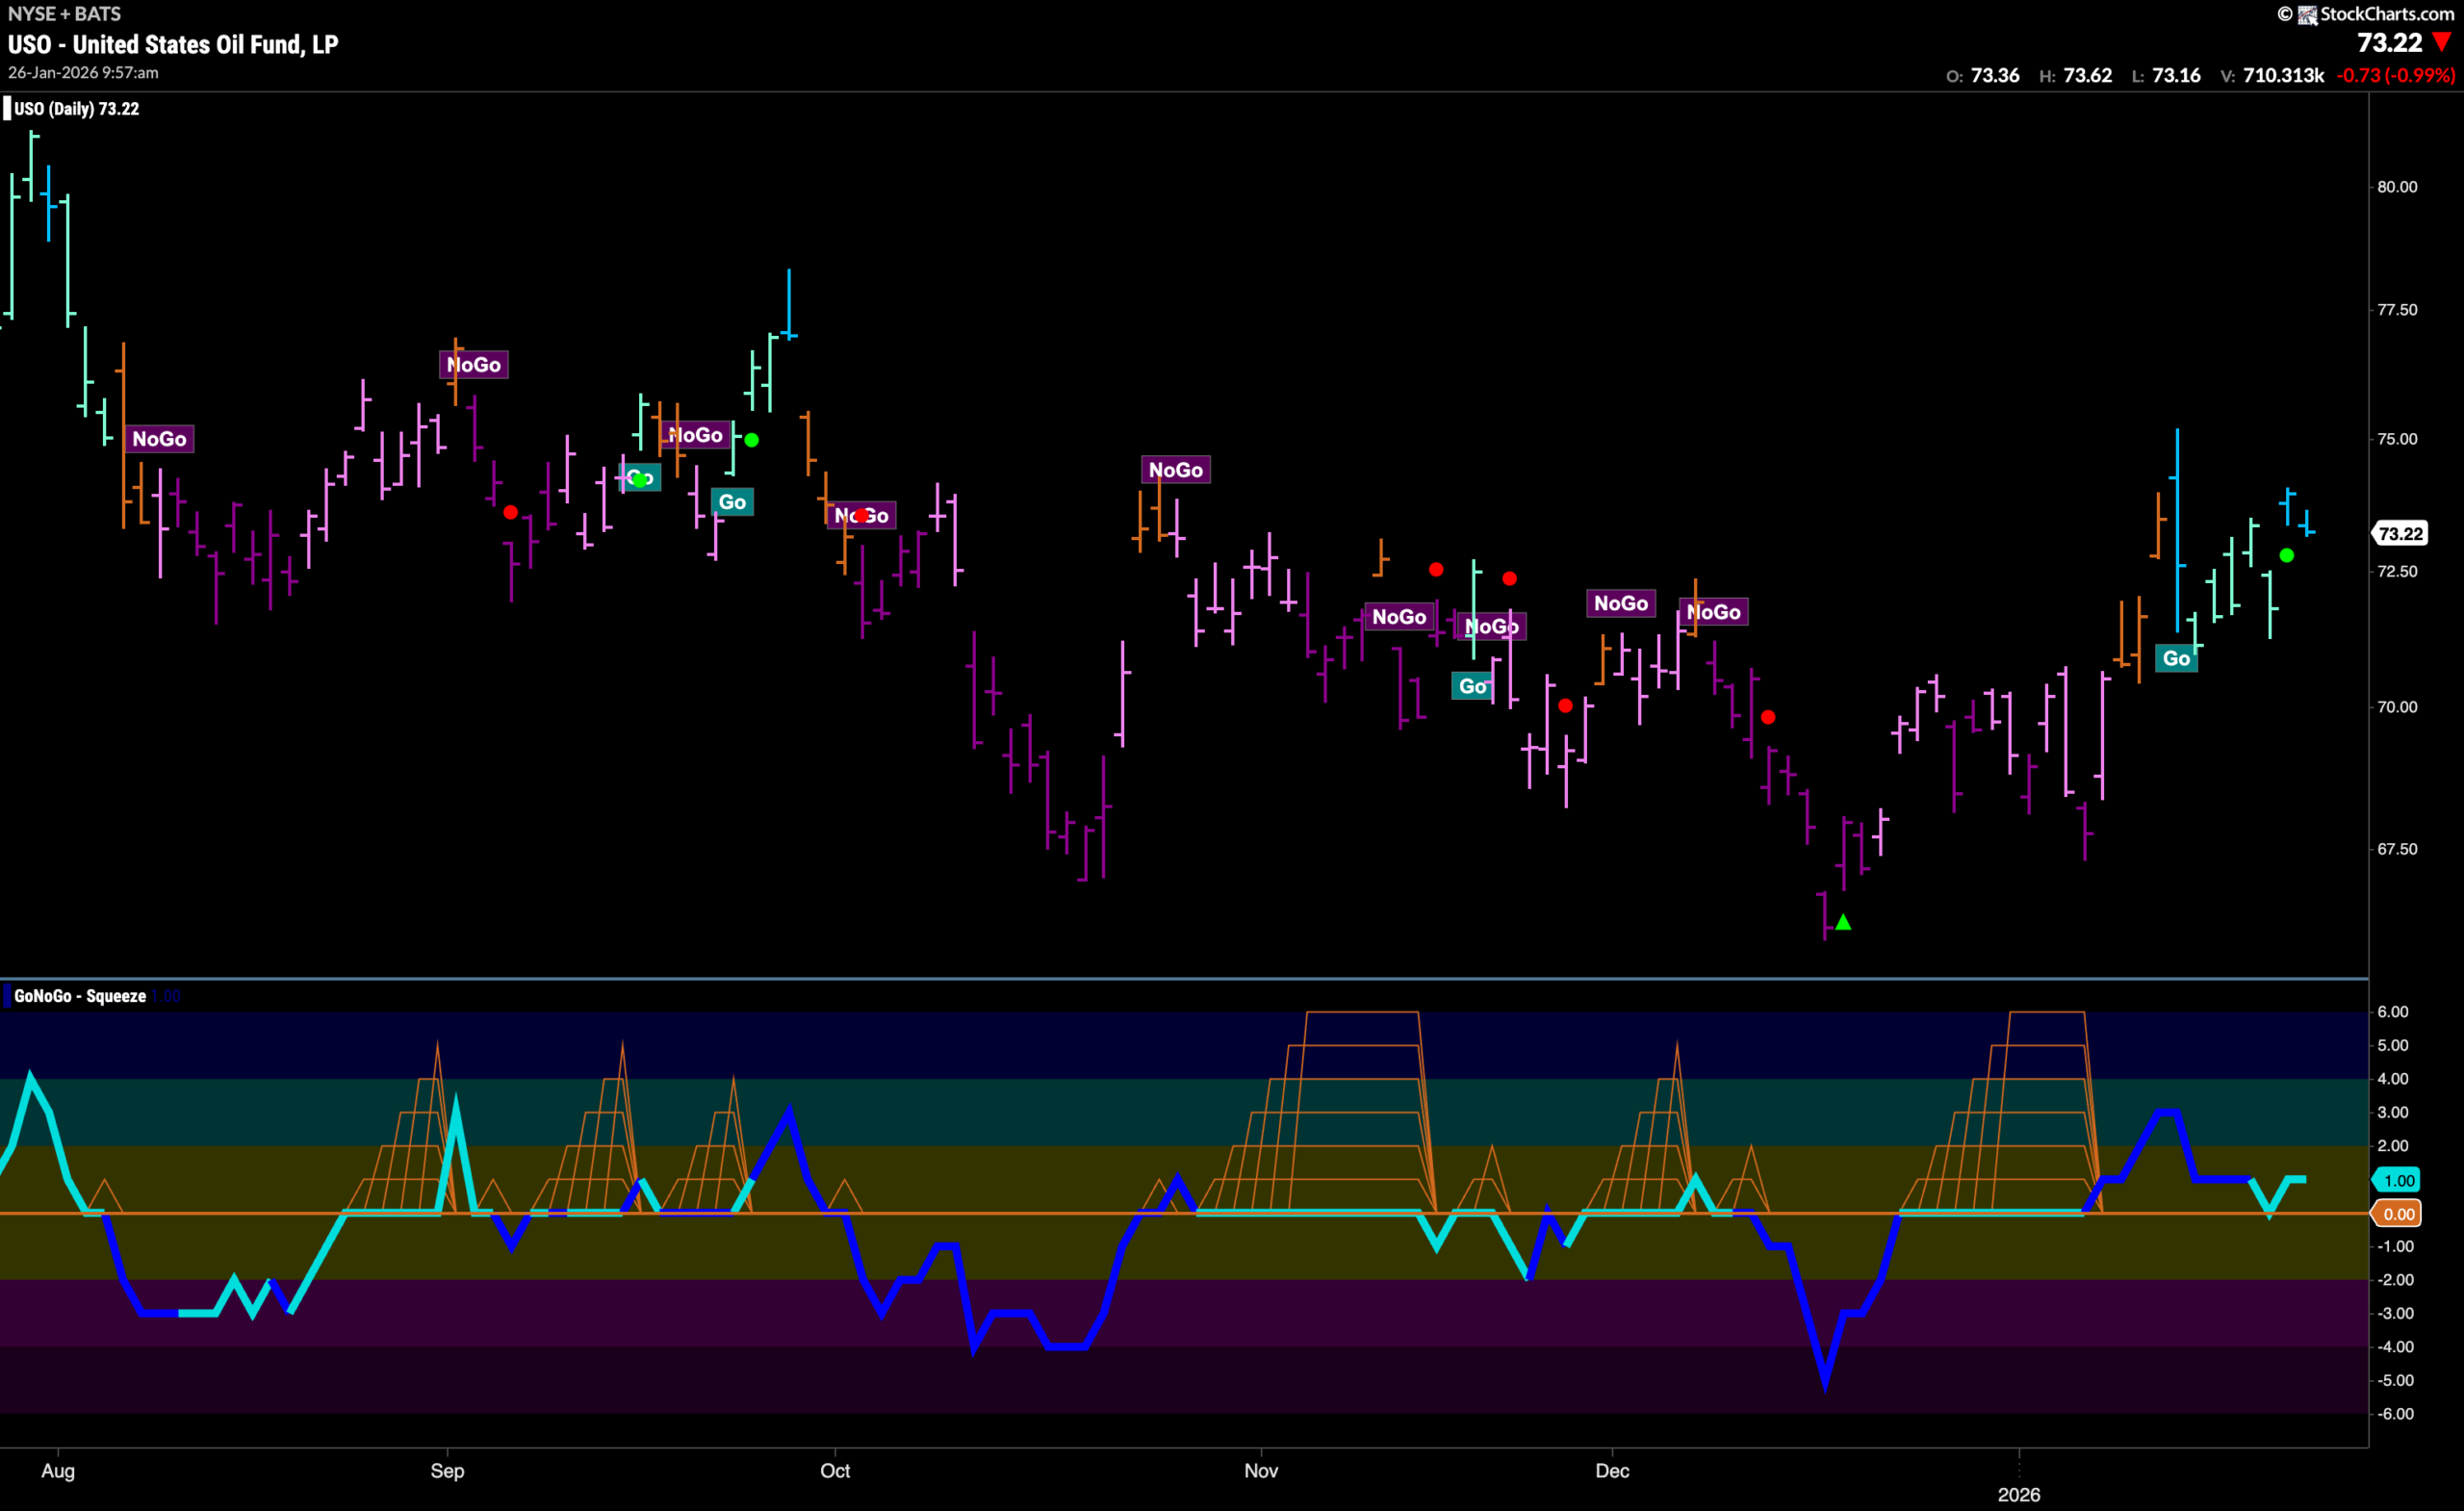
Oil Remains in “Go” Trend
GoNoGo Trend shows that the “Go” trend was able to survive and we see new bright blue “Go” bars as price rallies late last week. GoNoGo Oscillator tested the zero line and was able to find support bouncing back into positive territory at a value of 1. If momentum remains resurgent in the direction of the “Go” Trend and climbs further into positive territory we will look for price to make an attempt a new higher in the coming days.
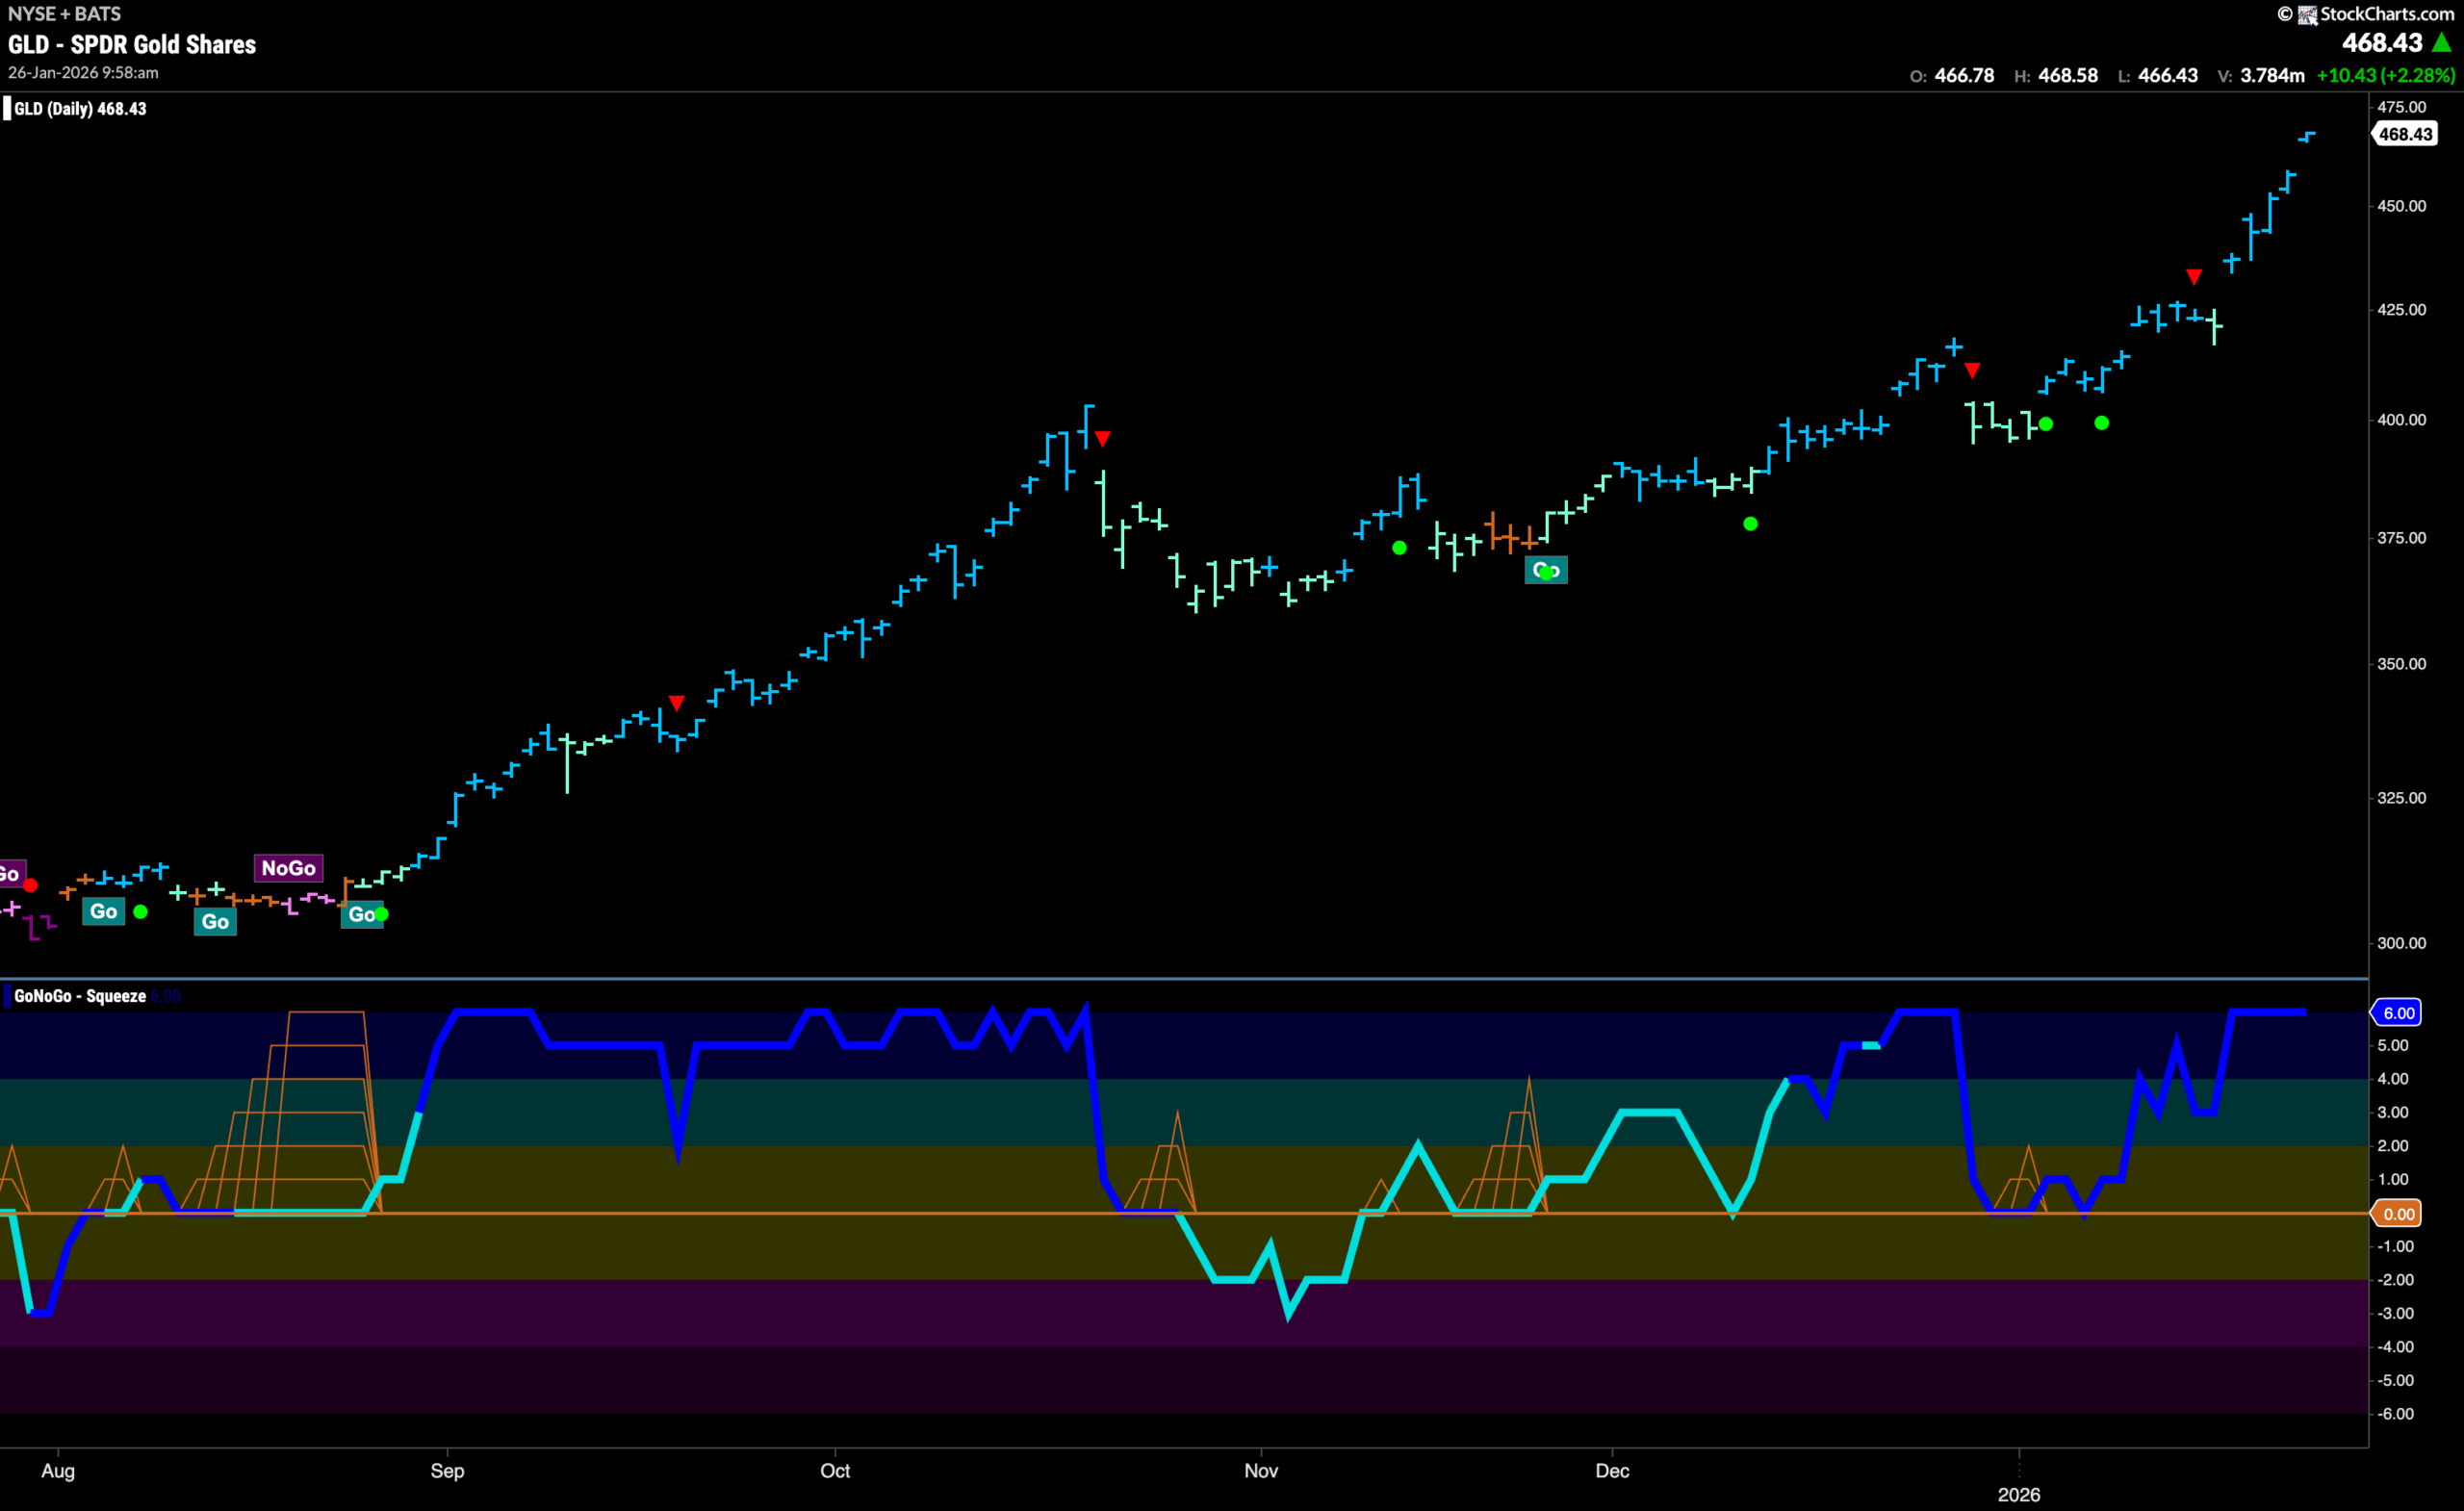
Gold Closes Higher Every Day
The trend in Gold shows no signs of slowing down and raced higher again this week with a new higher close every single day on strong blue “Go” bars. GoNoGo Oscillator raced into overbought territory and now has remained at extremes for several bars on heavy volume at a value 6. We will watch to see how much higher gold can climb before there is any hint of slowing momentum which could give the “Go” trend a pause, and bulls the chance to catch their breath.
Sector RelMap
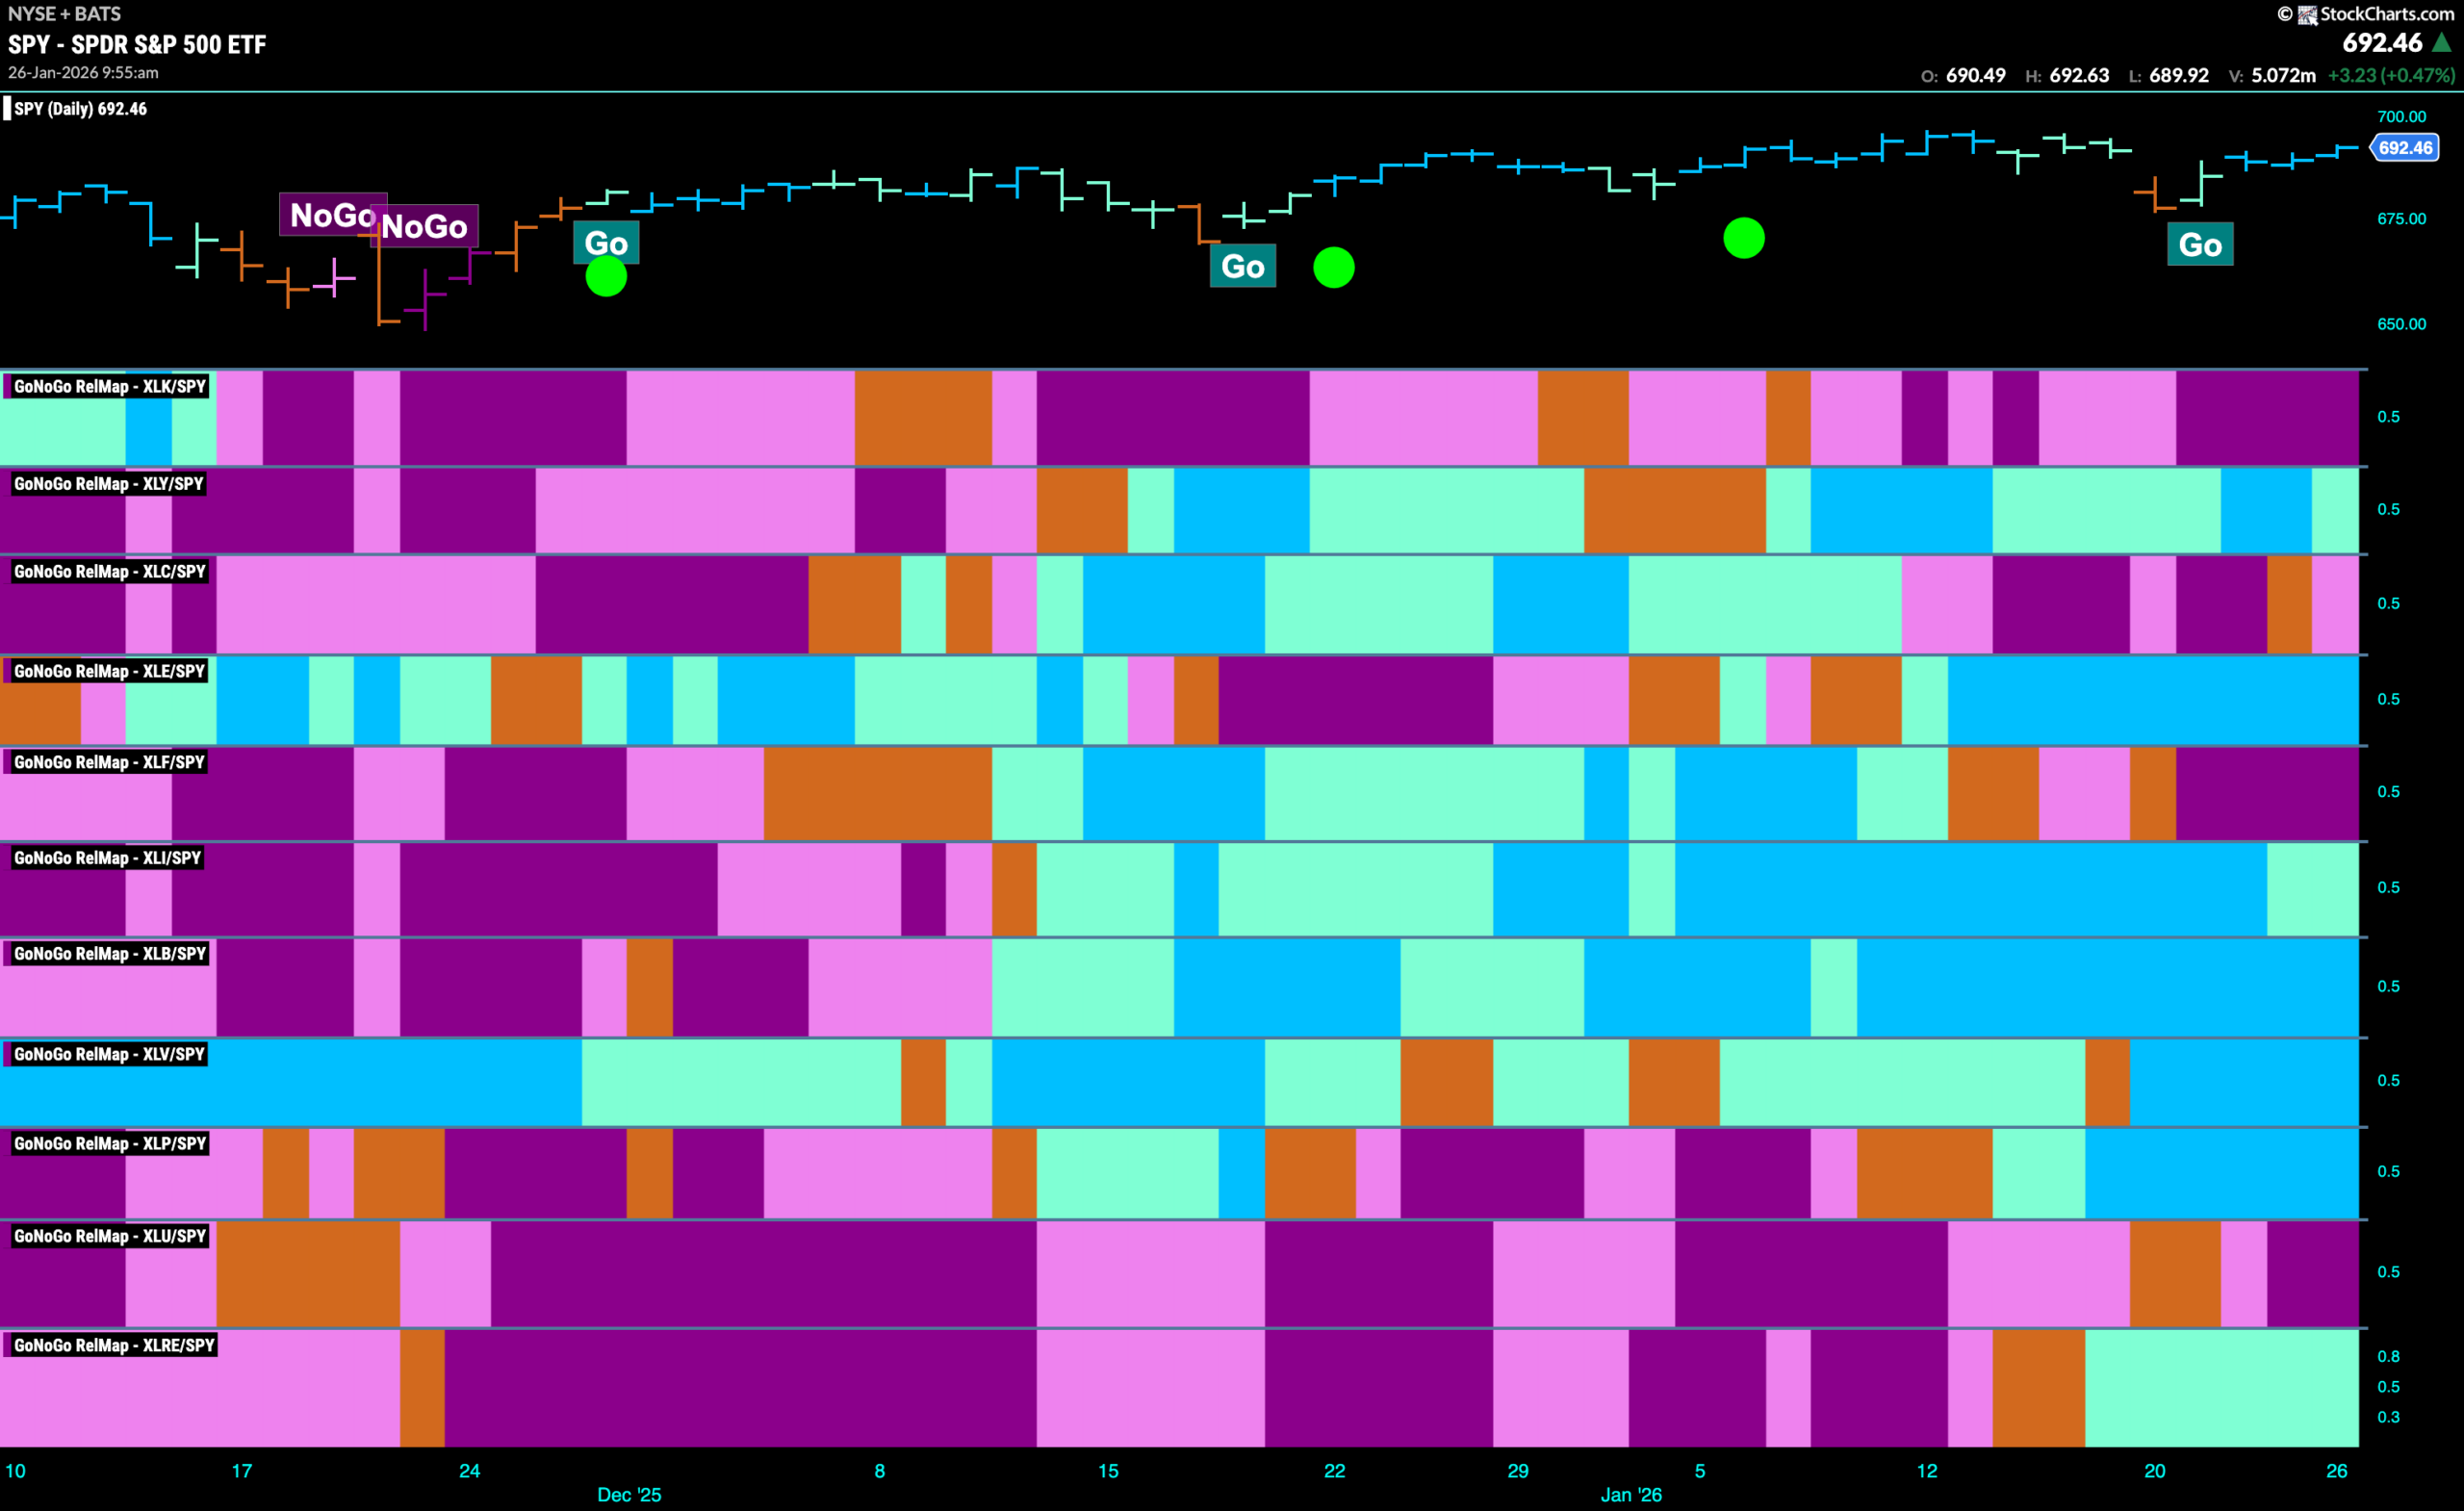
Below is the GoNoGo Sector RelMap. This GoNoGo RelMap applies the GoNoGo Trend to the relative strength ratios of the sectors to the base index. With this view we can get a sense of the relative out performance and relative underperformance of the sectors. 7 sectors are in relative “Go” trends. $XLY, $XLE, $XLI, $XLB, $XLV, $XLP, and $XLRE are painting relative “Go” bars.
Staples Sub-Group RelMap
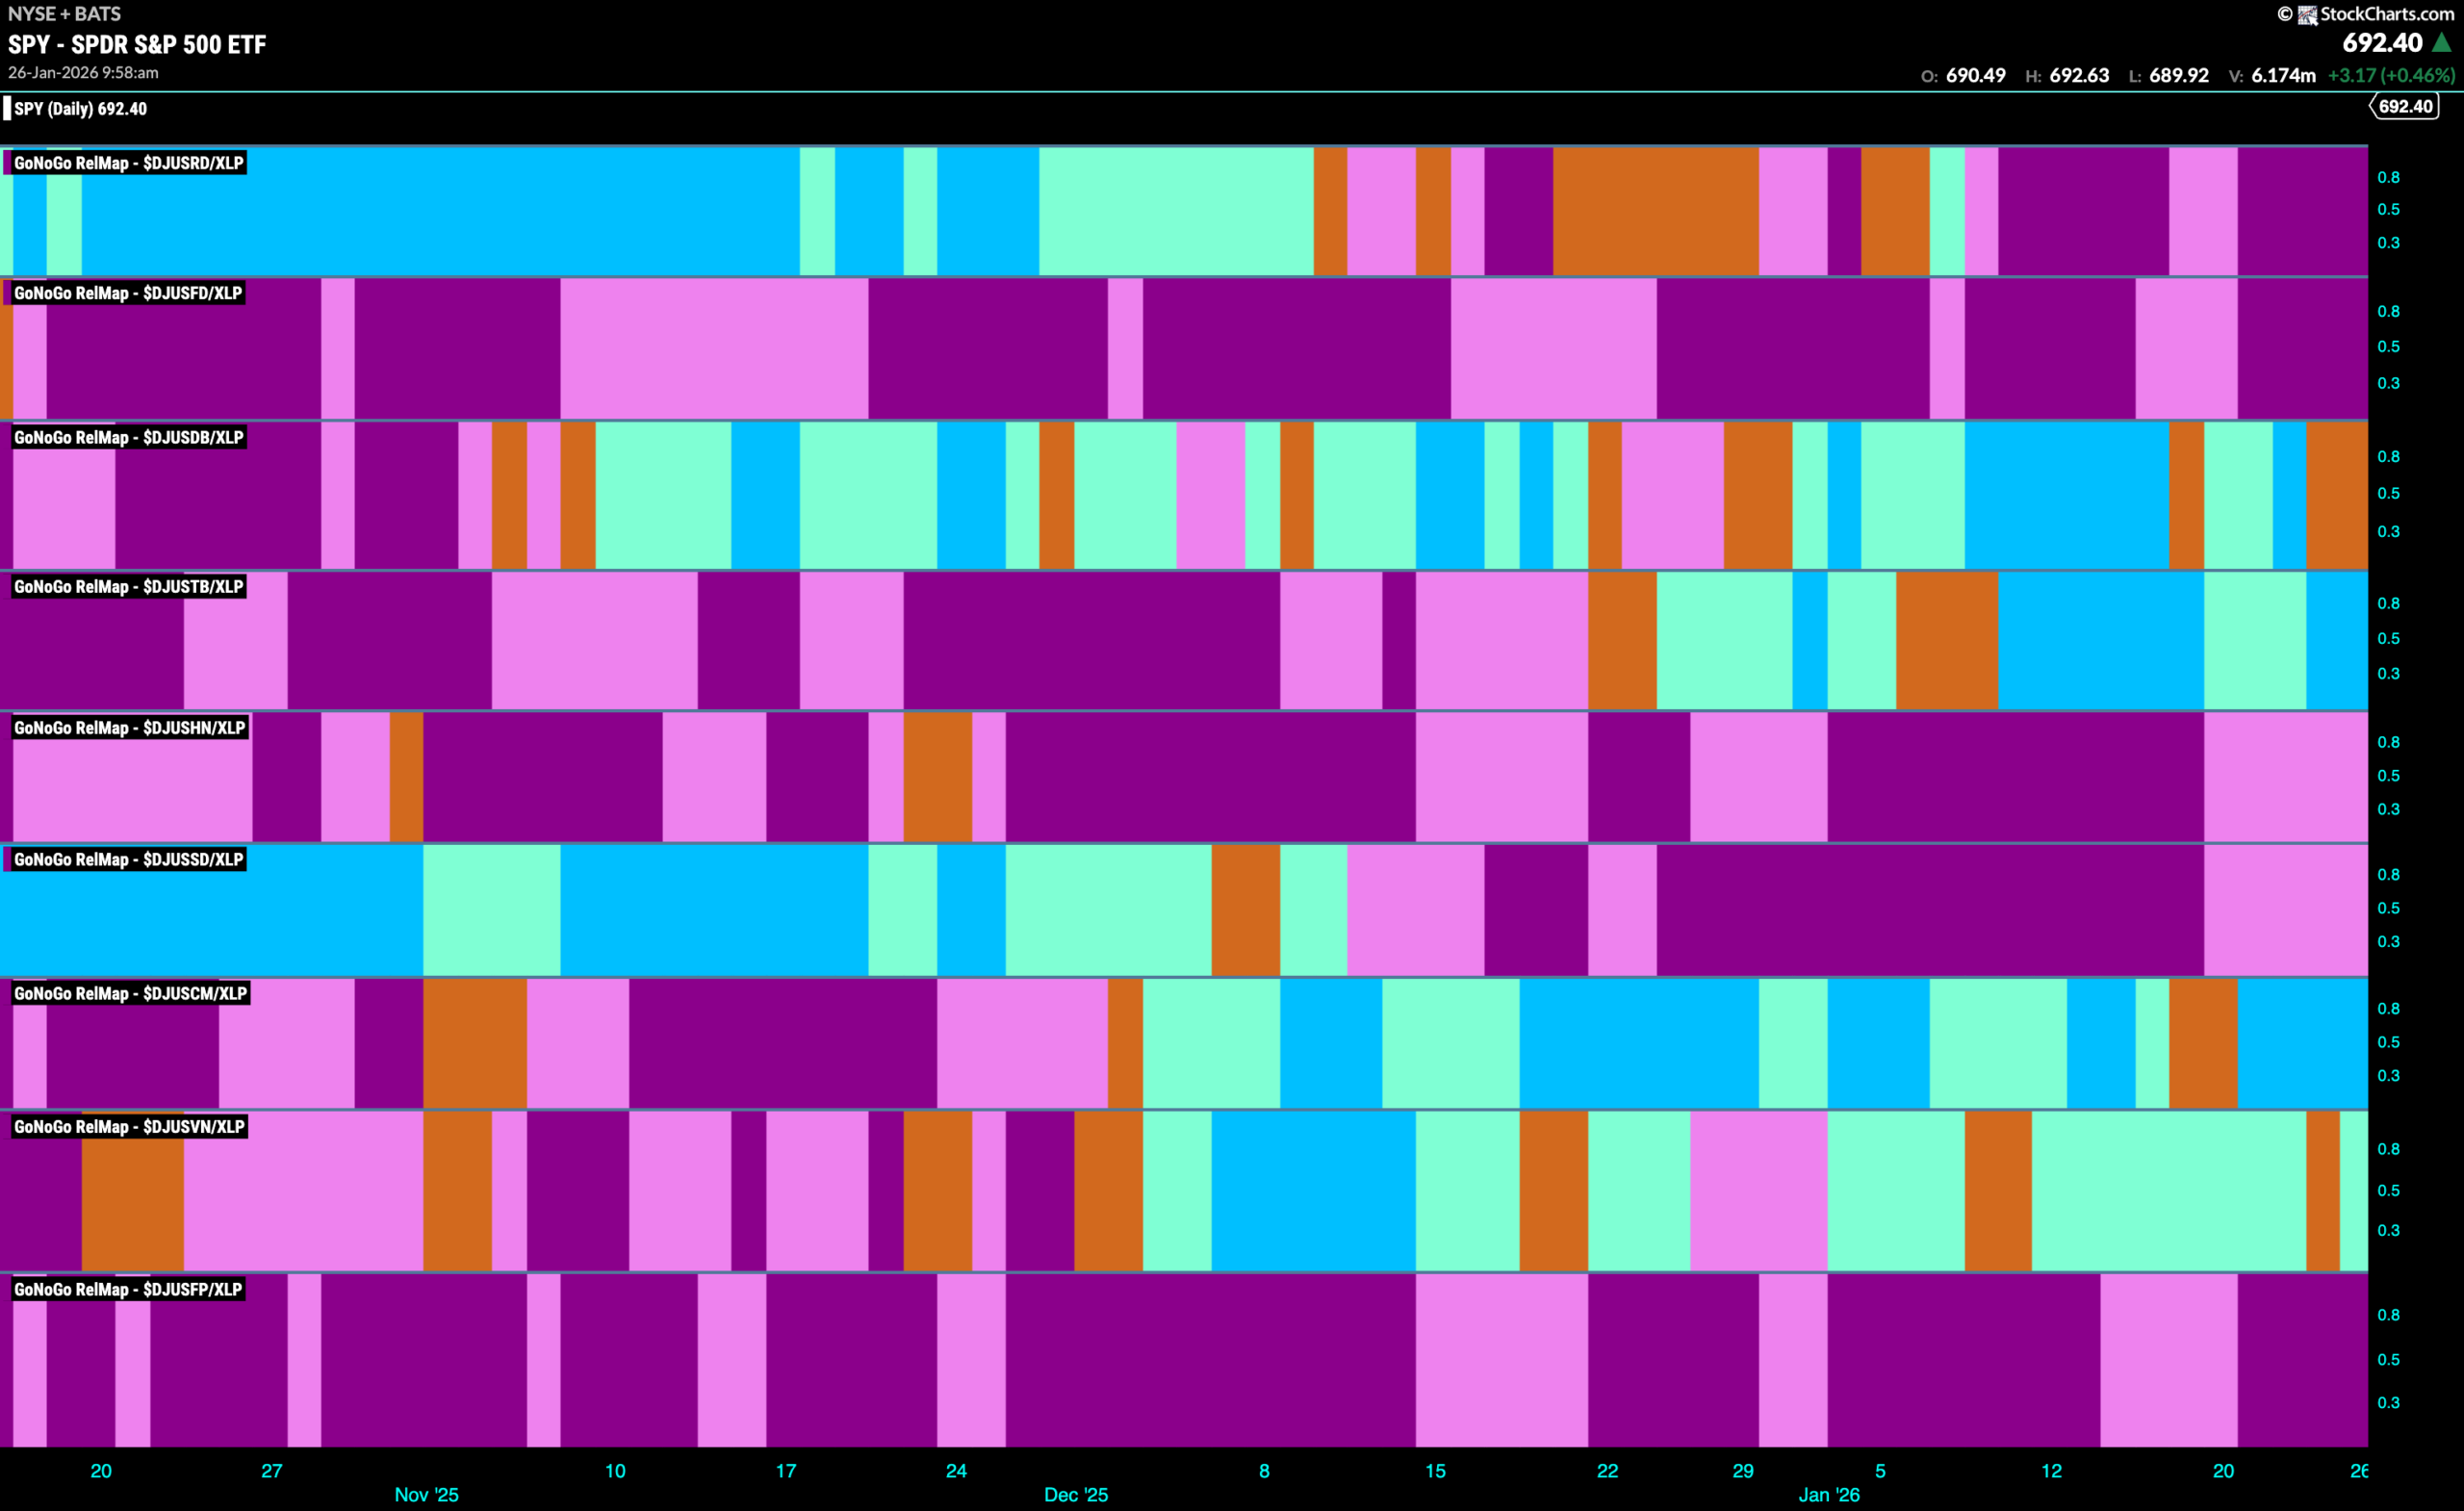
The chart below shows a relative trend breakdown of the sub groups within the consumer staples sector this week. The Sub-Group RelMap plots the GoNoGo Trend of each sub index to the $XLP. We saw in the above GoNoGo Sector RelMap that $XLP is an out-performing sector and paints strong relative “Go” bars. When we look at the below RelMap we can see that the personal products index in the third lowest panel is painting strong blue “Go” bars on a relative basis.
$NUS Fights for Higher Highs
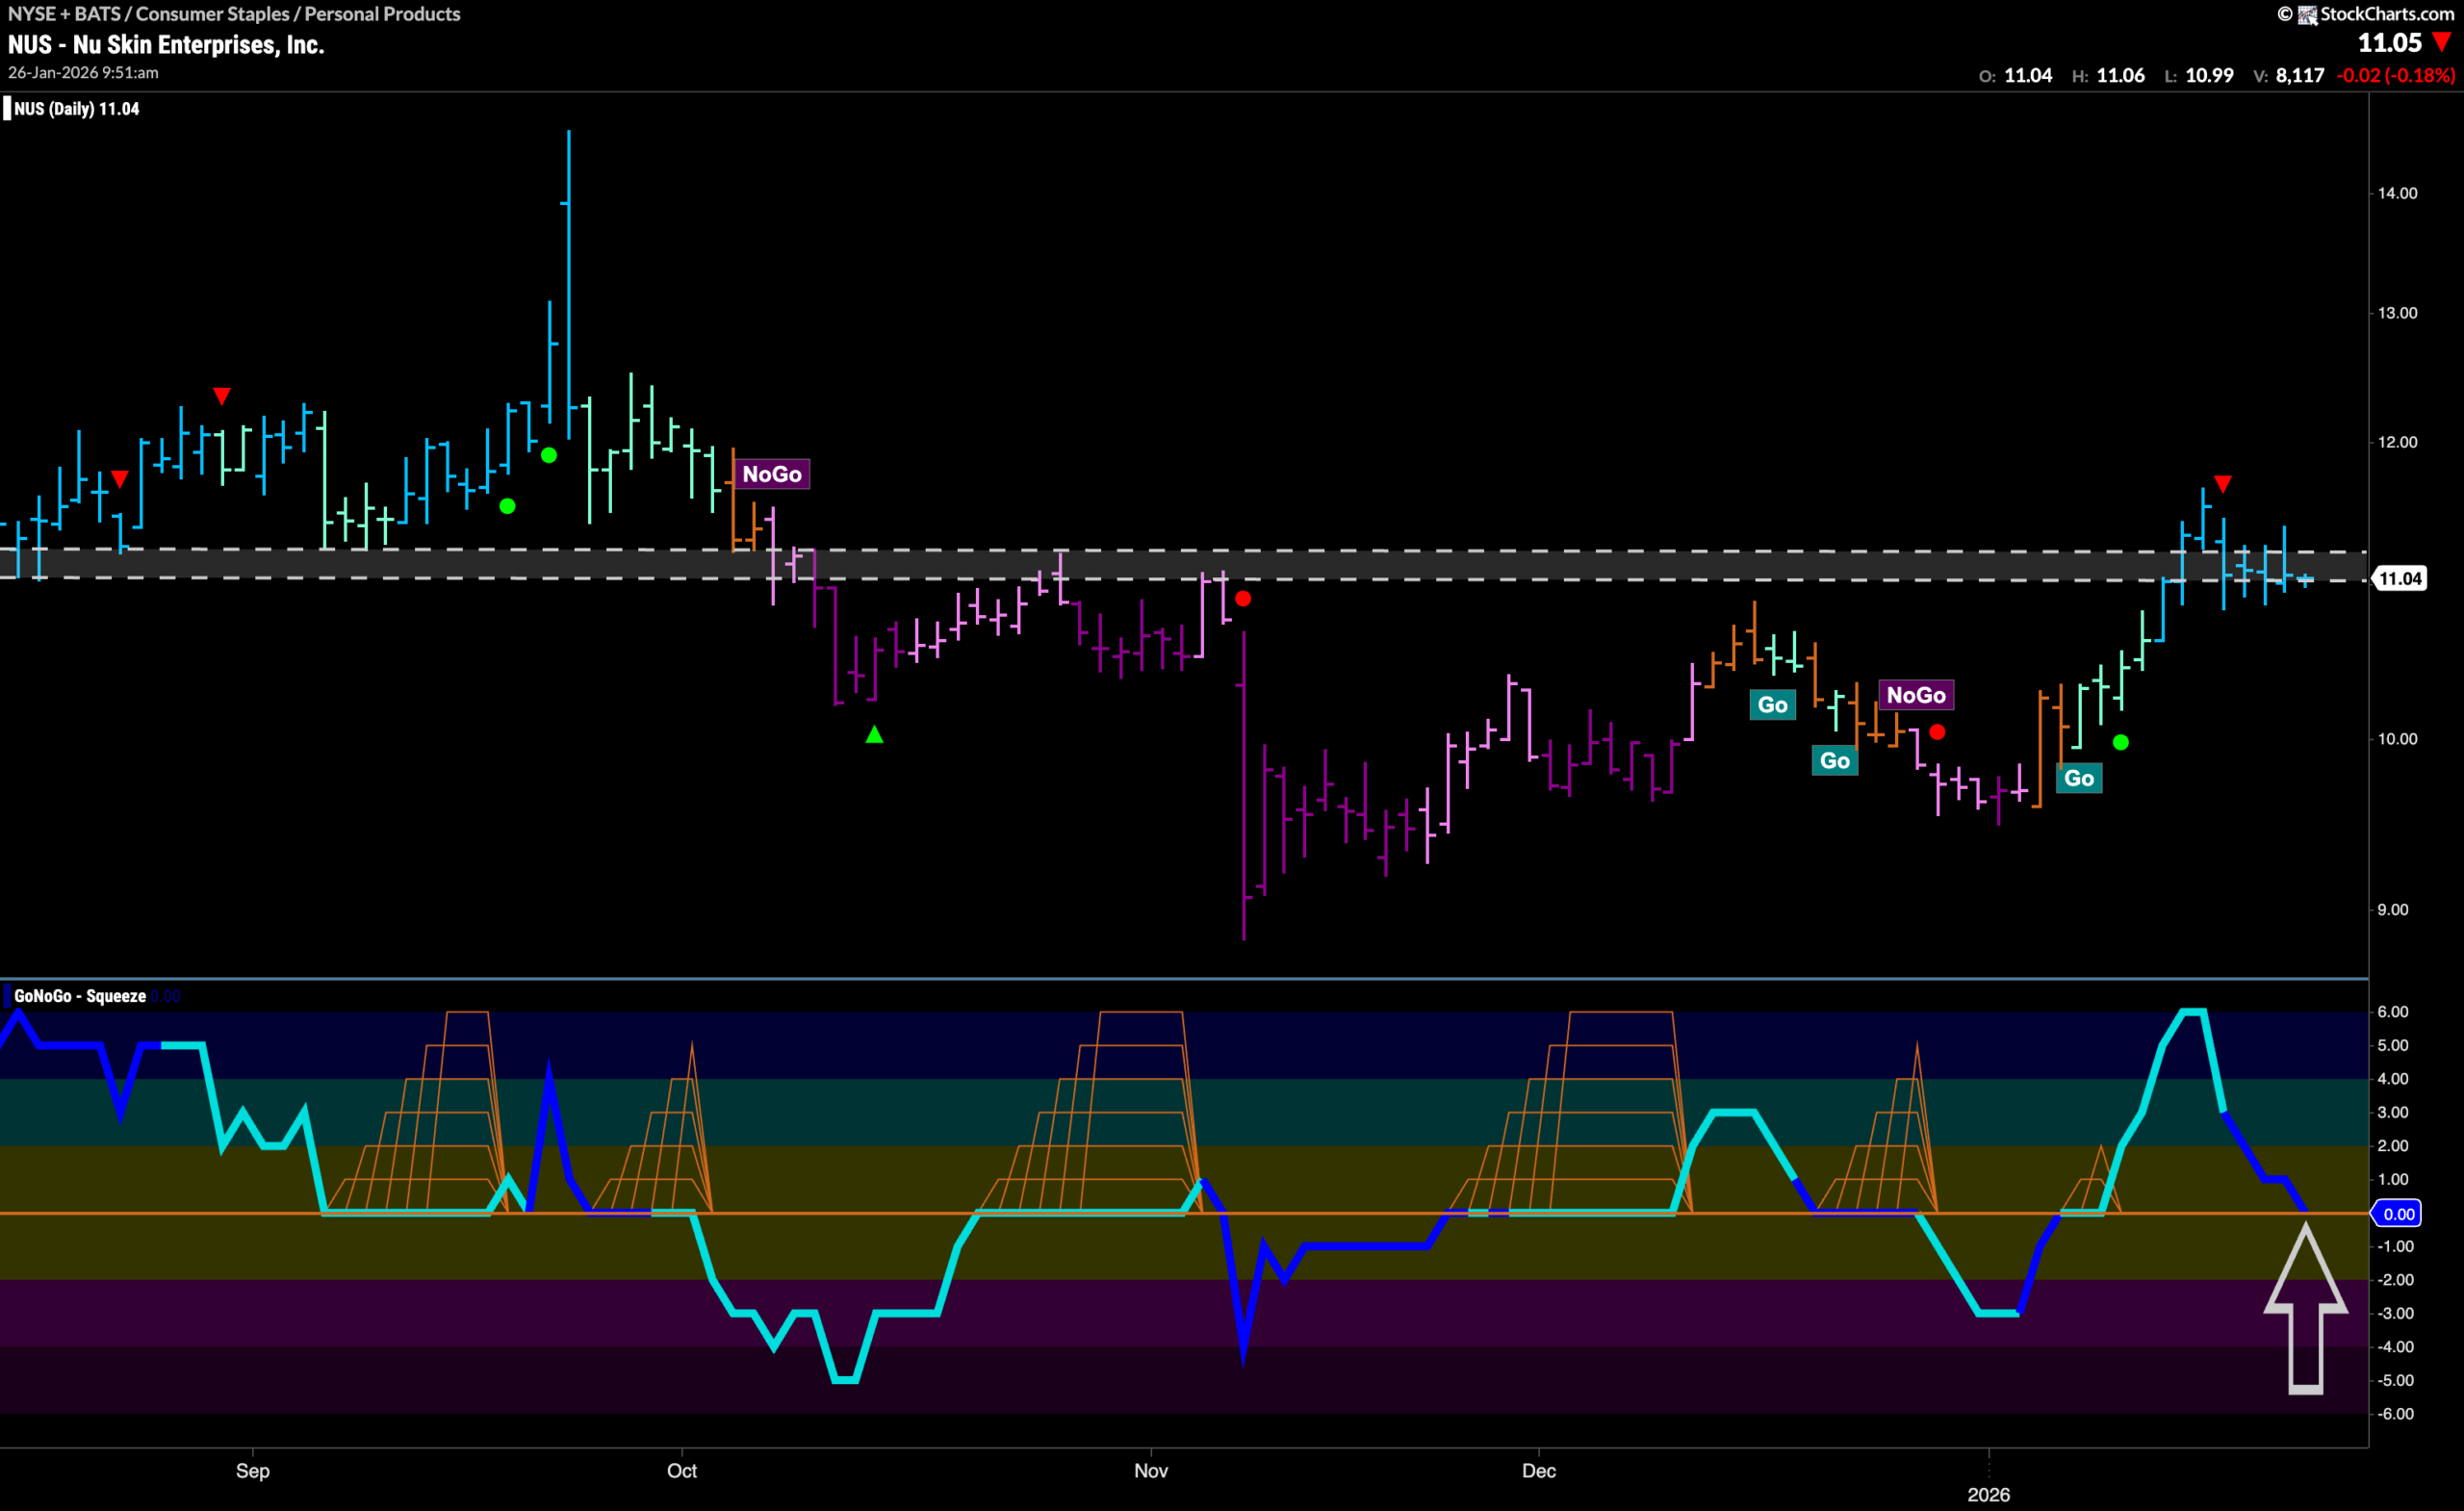
GoNoGo Trend shows that $NUS is fighting to consolidate new highs as it deals with congestion that has been evident for the length of the chart. We saw a Go Countertrend Correction Icon (red arrow) after price crept higher last week and since then we have seen price move slightly lower. GoNoGo Oscillator has fallen to test the zero line from above and volume is heavy. We will watch to see if the oscillator finds support here. If it does we will expect price to find its feet here before potentially climbing higher.
$EPC In New “Go” Trend
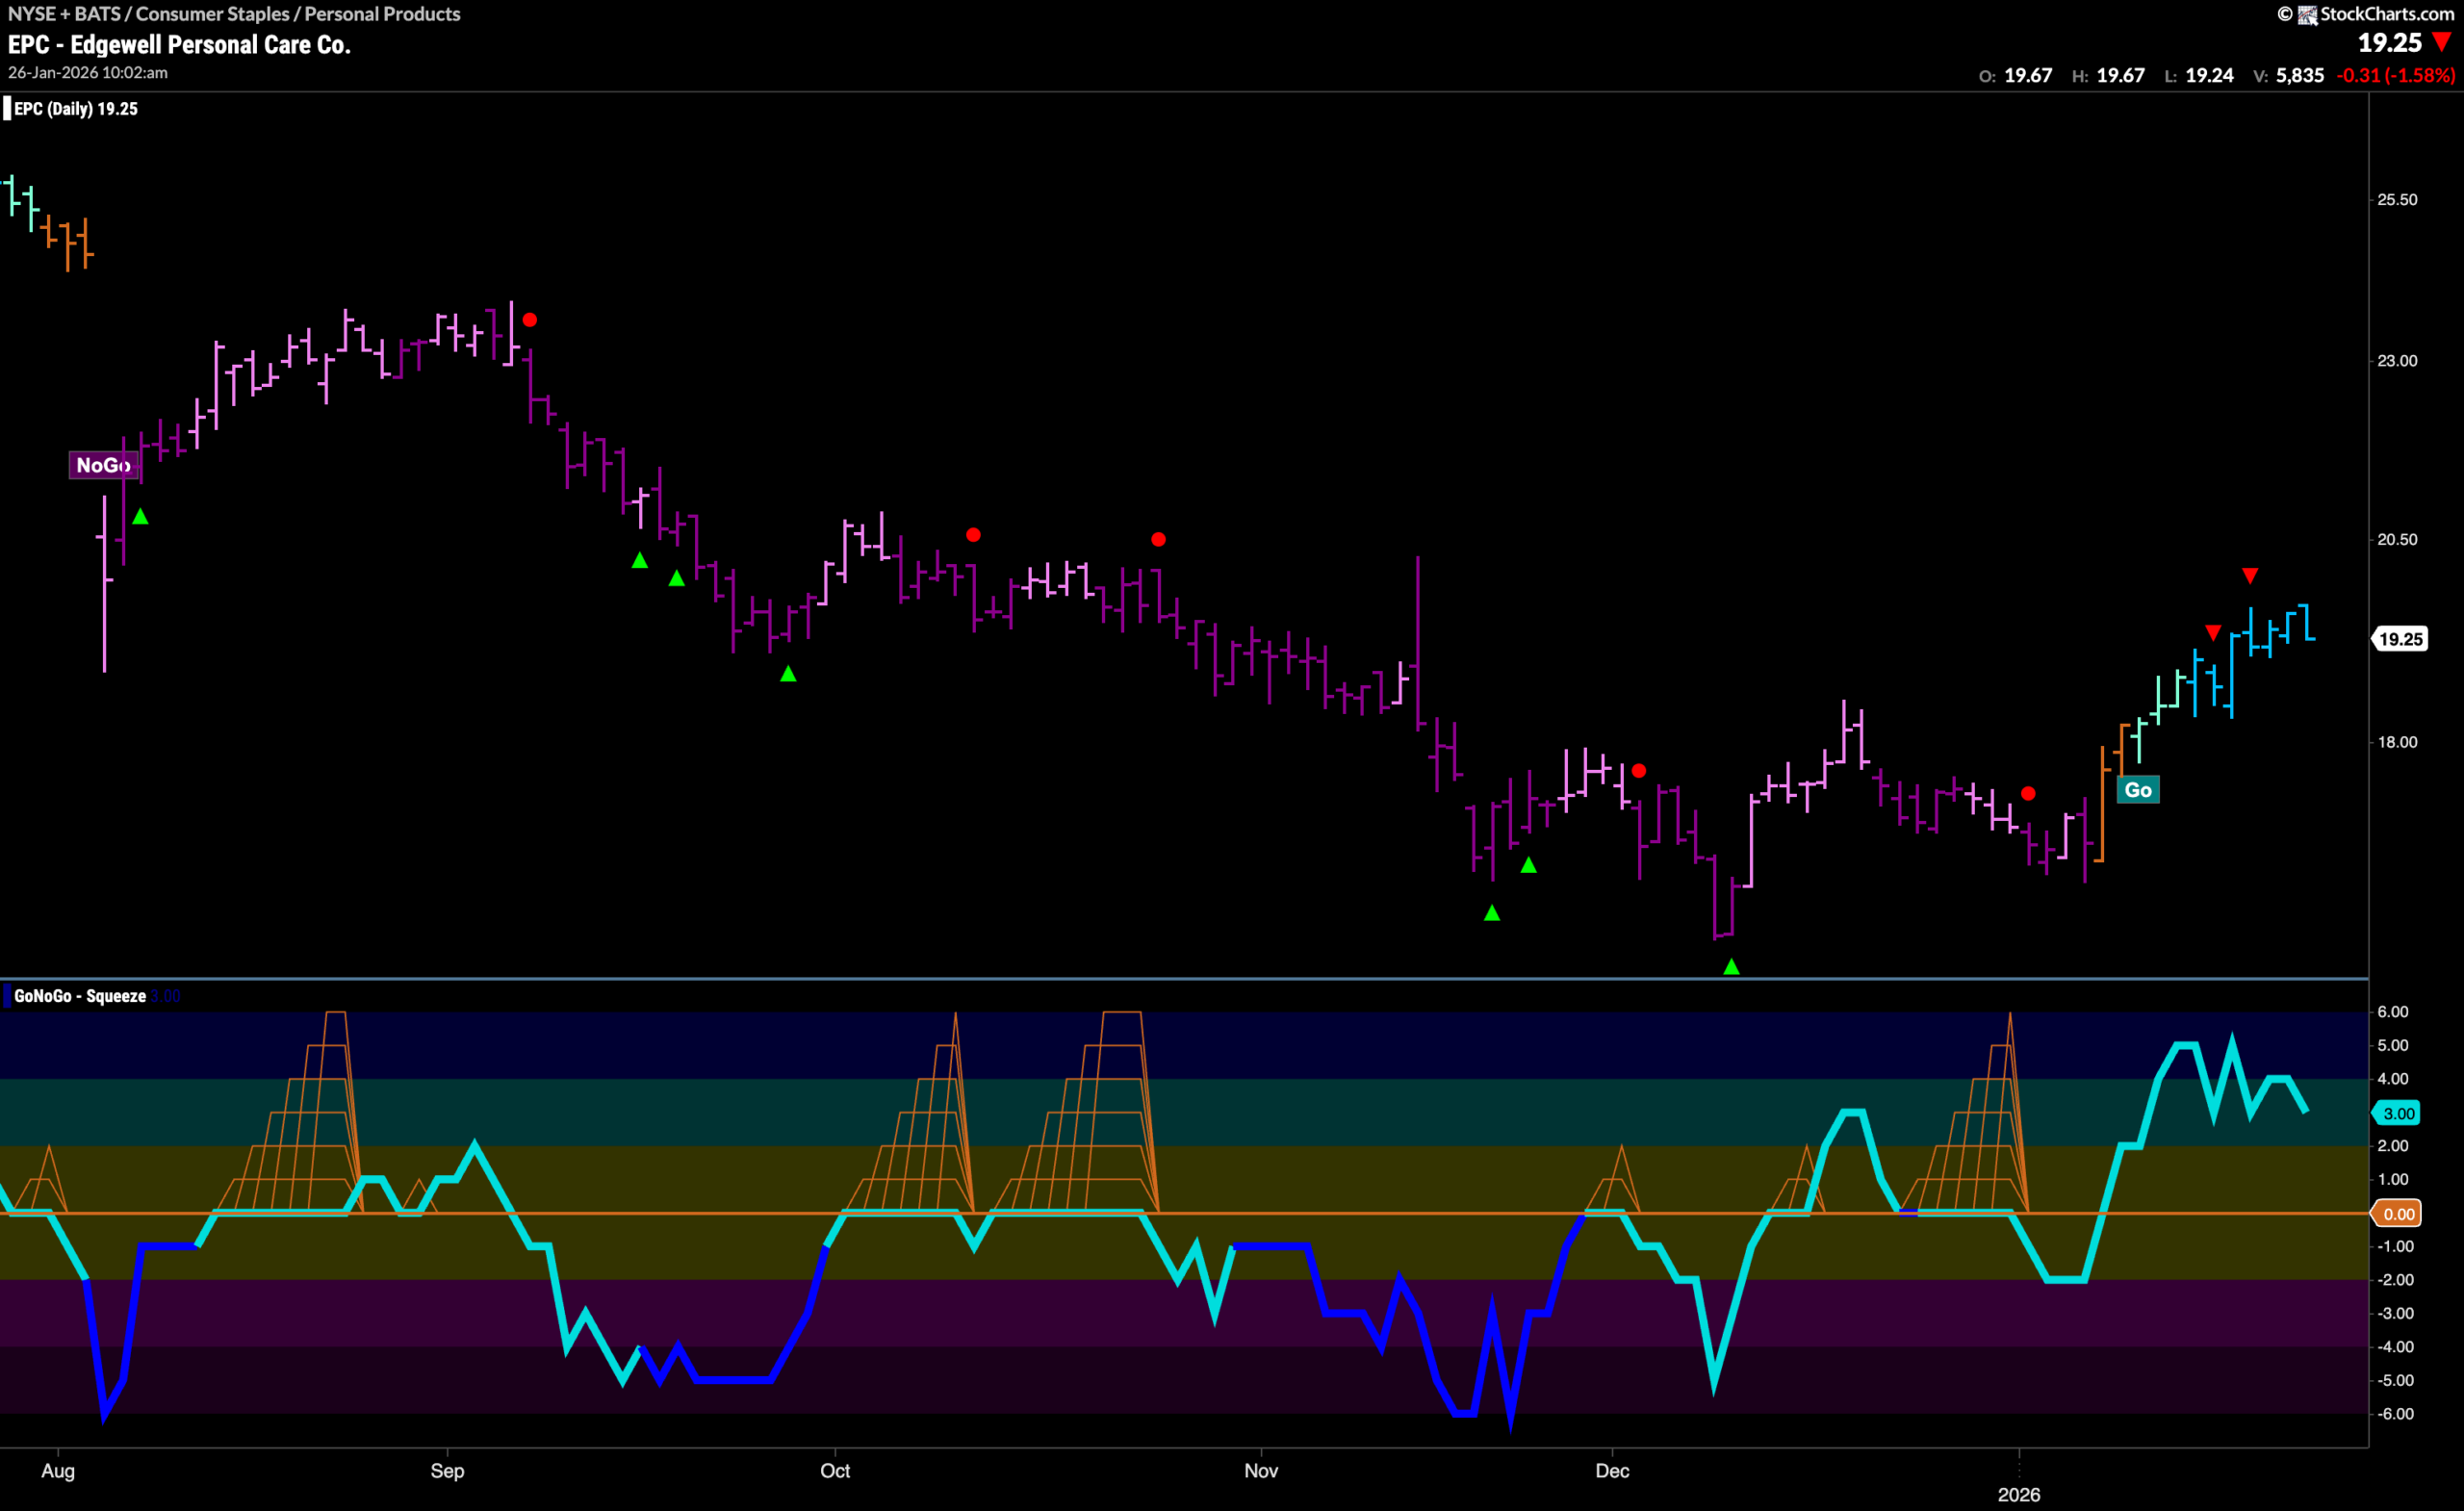
$EPC was in a “NoGo” trend for several months as price hit lower lows and lower highs. After the last lower low, GoNoGo Oscillator broke into positive territory and soon after price failed to make a lower low. With momentum surging into positive territory we saw GoNoGo Trend paint a couple of amber Go Fish bars as the market deliberated the next direction. Now, we see new highs and GoNoGo Trend painting strong blue bars with GoNoGo Oscillator in positive territory but no longer overbought. We will see if this gives price room to run higher this week.