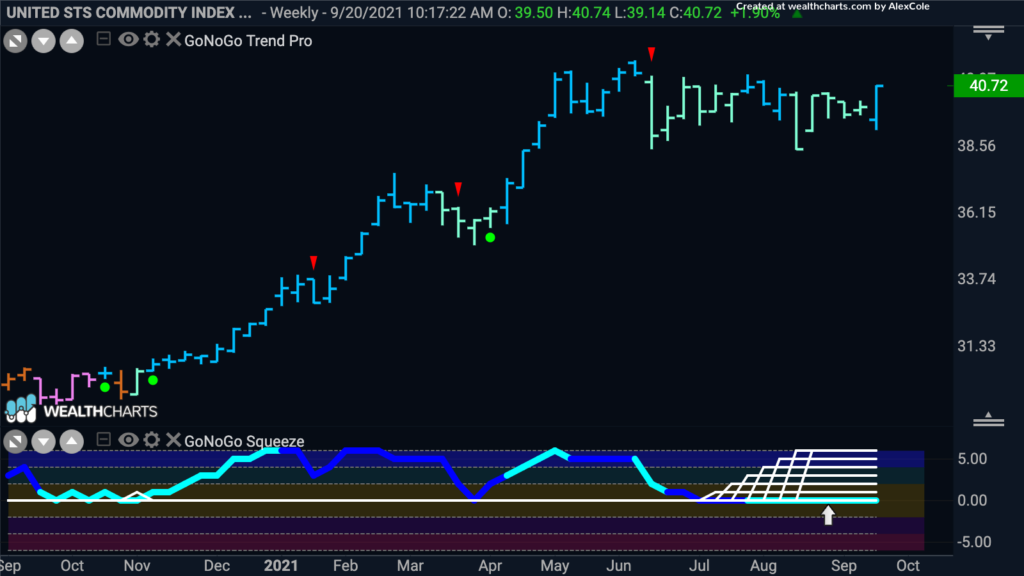
Good morning and welcome to this week’s Flight Path. Let’s take a look at the below GoNoGo Asset Map for this week. As we suspected, equities came in for a wild ride this week. Gapping down on Monday, prices climbed during the week as the S&P 500 tried to dig itself out of a hole. The week ended with an amber “Go Fish” bar and so we can’t say that we are out of the woods just yet. The dollar was able to return to a “Go” trend as well which if it holds could put pressure on equity prices. We also see commodities end the week by rallying with an aqua “Go” bar after surviving a “NoGo” correction that spanned around 6 weeks.
Sector Leadership
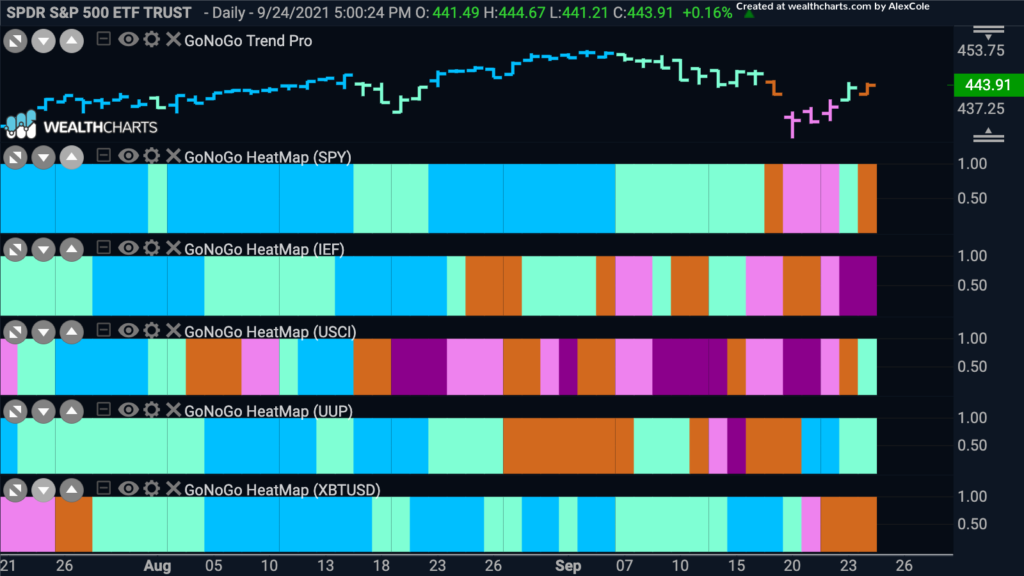
As we have noted over the past few weeks, the strength remains in technology and discretionary stocks on a relative basis. The GoNoGo Sector Map below shows the GoNoGo Trend of each sector etf to the base $SPY. The return of a “Go” trend for $XLE, the energy sector is of particular interest, as some analysts have been expecting a commodities super cycle all year. We will look at some commodity specific GoNoGo Charts below.
Pandemic Leaders Return
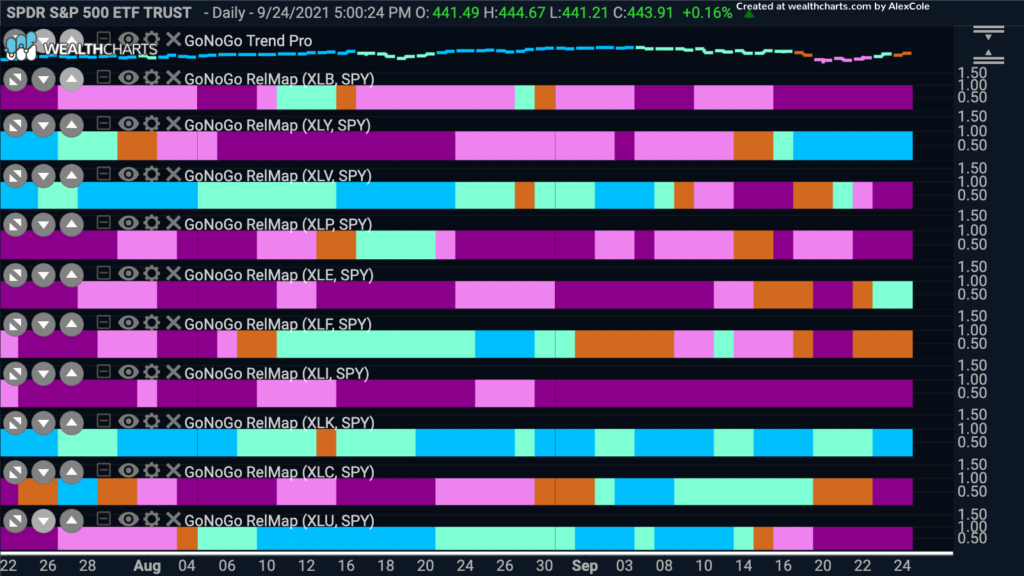
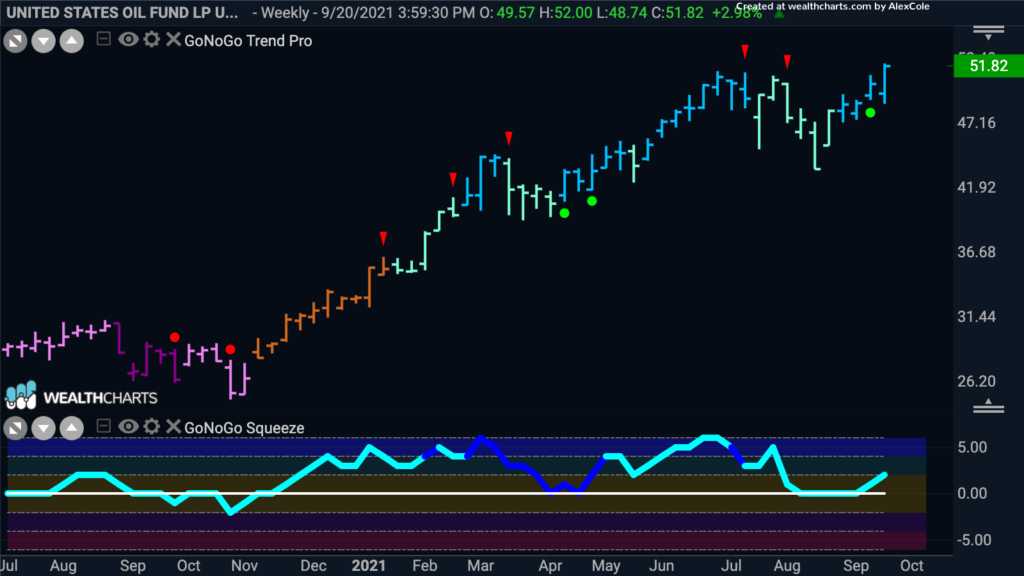
Energy outperformance has returned and so below we have a GoNoGo Chart of the United States Oil fund. The daily prices show that the “Go” trend got a boost from the GoNoGo Oscillator finding support at the zero line. That caused a green Go Trend continuation icon to appear under the price bar 3 days ago, propelling price higher. On the last bar of the week, price broke above resistance from prior highs.
If we want to look at the larger picture, we can view the weekly GoNoGo Chart below. We can see that the long term price trend is also a “Go”, with GoNoGo Trend painting strong blue bars. We see again that GoNoGo Oscillator has found support at the zero line suggesting that in the larger timeframe momentum is also on the side of the bulls. This bodes well for the long term strength of oil prices.
Marathon Oil to Make Moves?
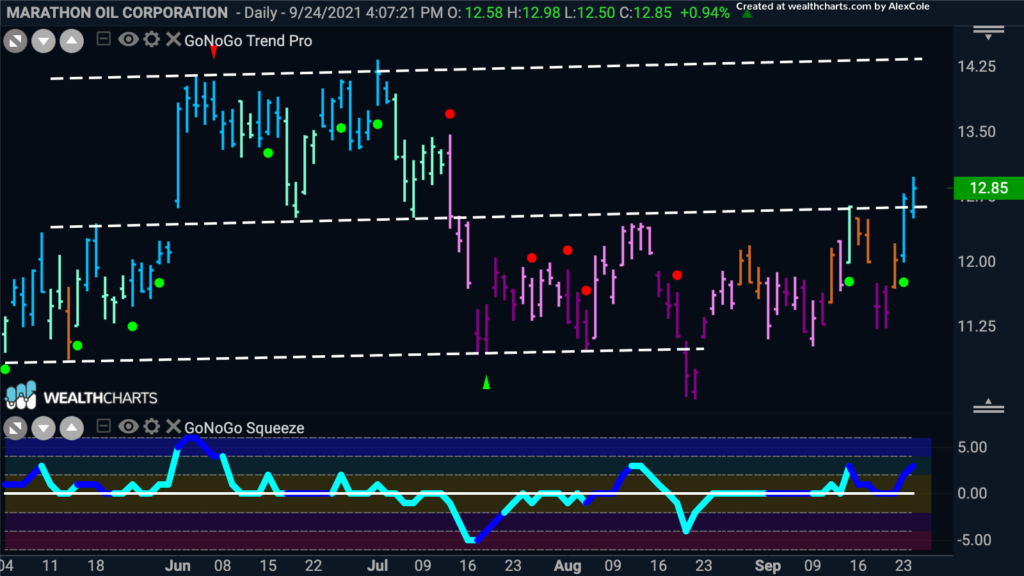
Given the potential strength of oil prices both in the short and long term, let’s take a look at Marathon Oil in the GoNoGo Chart below. We see that after a significant correction that moved nicely between targets drawn from support and resistance lines, price has once again entered a “Go” trend and has broken above resistance. GoNoGo Oscillator has broken into positive territory after a period riding the zero line that coincided with GoNoGo Trend moving from purple through pink and amber bars to the current strong blue color. As the oscillator most recently bounced off the zero line we see that volume has been heavy (dark blue of oscillator).
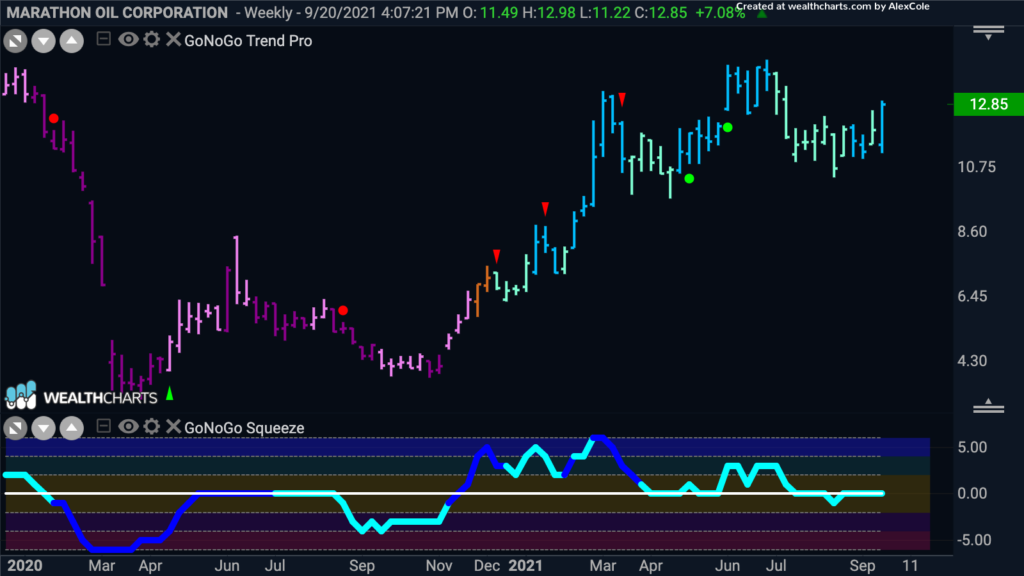
Zooming out, the weekly GoNoGo Chart of $MRO shows us that after correcting from midsummer highs, the GoNoGo Oscillator is riding the zero line. If the bullish scenario on the daily chart plays out, then we would likely see the oscillator on the weekly chart find support at the zero line and rally into positive territory which would strengthen the longer term “Go” trend as well.
Commodities Supercycle
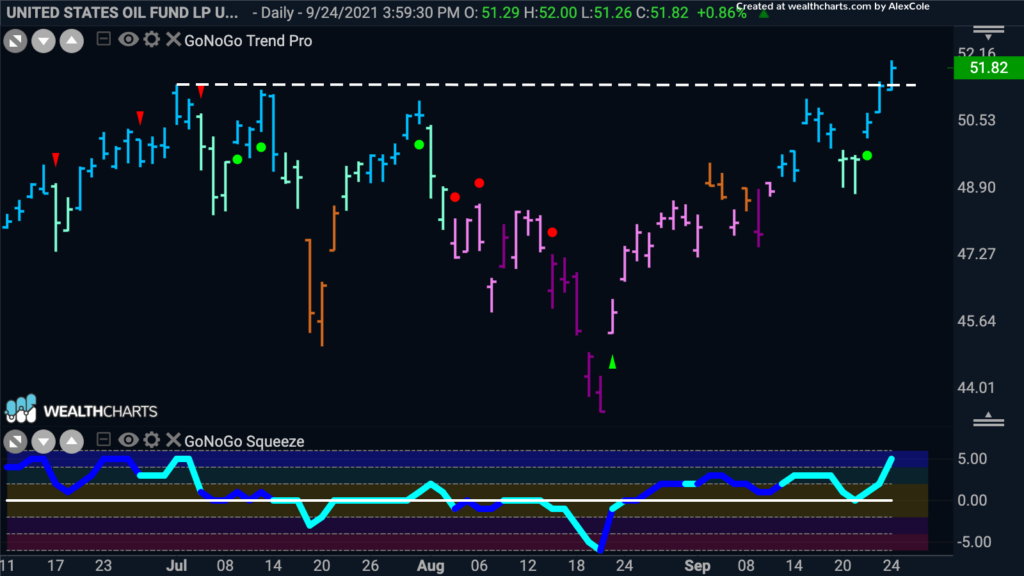
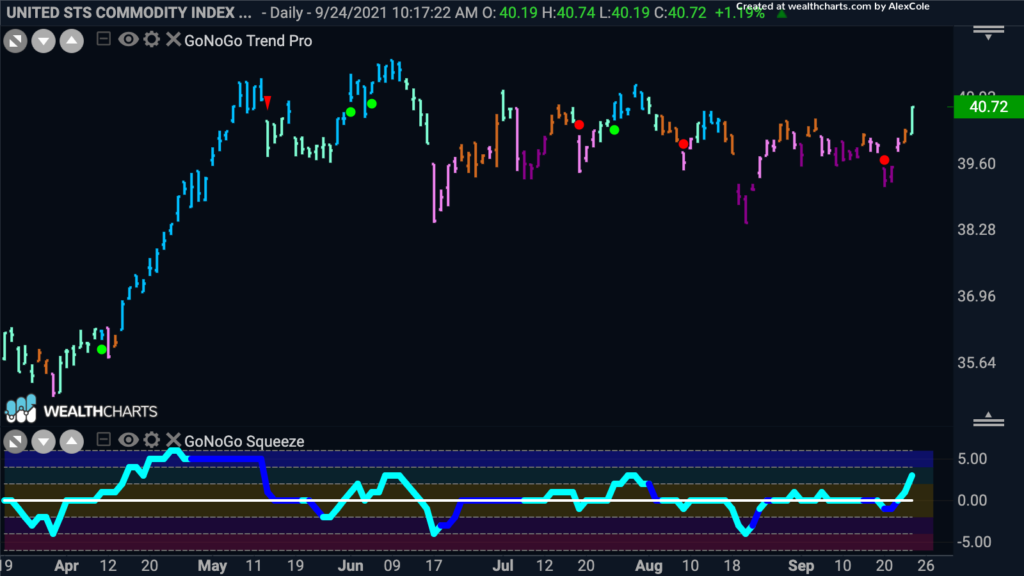
Is it just oil that is poised to move higher? Since earlier this year, many analysts have discussed the possibility of a supercycle for commodities. Indeed, in the spring, prices took off. The below GoNoGo Chart shows that since hitting highs in May and June, price has moved generally sideways and action has been choppy since. A supercycle is a massive, decade long type of price trend, and so we must ask is this sideways correction a pause? The daily chart shows that GoNoGo Trend is painting a first aqua “Go” bar after several weeks of NoGo and amber “Go Fish” bars. There is still overhead supply to deal with from the early summer highs but we will look to see if a sustained “Go” trend emerges to move price to a new leg higher.
Zooming out, we can see that the above discussed long term pause in a “Go” trend is exactly what we see. After a strong “Go” move that started at the end of last year, price has moved sideways from early summer highs and the GoNoGo Oscillator fell to the zero line. We see that this has caused a massive squeeze on the weekly chart, with the climbing grid of GoNoGo Squeeze rising to and staying at extremes. If the oscillator can break out of the squeeze to the upside, we may well see a significant move higher in commodity prices.
