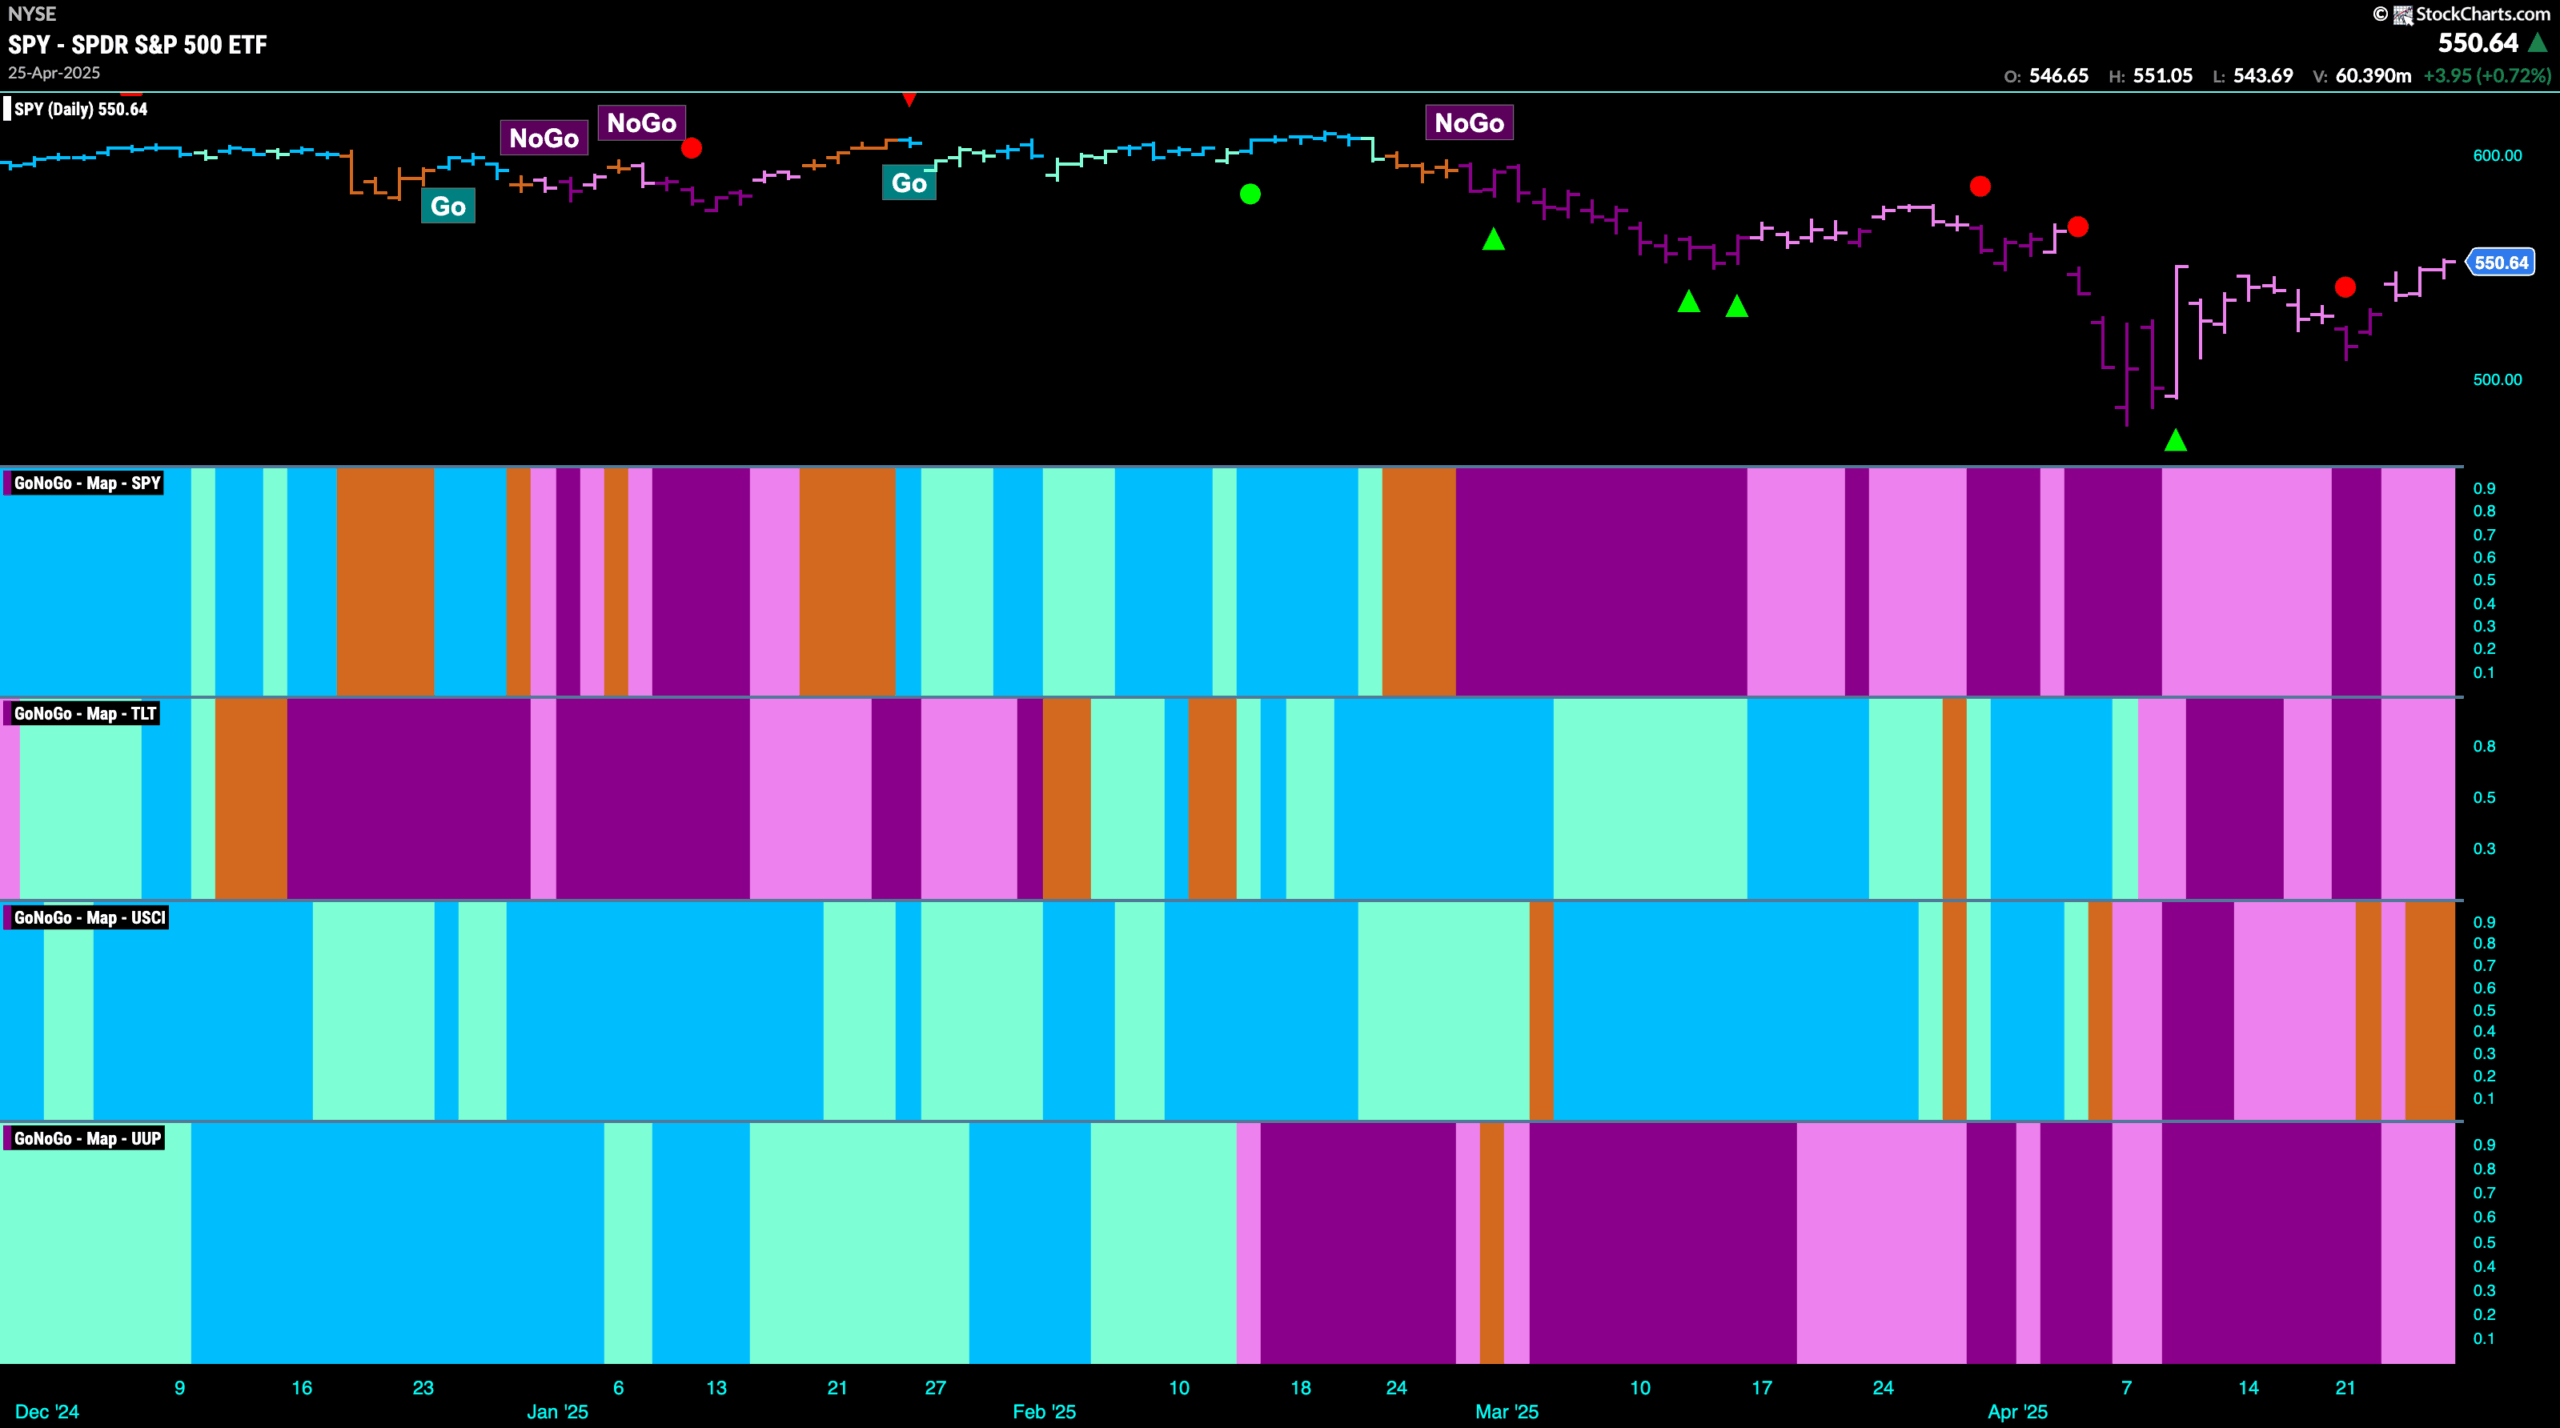
Good morning and welcome to this week’s Flight Path. The equity trend remained a “NoGo” but as price rallied off the lows we saw more pink bars indicating indicating a weakening trend. Treasury bond prices are also painting weaker pink bars and U.S. commodities is painting amber bars of uncertainty. The dollar saw its “NoGo” trend survive but it also showed weakness with pink bars.
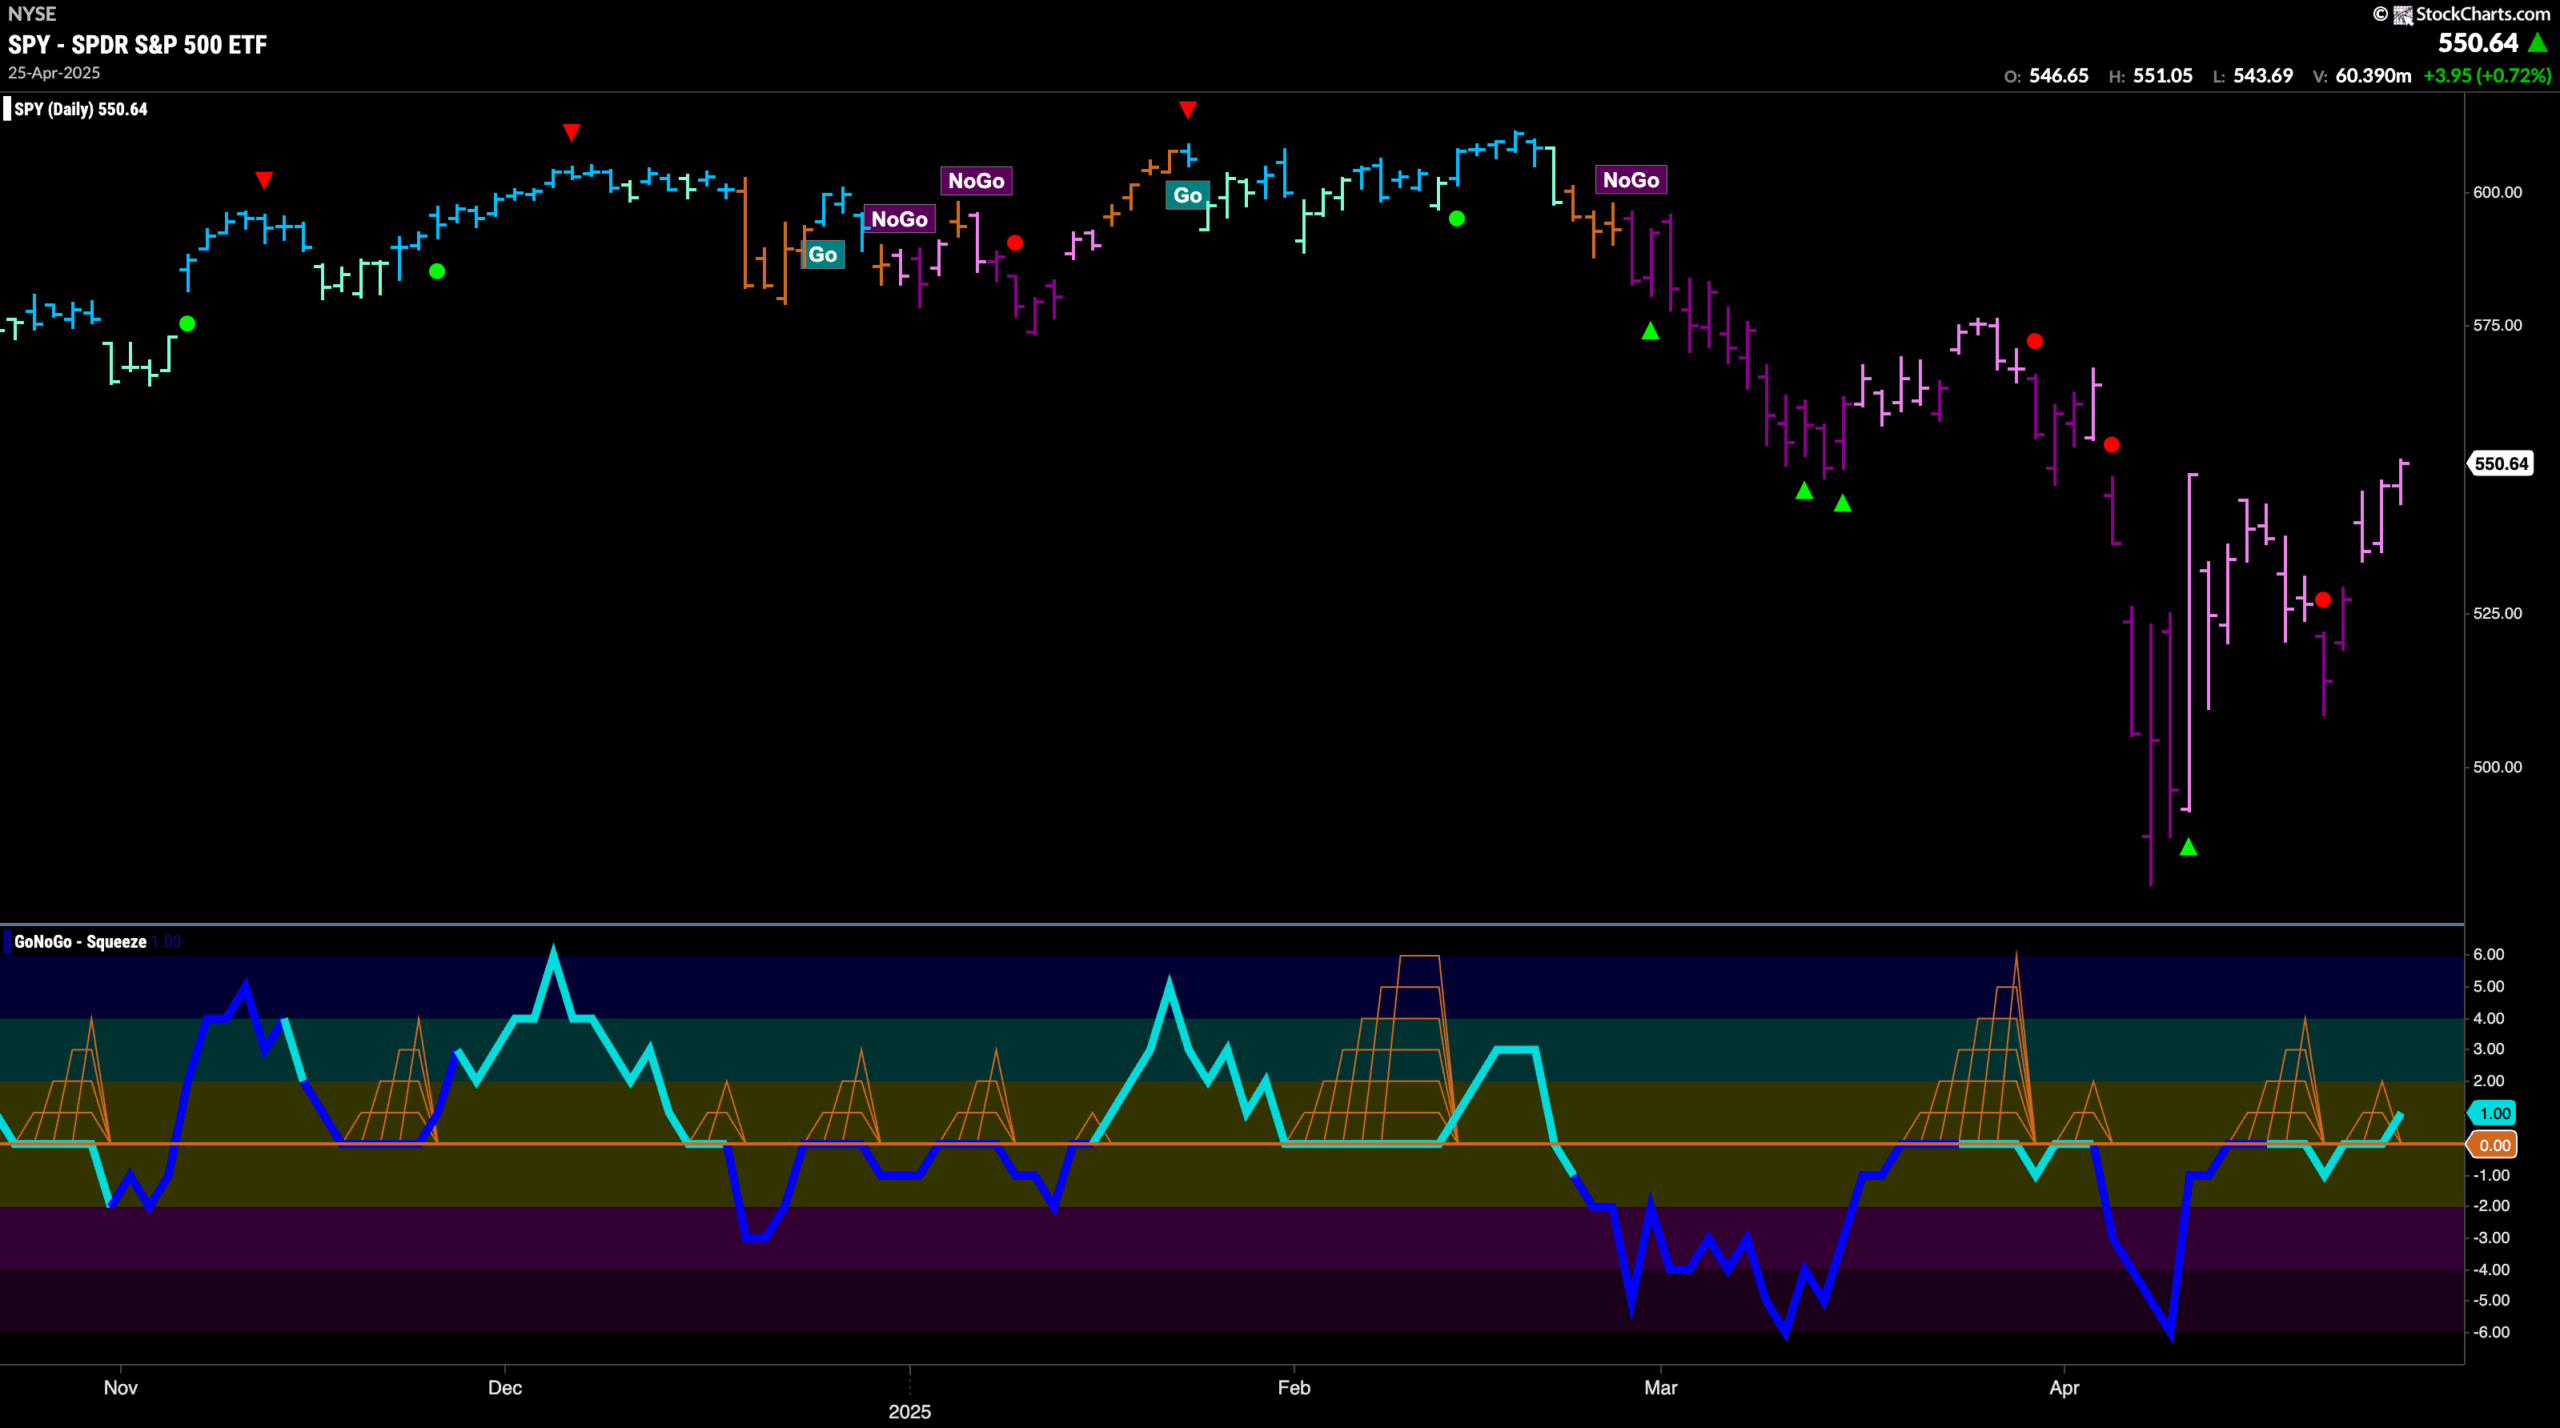
$SPY Paints Pink “NoGo” Bars as Price Climbs
The GoNoGo chart below shows that the “NoGo” trend stayed for another week but we saw price continue to climb off the lows and the indicator painted more weak pink bars. We have now seen a higher low and price is threatening to make a higher high. GoNoGo Oscillator is dipping its nose into positive territory having struggled with the zero line for some time. We will see if this momentum shift is enough to cause a trend change in the panel above.
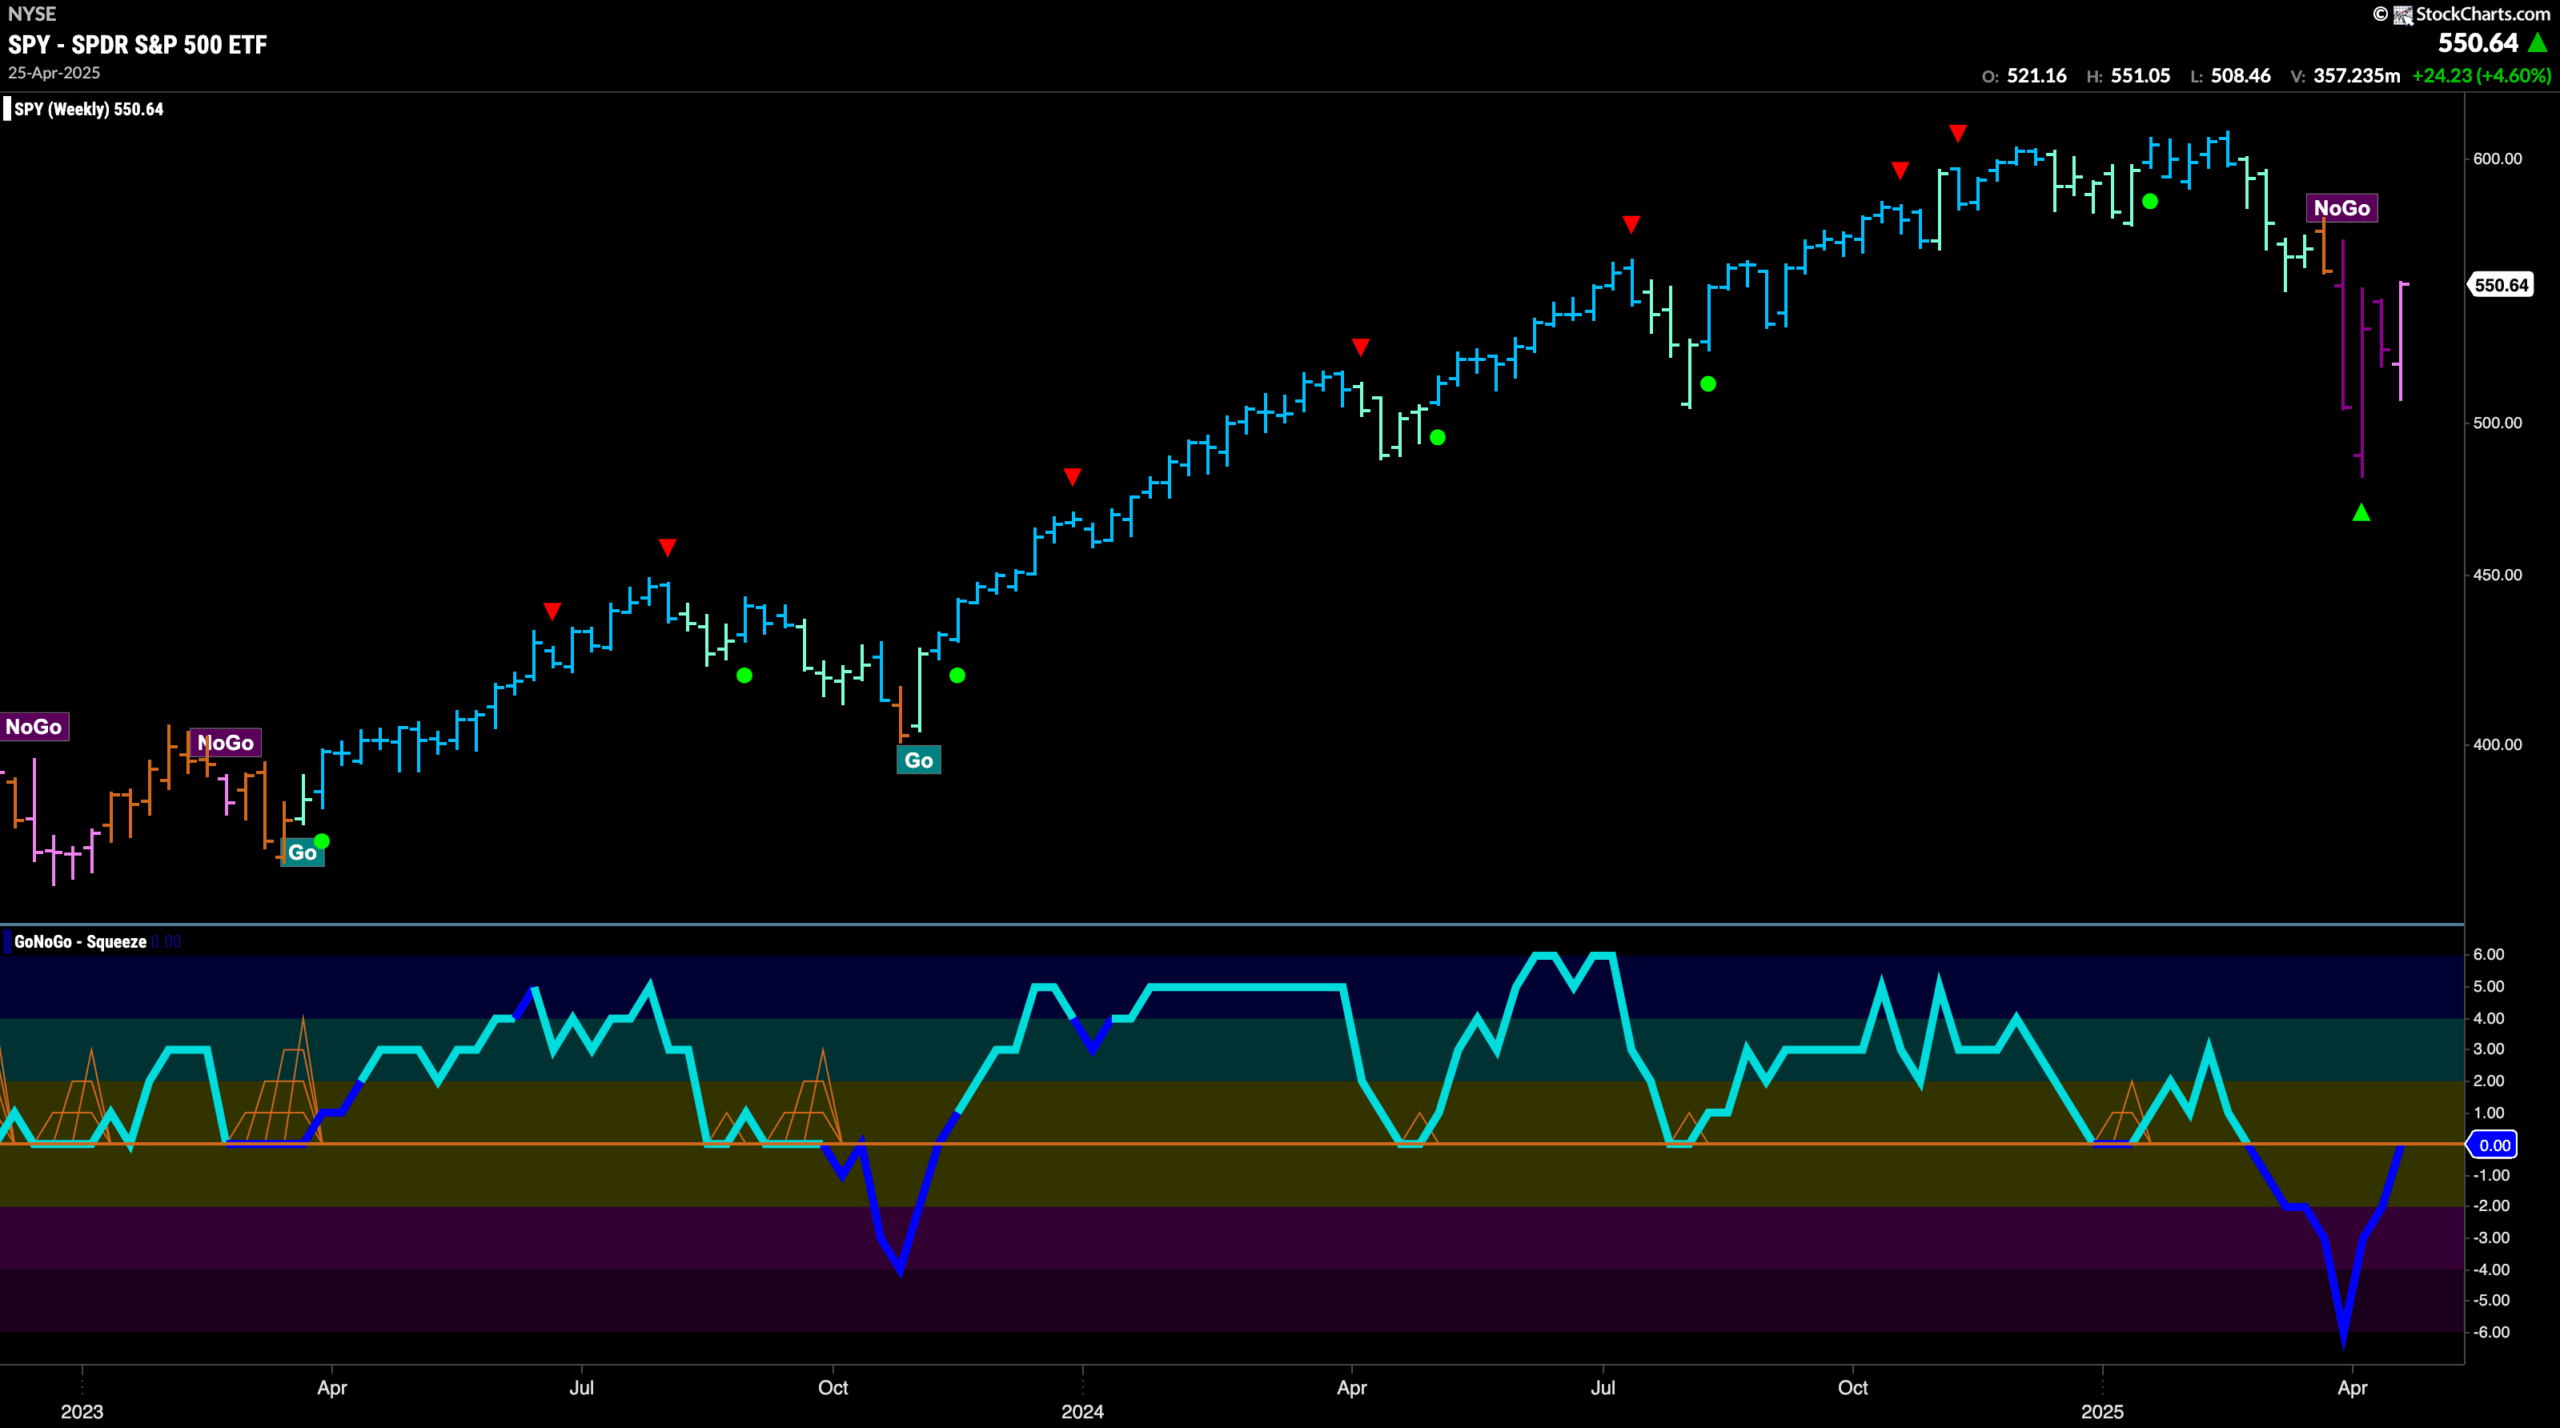
The weekly chart shows us that while the “NoGo” trend is still in place it is weakening on the the longer time frame as well. GoNoGo Trend paints a weak pink bar as it begins to tackle the strong overhead resistance from the prior “Go” trend. GoNoGo Oscillator is testing the zero line from below and volume is heavy.
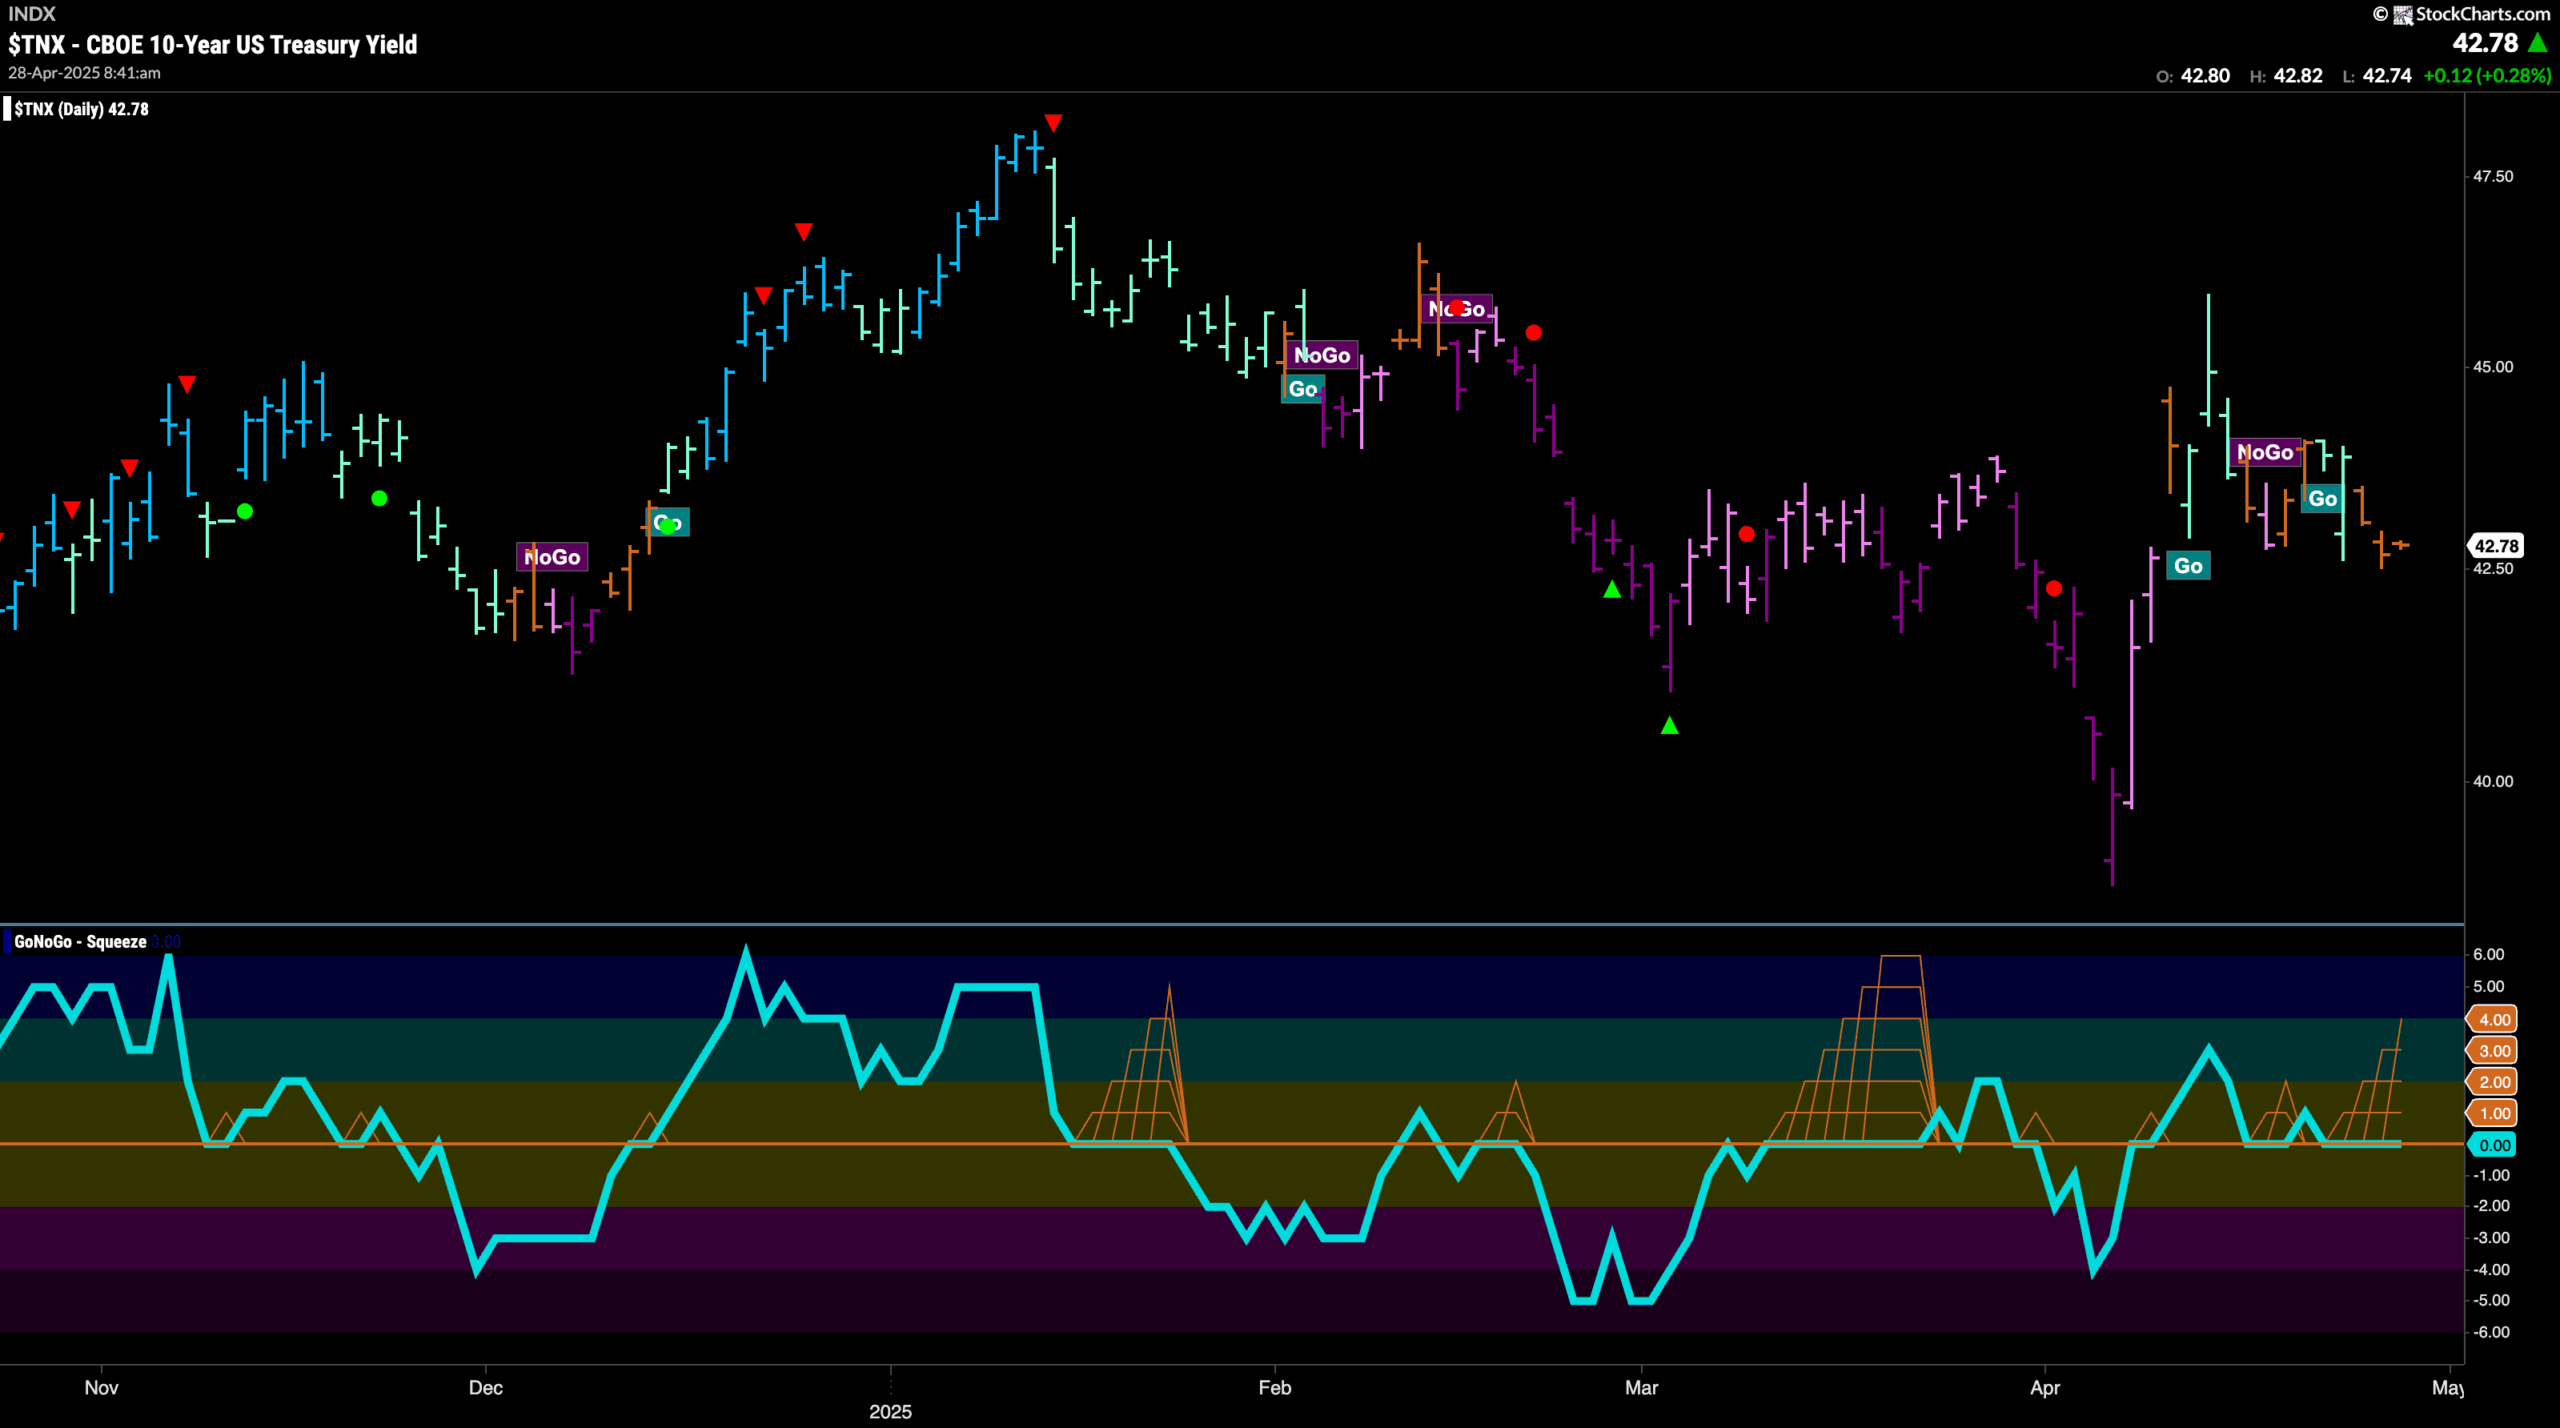
Treasury Rates Still Dealing with Chop
GoNoGo Trend shows that the market has not determined a clear direction for rates. After being unable to hold onto a new “Go” trend we see the indicator once again painting amber “Go Fish” bars. GoNoGo Oscillator is riding the zero line once again as investors battle over future direction. We will look to see if the oscillator regains positive territory which would give the “Go” a chance to return.
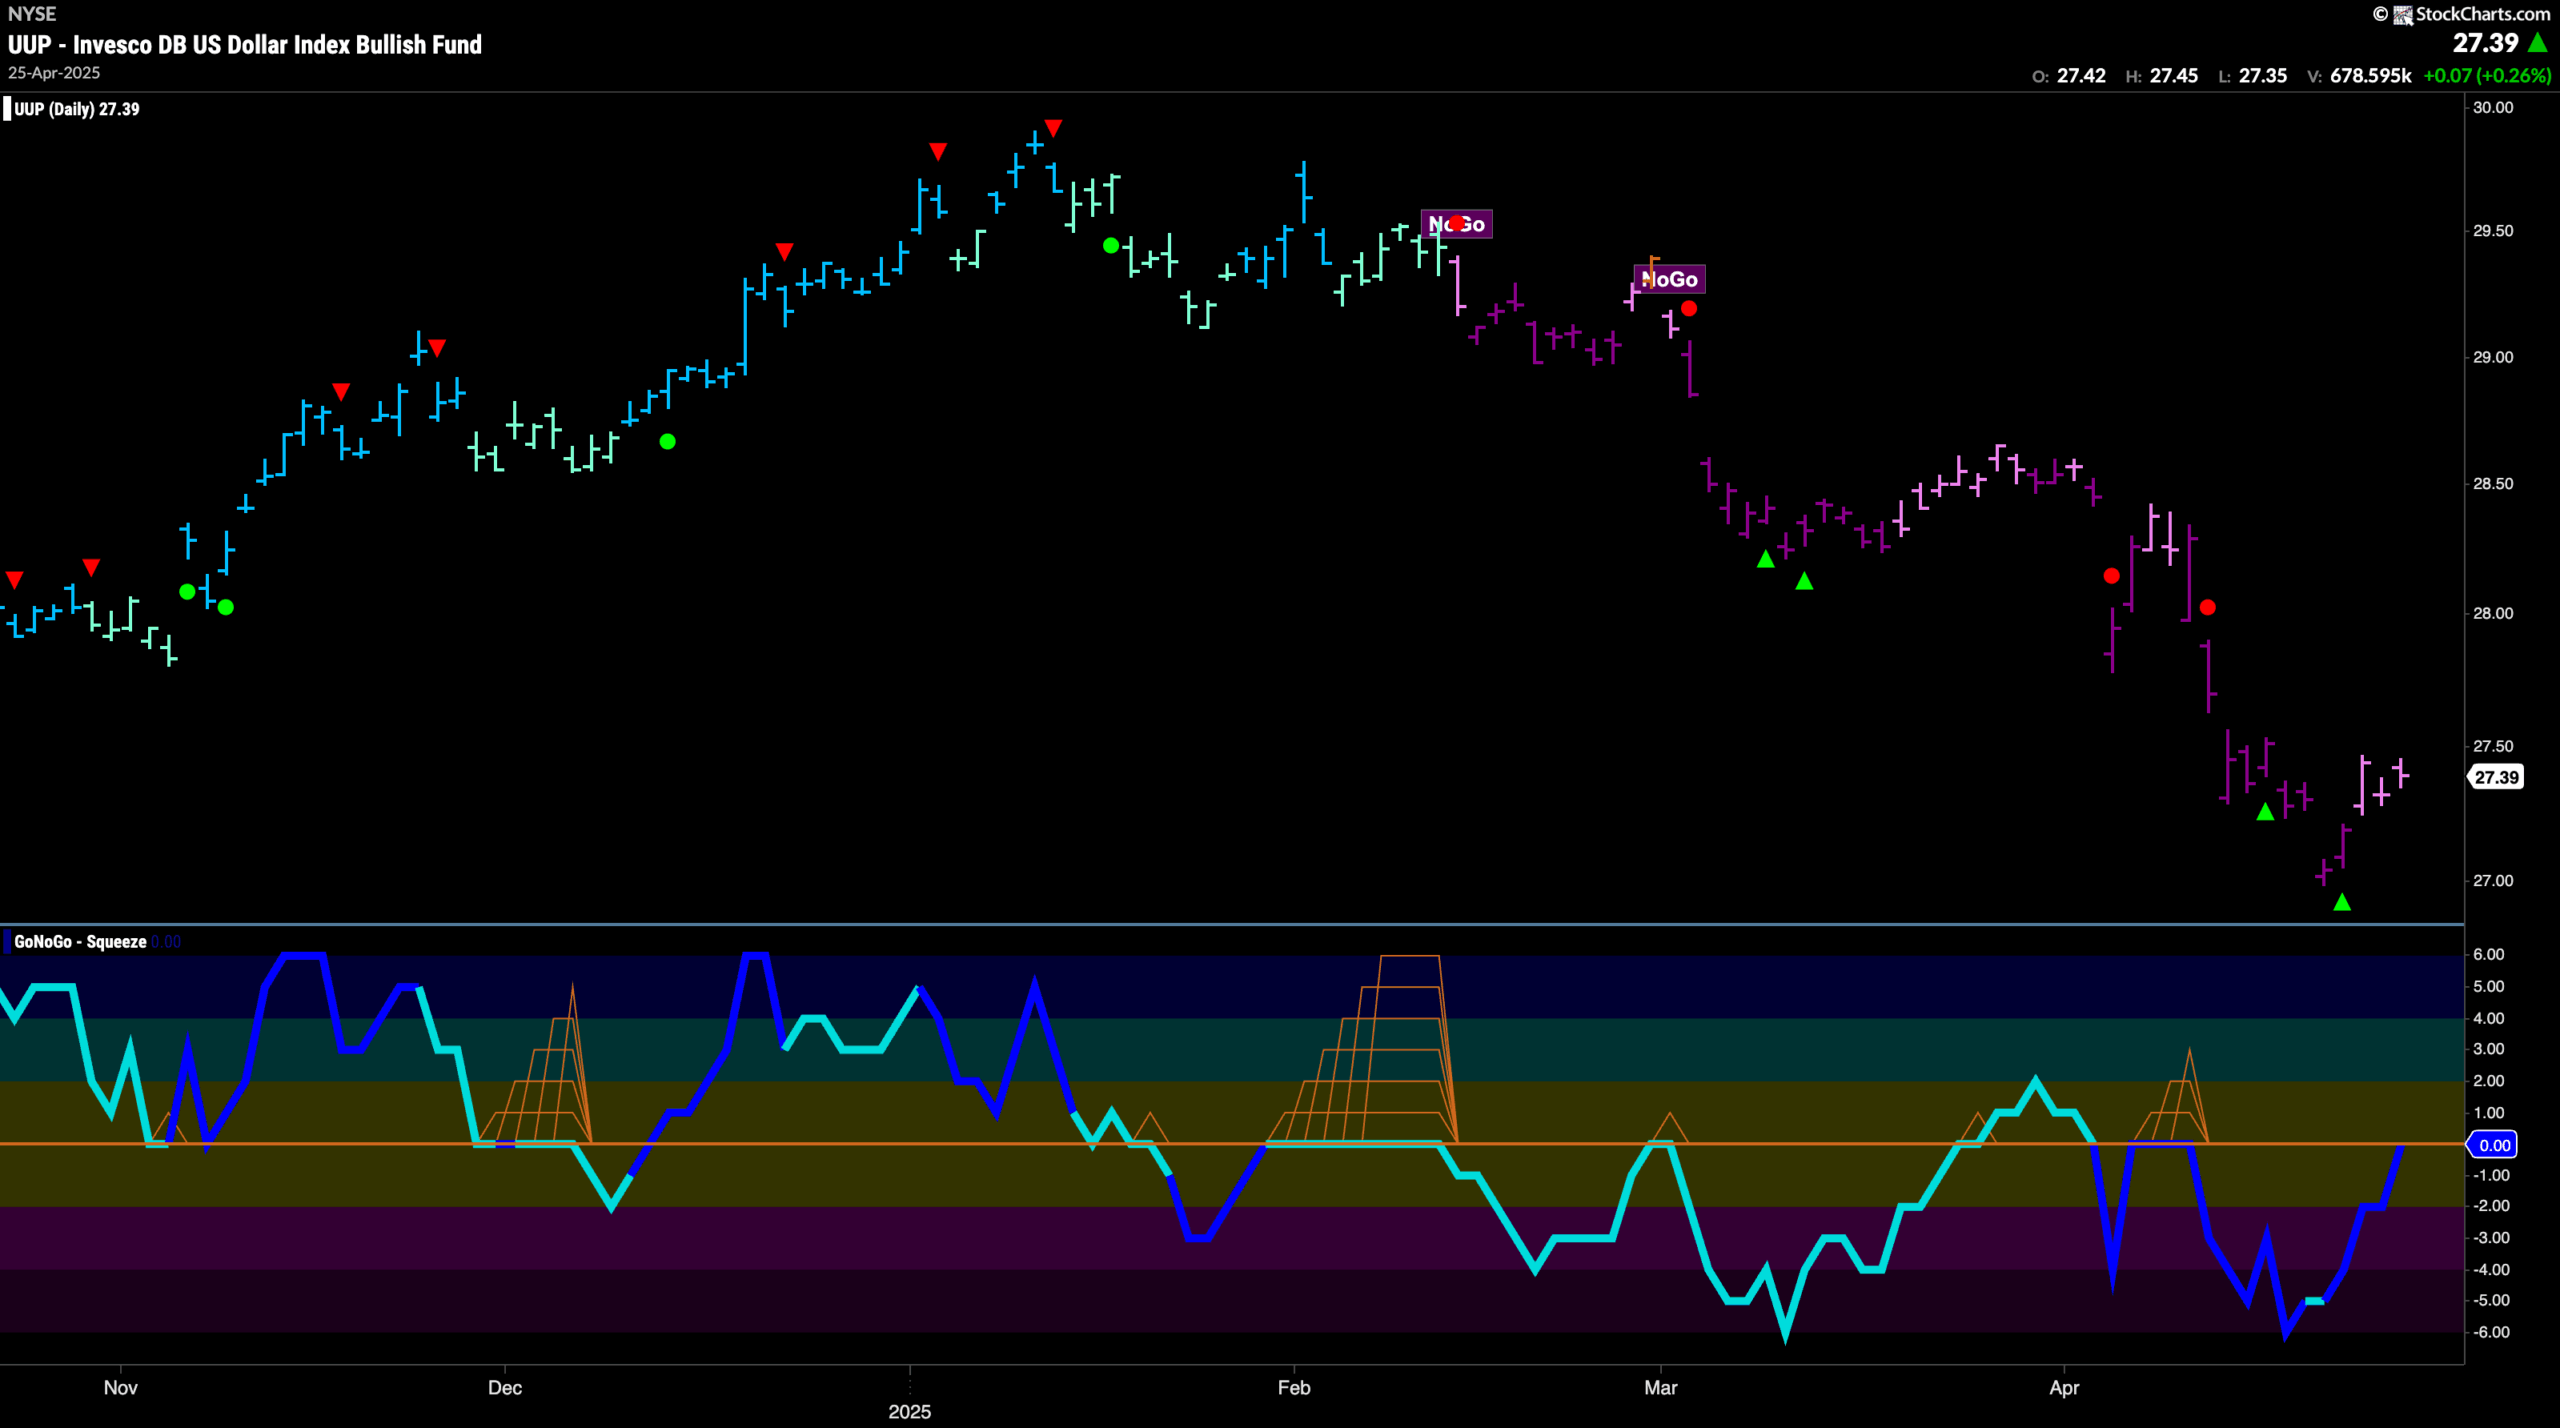
Dollar Continues Remains in “NoGo” Trend
The “NoGo” trend continued for another week although as price rallied off the recent lows we do see some weakness with the indicator painting pink bars. We will watch to see if this is another lower low in a continued “NoGo” trend or the start of a reversal. GoNoGo Oscillator is testing the zero line from below on heavy volume. We will watch to see if it is rejected at this level. If it is, then we will likely see another drop in rates.
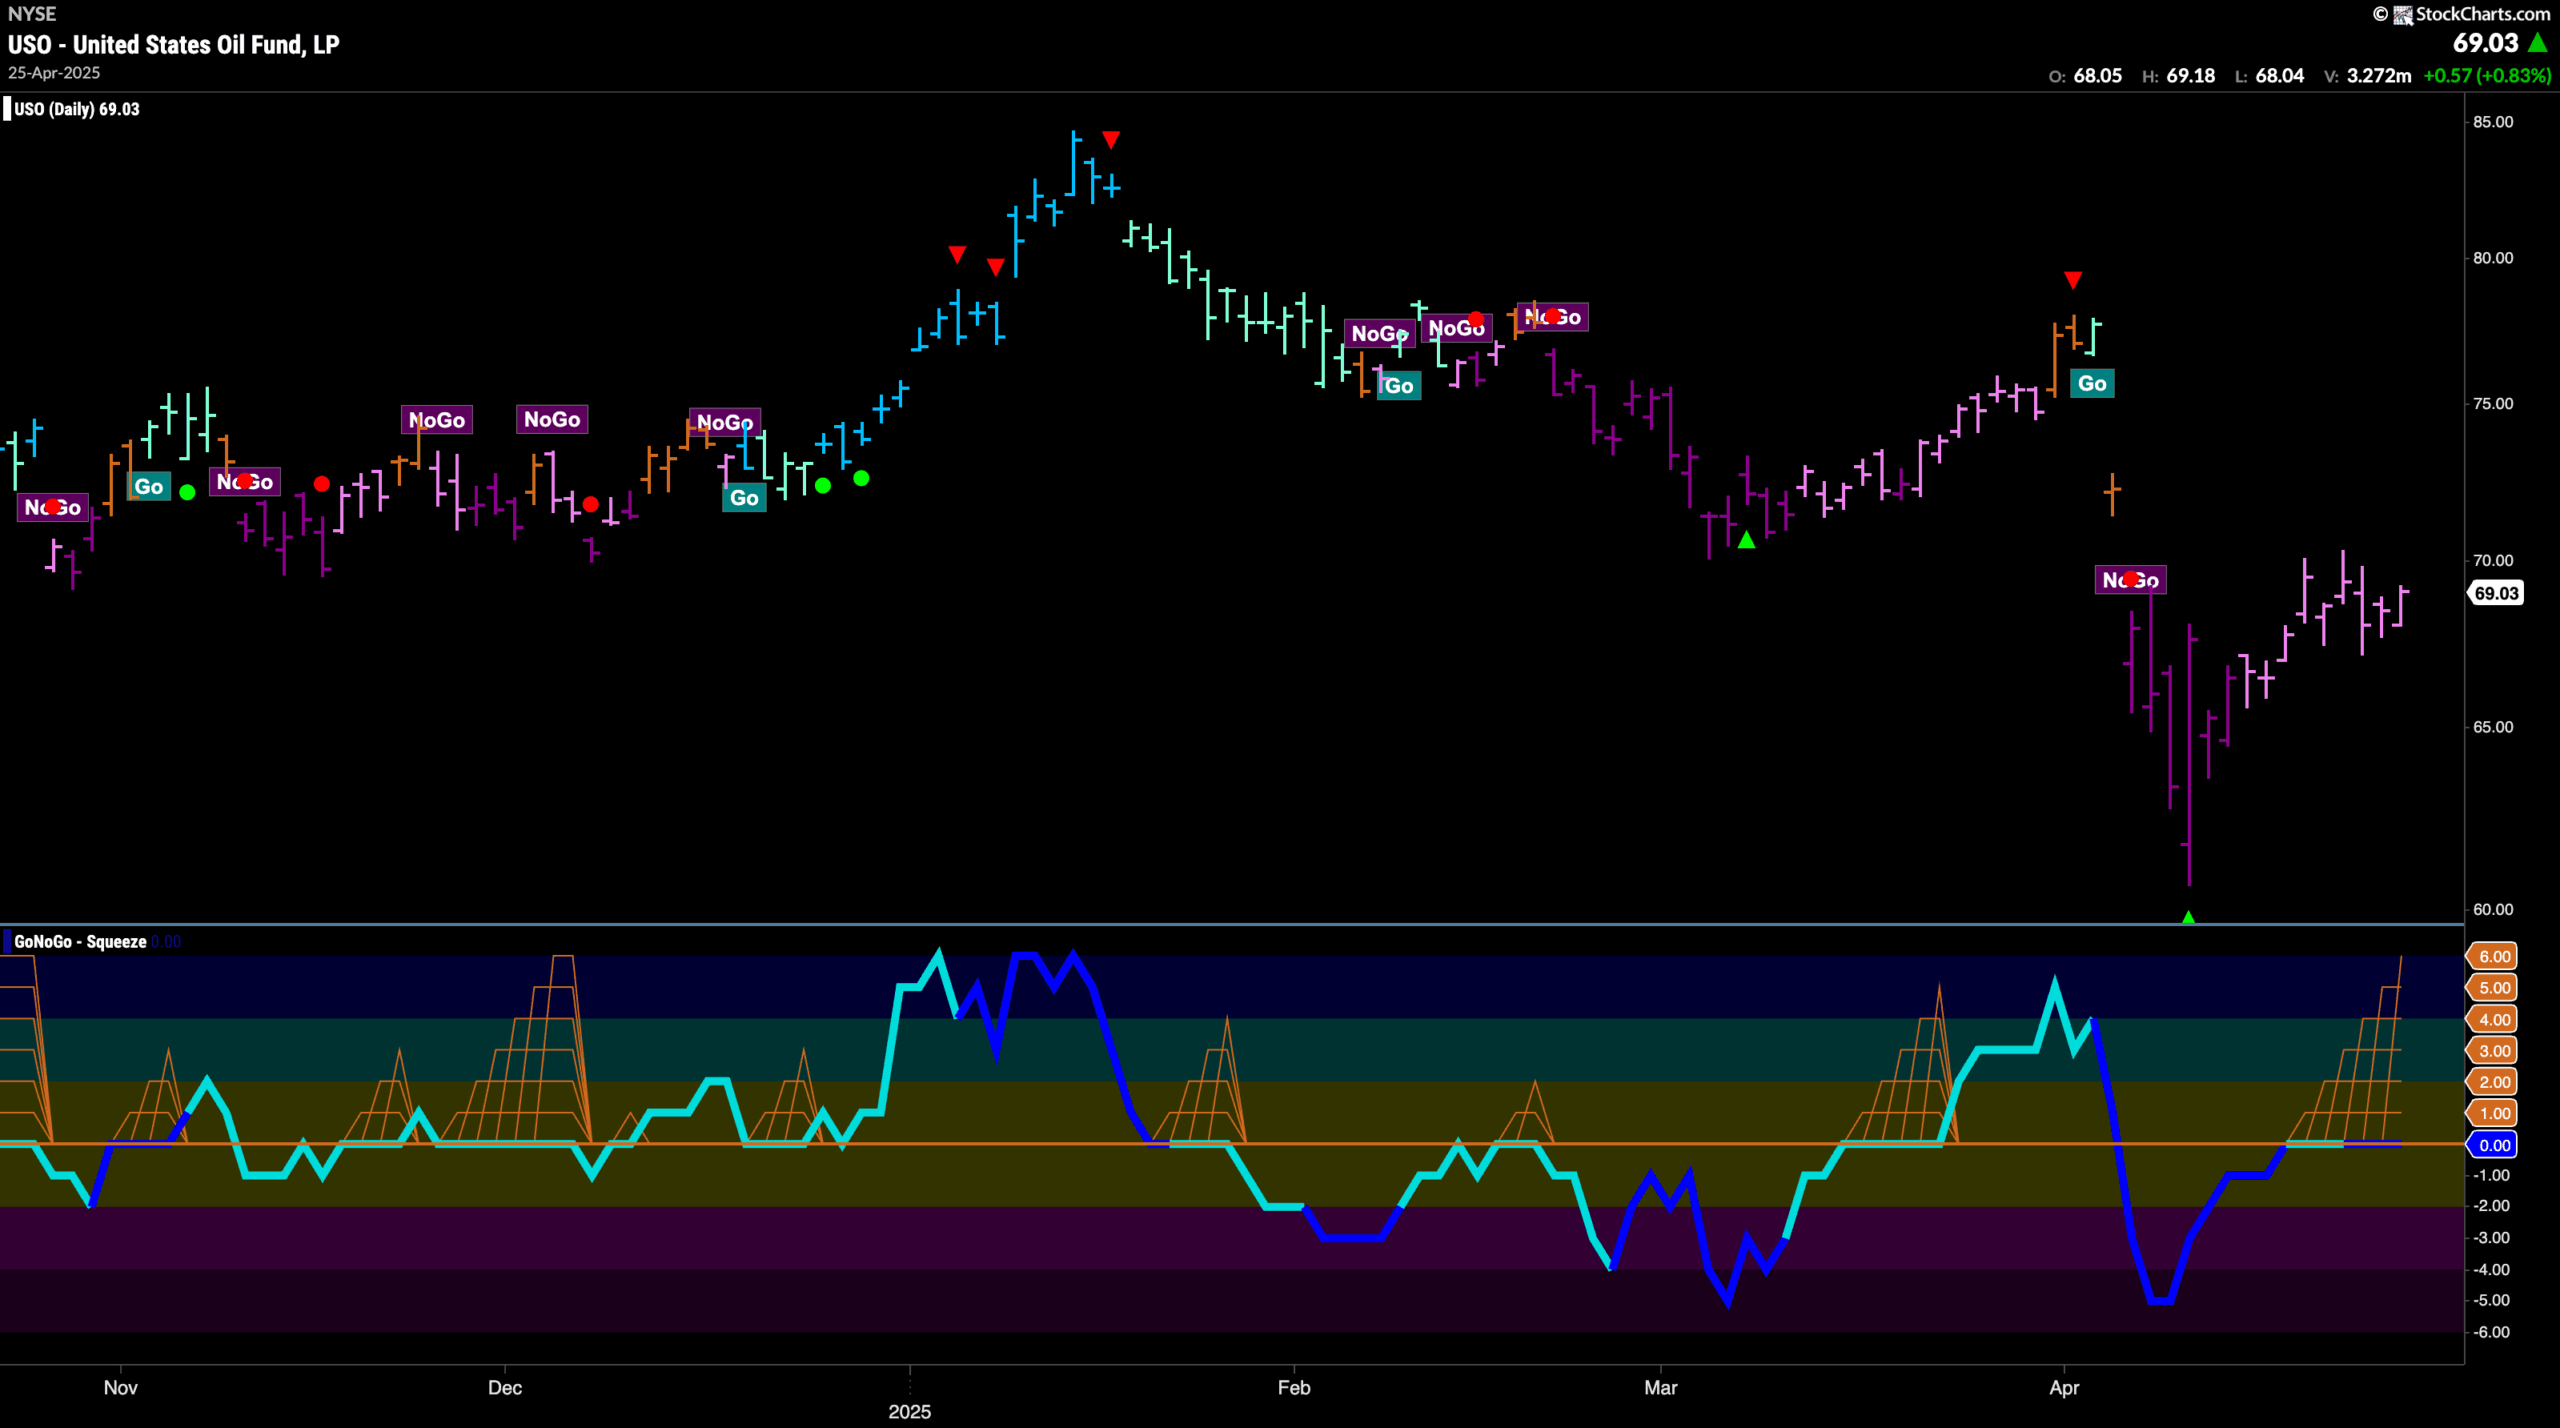
“NoGo” Stays Weak As GoNoGo Trend Paints Pink Bars
A weak of uninterrupted pink “NoGo” bars tells us that while the trend is still in place it is weak. We may have run into natural resistance from the last gap that we see on the chart. GoNoGo Oscillator is riding the zero line and we see a Max GoNoGo Squeeze. This reflects the virtual tug of war at these levels between buyers and sellers. We will watch to see in which direction the Squeeze is broken. If the Oscillator falls into negative territory then we will know that momentum is resurgent in the direction of the “NoGo” trend and we will expect price to fall.
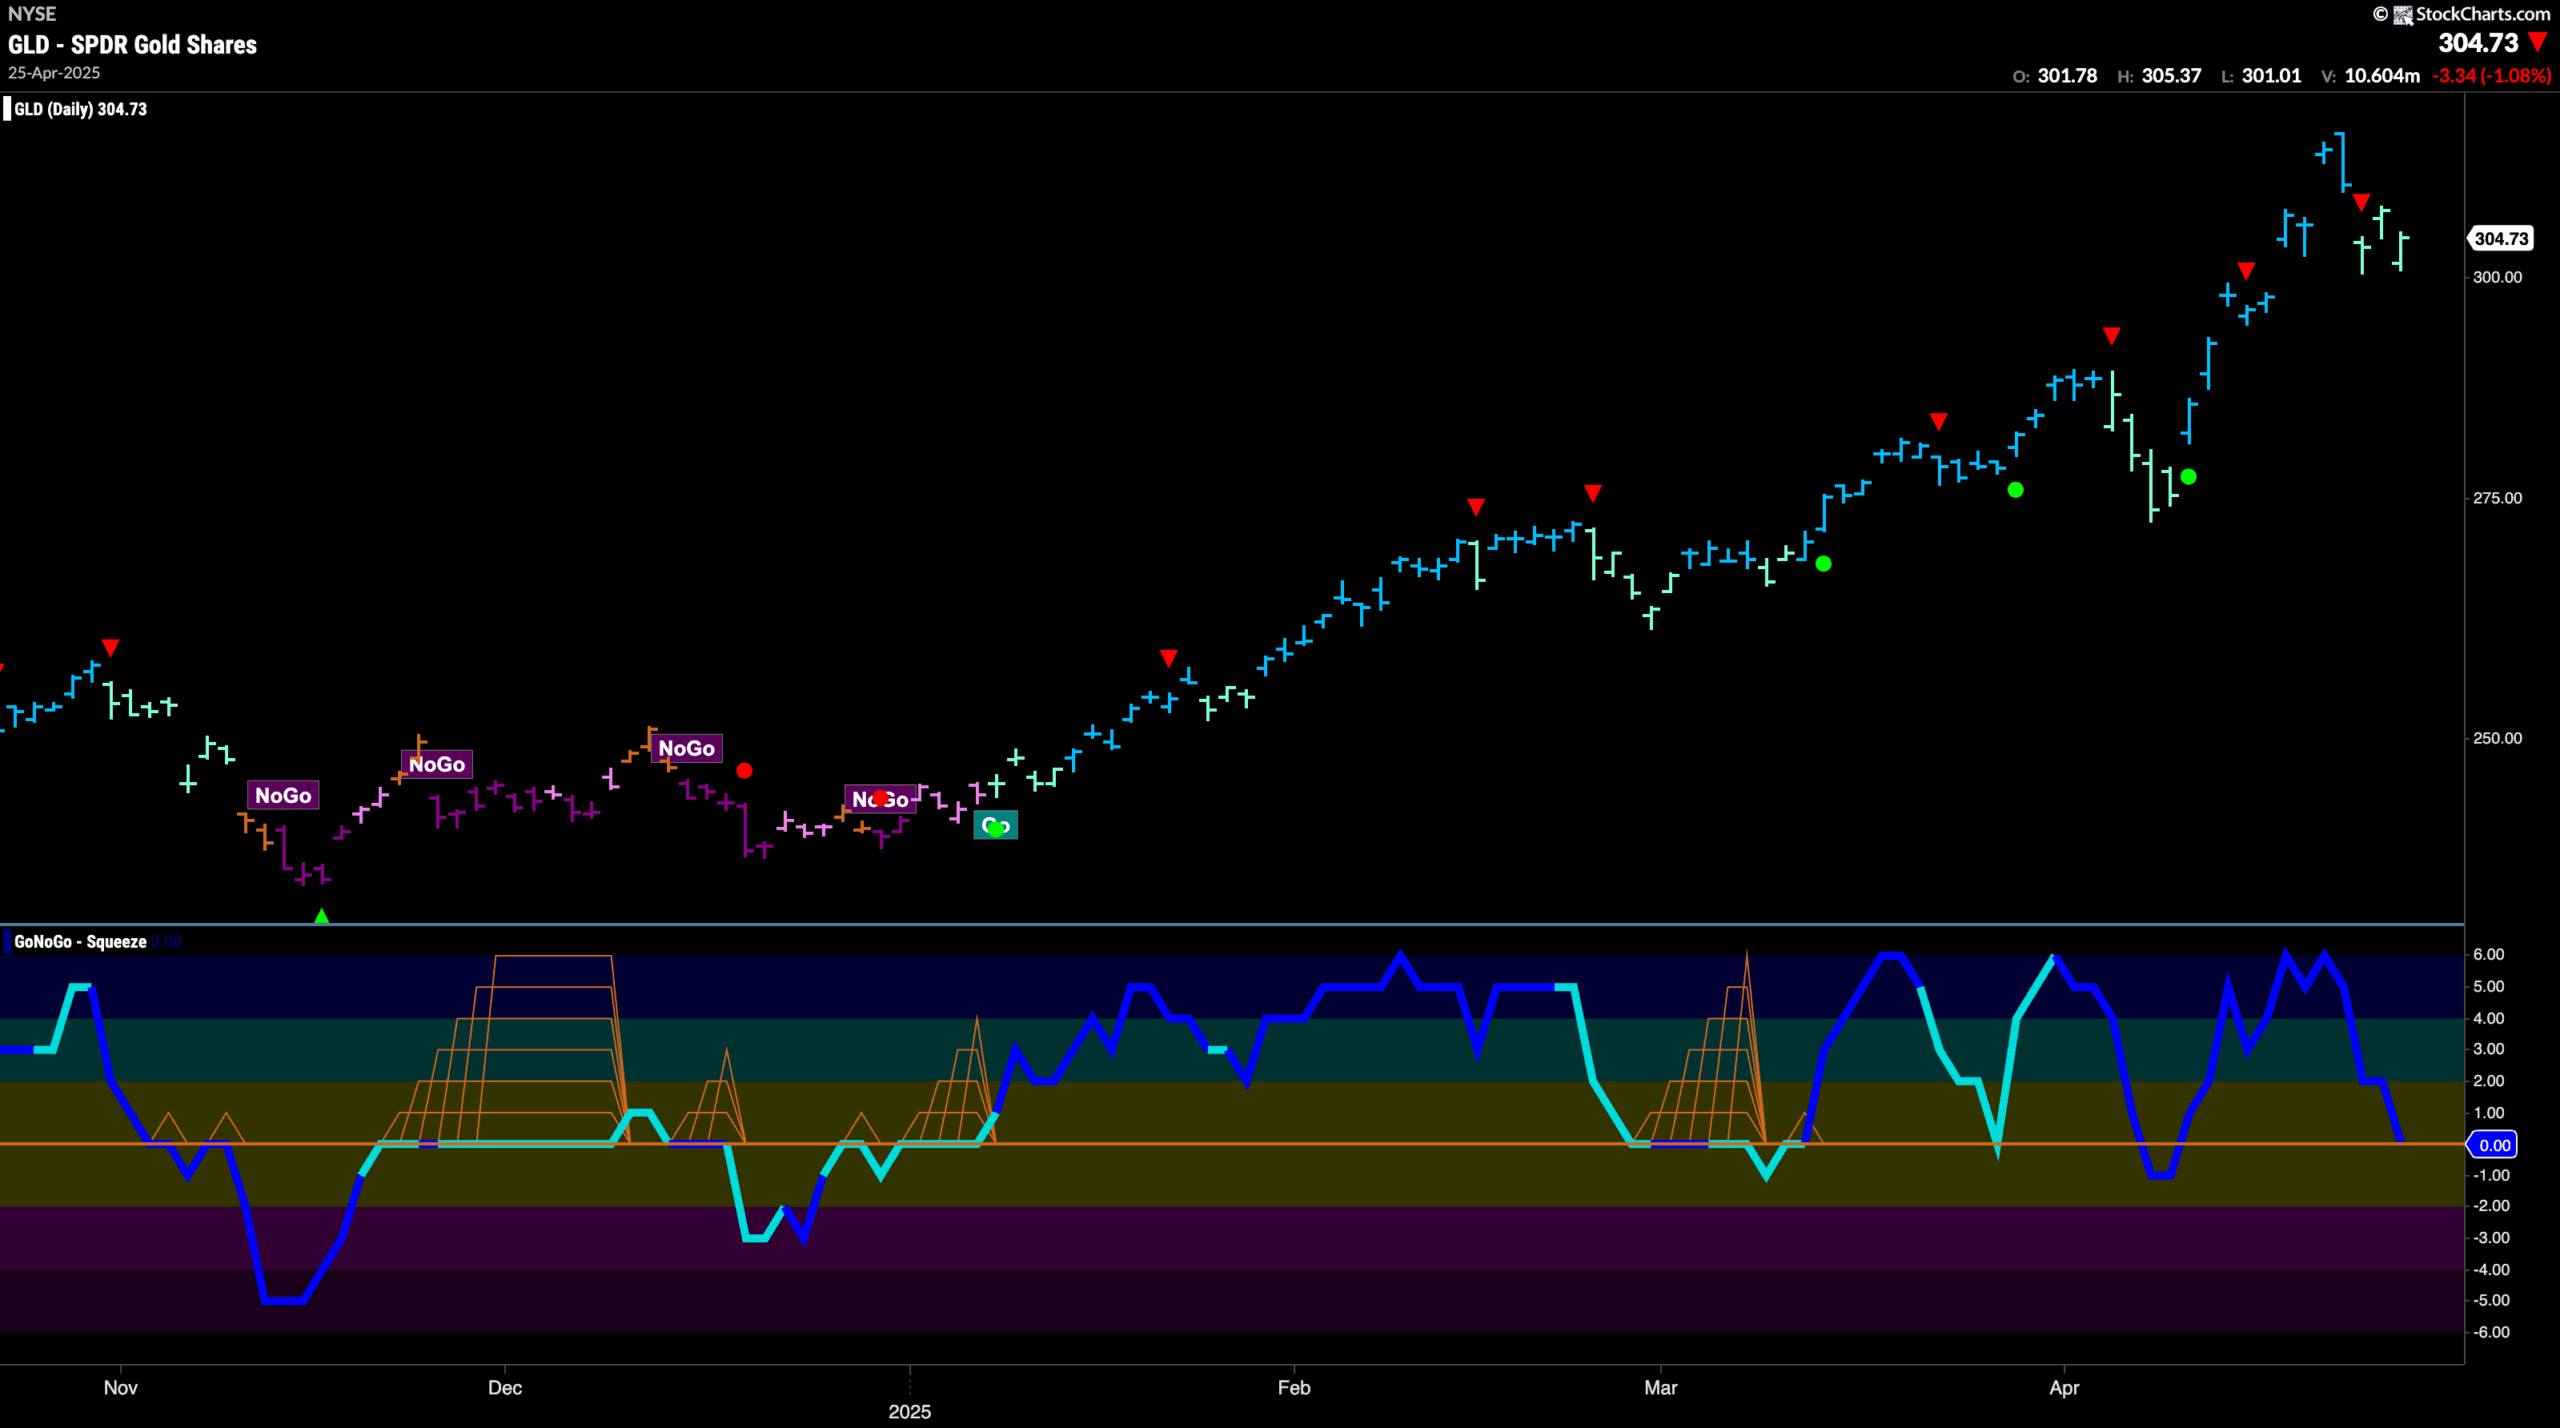
Gold Rests After Another High
Gold took a pause this week but not after first setting another higher high. We saw price gap higher on the first bar of the week and then retreat on weaker aqua bars. We will watch to see if it finds some support here and sets another higher low. GoNoGo Oscillator is testing the zero line and volume is heavy. If the oscillator finds support again at zero then we will know that the trend is healthy and momentum remains in the direction of the “Go” trend.
Sector RelMap
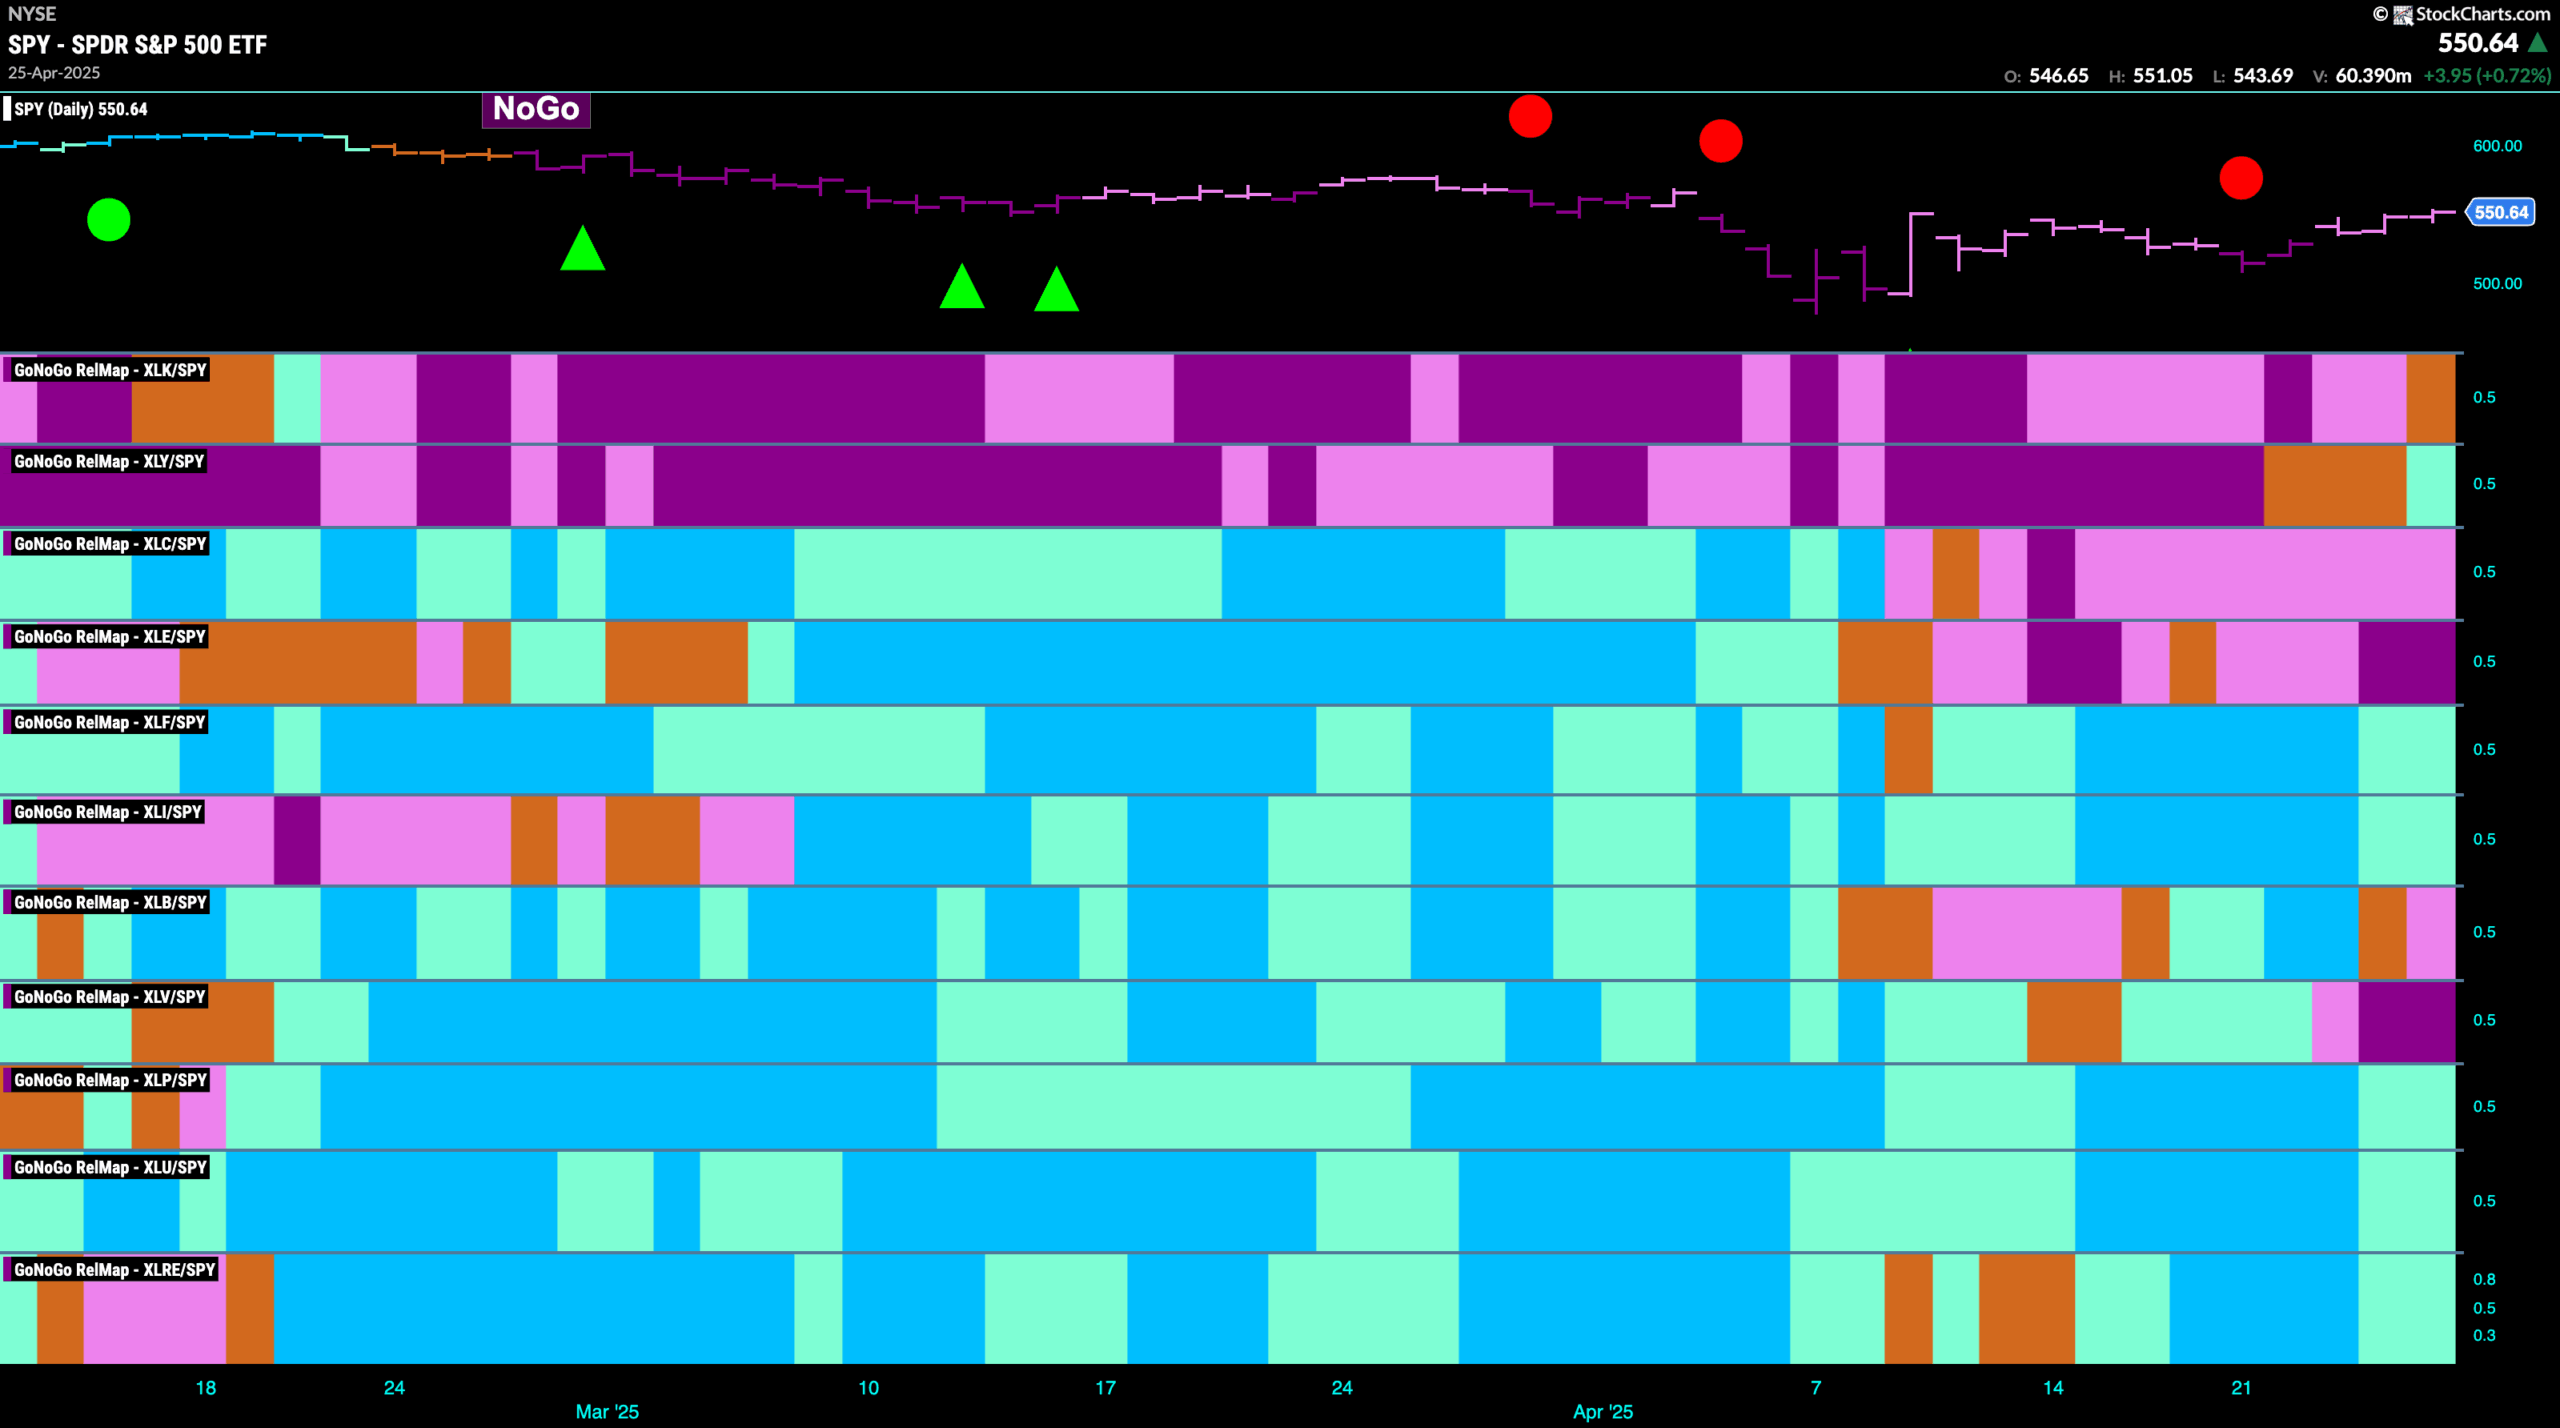
Below is the GoNoGo Sector RelMap. This GoNoGo RelMap applies the GoNoGo Trend to the relative strength ratios of the sectors to the base index. With this view we can get a sense of the relative out performance and relative underperformance of the sectors. 6 sectors are in relative “Go” trends. $XLY, $XLF, $XLI, $XLP, $XLU and $XLRE are painting relative “Go” bars.
Discretionary Sub-Group RelMap
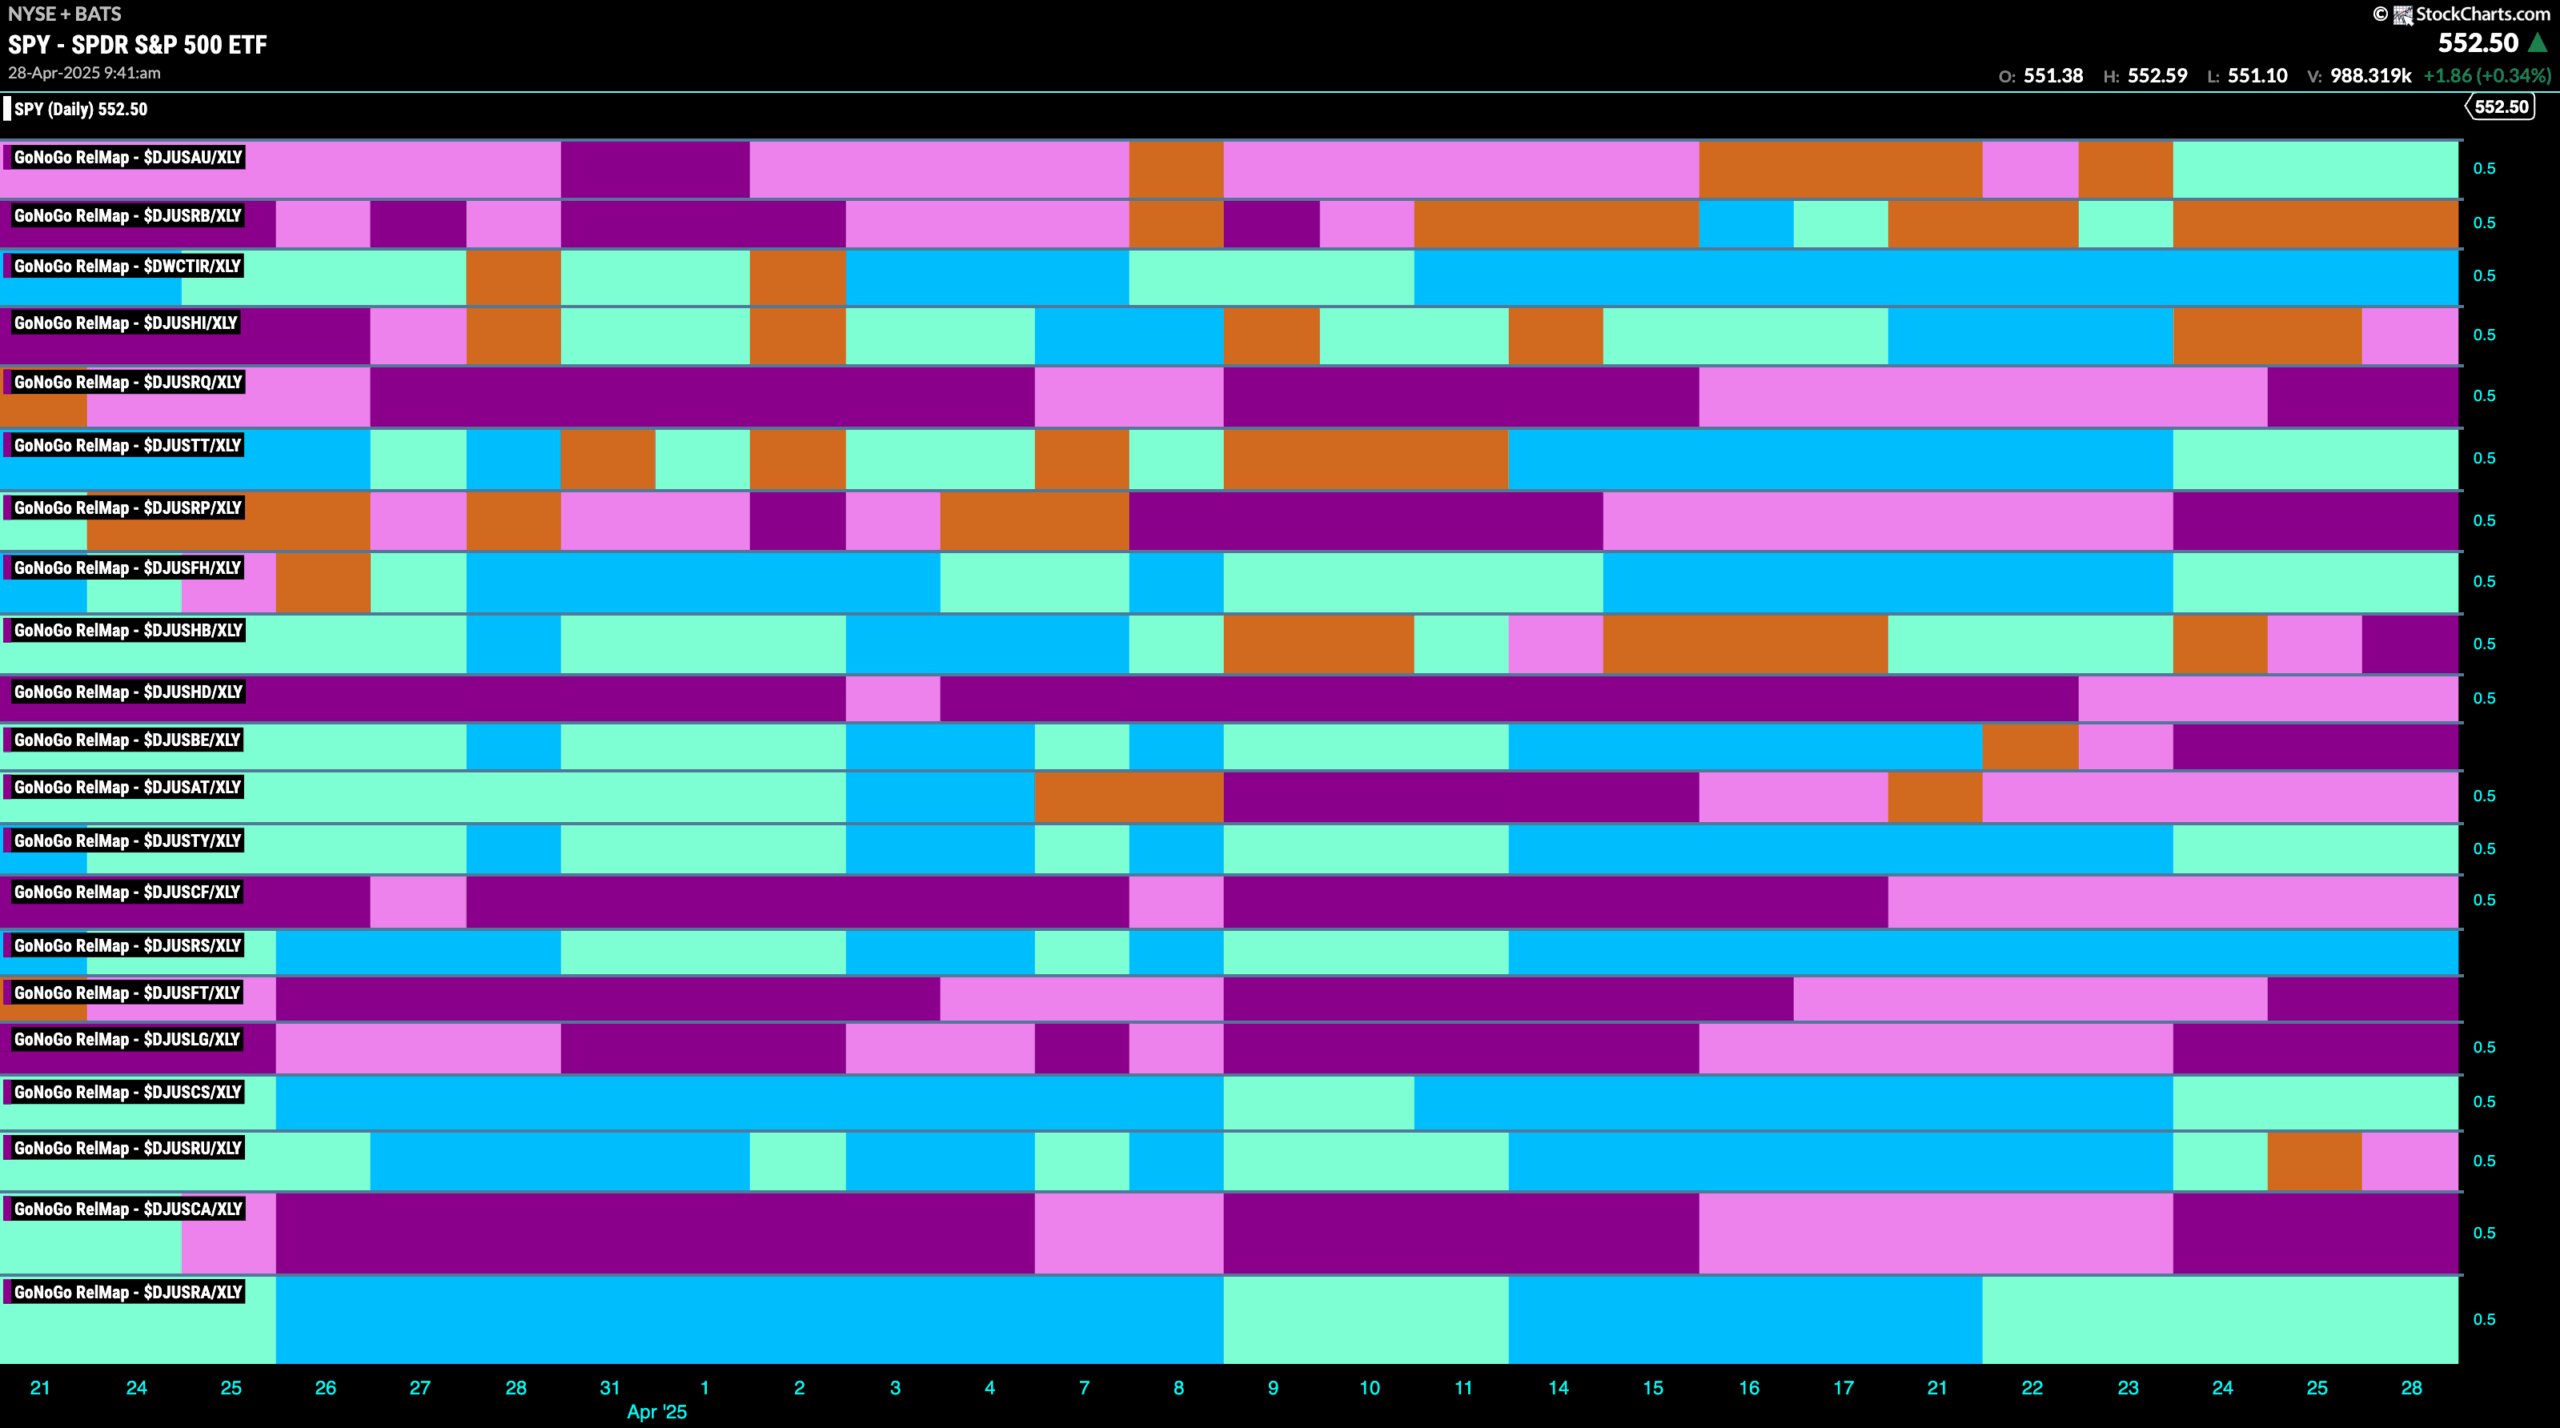
The chart below shows a relative trend breakdown of the sub groups within the discretionary sector this week. The Sub-Group RelMap plots the GoNoGo Trend of each sub index to the $XLY. We saw in the above GoNoGo Sector RelMap that $XLY is a brand new out-performer of the base index. When we look at the below RelMap we can see that in the 15th panel, the specialty retailers index has been out-performing for the entire timeframe of the chart.
$REAL Tries to Escape “NoGo” Trend
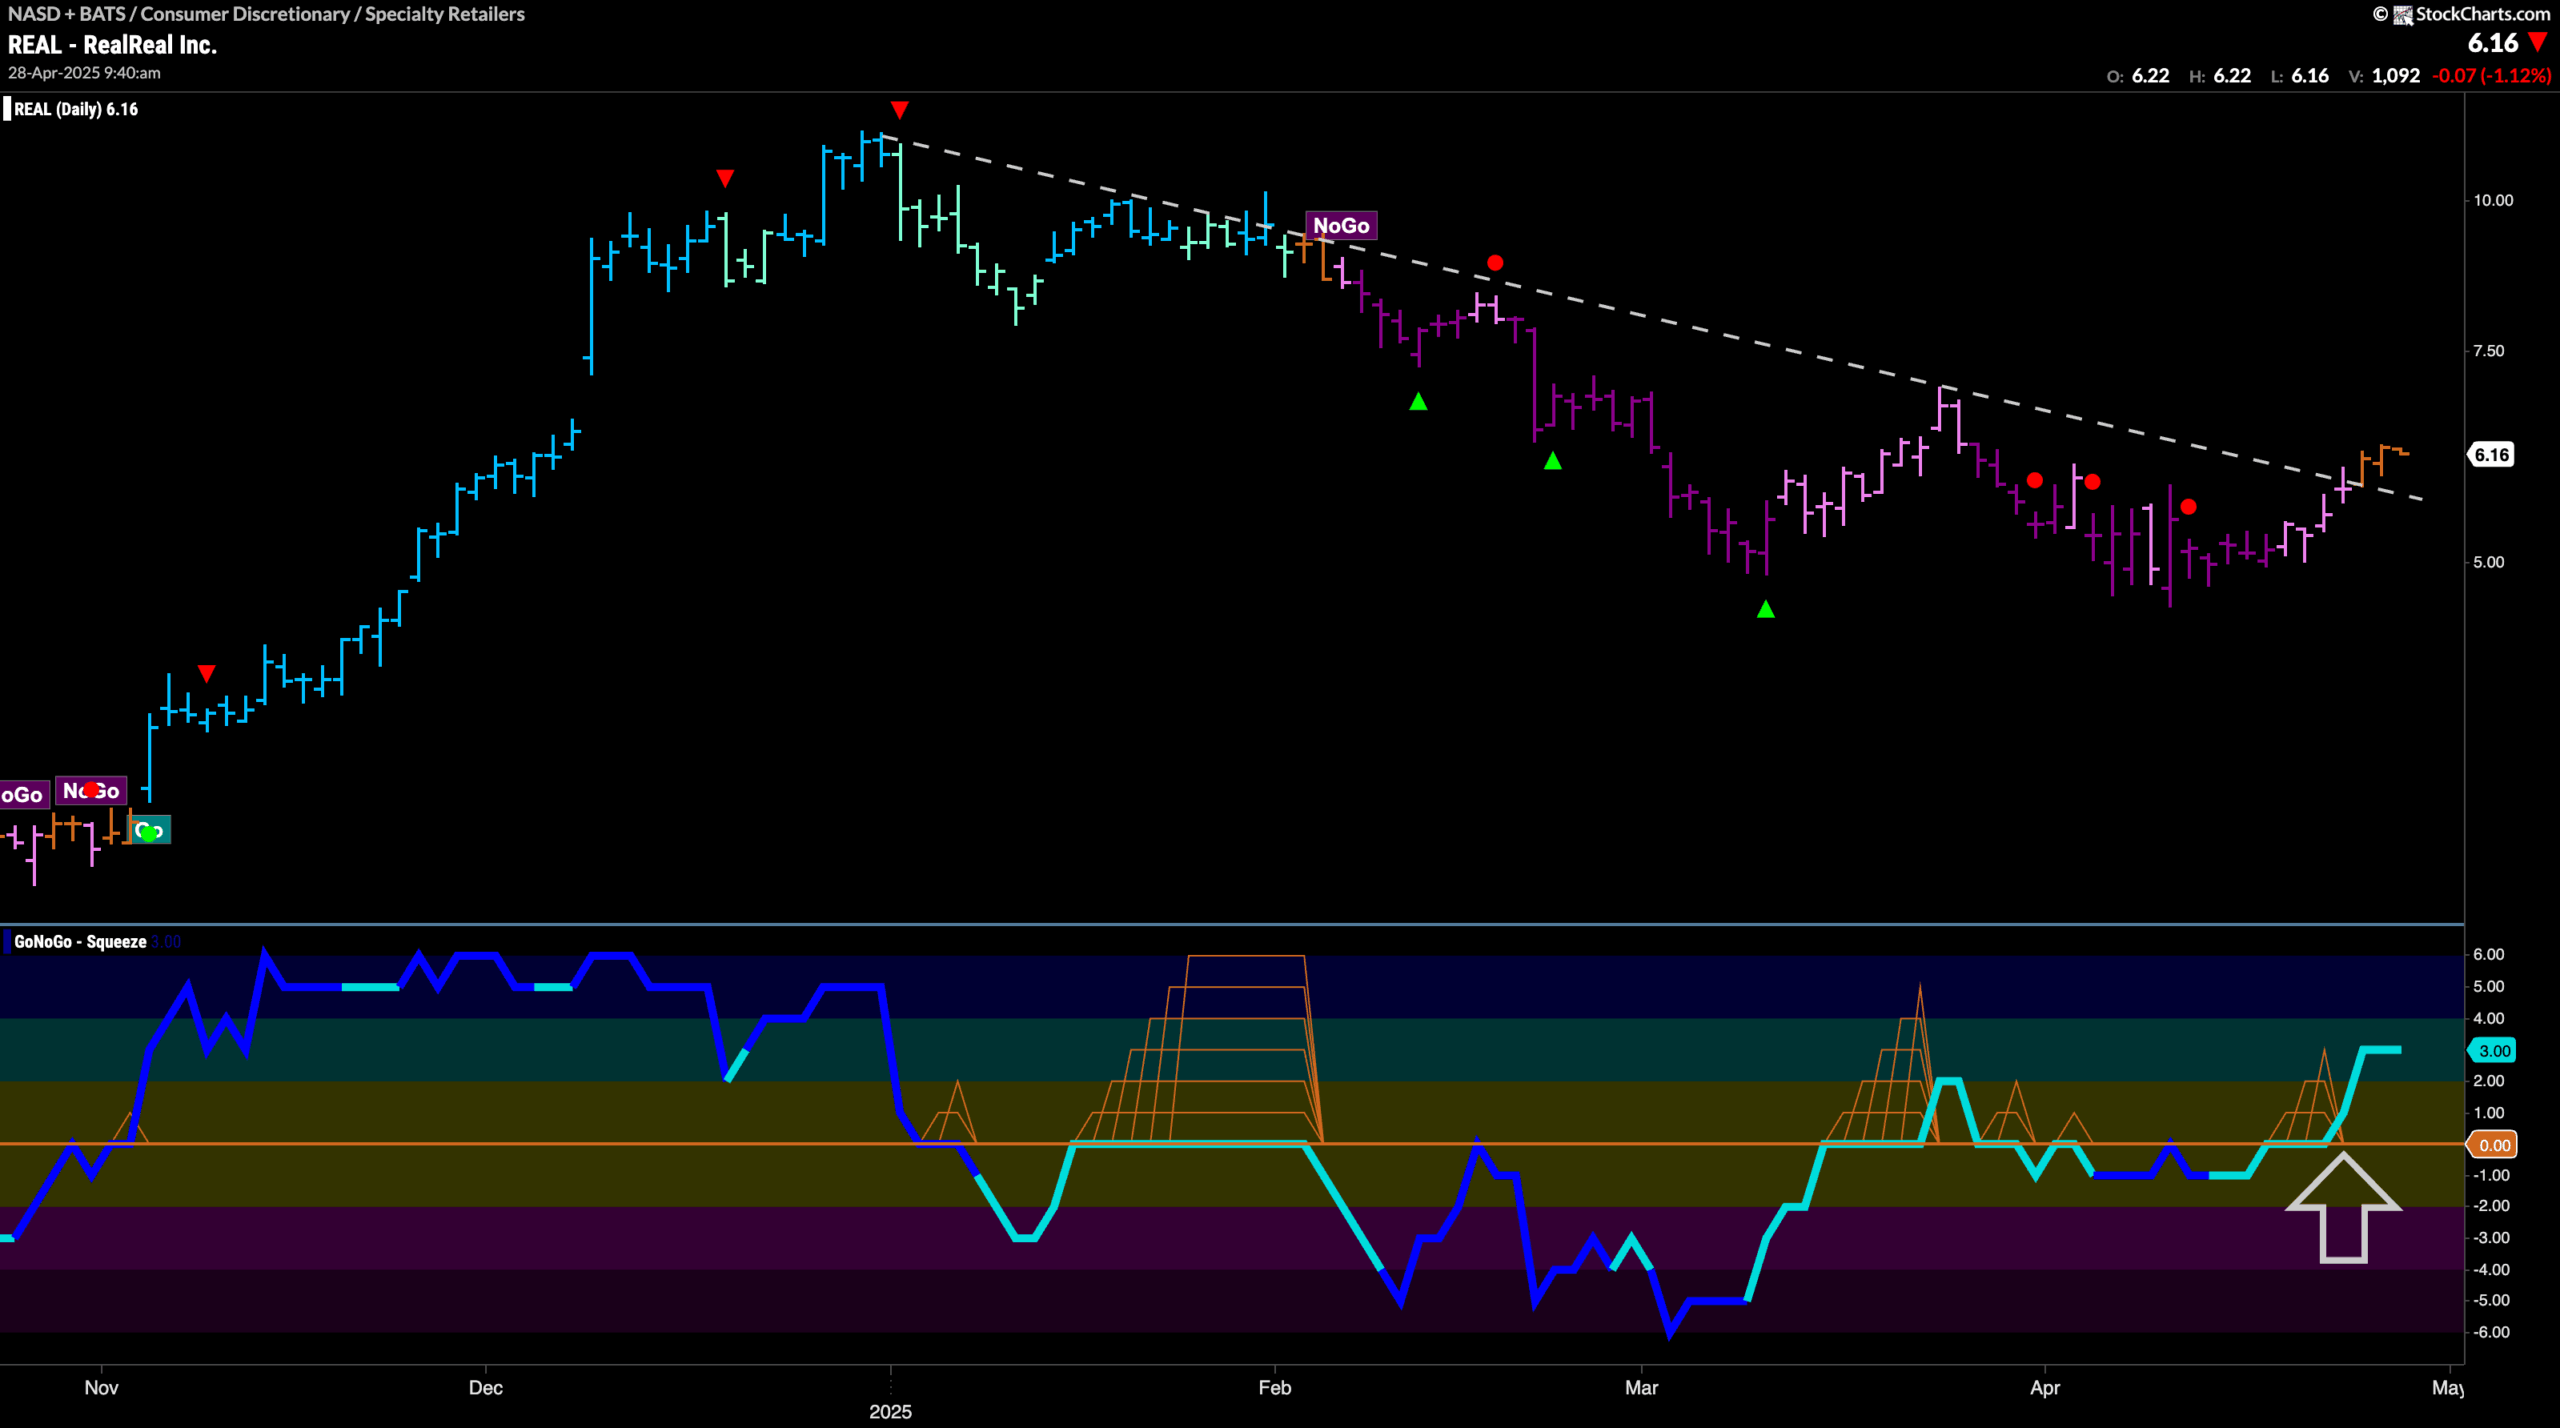
GoNoGo Trend shows that after a lengthy “NoGo” move that saw a series of lower lows and lower highs, price has rallied enough to paint amber “Go Fish” bars. Price is also breaking above a downward sloping trend line as GoNoGo Oscillator breaks above the zero line into positive territory. We will watch to see if this surge in momentum is enough to propel price higher and cause a change in trend.
$CHWY Sees New “Go” Trend Strengthen
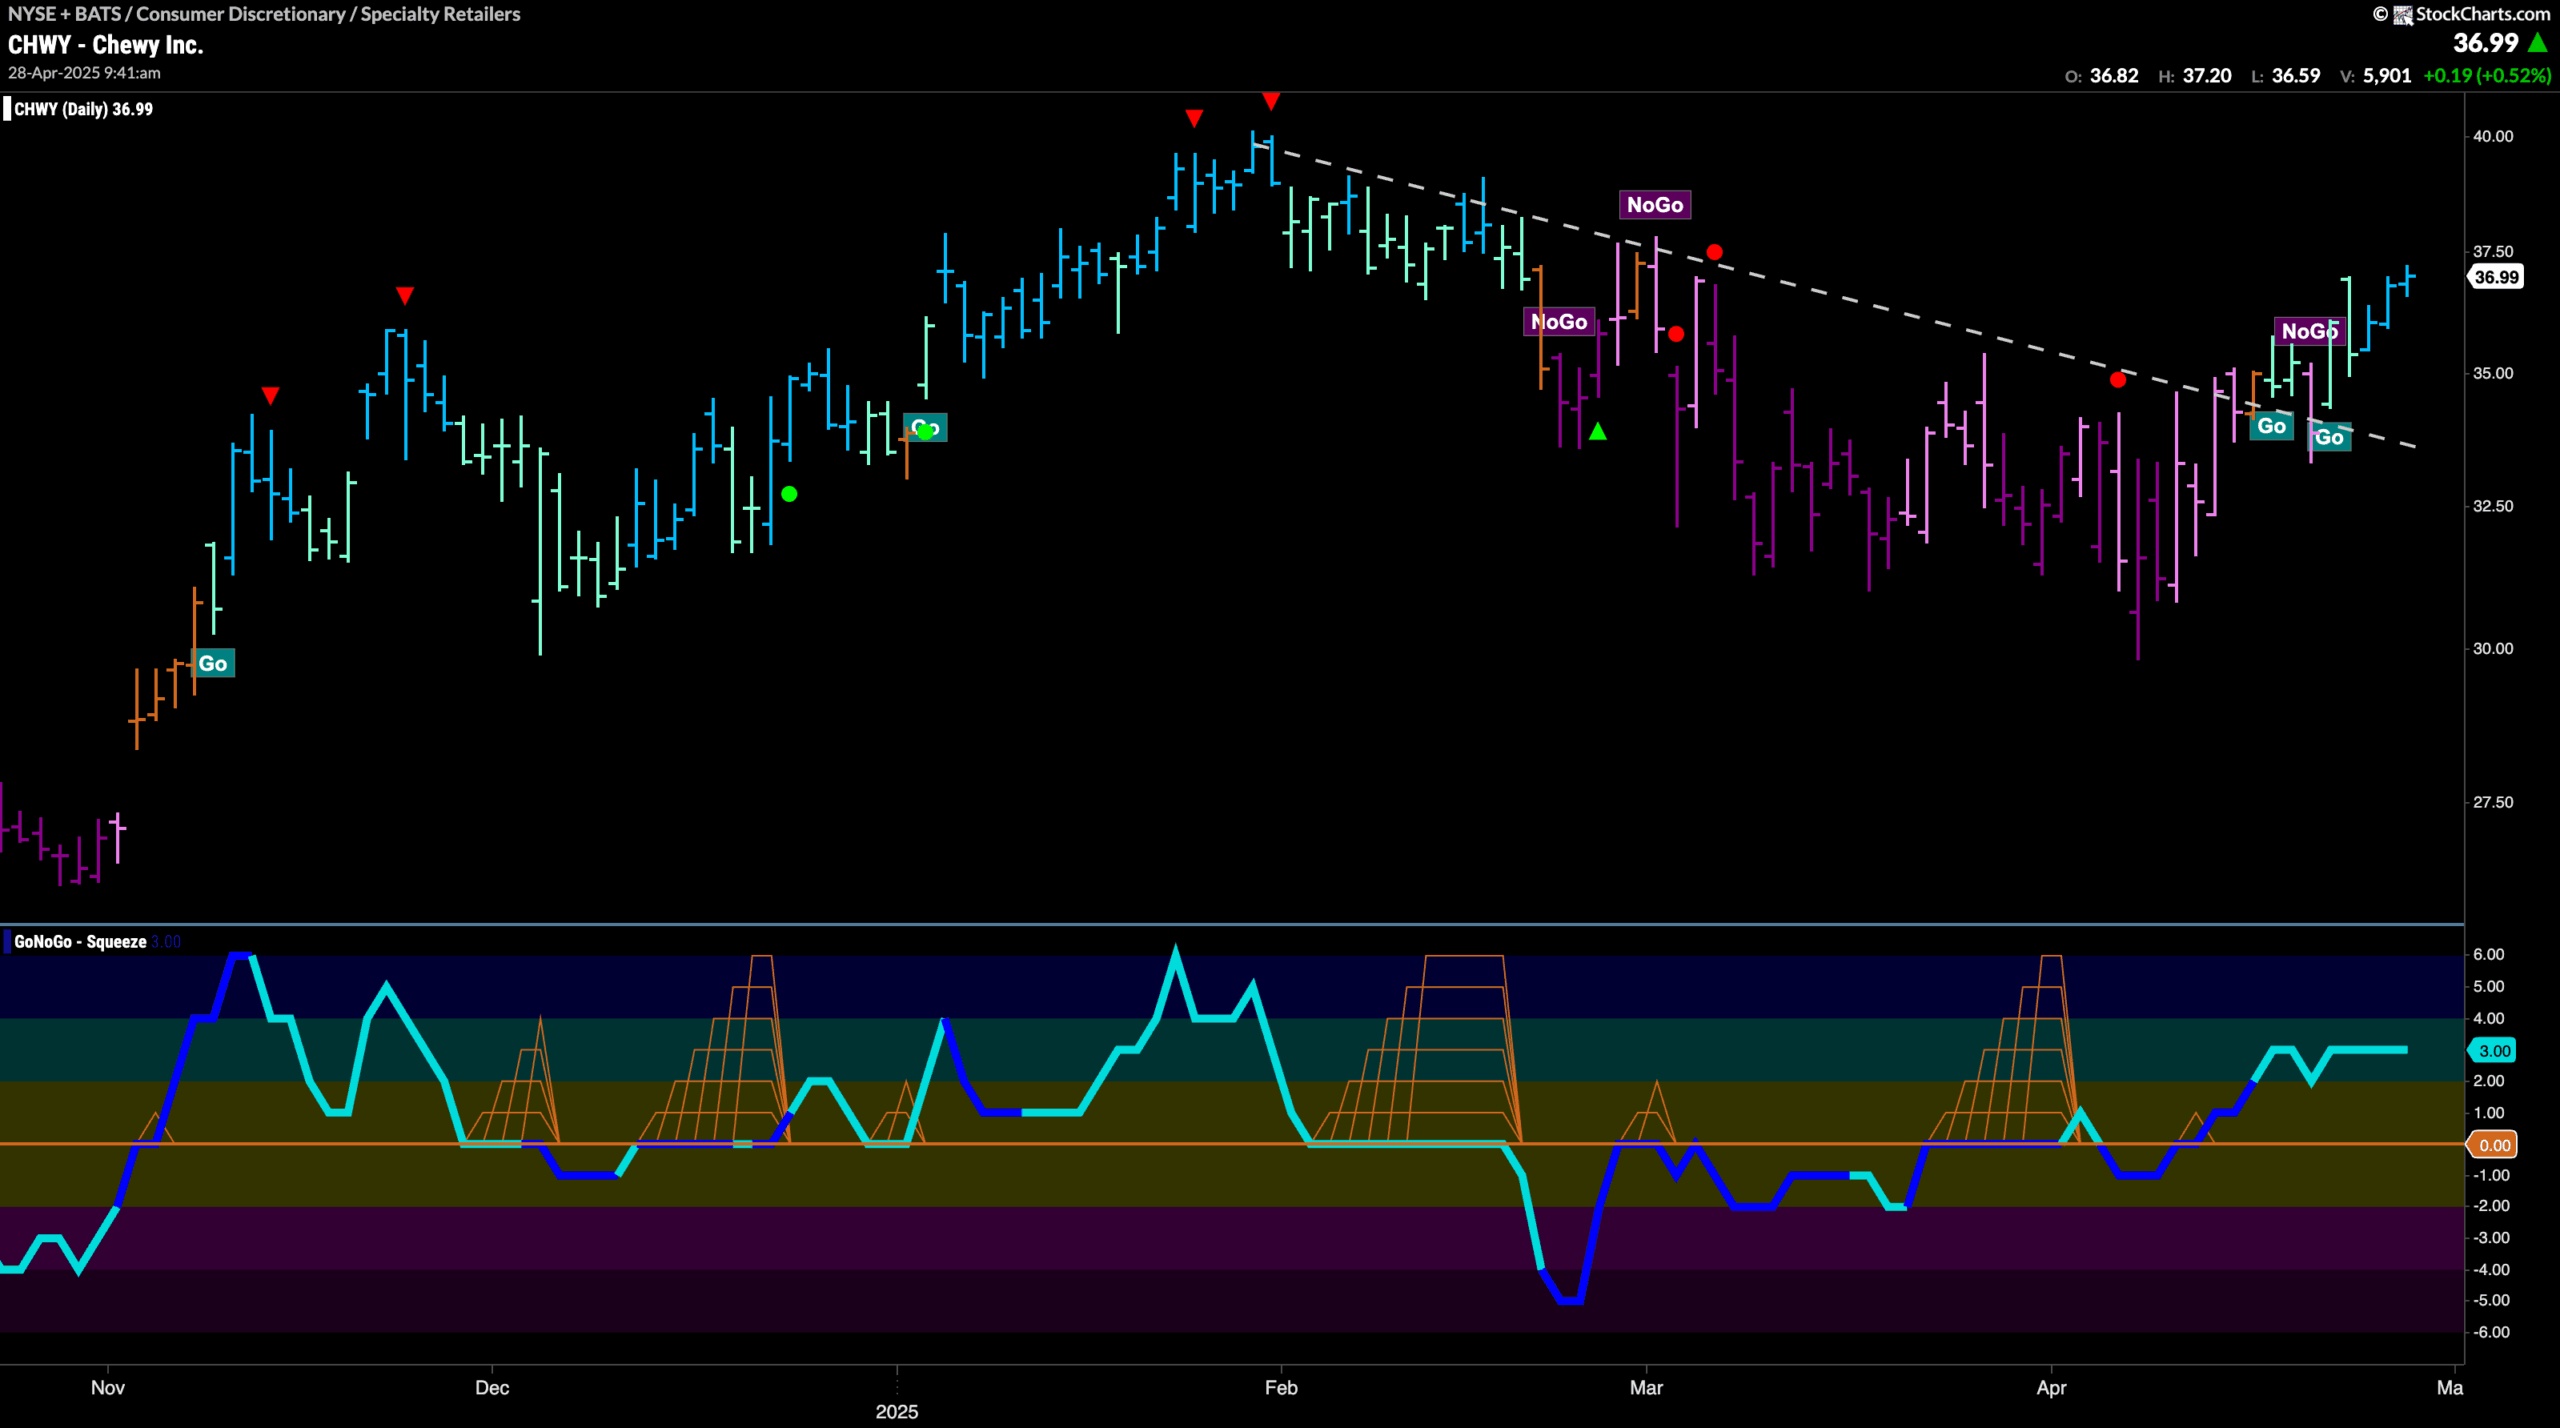
The chart below of $CHWY shows that the “Go” trend is strengthening as it paints bright blue bars. This comes after price rallied out of the “NoGo” trend and above downward sloping resistance. After a retest of that trend line, price has climbed and the “Go” trend has persisted. GoNoGo Oscillator has remained in positive territory after having broken above the zero line but is not yet overbought. With momentum on the side of the “Go” trend, we will look to see if the trend can progress from here.
