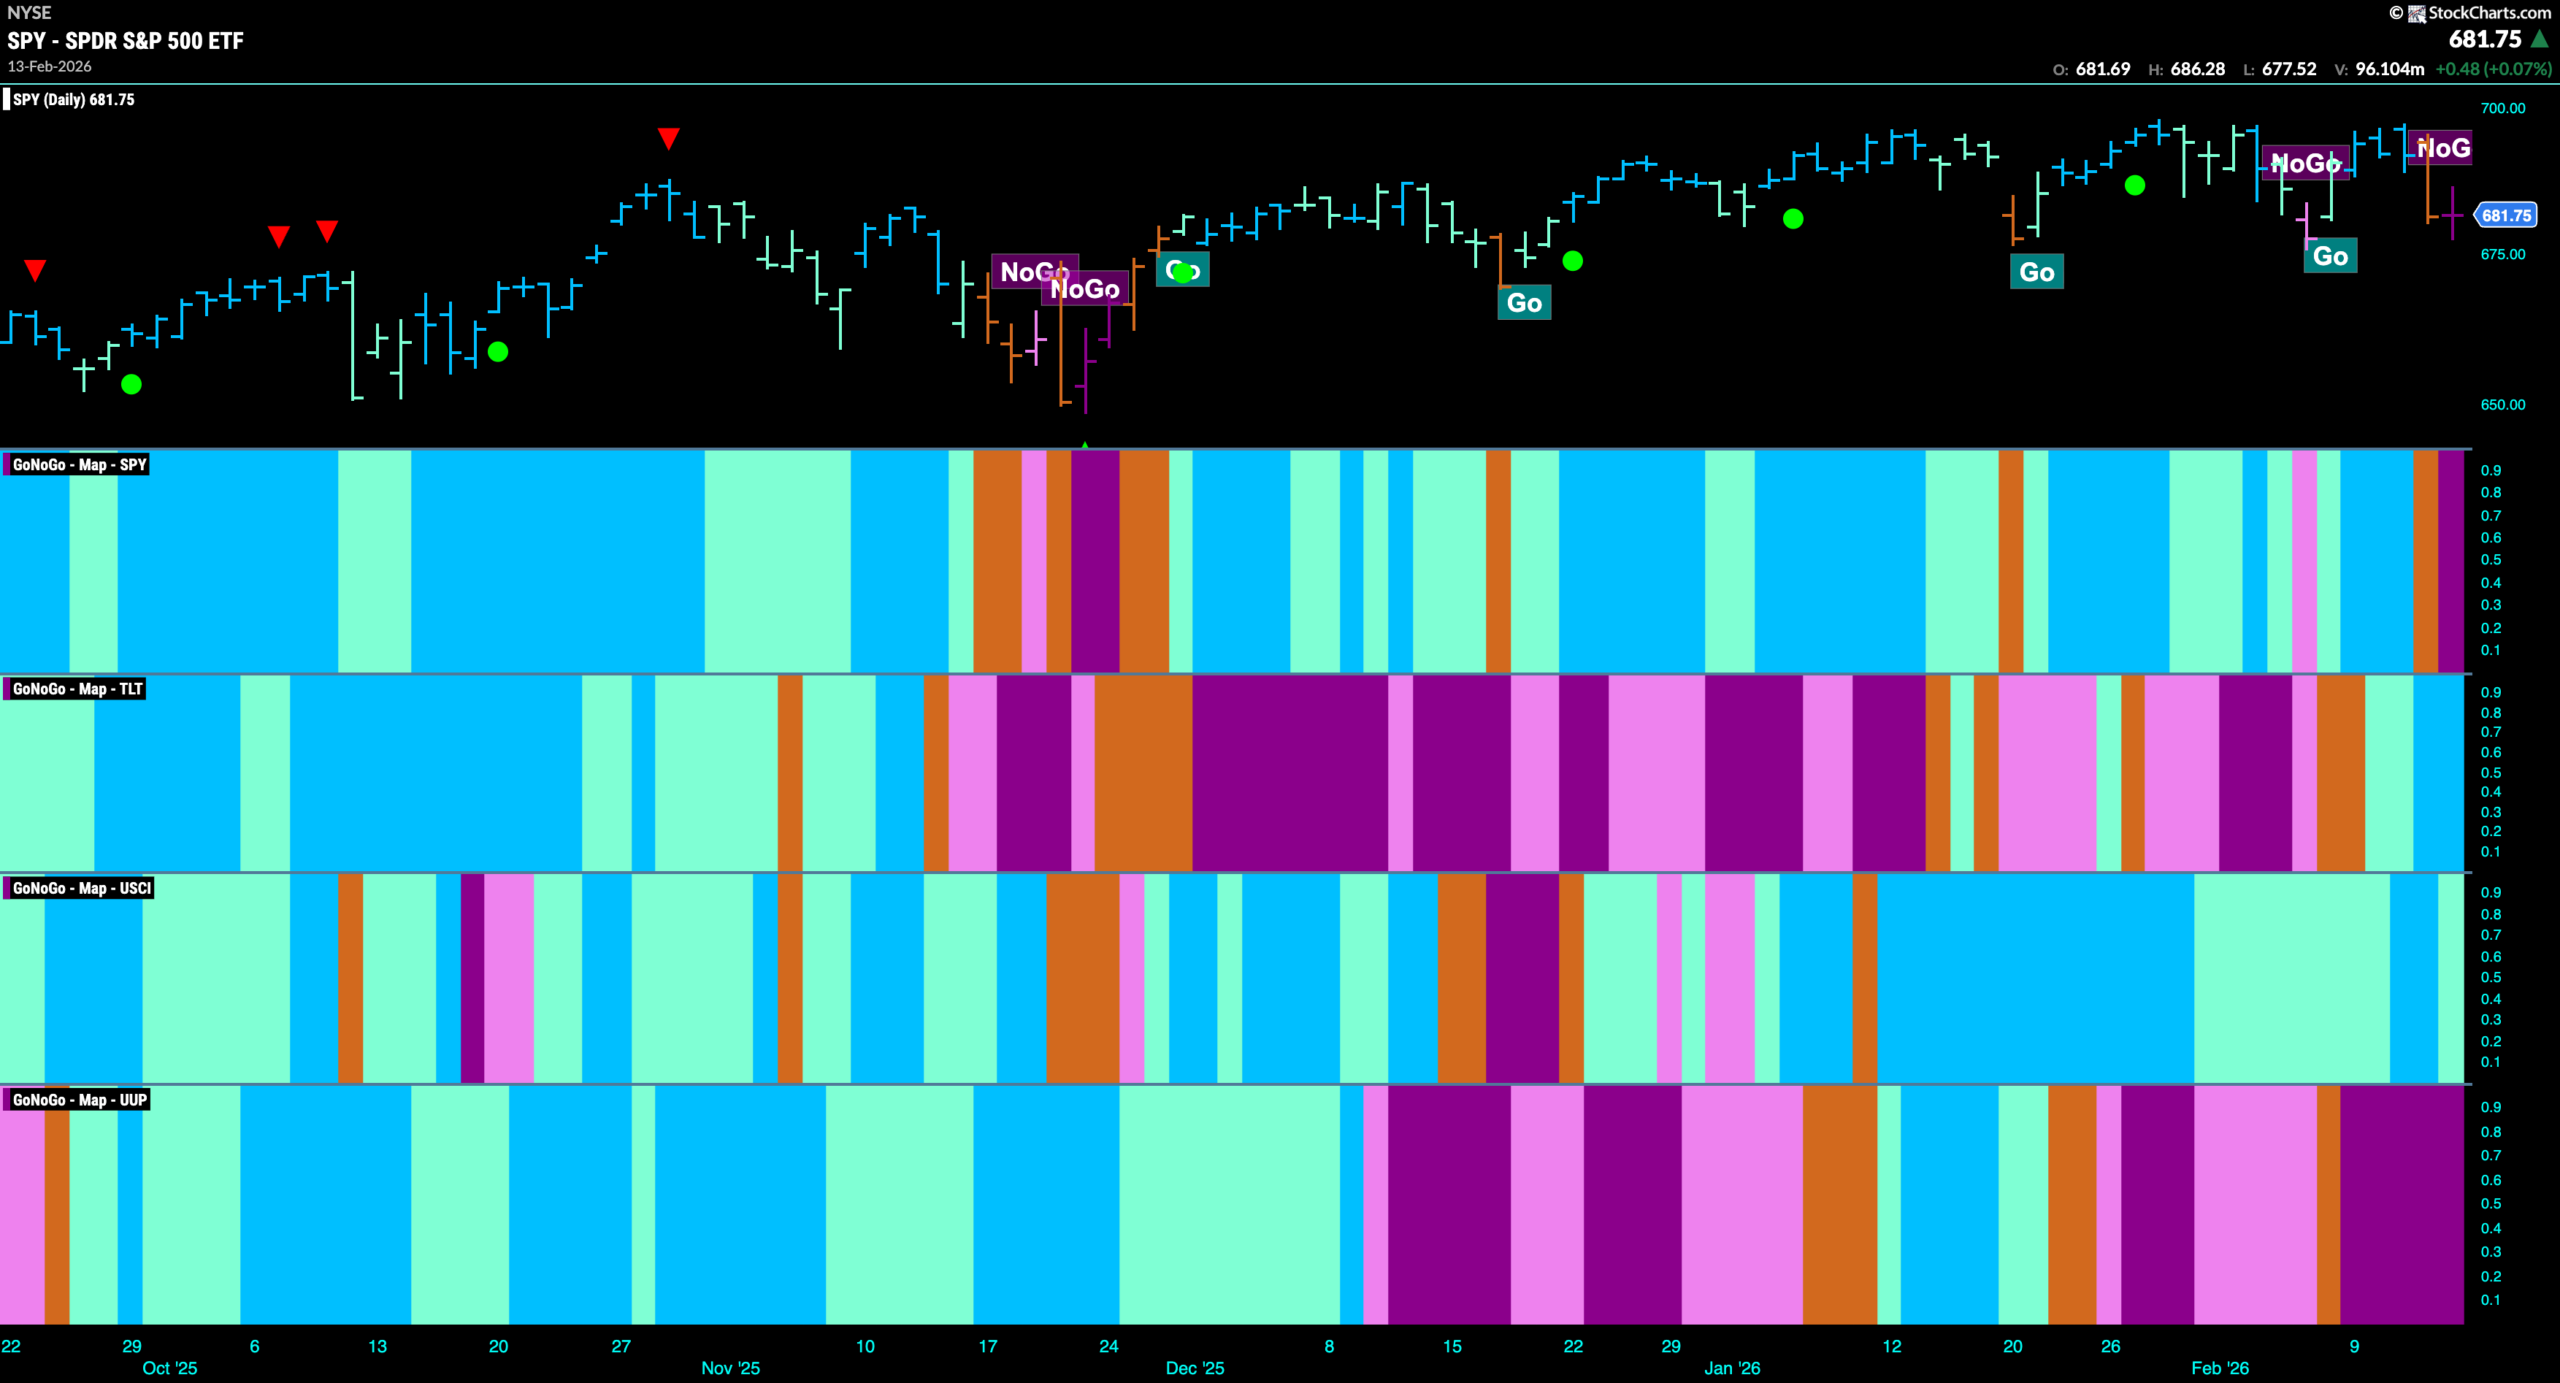
Good morning and welcome to this week’s Flight Path. Equities see the “Go” trend fail this week first with an amber “Go Fish” bar and then with a strong purple “NoGo” bar as we can see a trend change. Treasury bond prices show that the “Go” trend survived the week and indeed strengthened as we see bright blue bars. U.S. commodities remained in the “Go” trend however we saw a weaker aqua bar at the end of the week. The dollar remains in a “NoGo” trend and indeed we saw a week of uninterrupted strong purple “NoGo” bars.
$SPY Struggles and Changes Trend
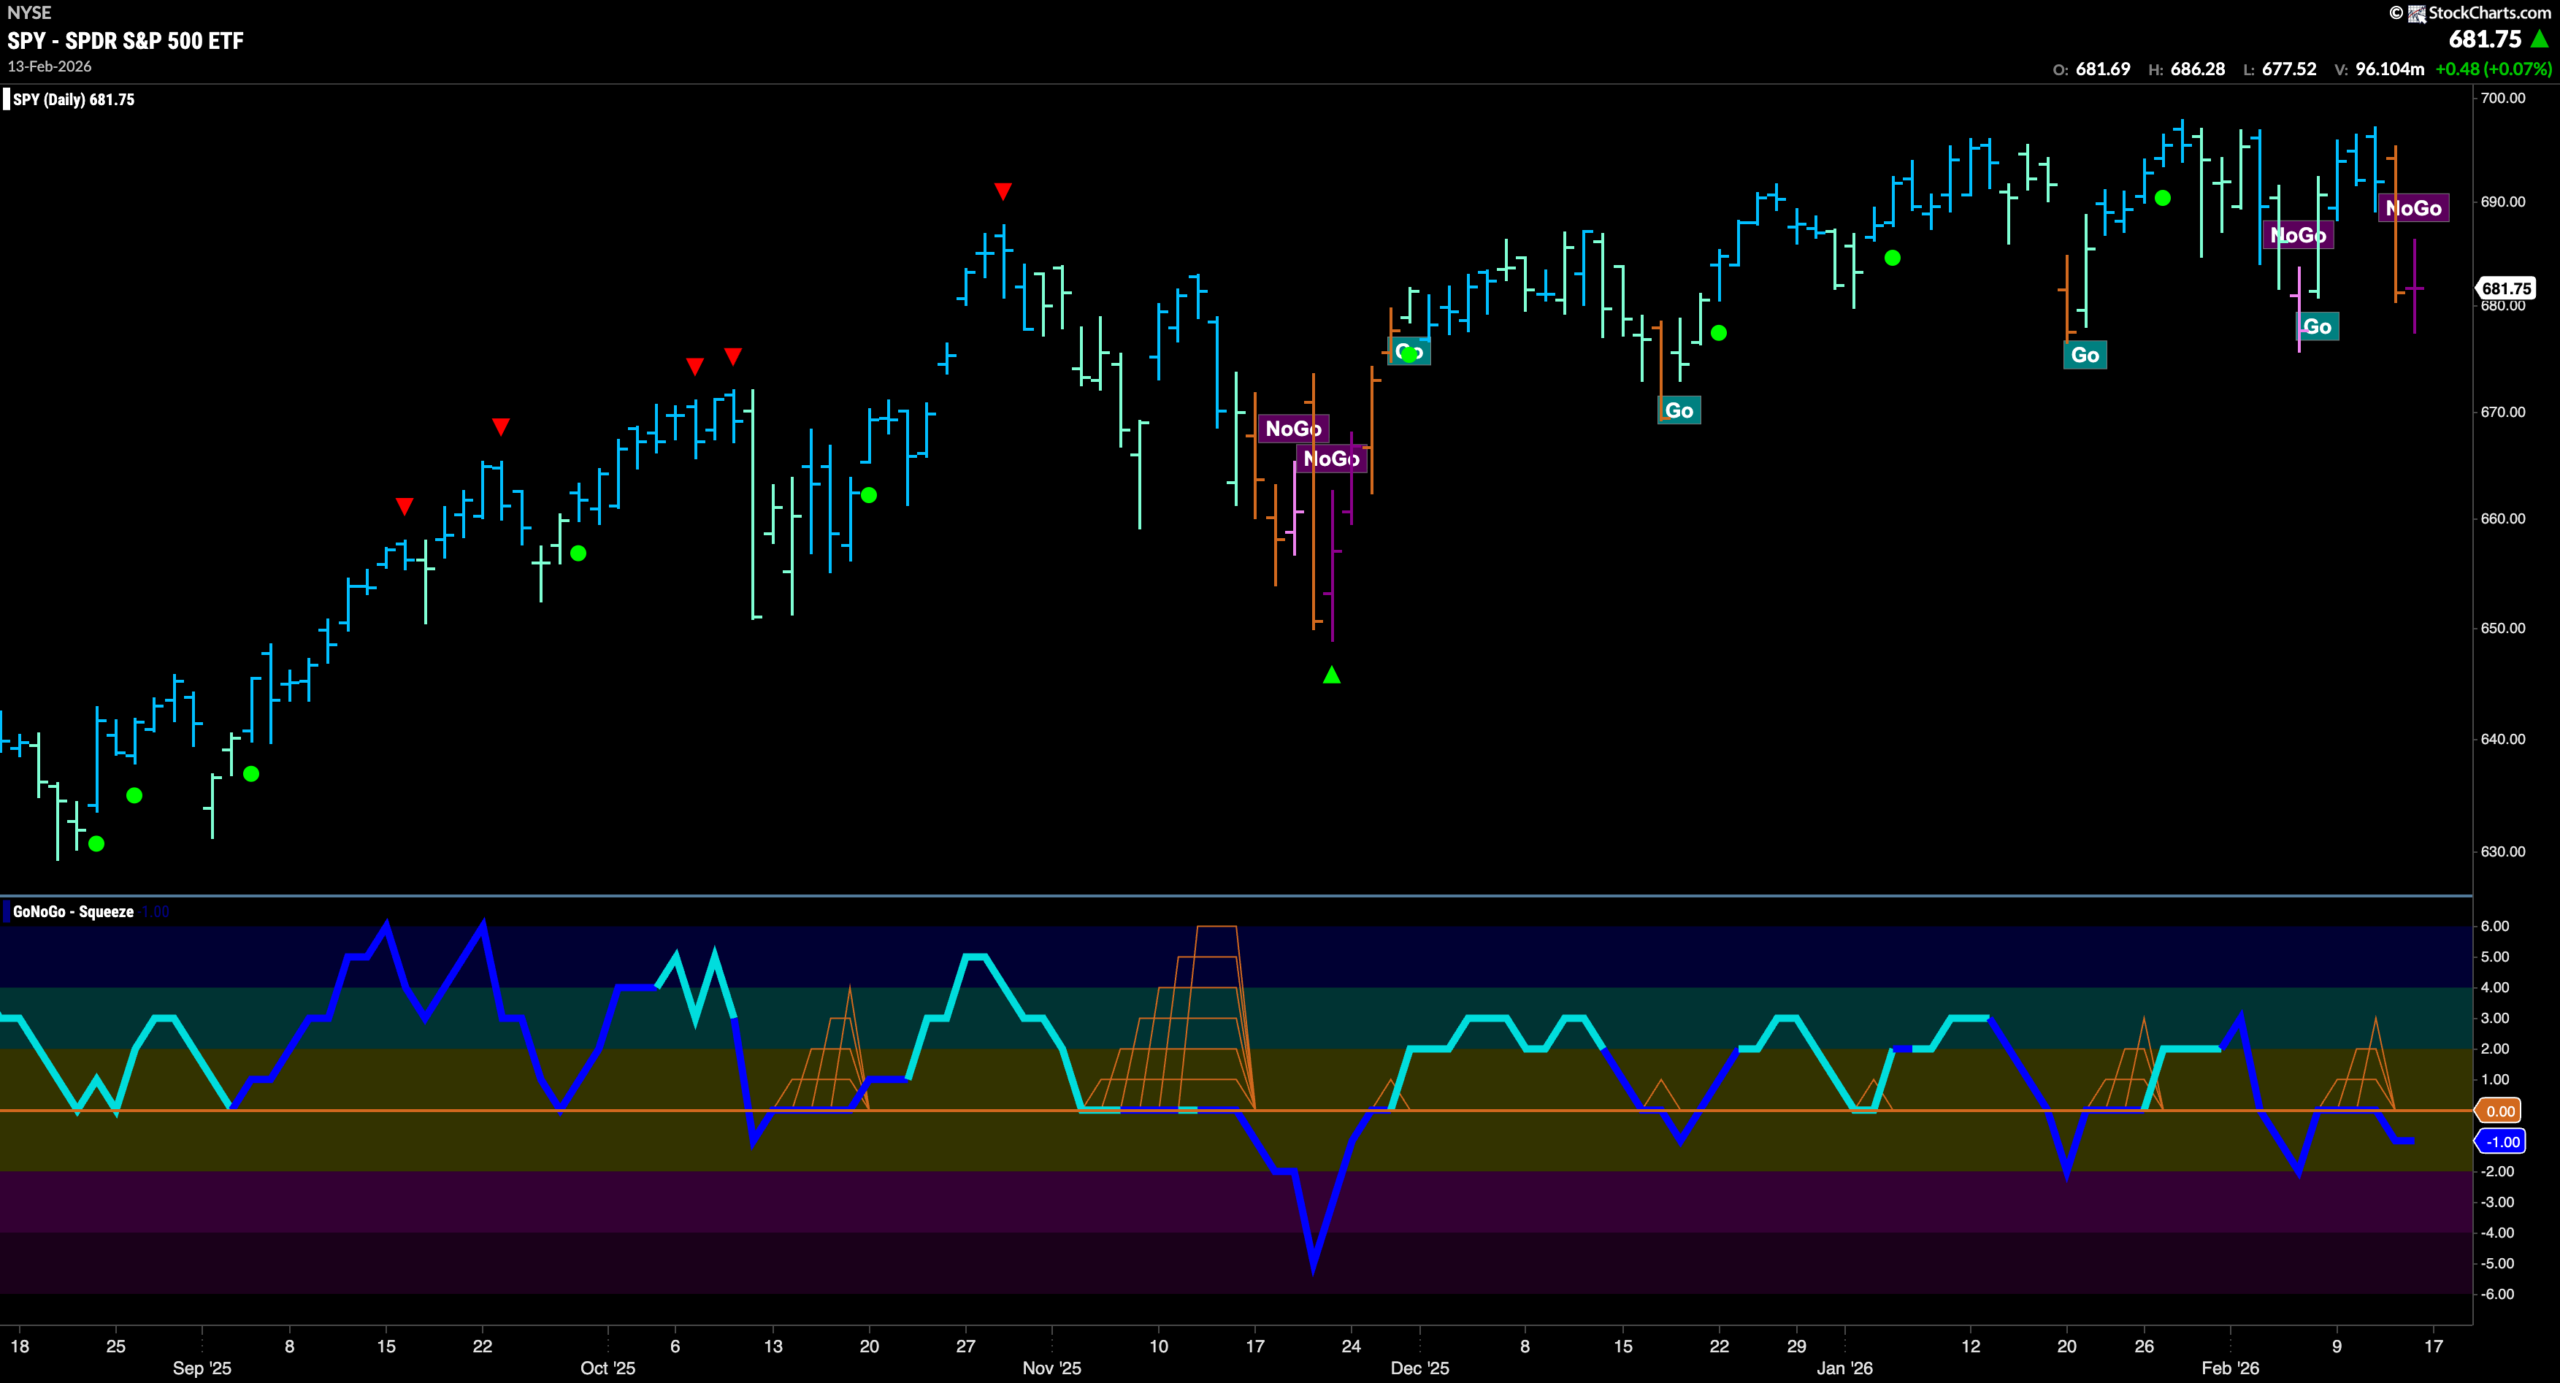
The GoNoGo chart below shows that the “Go” trend gave up this week. We saw an amber “Go Fish” bar of uncertainty that saw prices fall sharply and then on the last bar of the week a new trend emerged as GoNoGo Trend painted a strong purple bar. If we look at the lower panel, we see that GoNoGo Oscillator had broken into negative territory prior to this trend change and as it tested the zero level from below and failed, we knew that momentum had been a leading indicator to the trend change.
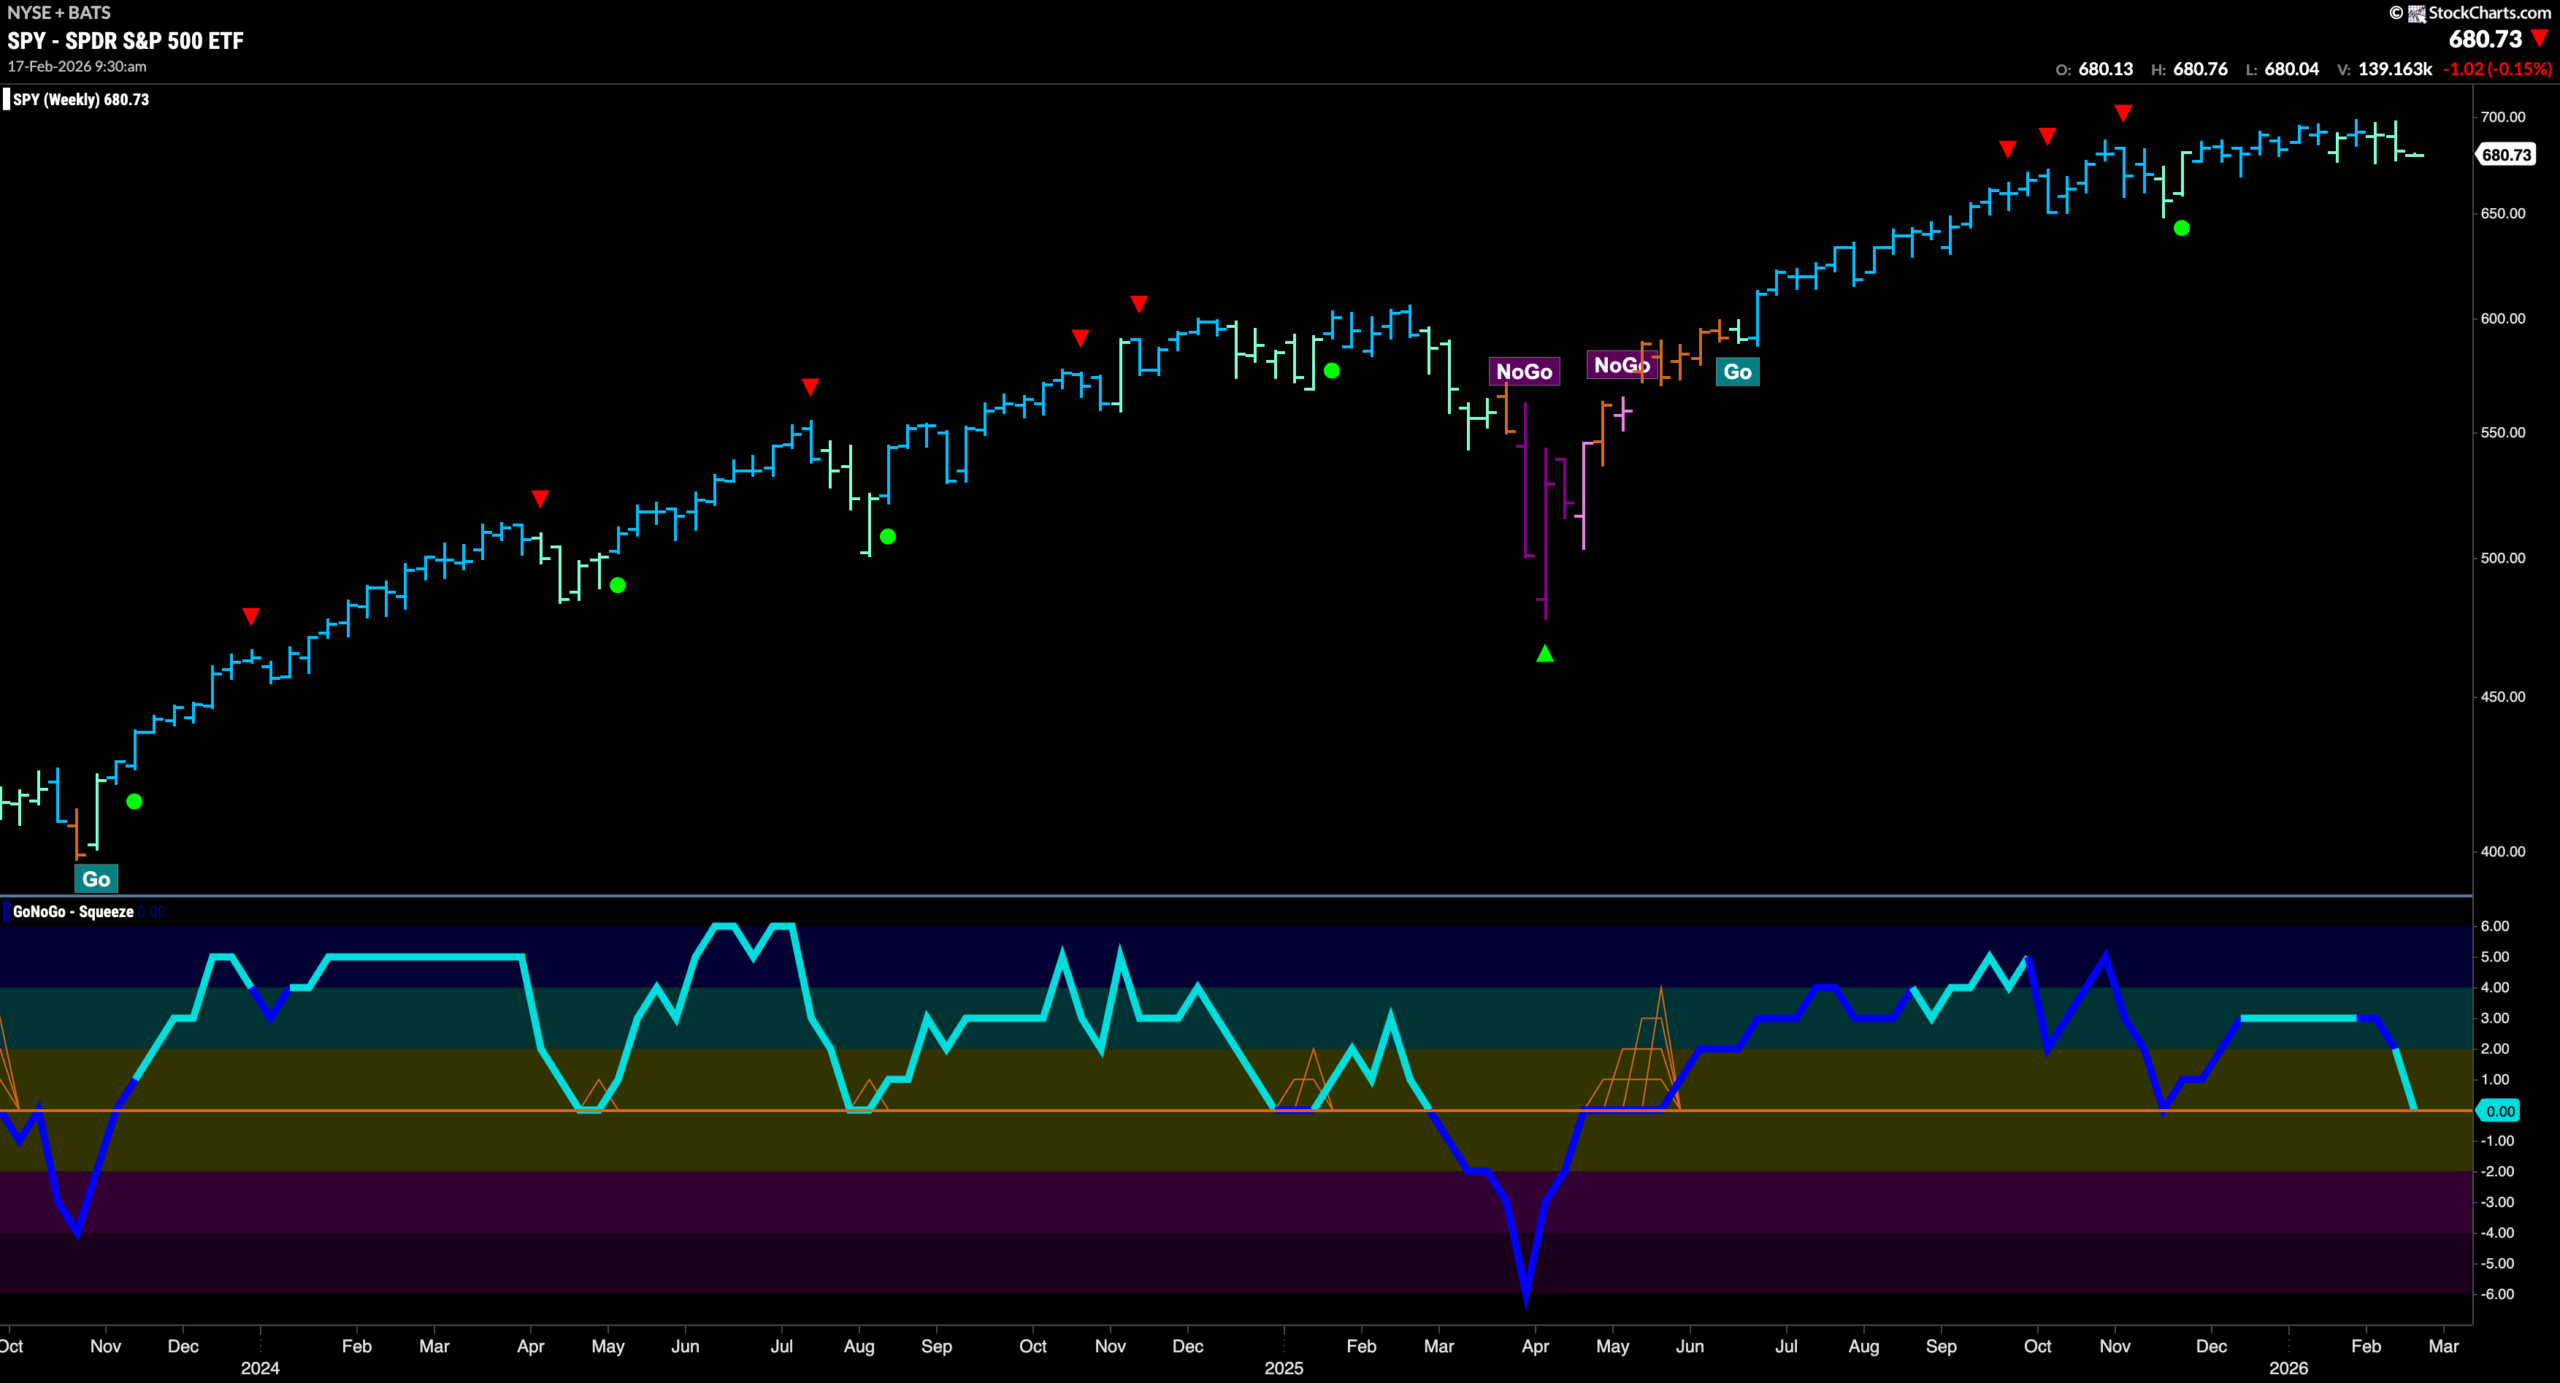
The weekly chart shows that on the larger time frame we see continued weakness as price moves sideways and is unable to make a higher high. GoNoGo Trend paints another weaker aqua bar. GoNoGo Oscillator has fallen to test the zero line from above and it will be important for the long term health of the trend to see if it finds support at this level. If it fails, and falls into negative territory we could expect a deeper correction.
Treasury Rates Fall Sharply
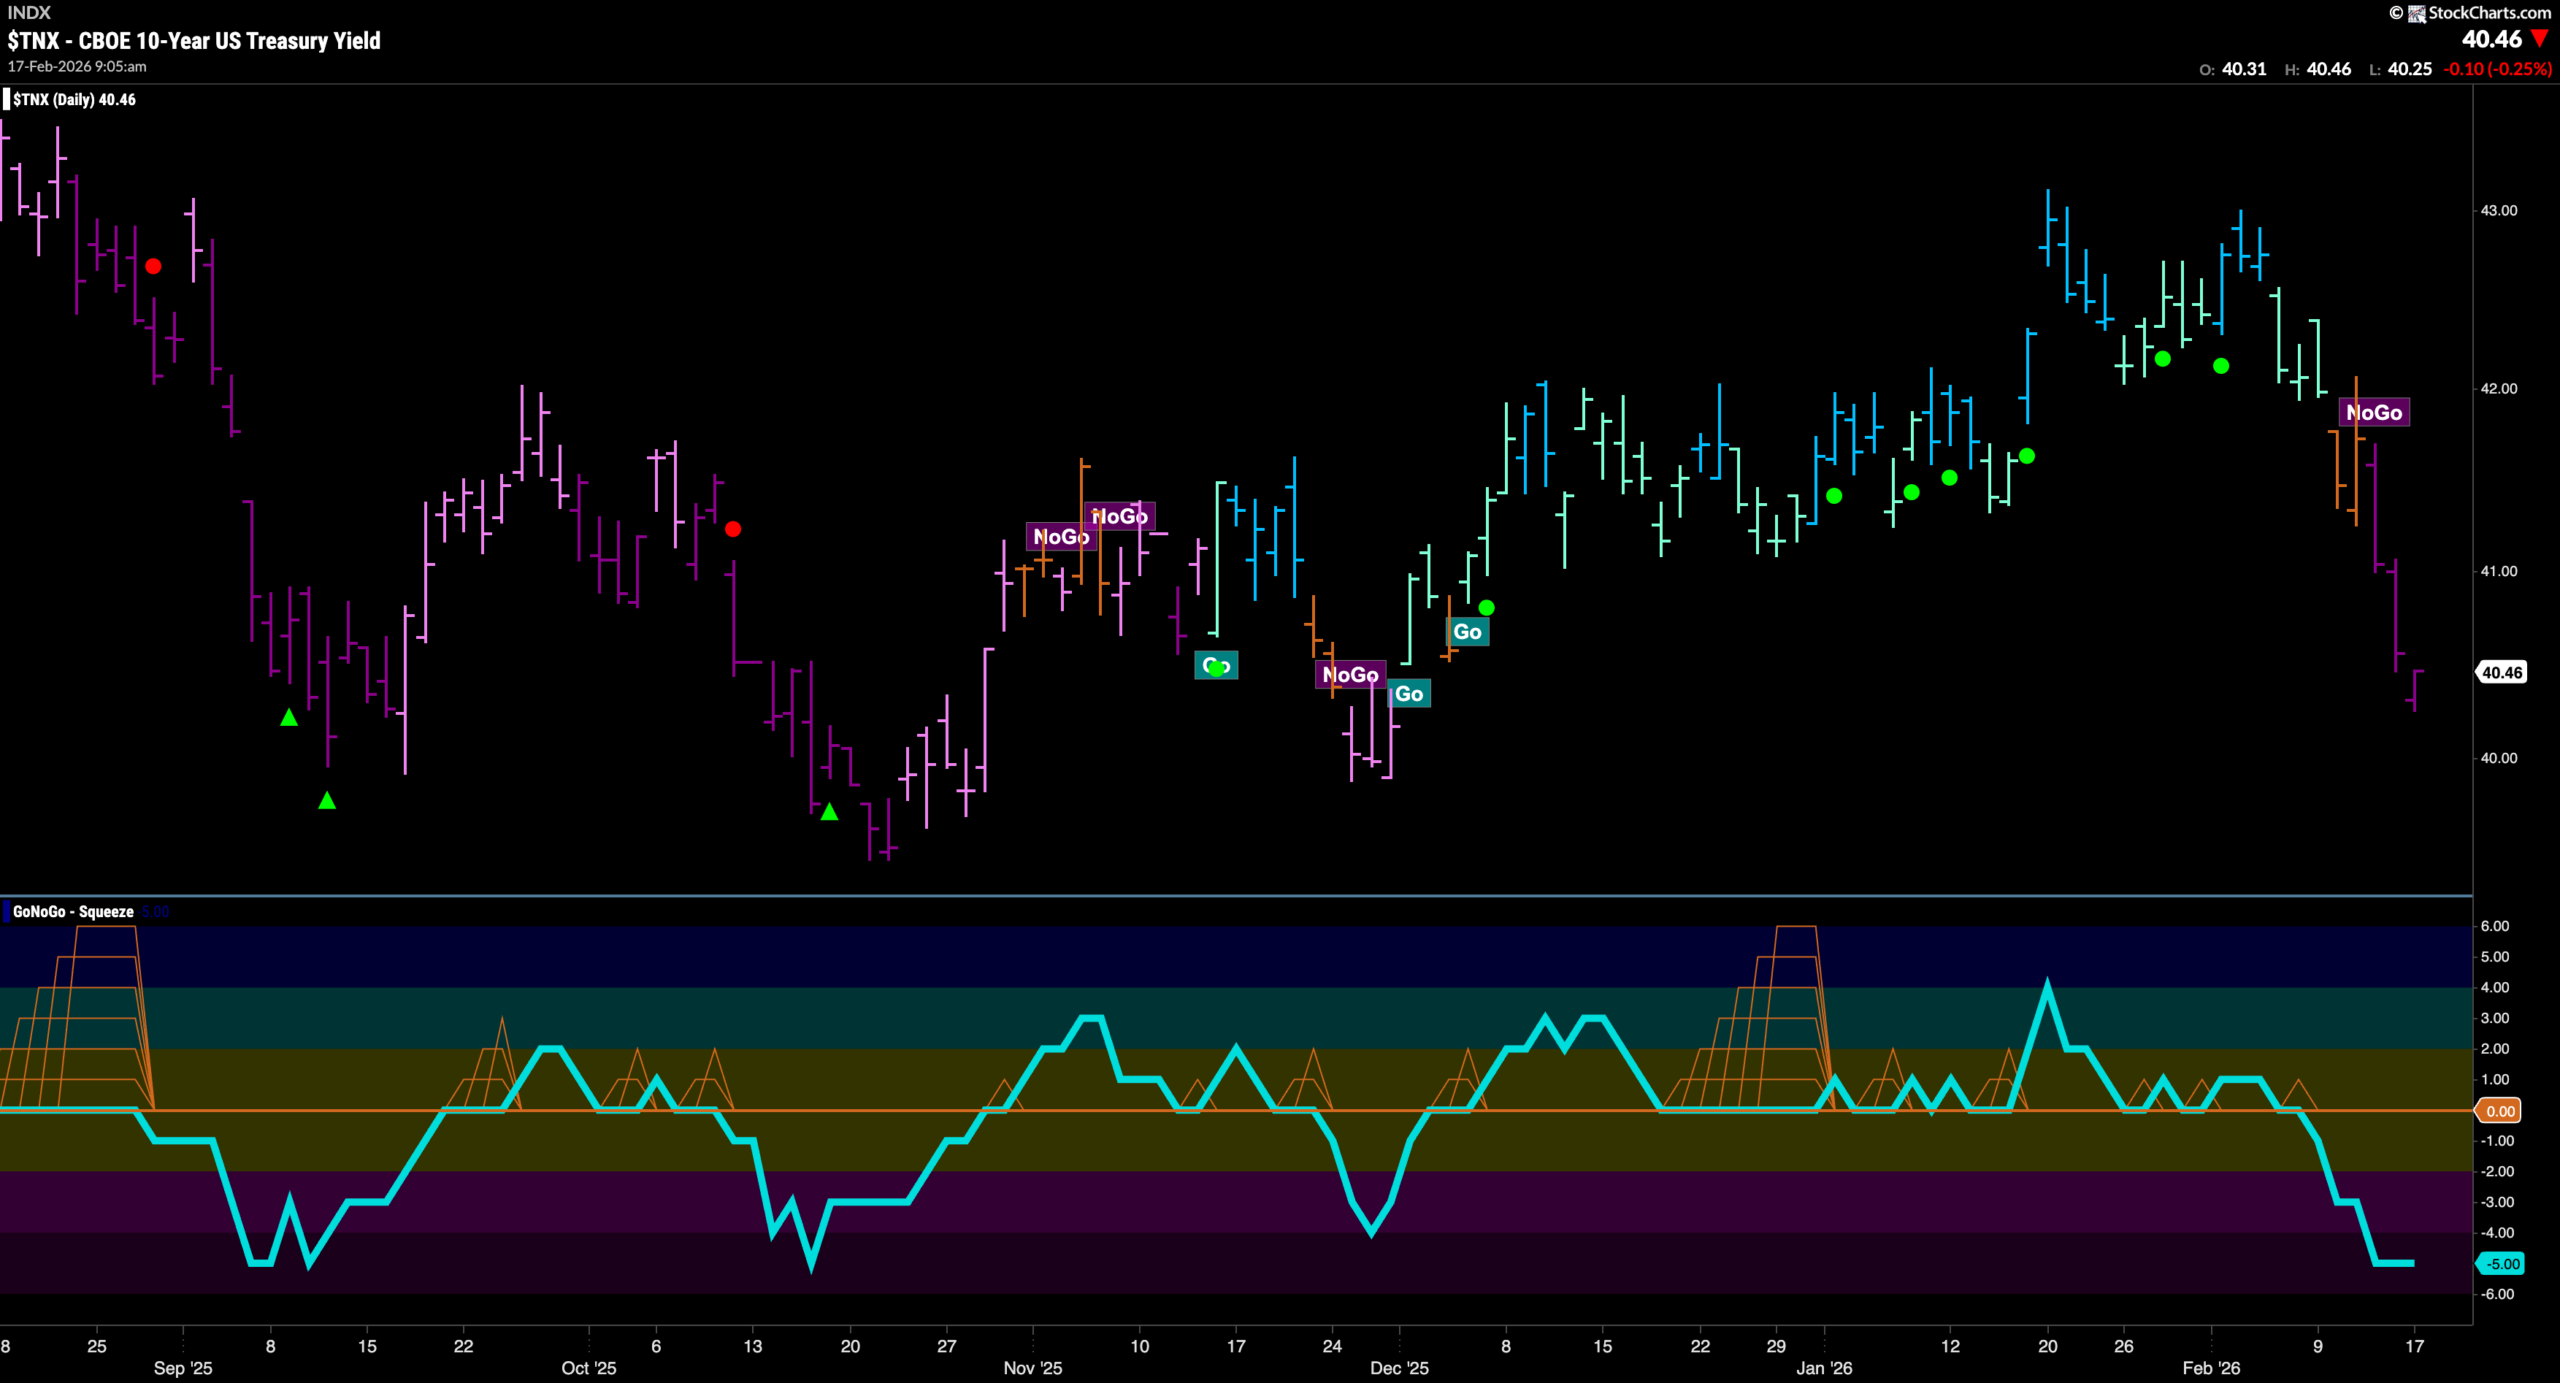
GoNoGo Trend shows the trend changed this week as we first saw a couple of amber “Go Fish” bars of uncertainty. These amber bars are painted when there are not enough GoNoGo criteria being met behind the scenes to identify a trend direction either up or down. These “Go Fish” bars often happen at transitions. Indeed, they were followed in this case by a new “NoGo” trend. Now we see the indicator painting strong purple bars.
Dollar Remains in Trend
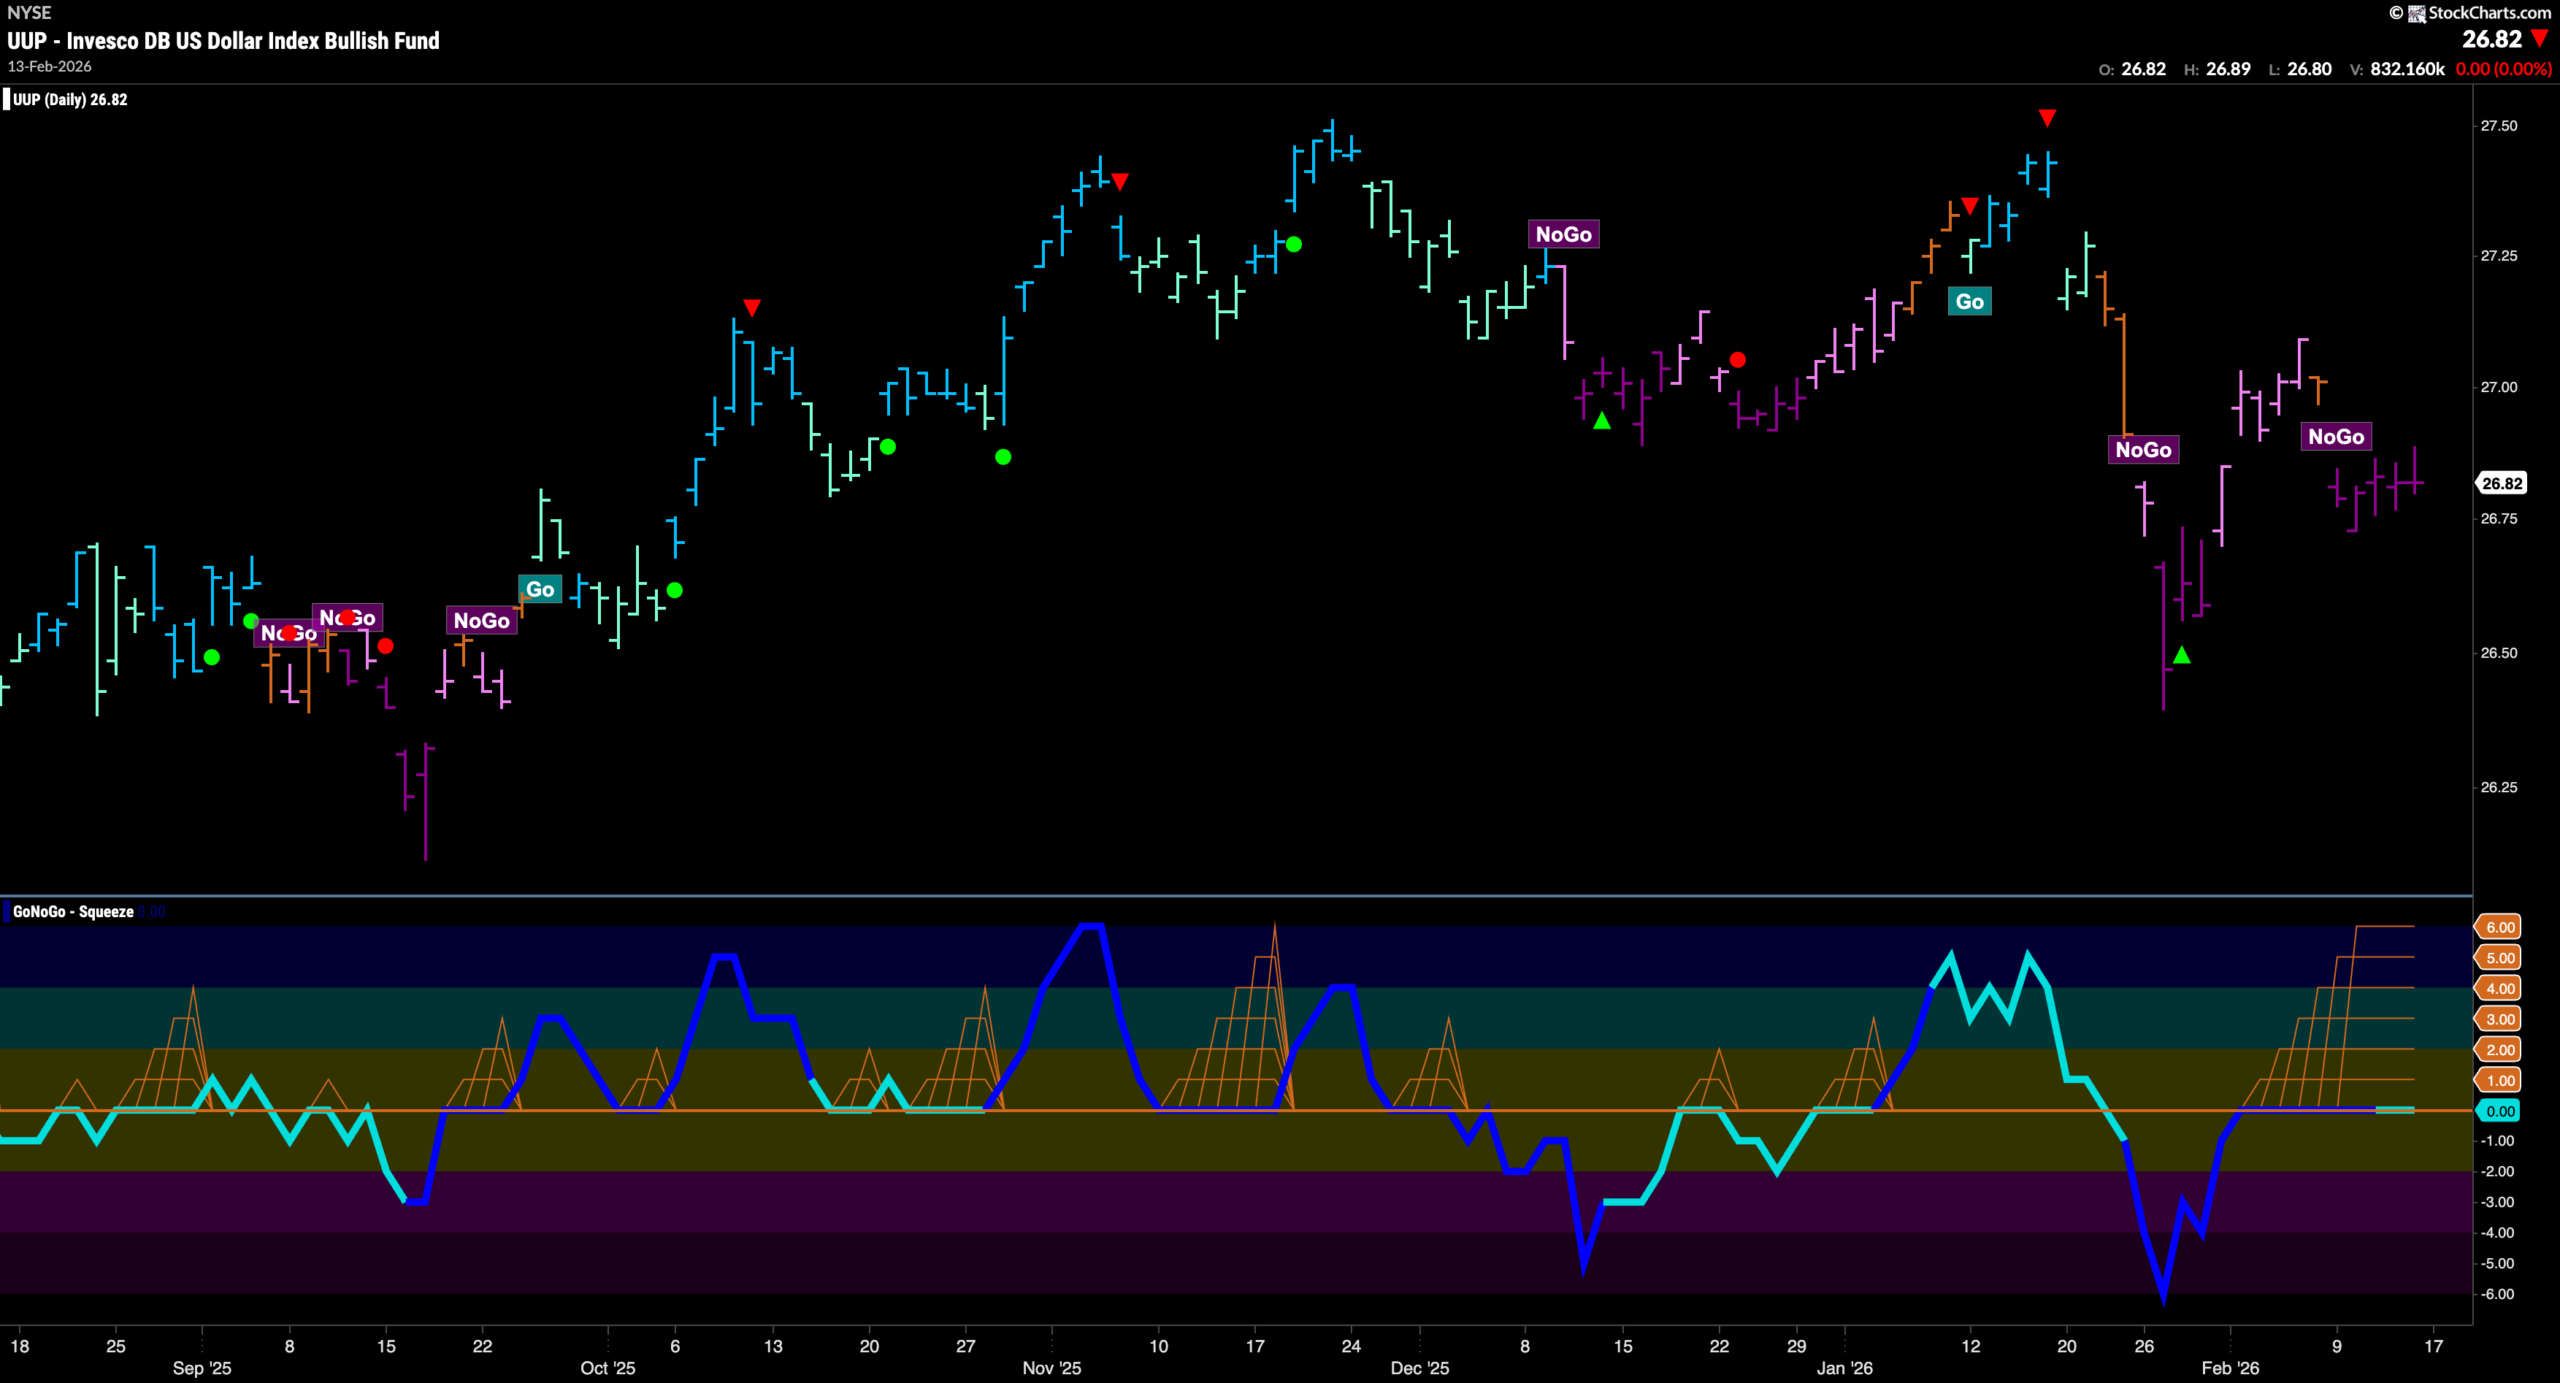
The chart below shows that the dollar remained in a “NoGo” trend and indeed we saw price fall lower after an amber “Go Fish” bar. We also see that last weeks rally has set a new lower high. GoNoGo Trend is painting strong purple bars now as we watch to see if prices fall to test prior lows. Looking at the oscillator panel, we can see that GoNoGo Oscillator has been riding the zero line for some time and we see an extended Max GoNoGo Squeeze. It will be important to note the direction of the next break. If the Squeeze is broken into negative territory then we will expect price to fall further in the coming days.
Oil Remains in Trend Looking for Support
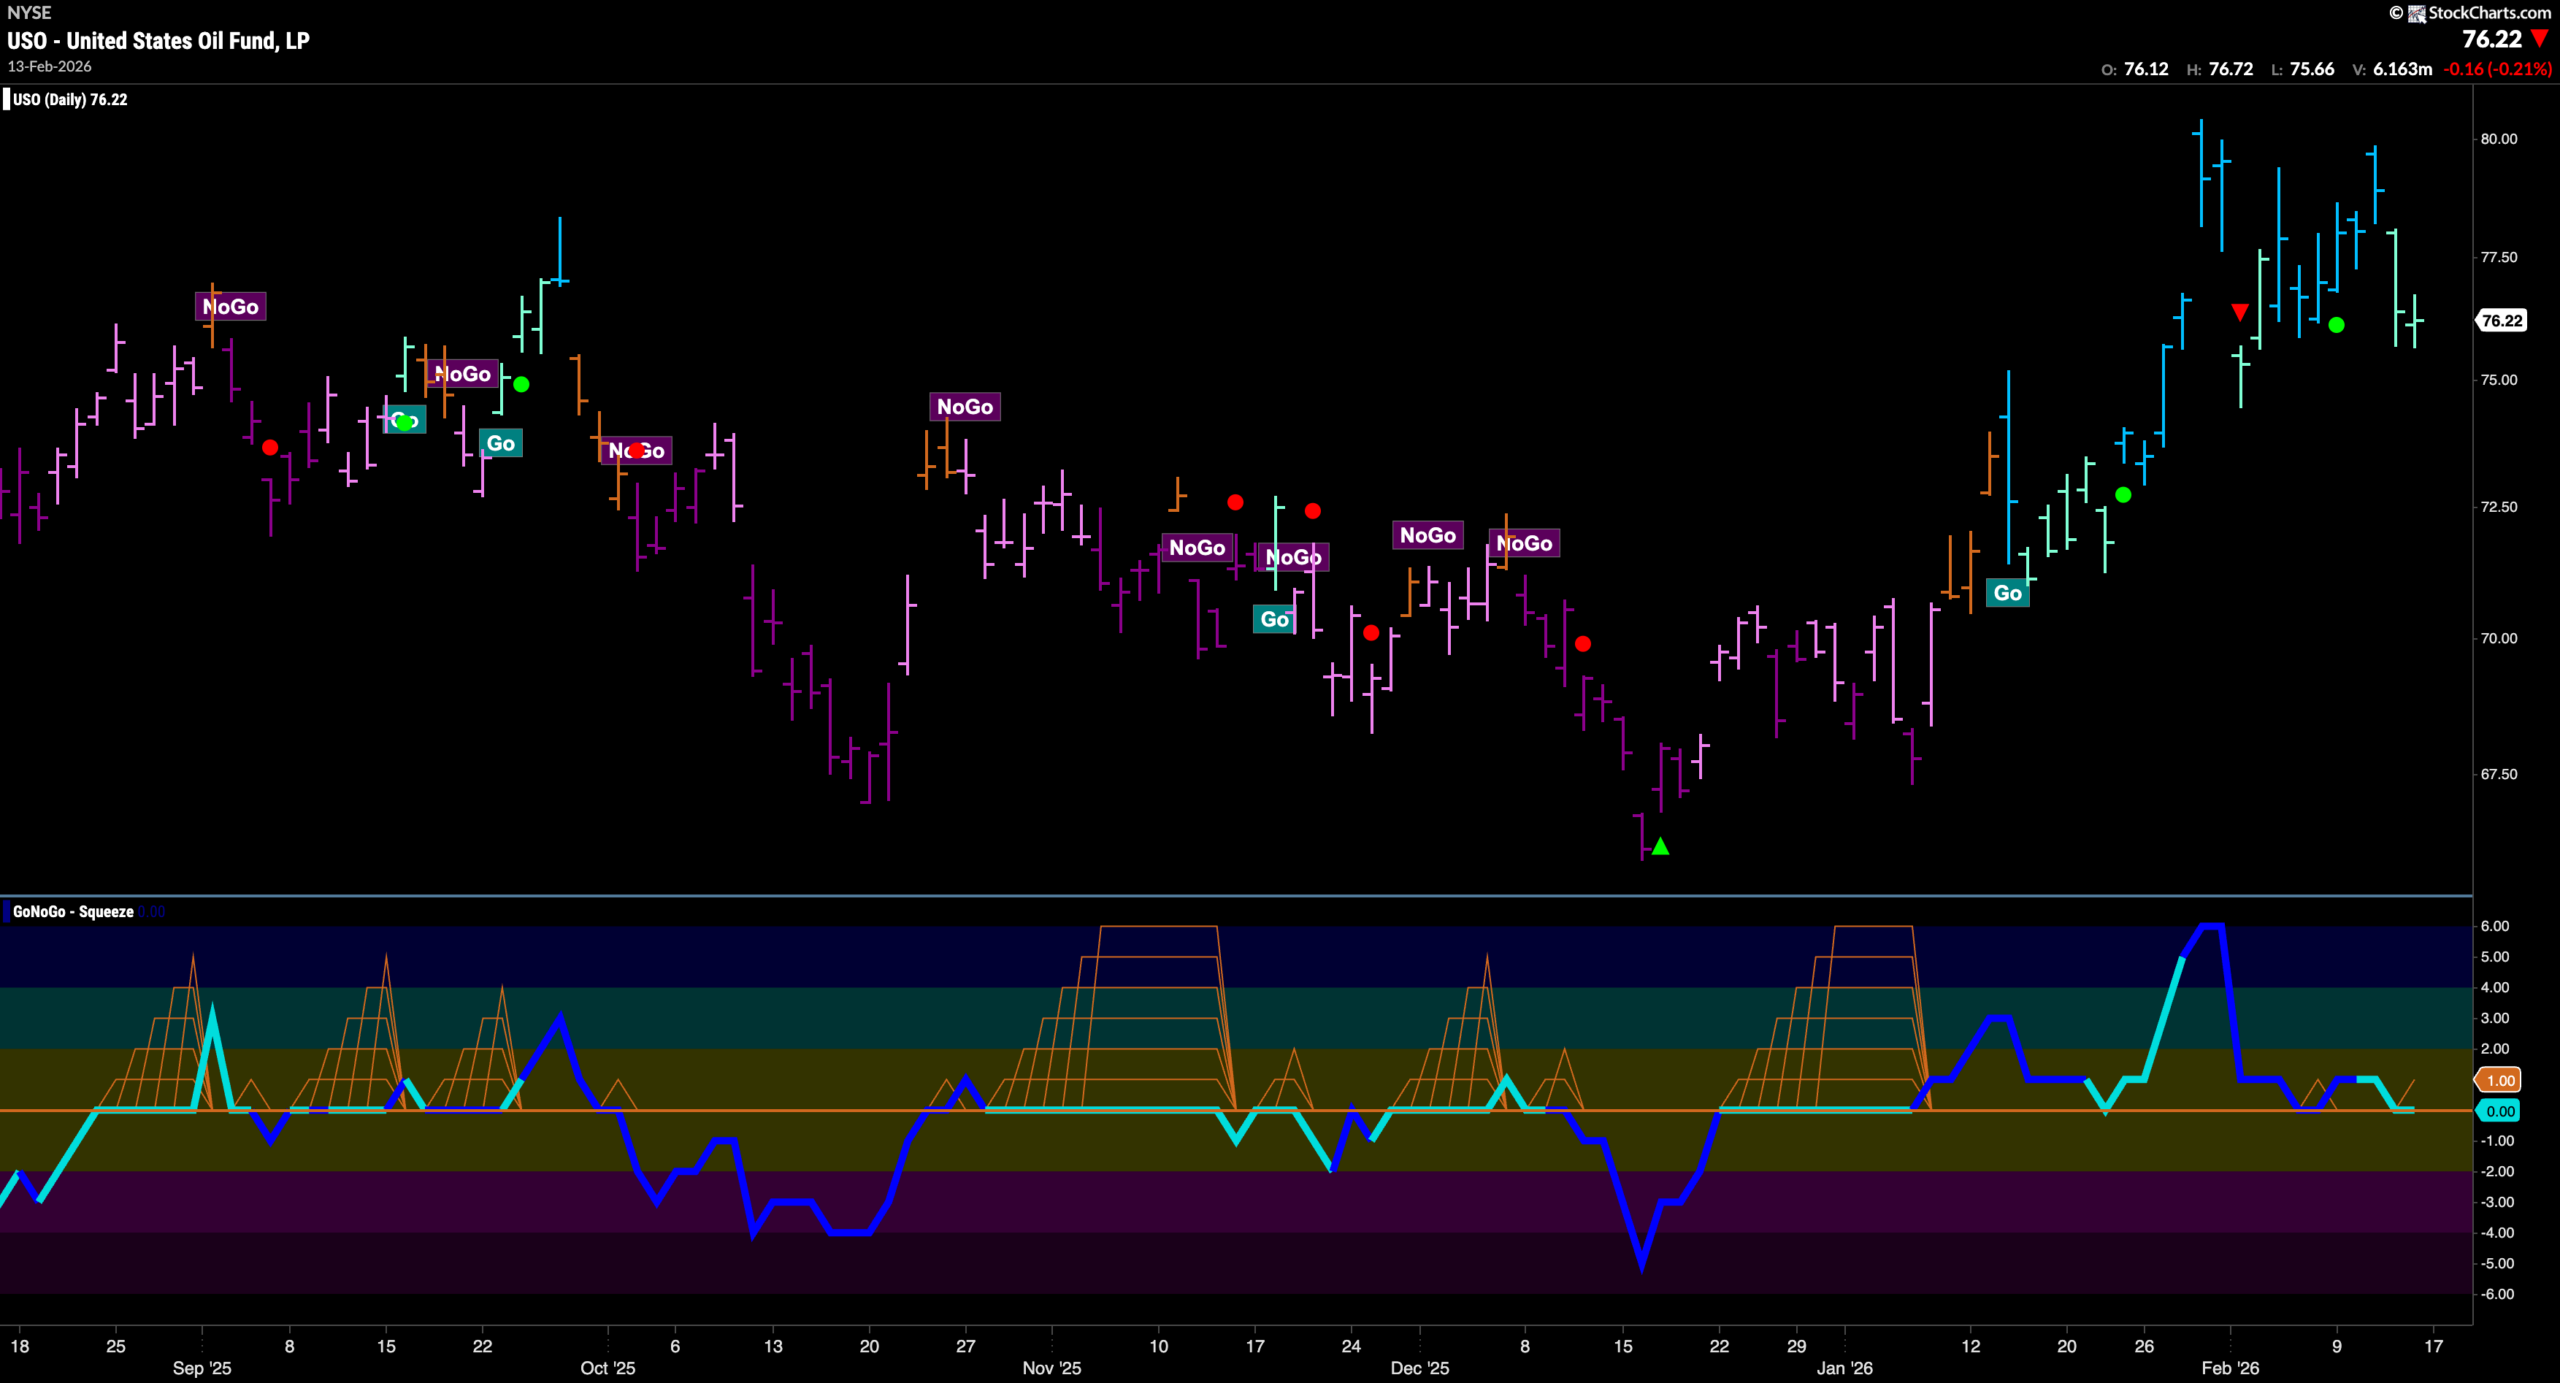
GoNoGo Trend shows that the “Go” trend remained this week however as price failed to make a new higher high we see the indicator painting a couple of bars of weakness with aqua bars as it looks for support. If we turn our attention to the lower panel, we see that GoNoGo Oscillator is again searching for support at the zero line. Since the start of this “Go” trend, we have seen that the oscillator has been at or above that level, confirming the trend. It will be important for the oscillator to once again find support for this “Go” trend to remain in place.
Gold Remains in “Go” Trend
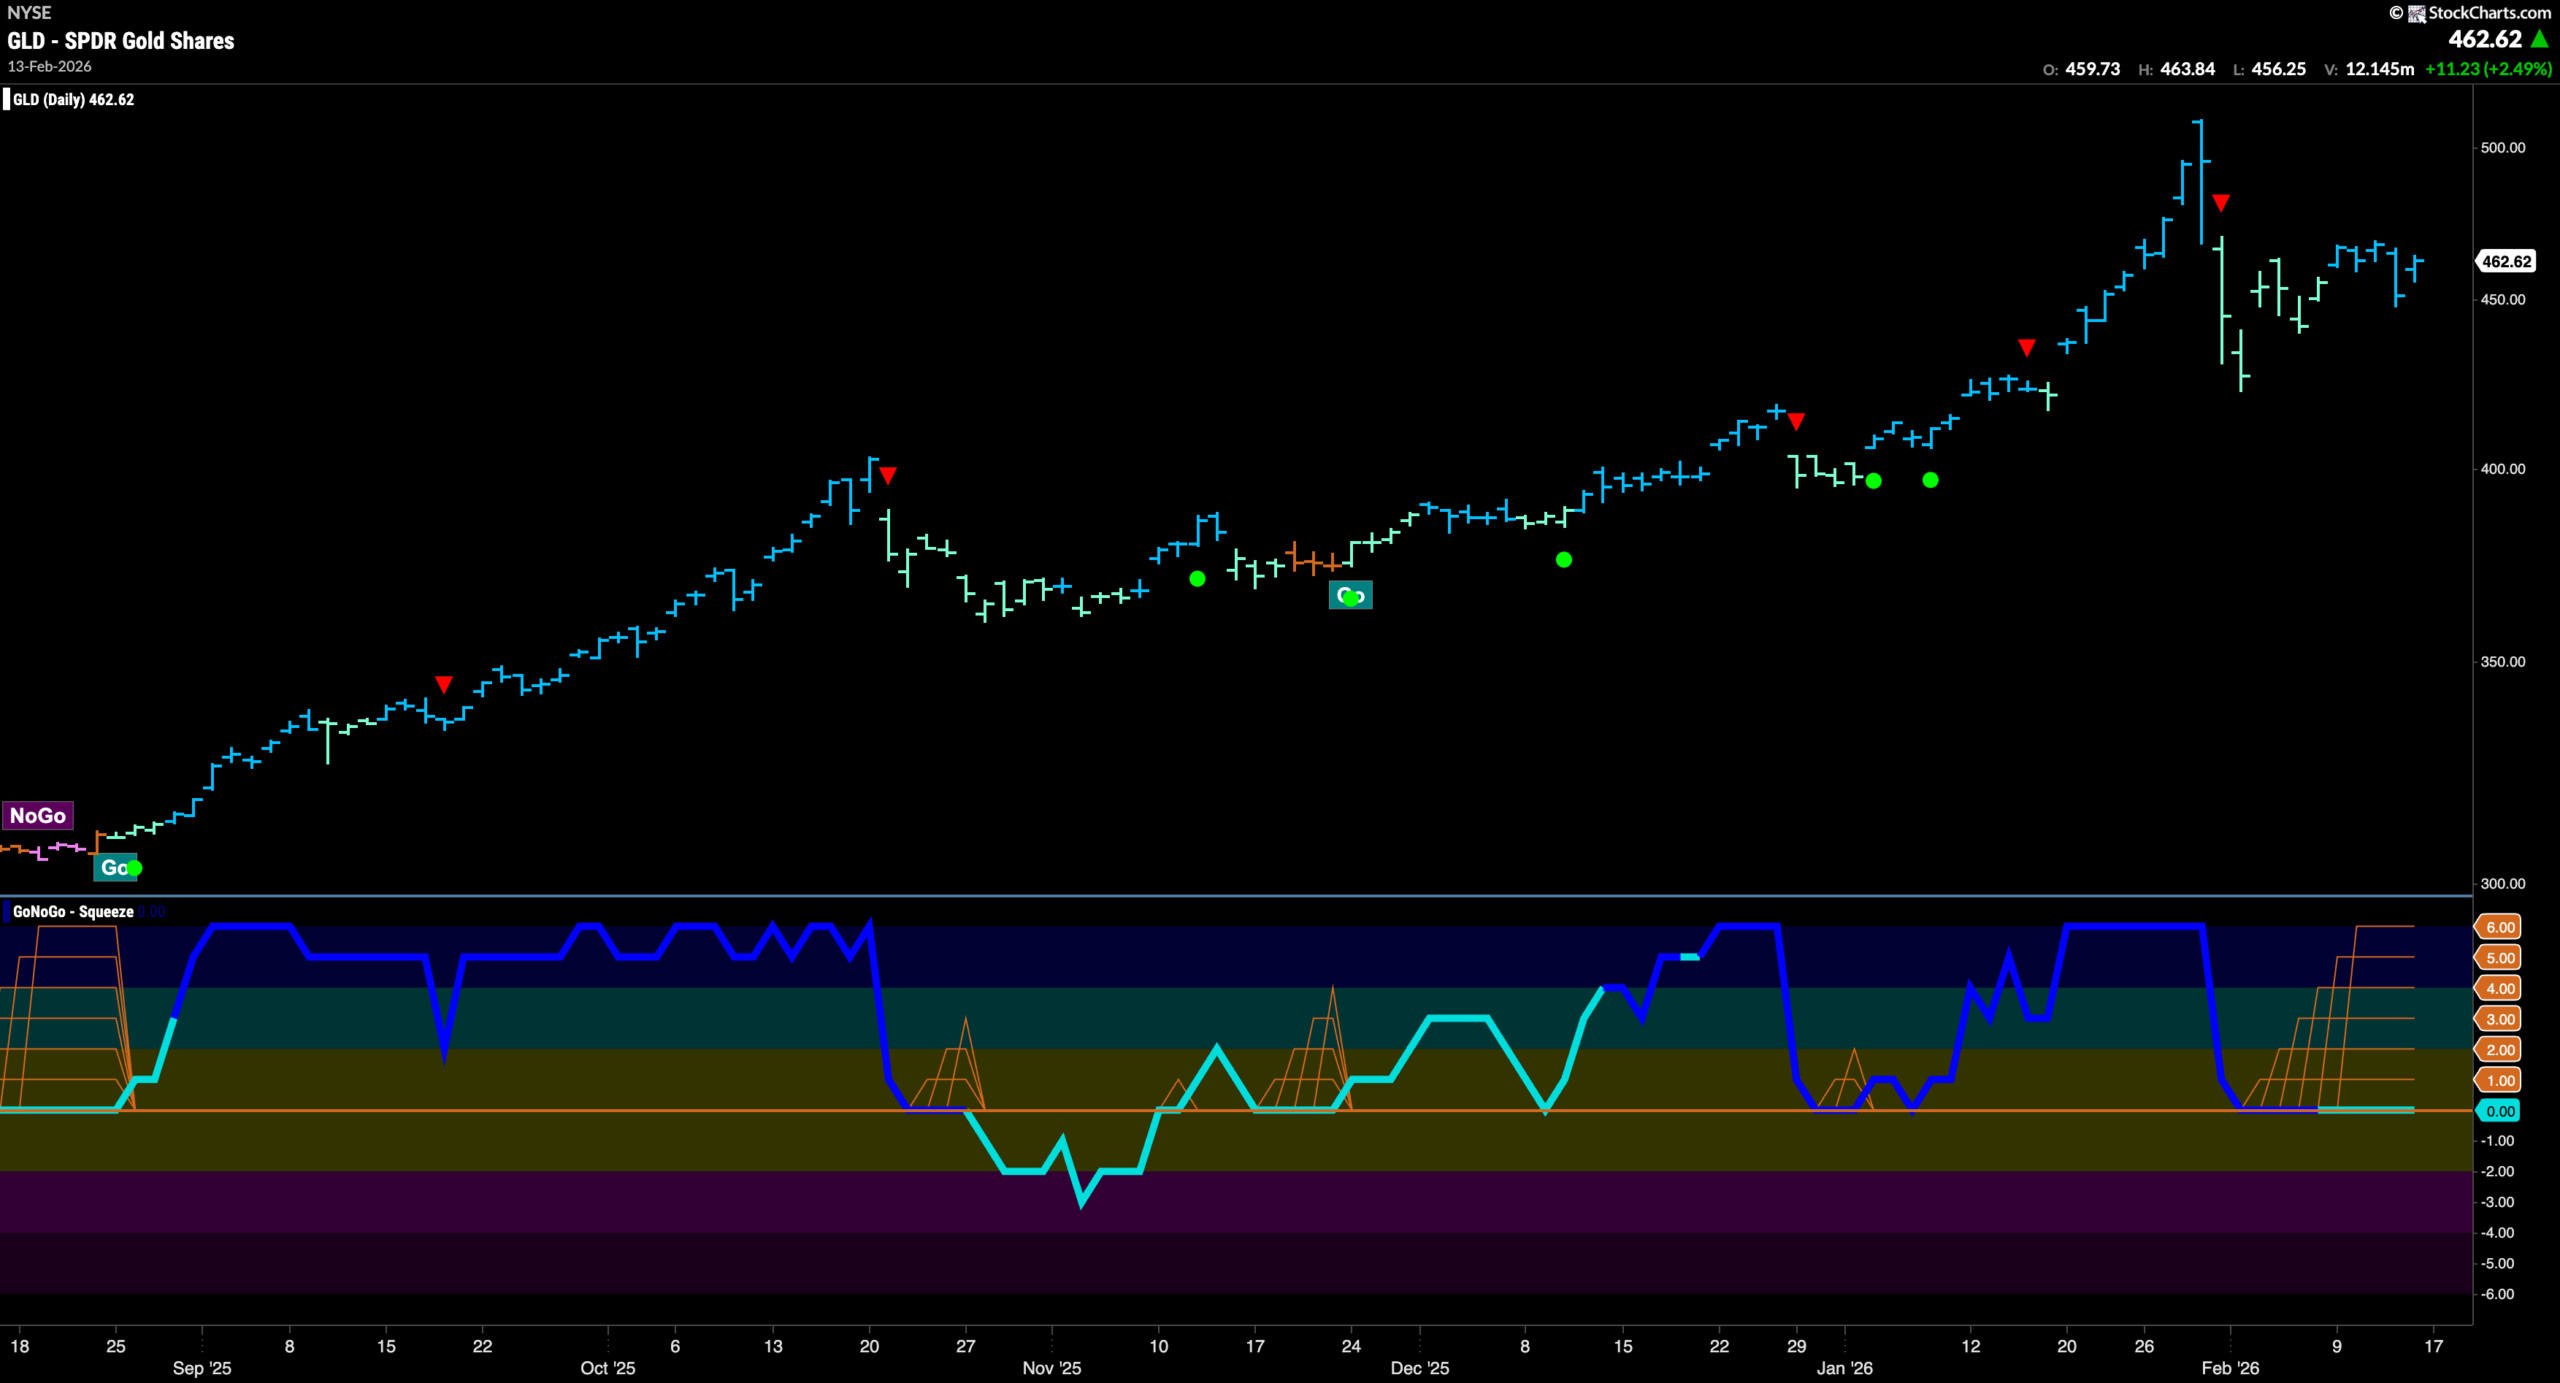
The trend in Gold remained in place this week as the GoNoGo Trend indicator painted a series of strong blue bars and price continues to stabilize having rallied from the recent low. Looking at the lower panel, we see that GoNoGo Oscillator has been embroiled in a battle with the zero line as we see an extended Max GoNoGo Squeeze reflecting the battle between buyers and sellers at this level. We will watch for the direction of this Squeeze break to gives us a hint at gold’s next direction.
Sector RelMap
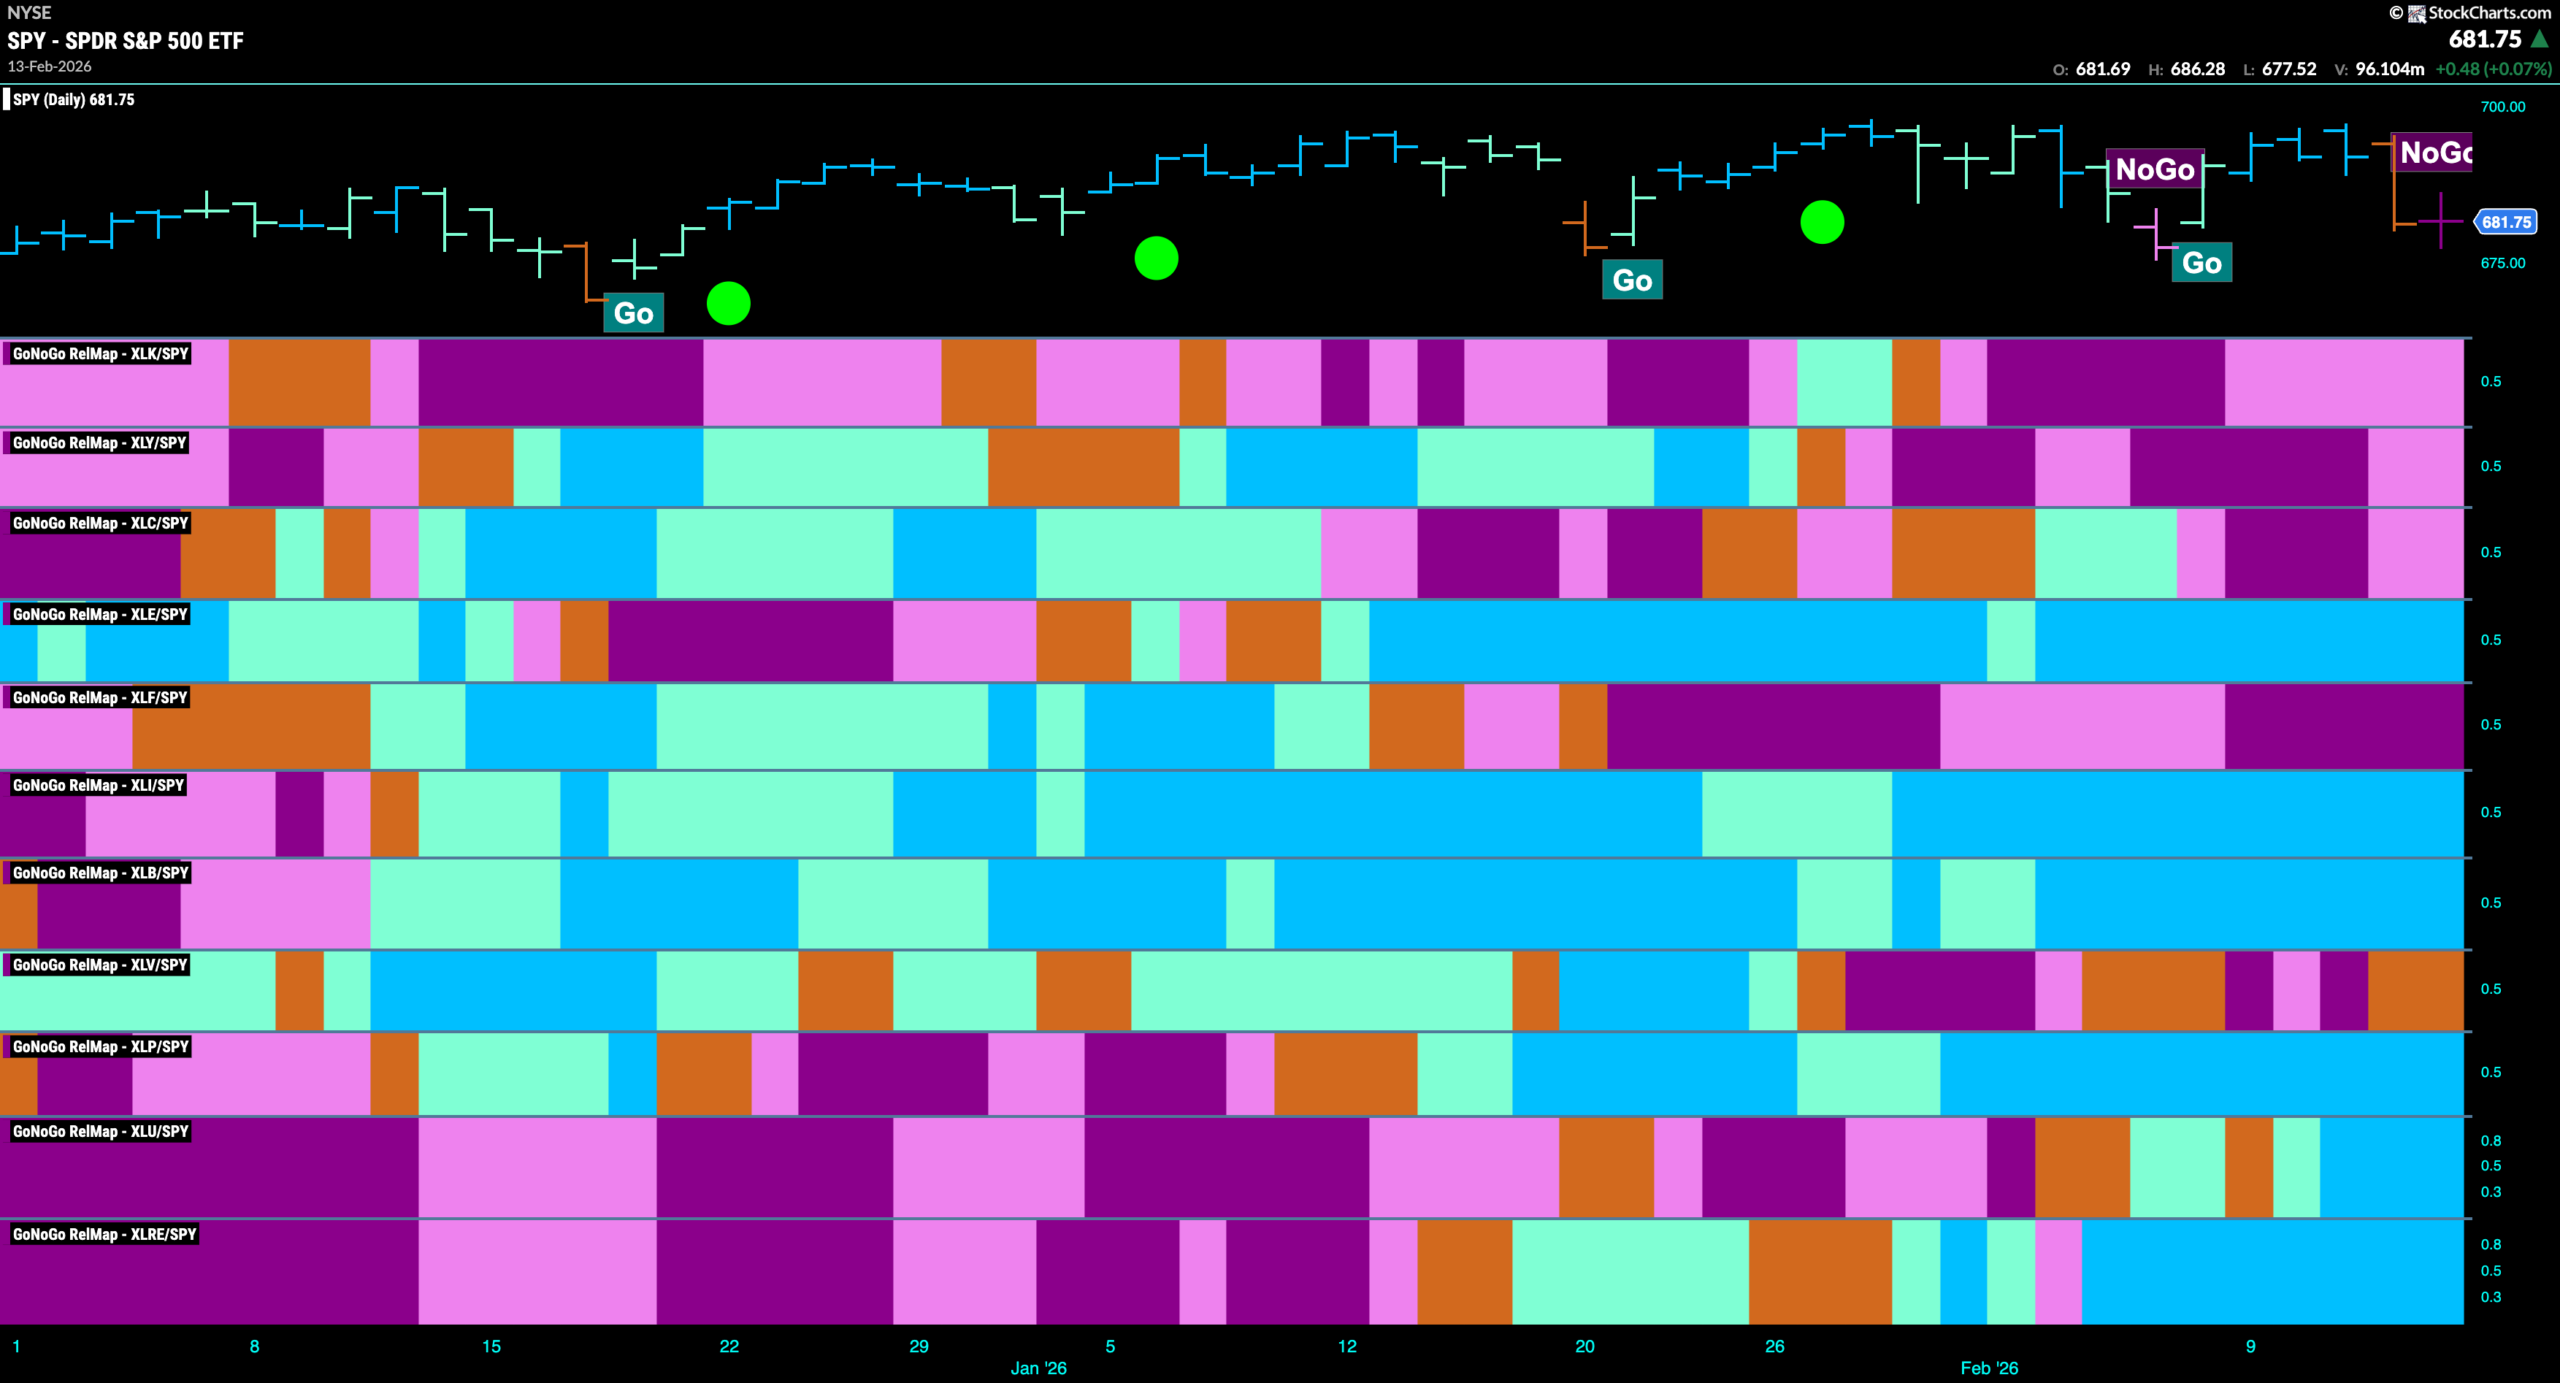
Below is the GoNoGo Sector RelMap. This GoNoGo RelMap applies the GoNoGo Trend to the relative strength ratios of the sectors to the base index. With this view we can get a sense of the relative out performance and relative underperformance of the sectors. 6 sectors are in relative “Go” trends. $XLE, $XLI, $XLB, $XLP, $XLU, and $XLRE are painting relative “Go” bars.
Utilities Sub-Group RelMap
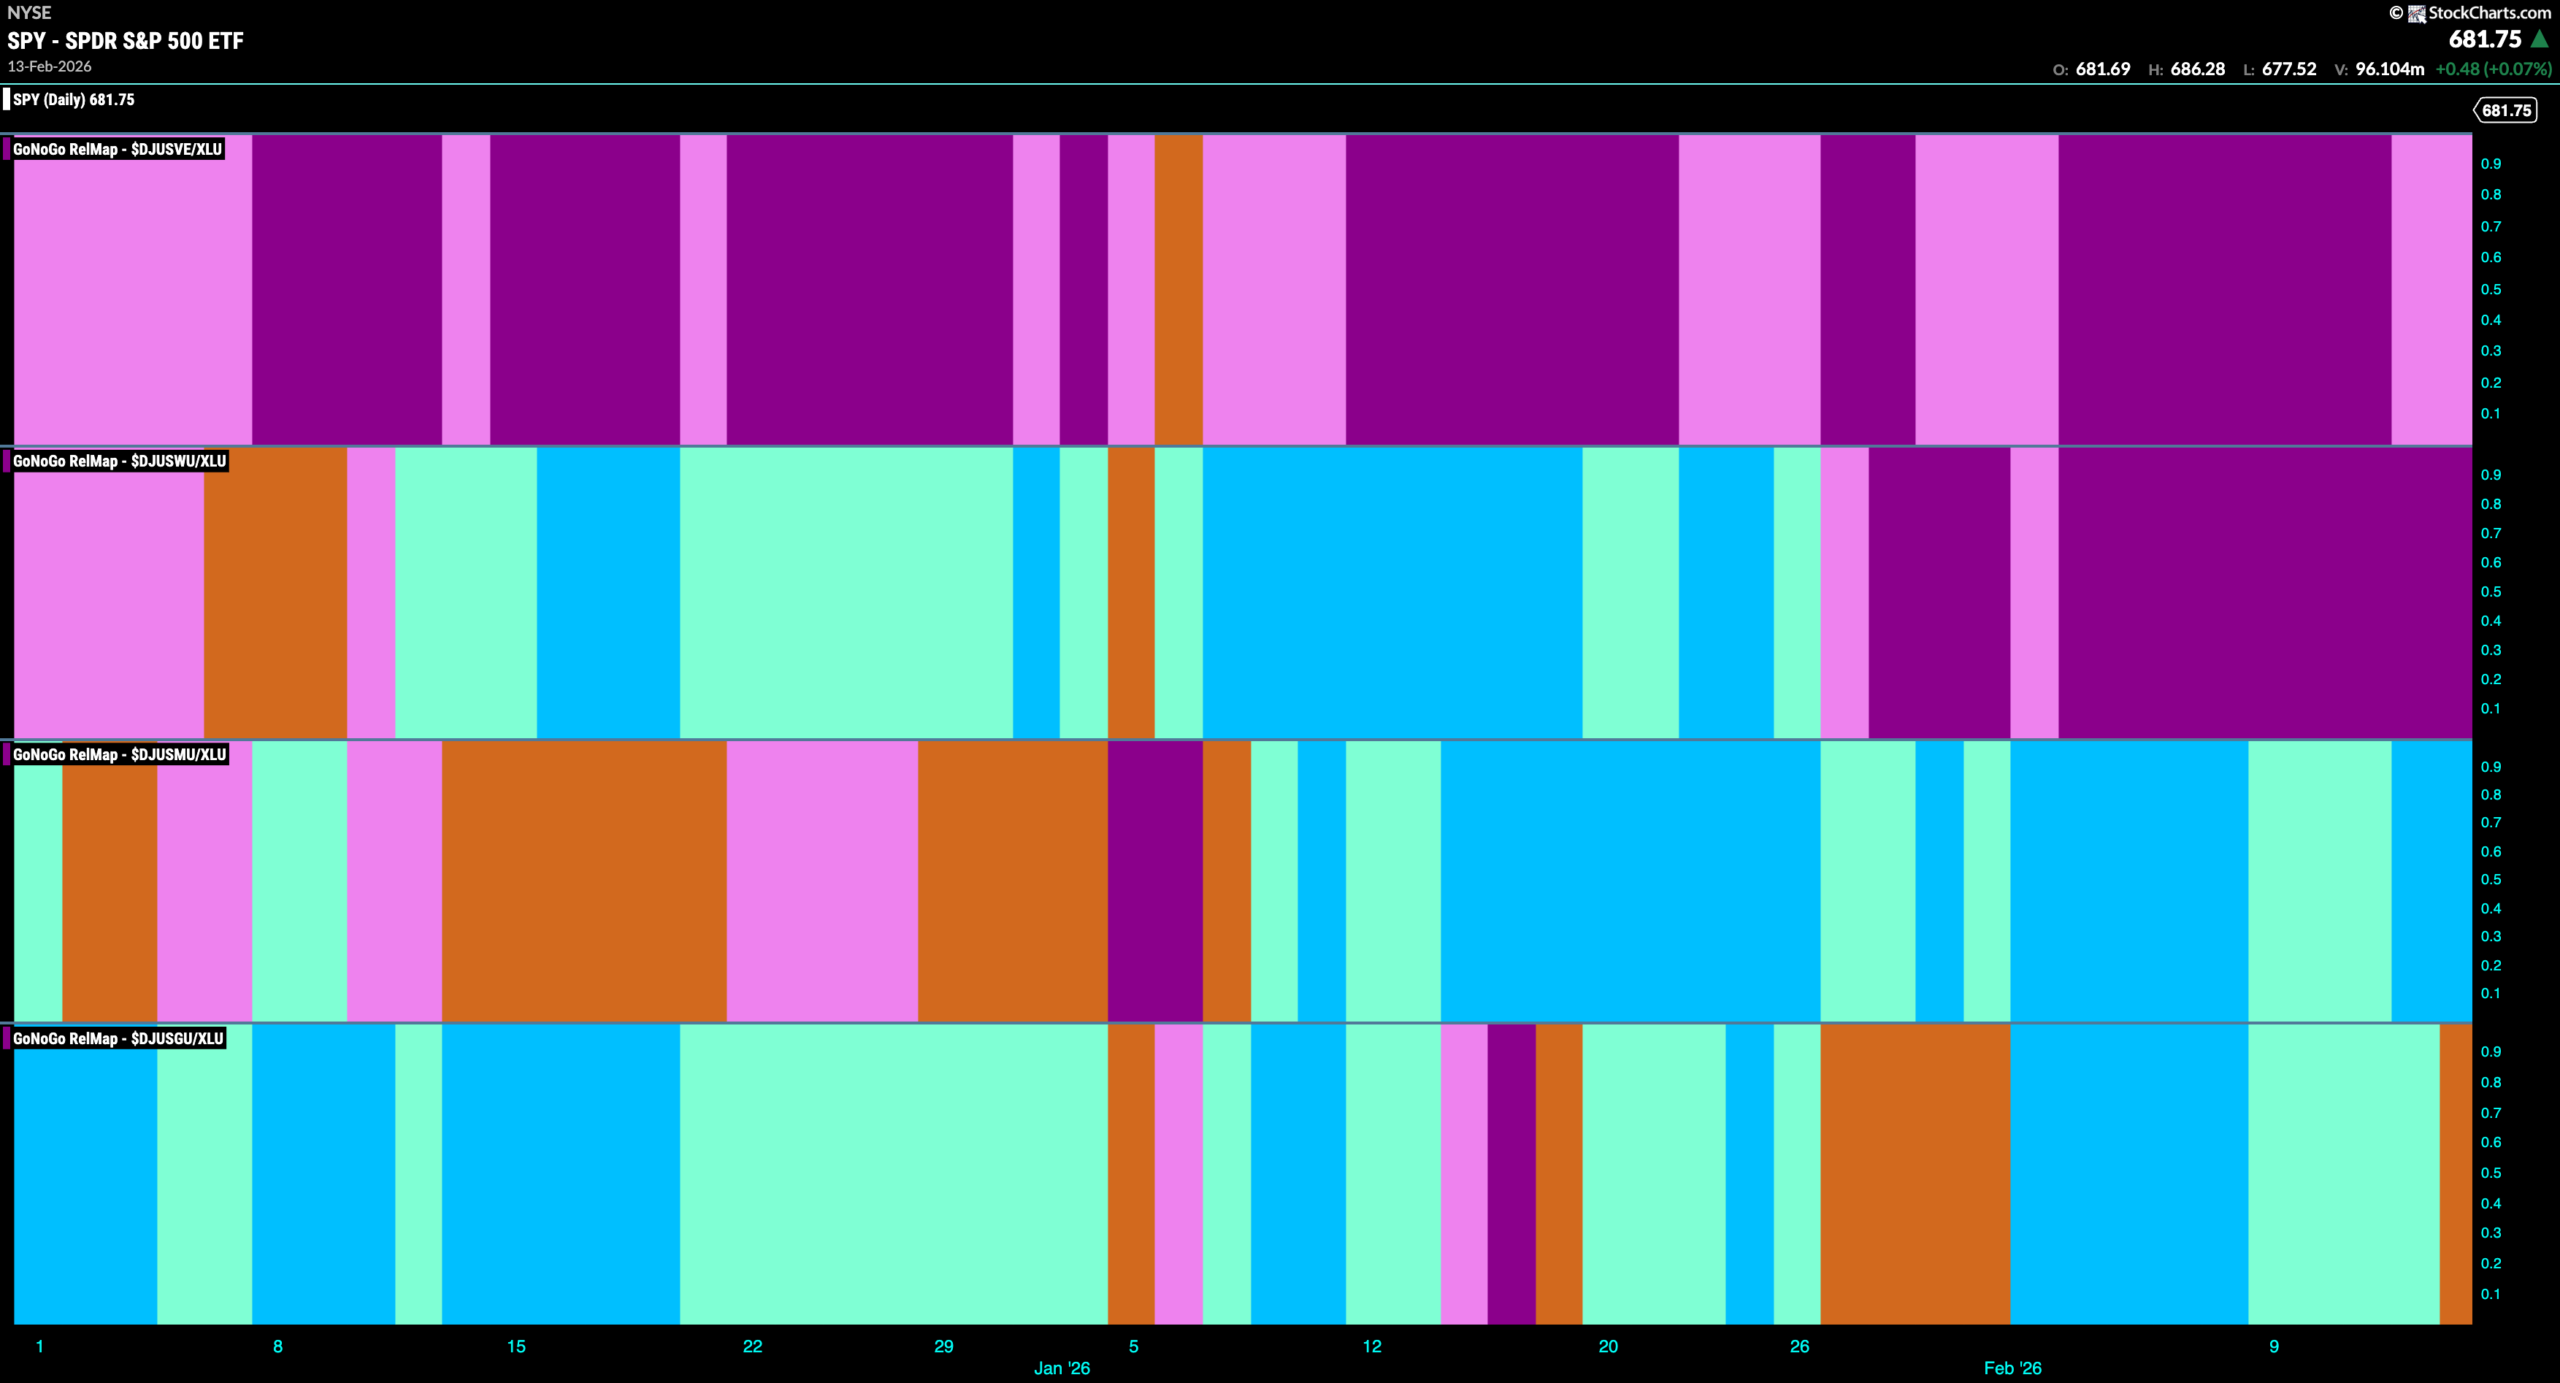
The chart below shows a relative trend breakdown of the sub groups within the utilities sector again this week. The Sub-Group RelMap plots the GoNoGo Trend of each sub index to the $XLB. We saw in the above GoNoGo Sector RelMap that $XLU is a new out-performing sector and paints strong relative “Go” bars. When we look at the below RelMap we can see that the multi utilities index in the 3rd panel has once again started to paint strong blue “Go” bars on a relative basis.
$BEPC Looks for a Break above Resistance
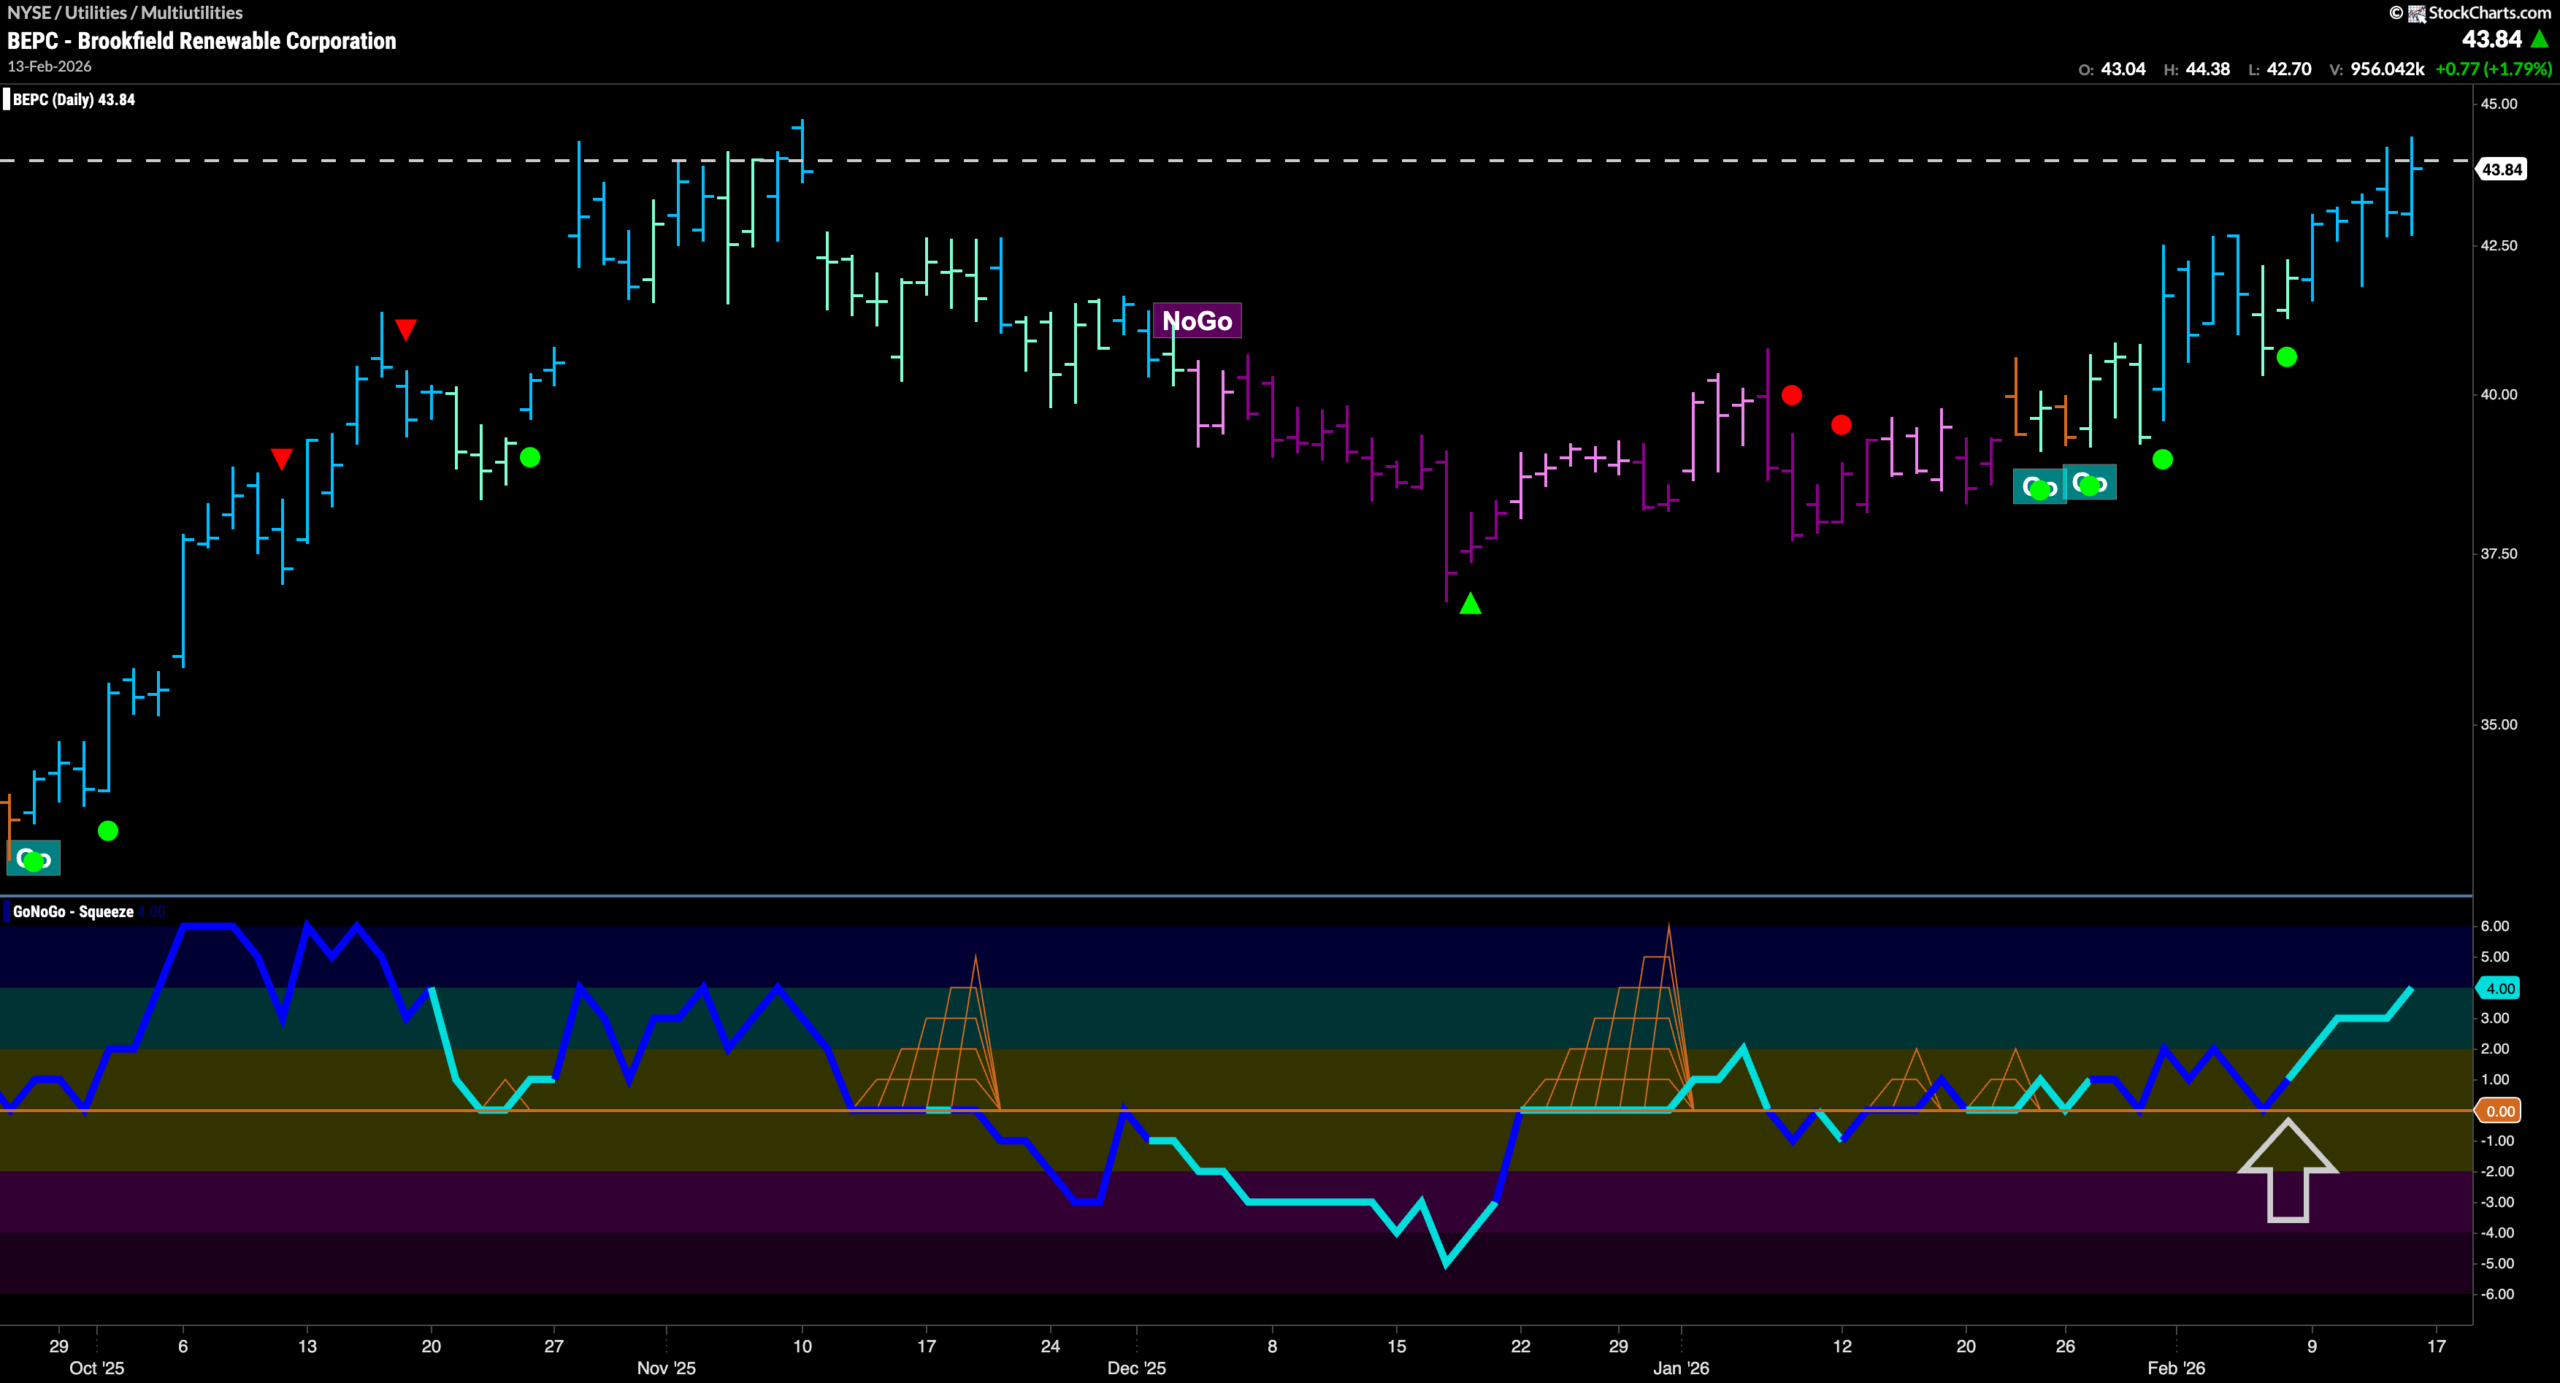
GoNoGo Trend shows that $BEPC has been in a “Go” trend for several weeks and price has climbed steadily to challenge prior highs from November. During this “Go” trend, we see that GoNoGo Oscillator has consistently found support at the zero line providing confirmation for the “Go” trend. Now, the oscillator is in positive territory but not yet oversold at a value of 4. We will watch to see if this gives price the push it needs to set a new higher high.
$RWEOY Breaks Below Support
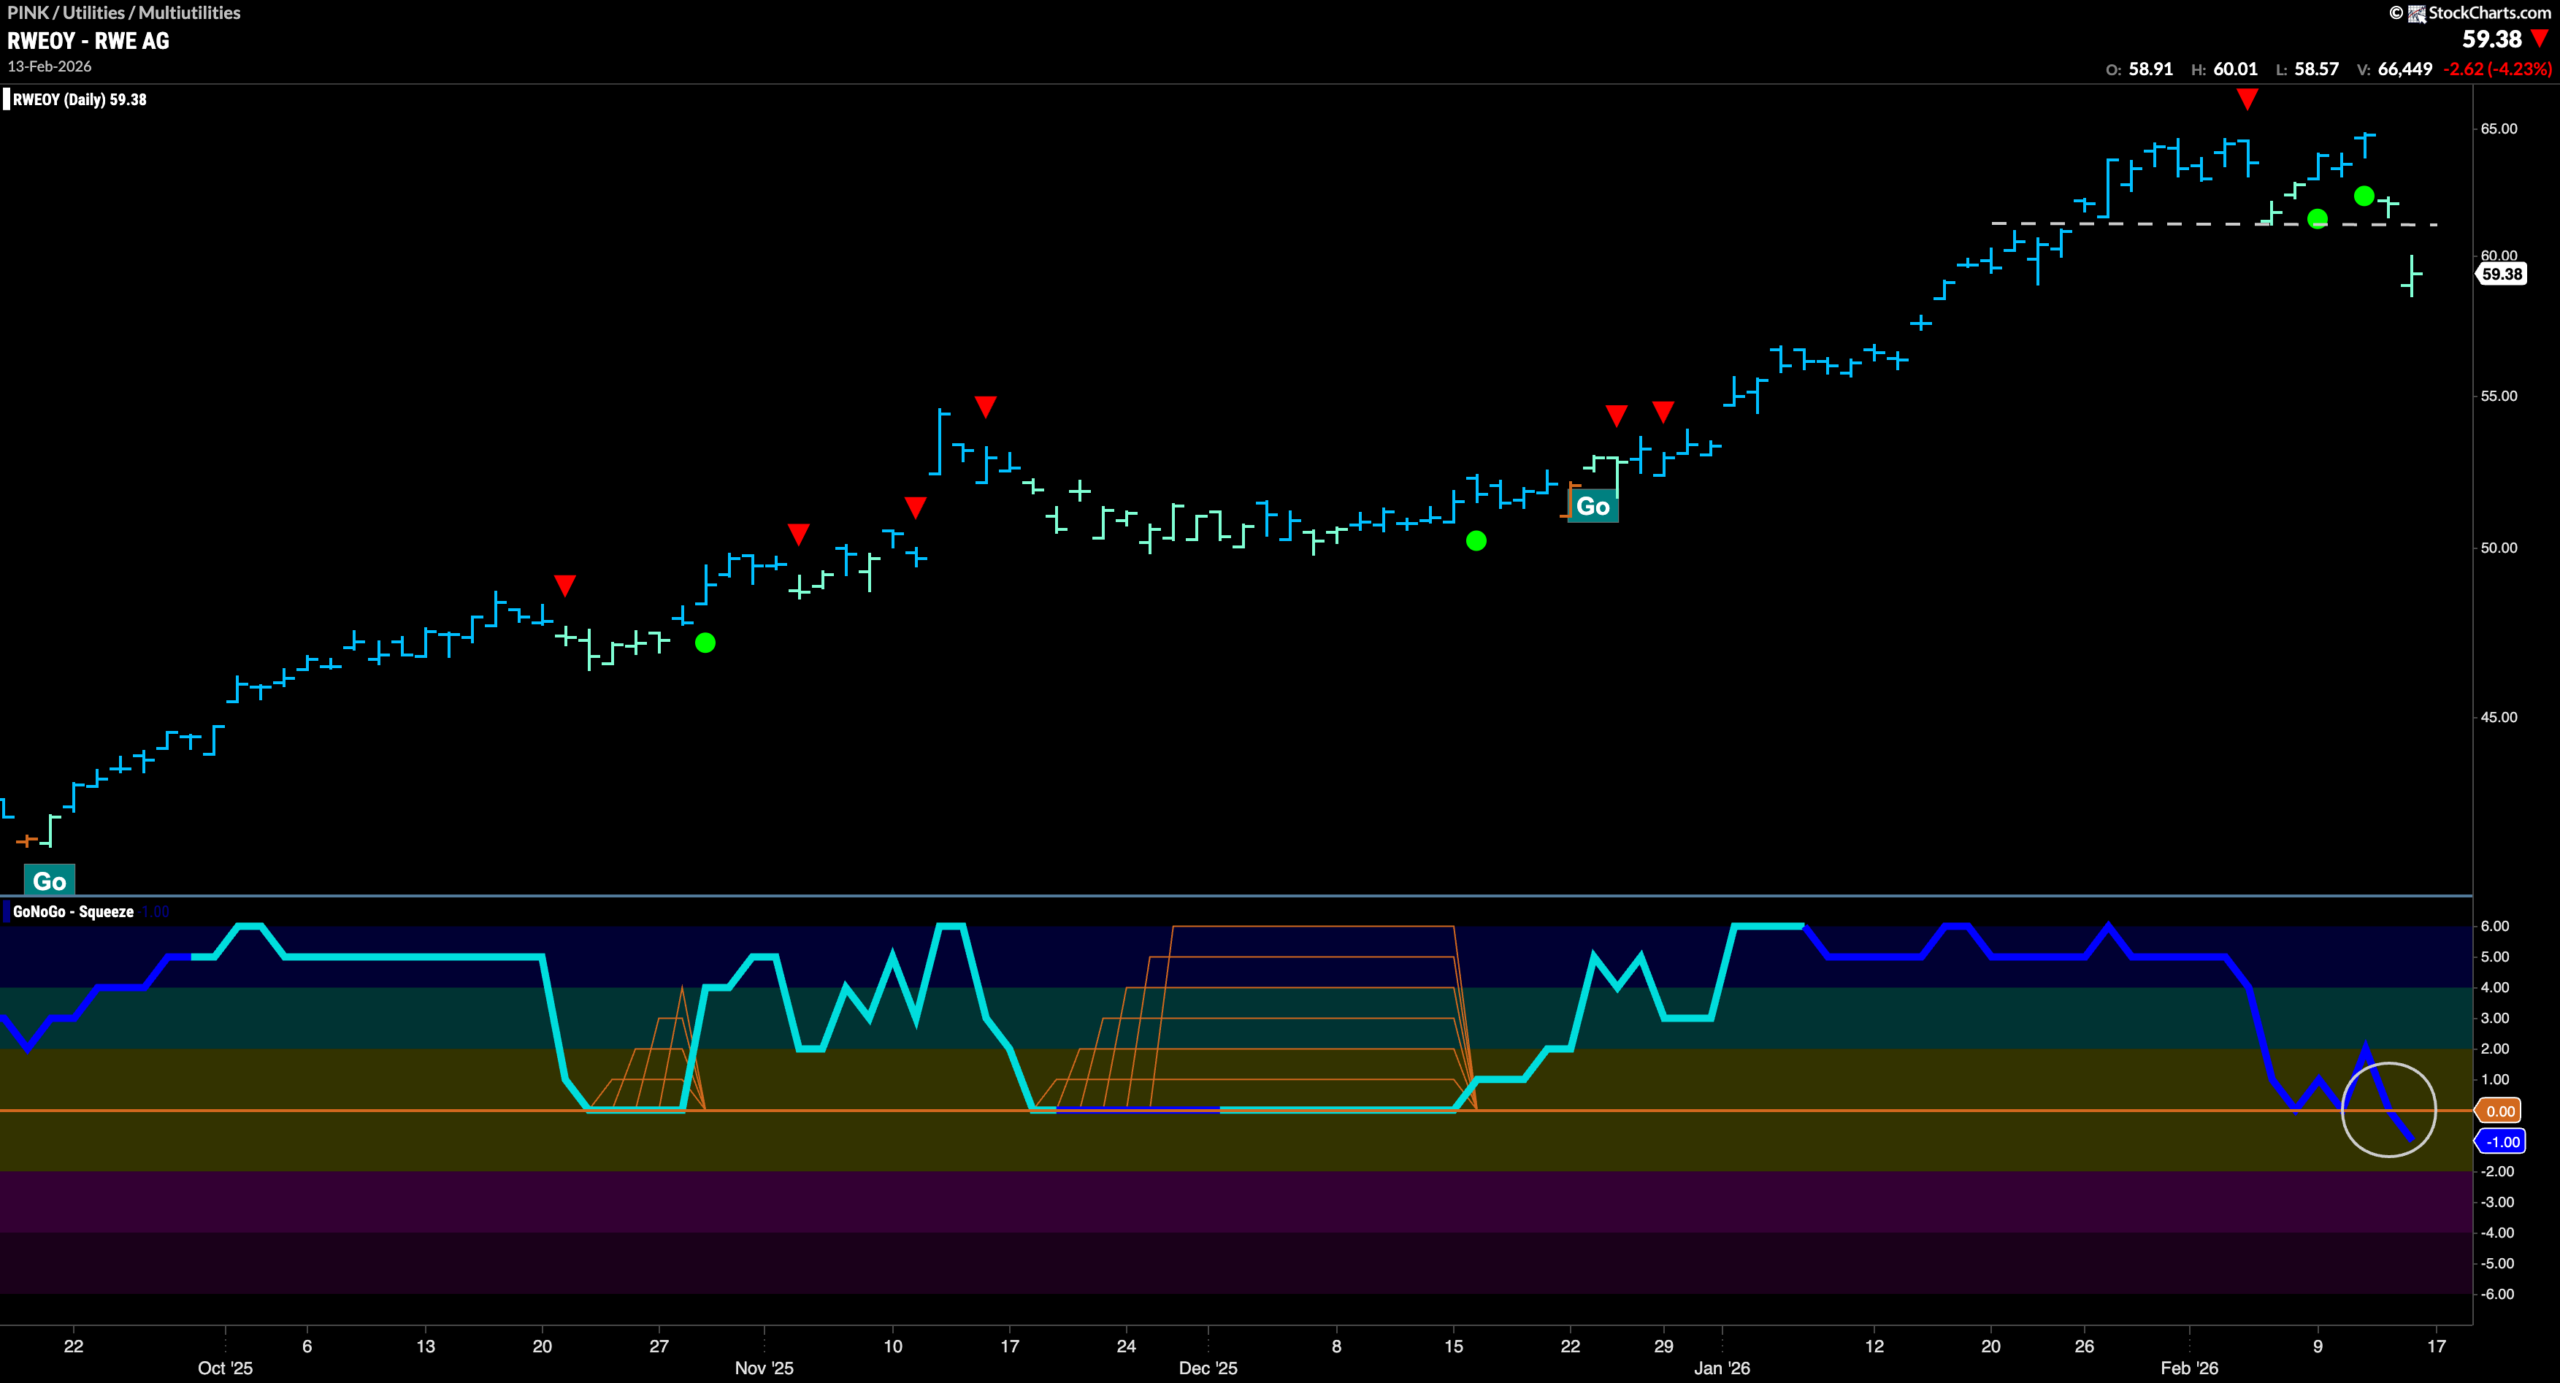
$RWEOY has been a very strong performer for months and we have seen price set a series of higher highs and higher lows during the “Go” trend. We have also seen that during this trend, GoNoGo Oscillator has consistently found support at the zero line confirming the health of the trend. Most recently, We see price fall below a horizontal level of support as GoNoGo Oscillator fails to finds support at zero for the first time. With momentum now out of step with the “Go” trend, we will expect price to struggle further, having already set a first lower low.