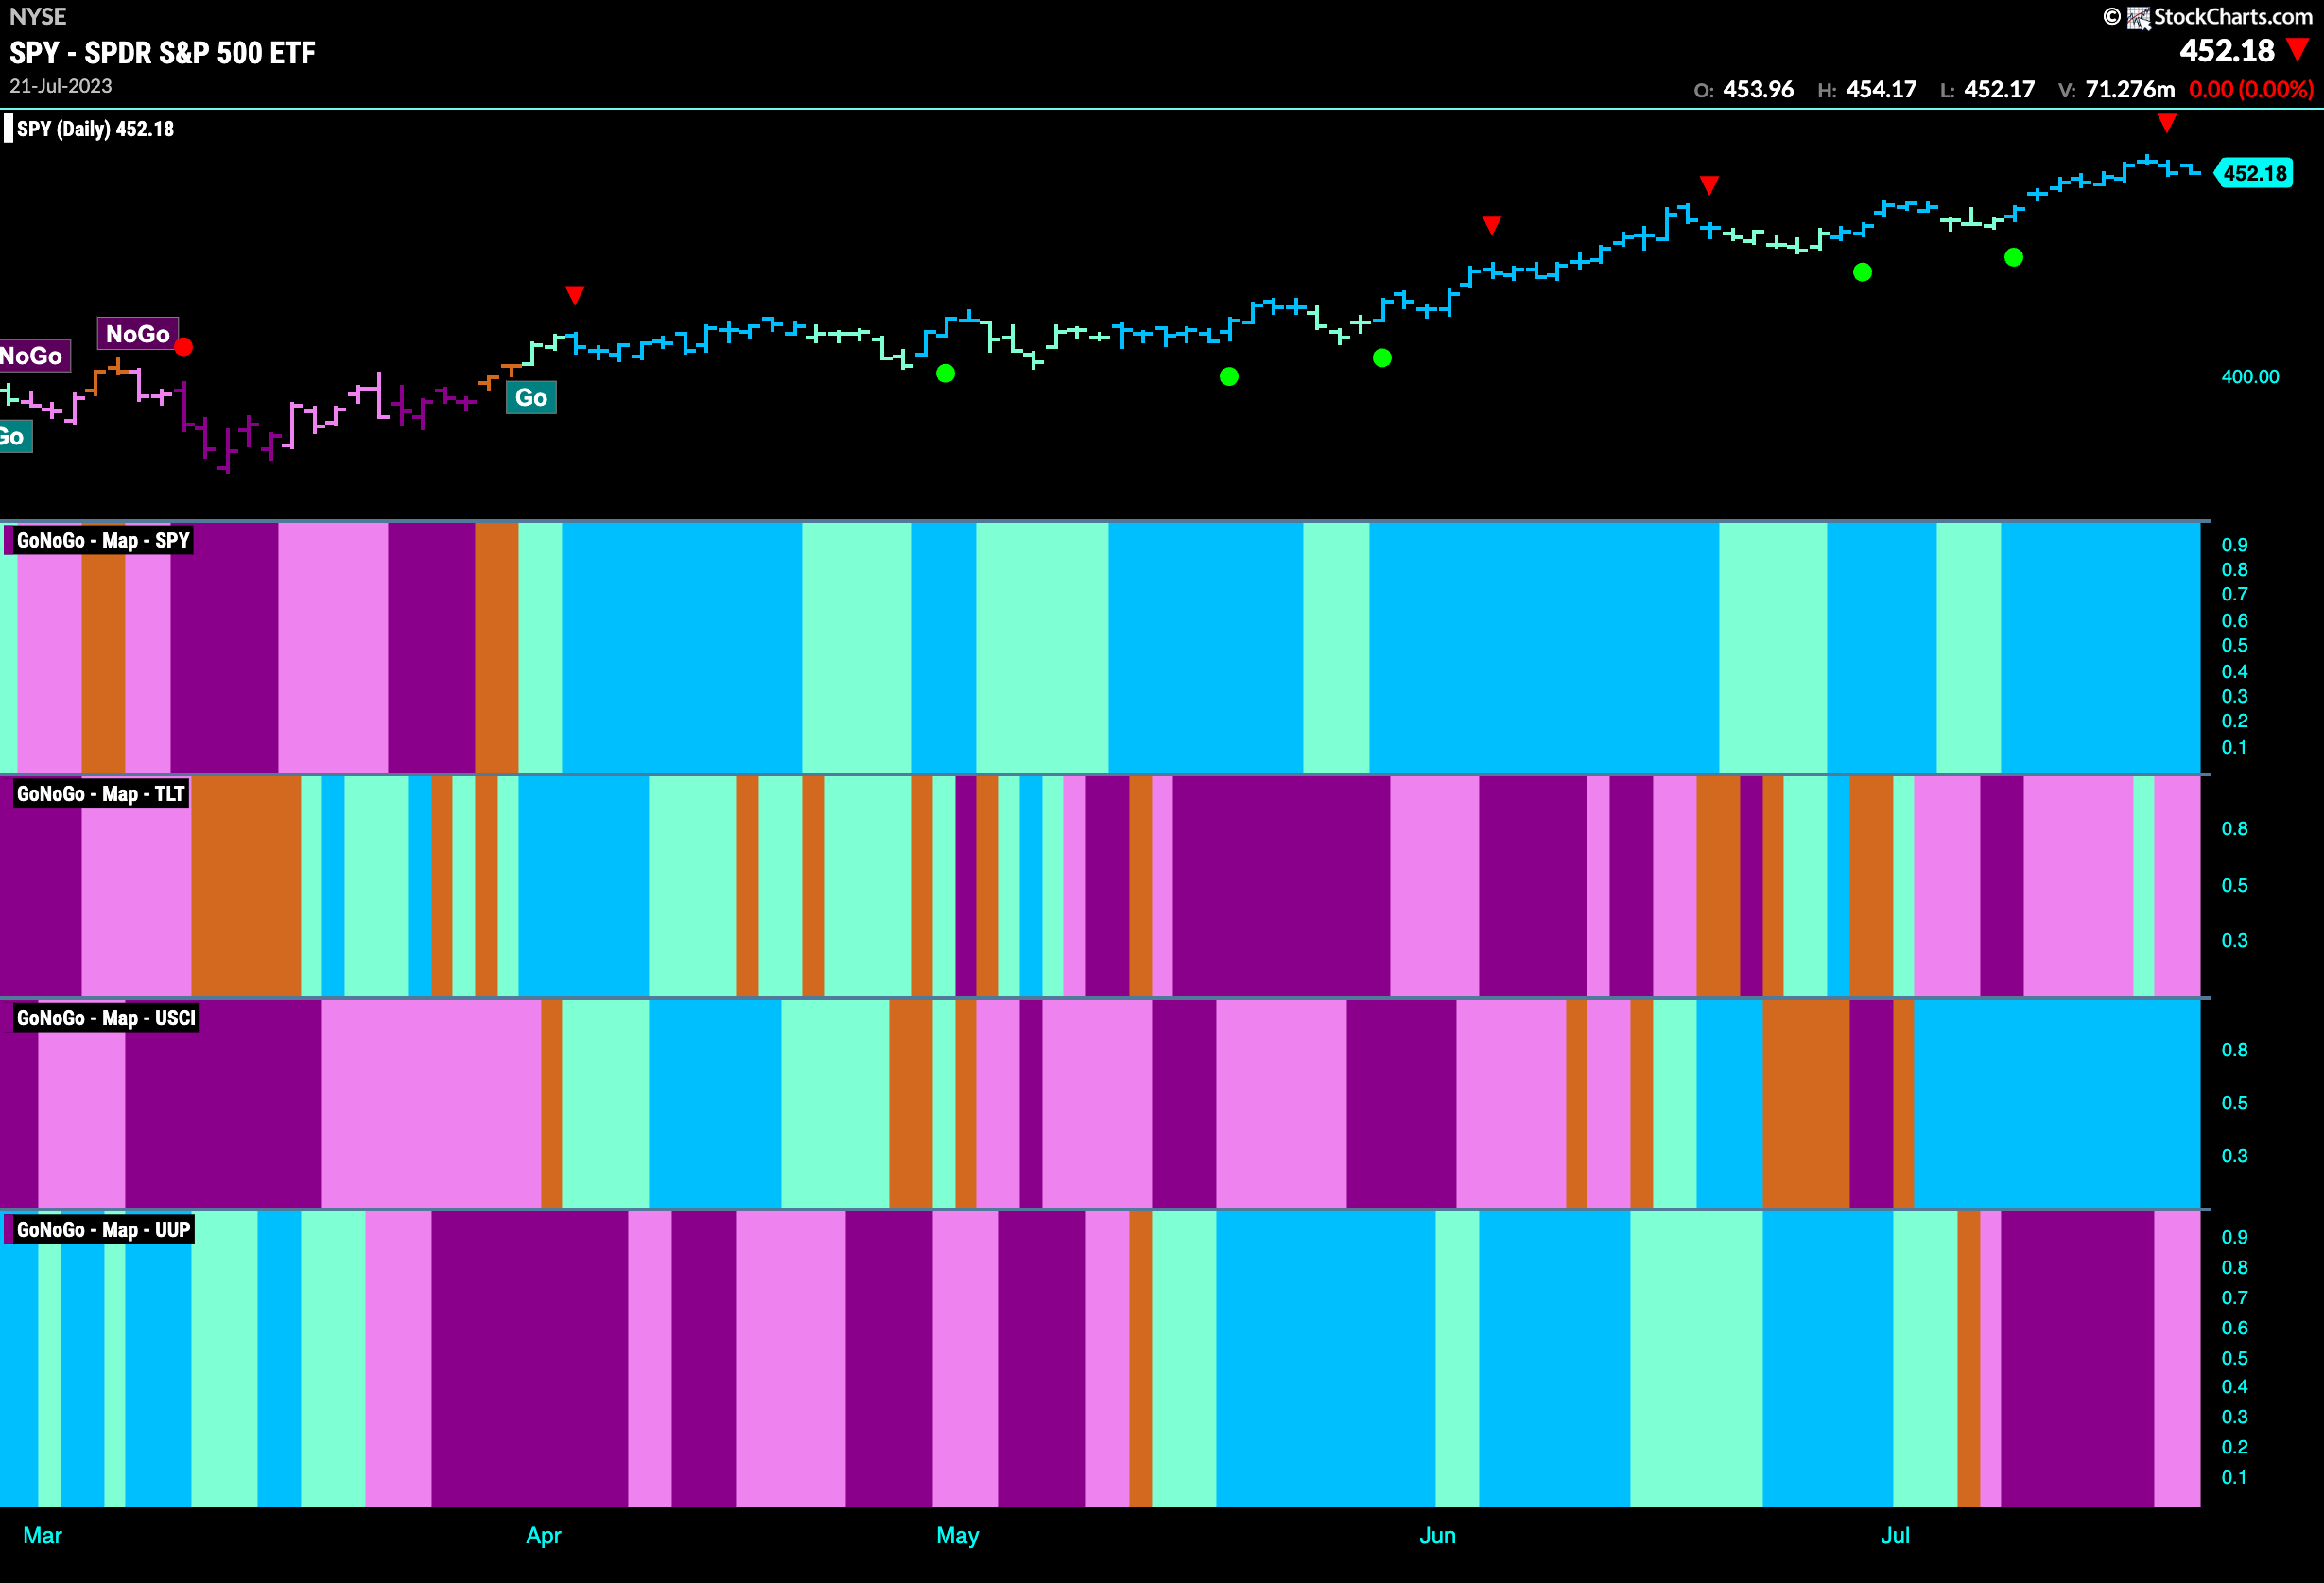
Good morning and welcome to this week’s Flight Path. The heat map shows that the “Go” trend in equities remained strong this week as GoNoGo Trend painted consistent blue “Go” bars. Treasury bond prices resumed their “NoGo” after the indicator painted a single aqua bar midweek. Commodities remained in a strong “Go” trend this week. The dollar rallied a little after its calamitous drop last week to end the week painting pink “NoGo” bars.
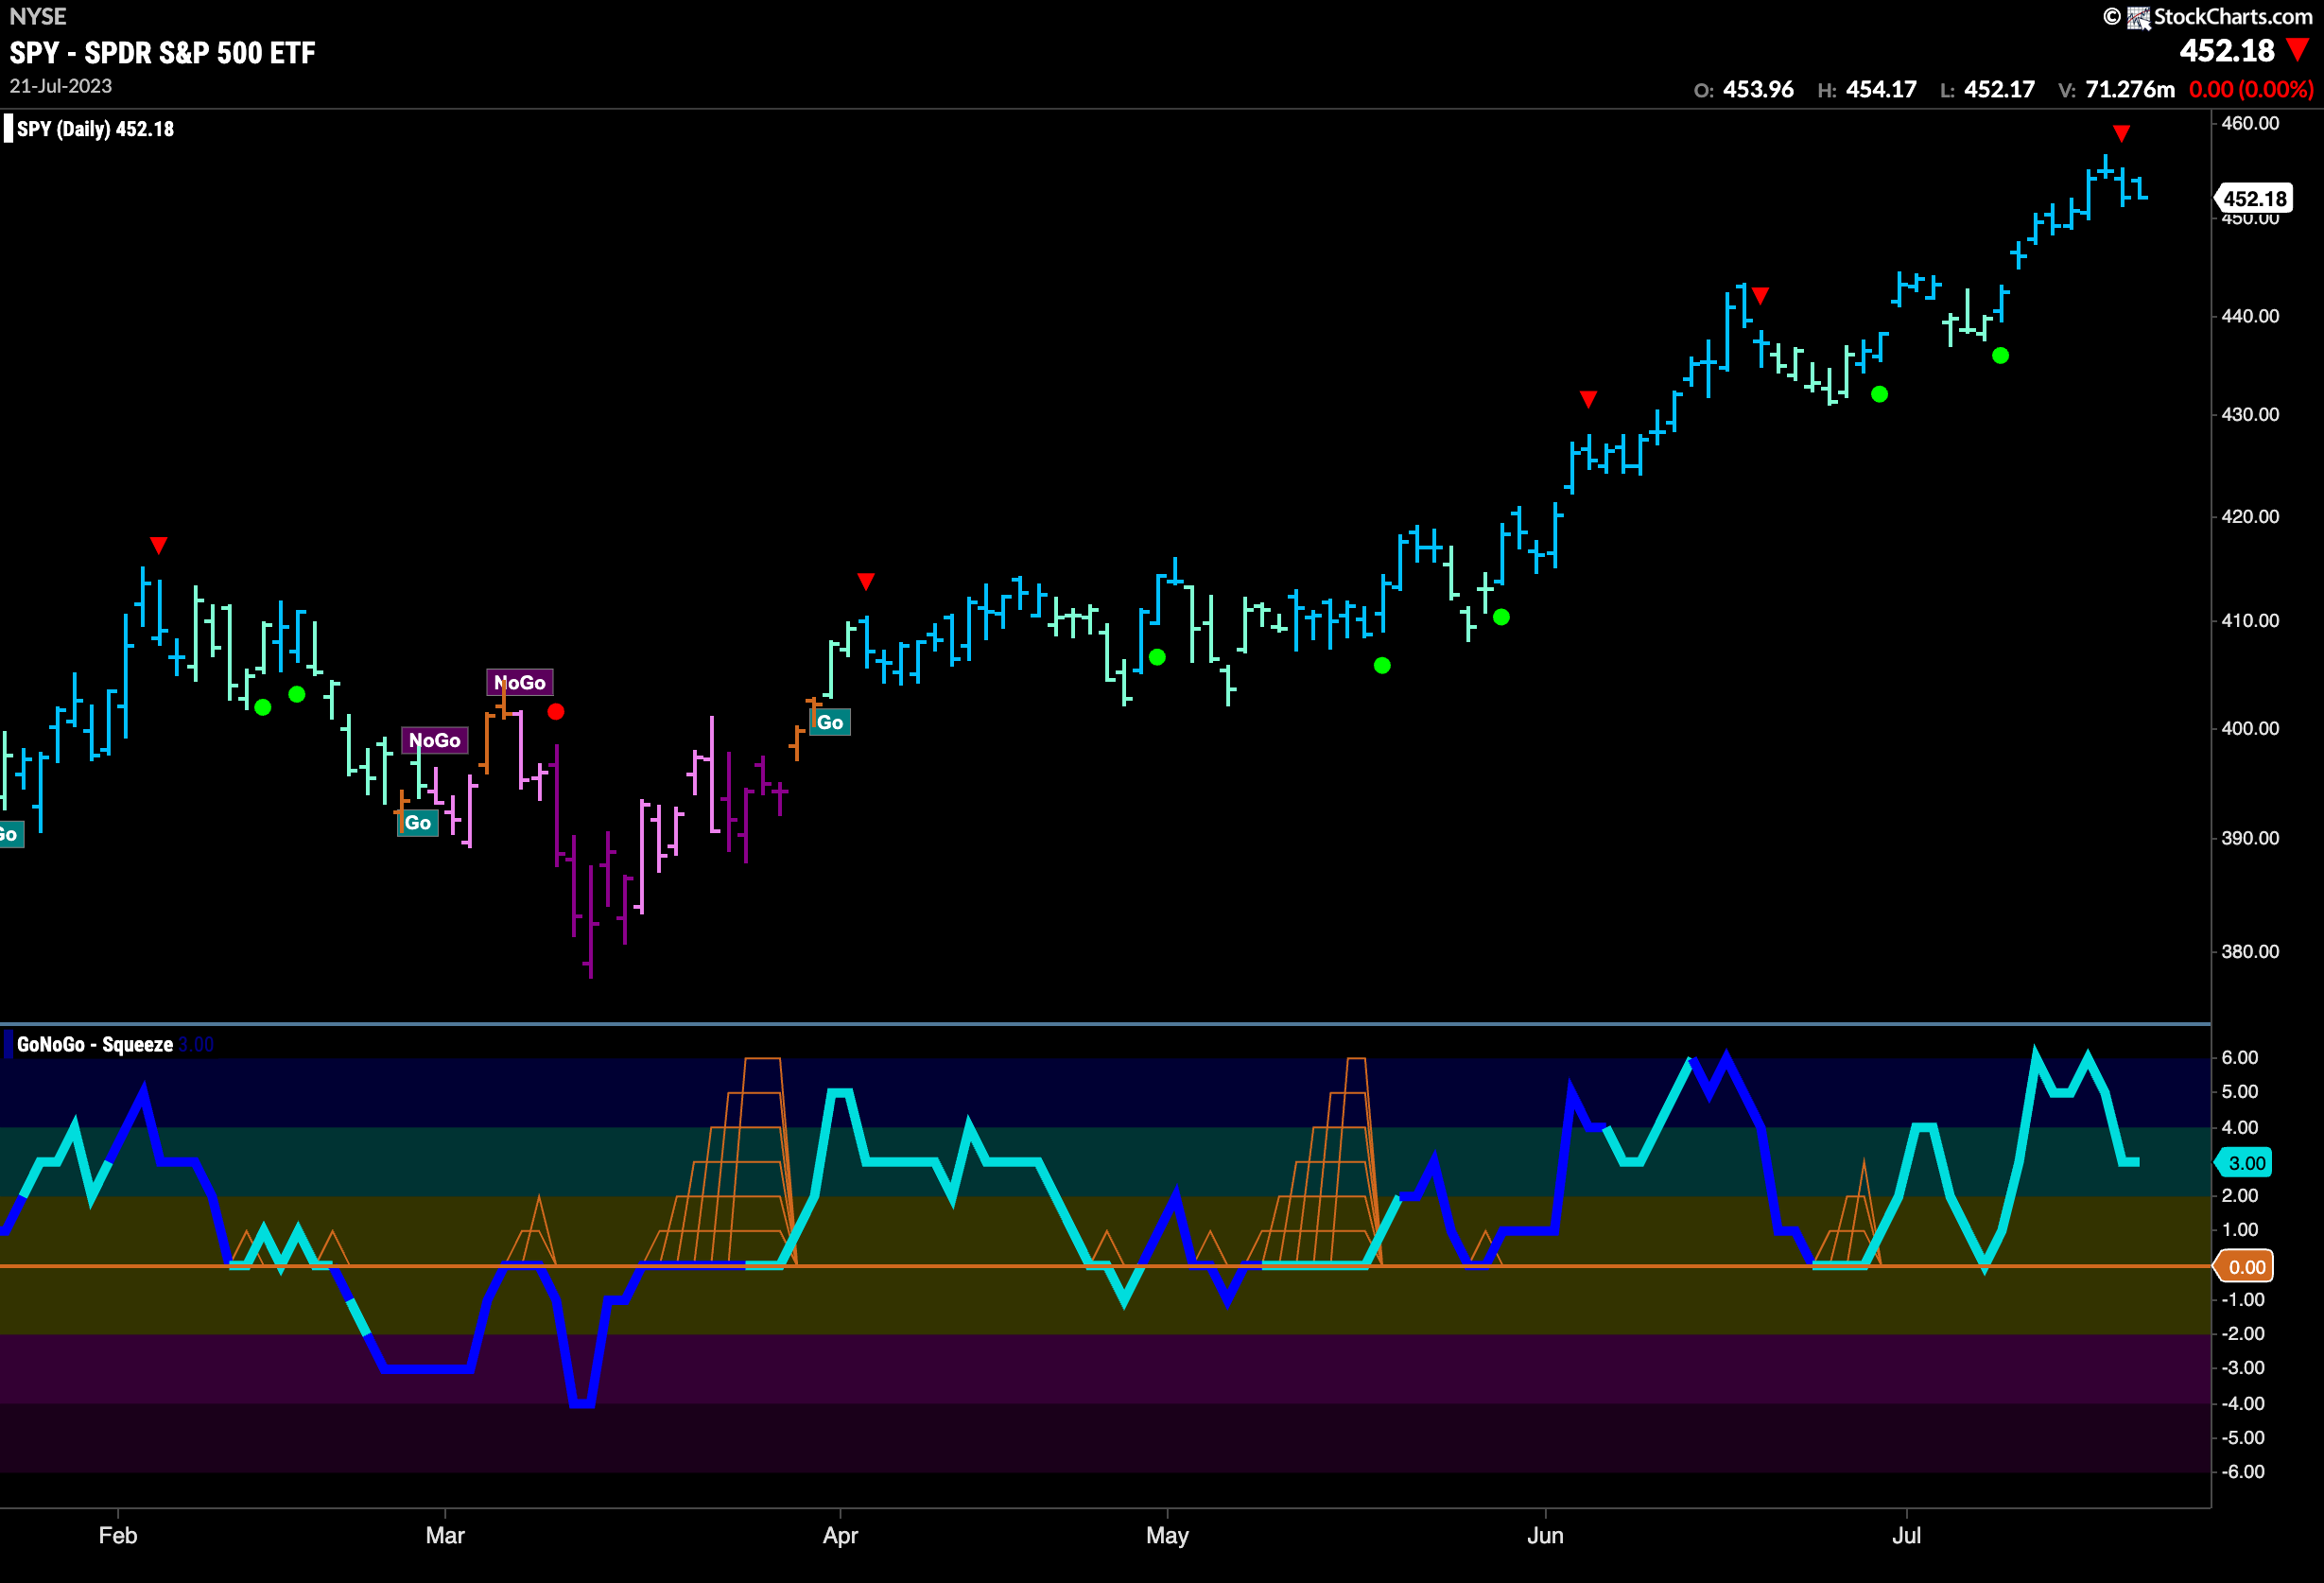
Equities Continue to Look Strong
GoNoGo Trend painted uninterrupted strong blue “Go” bars this week as price made a new higher high. GoNoGo Oscillator is in positive territory but no longer overbought. We will watch to see if prices can continue higher from here and perhaps even challenge all time highs.
The longer term weekly chart continues to show strength. Another strong blue “Go” bar this week although we can see that the range of trading for the week was smaller. GoNoGo Oscillator remains in positive territory but still hasn’t achieved overbought levels and volume is relatively light. We can see the high from late ’22 on this chart and that is the next level of obvious resistance. 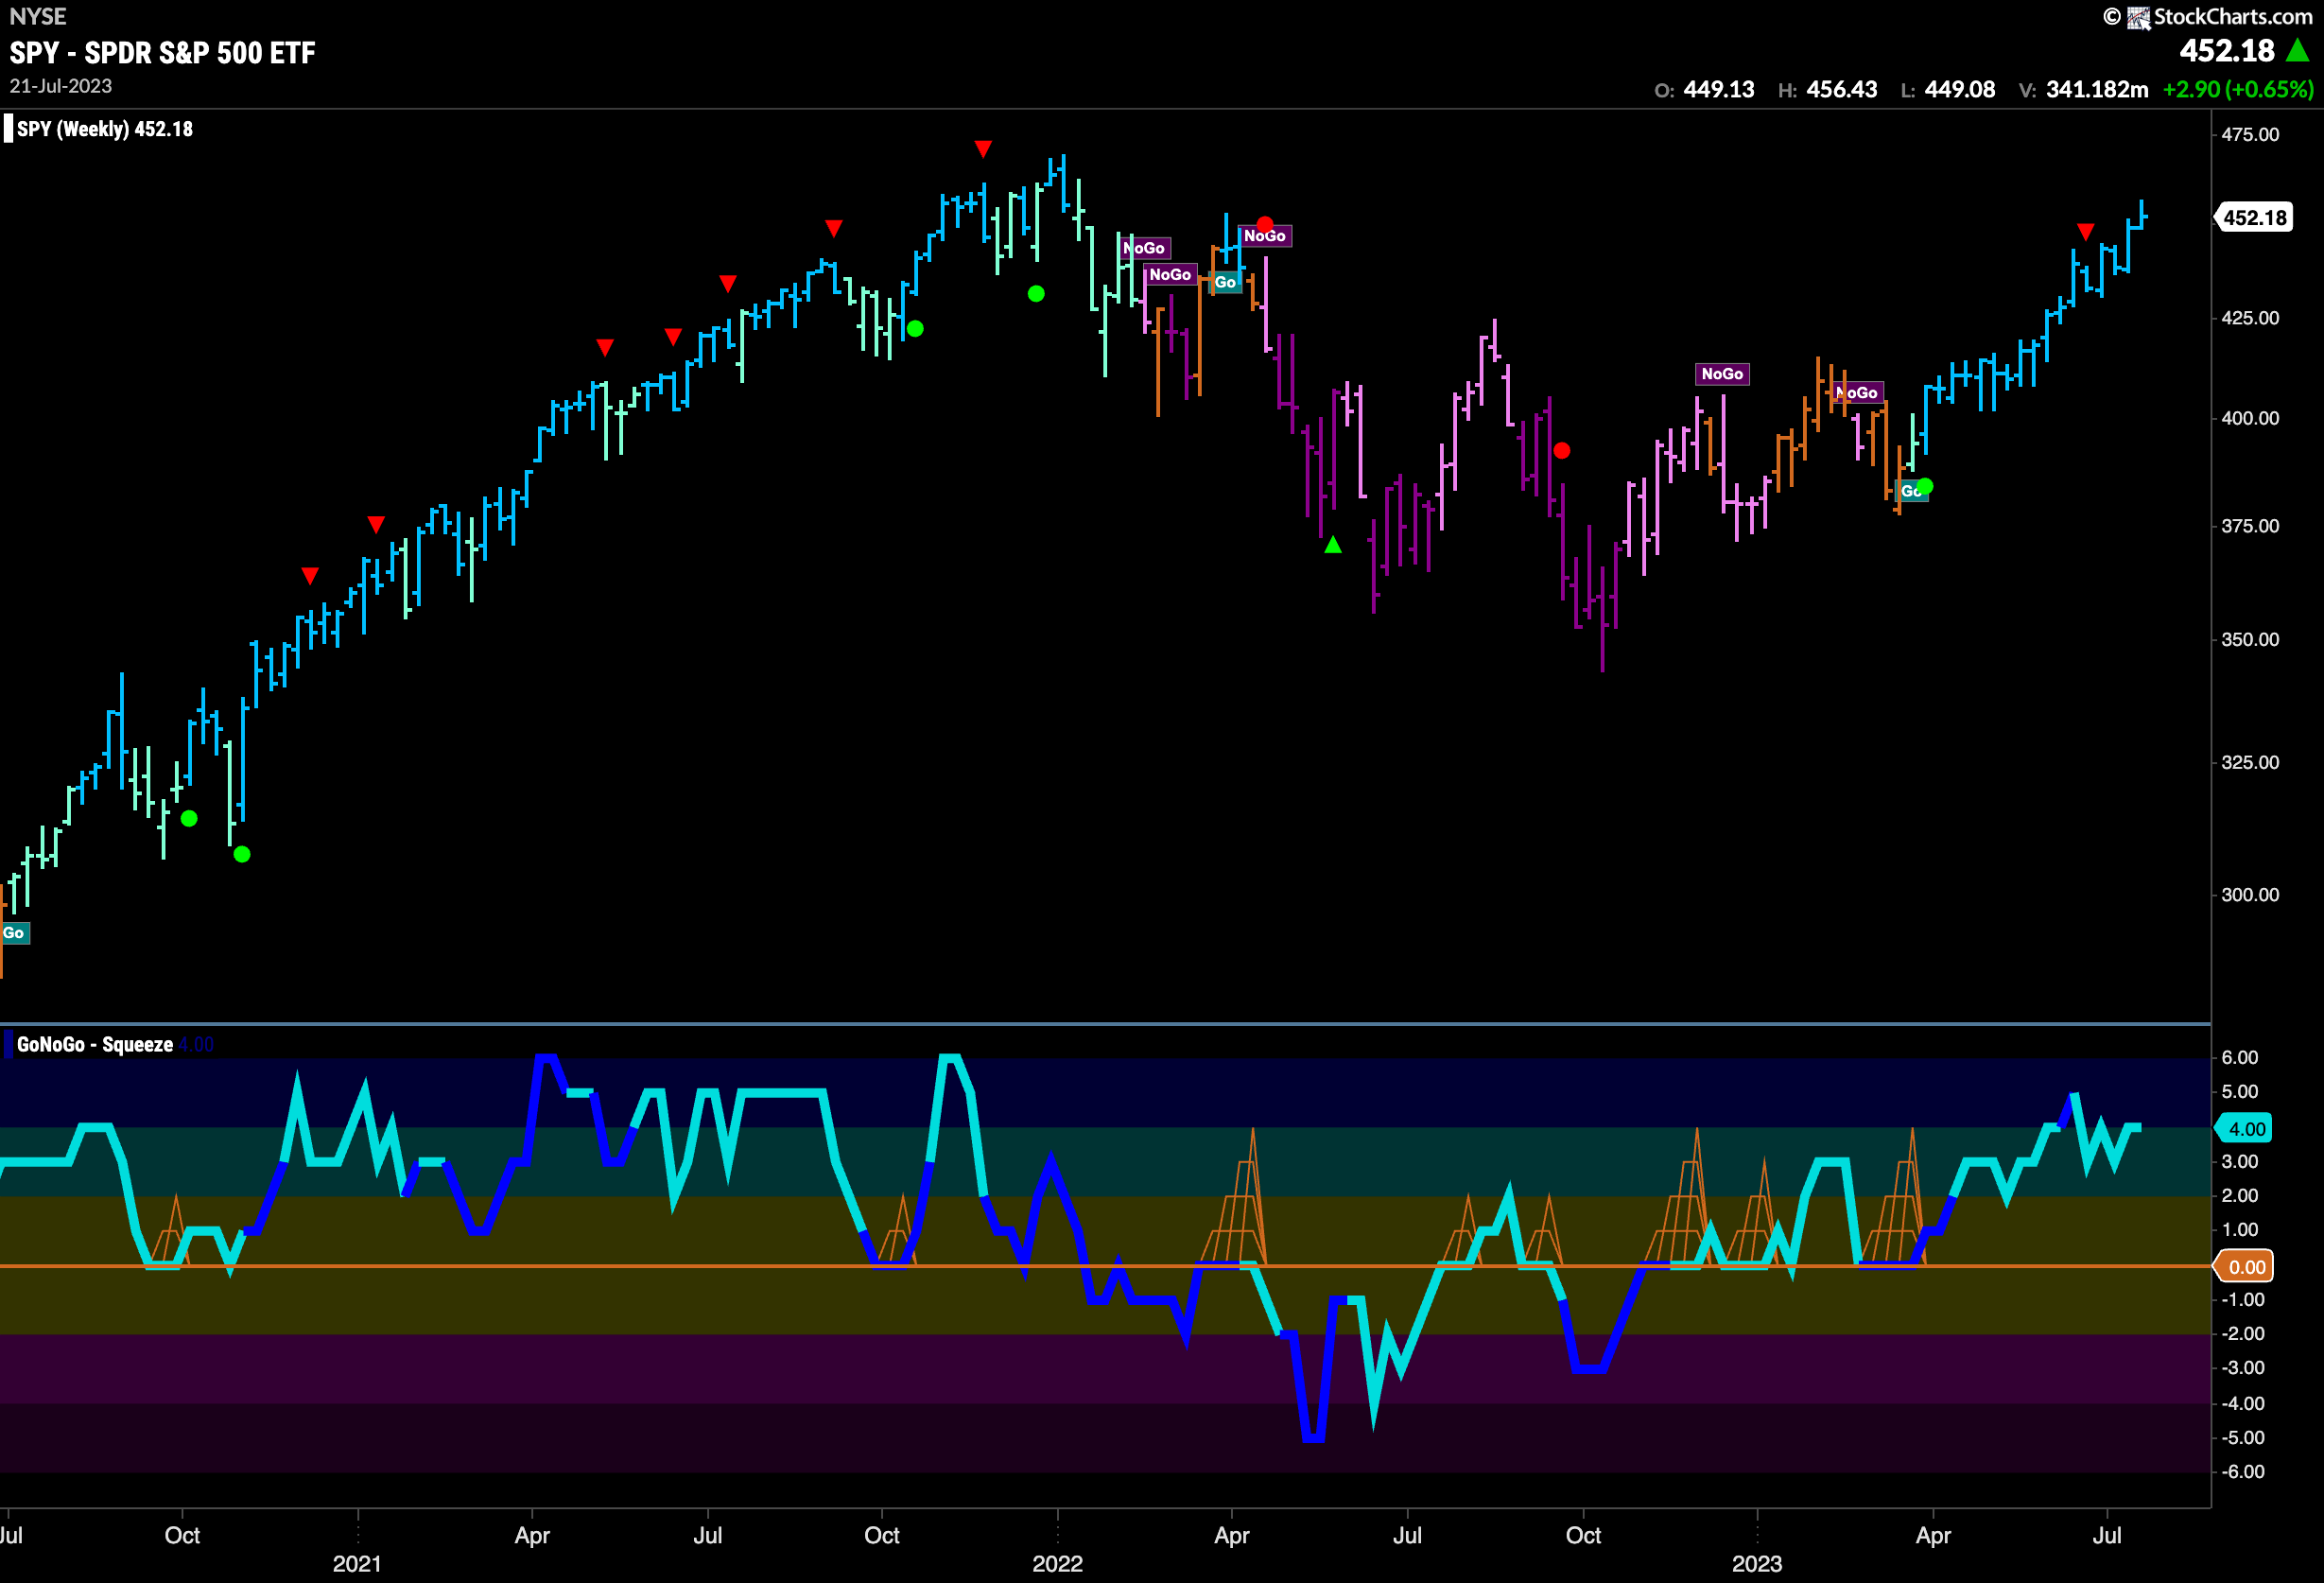
Treasury Bond Rates Settle into Range
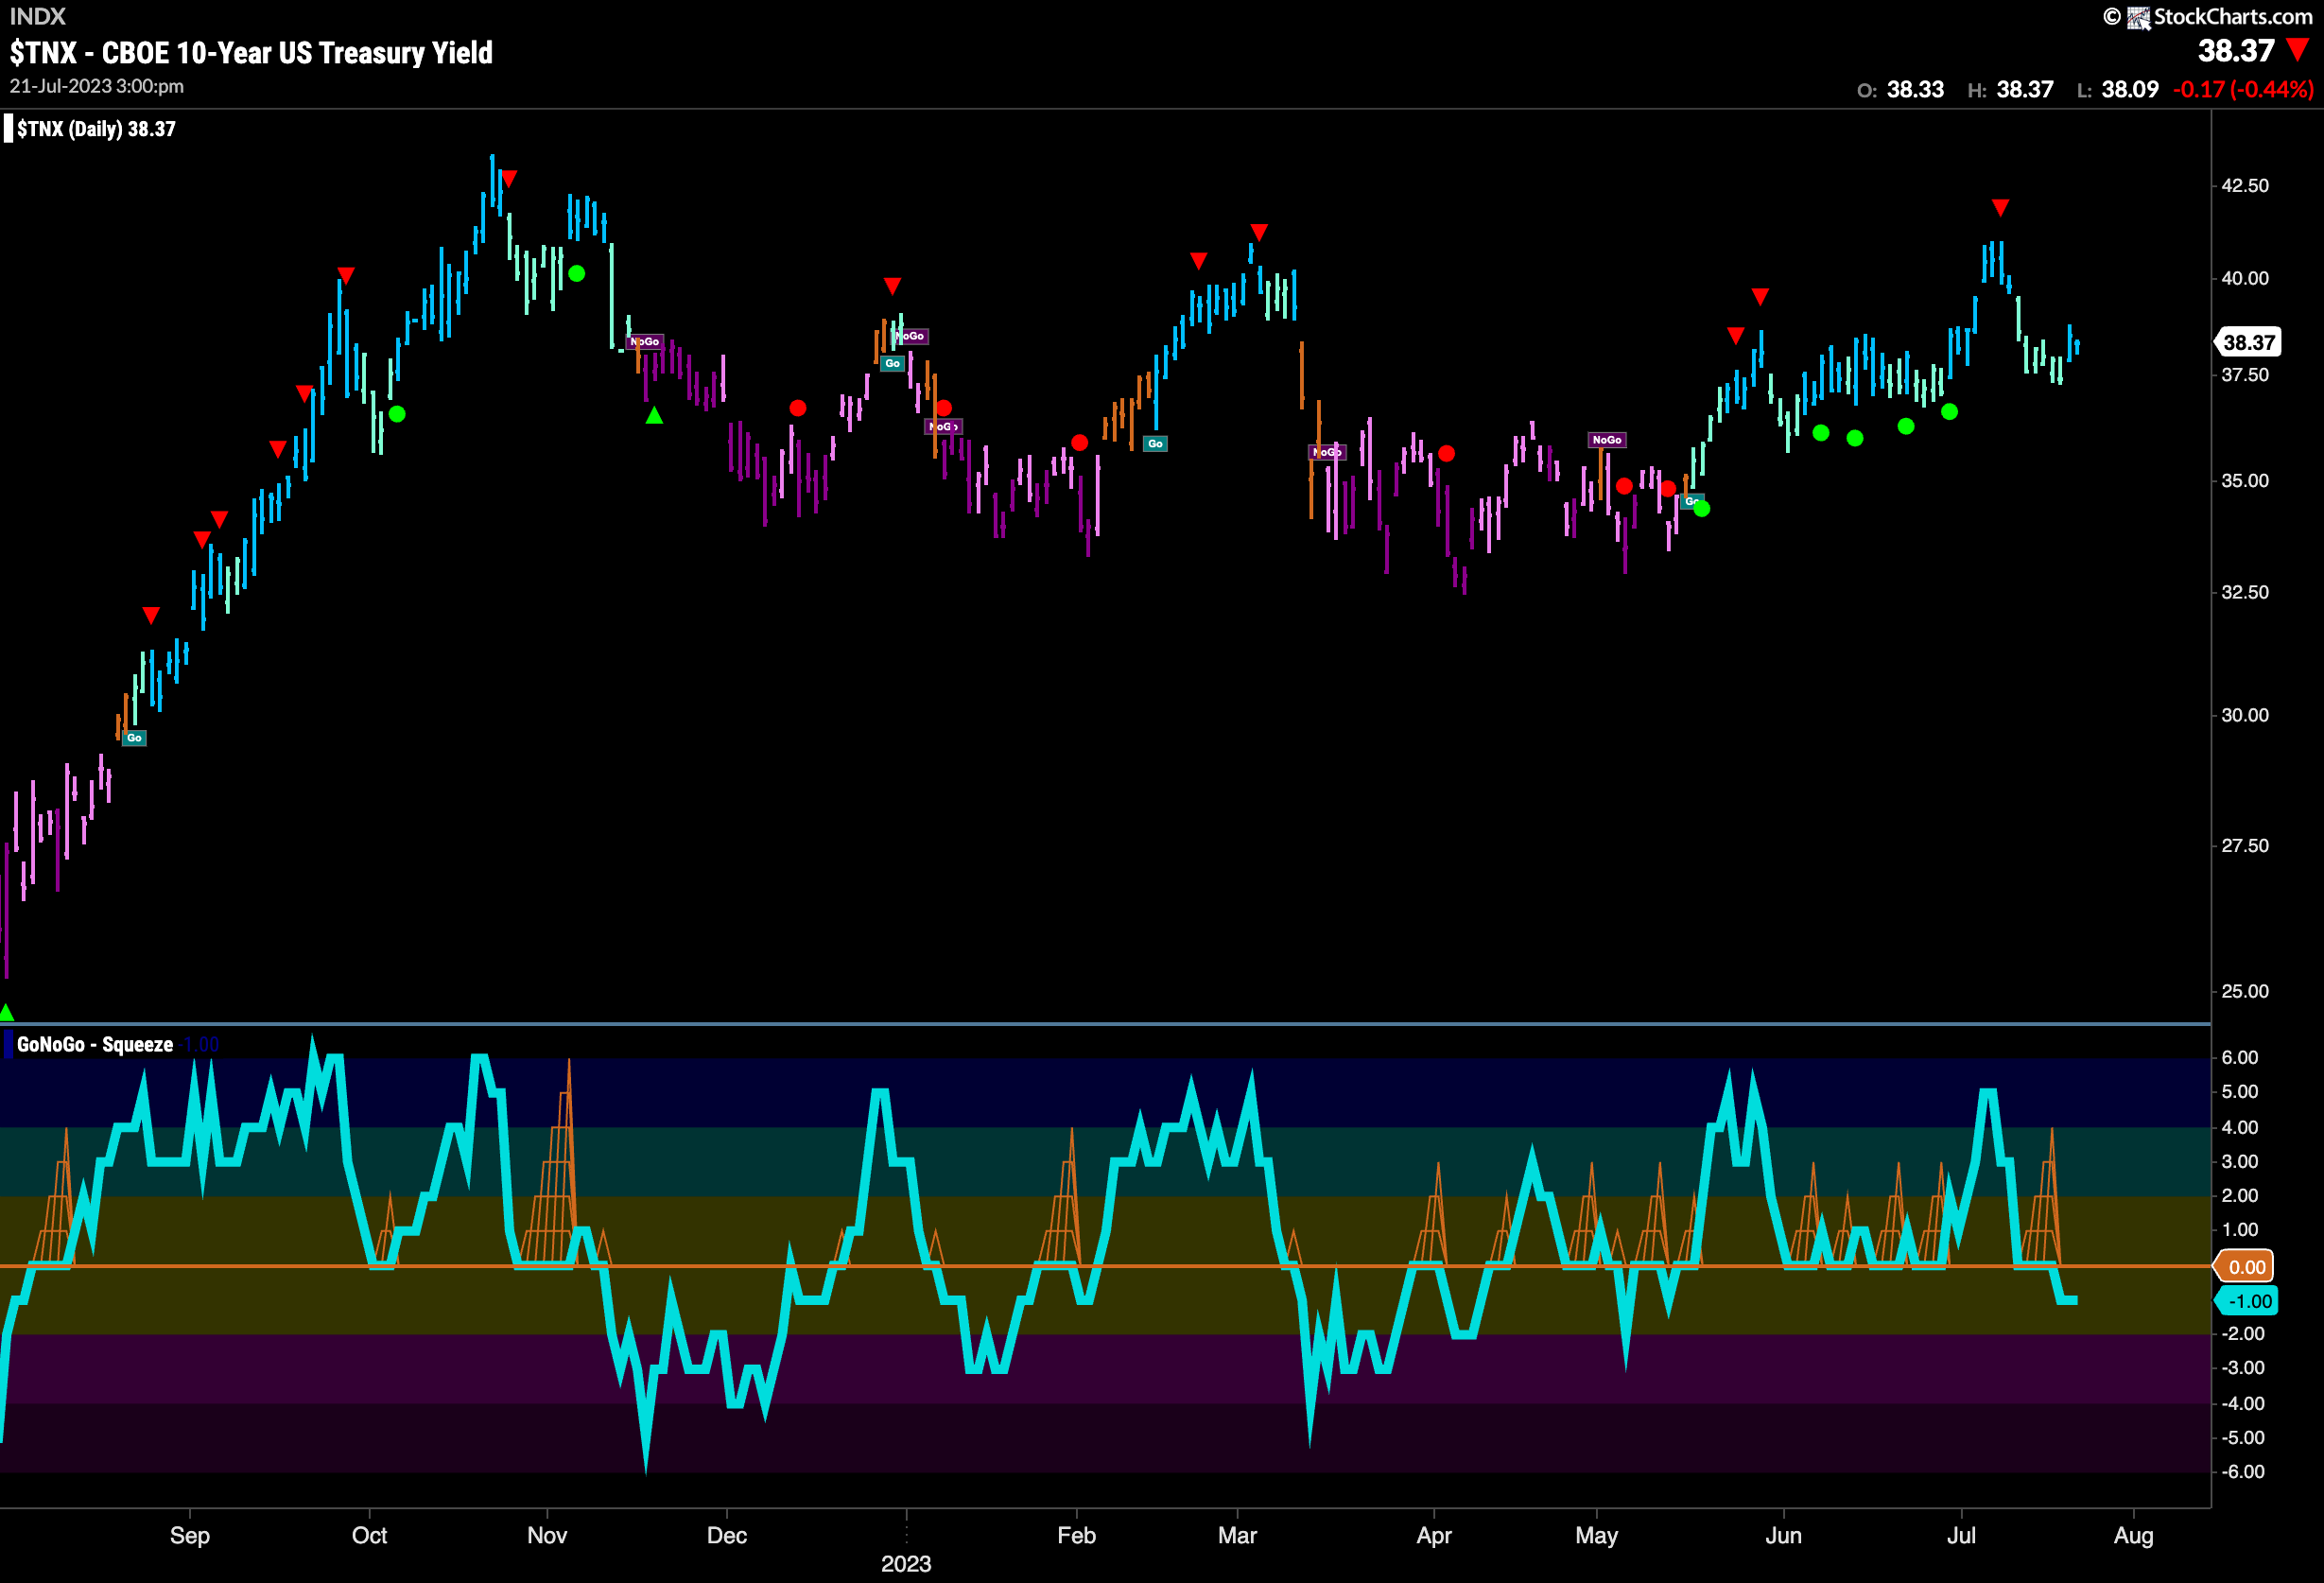
Treasury bond rates settled this week and found some support in the congestion from a month or two ago. GoNoGo Trend is still painting blue “Go” bars and so the weight of the evidence suggests that the easiest path is upward but we have seen strong resistance at slightly higher levels. GoNoGo Oscillator has also just broken below the zero line into negative territory and so we will watch to see if that negative momentum takes a toll on price.
Dollar Looks Range Bound
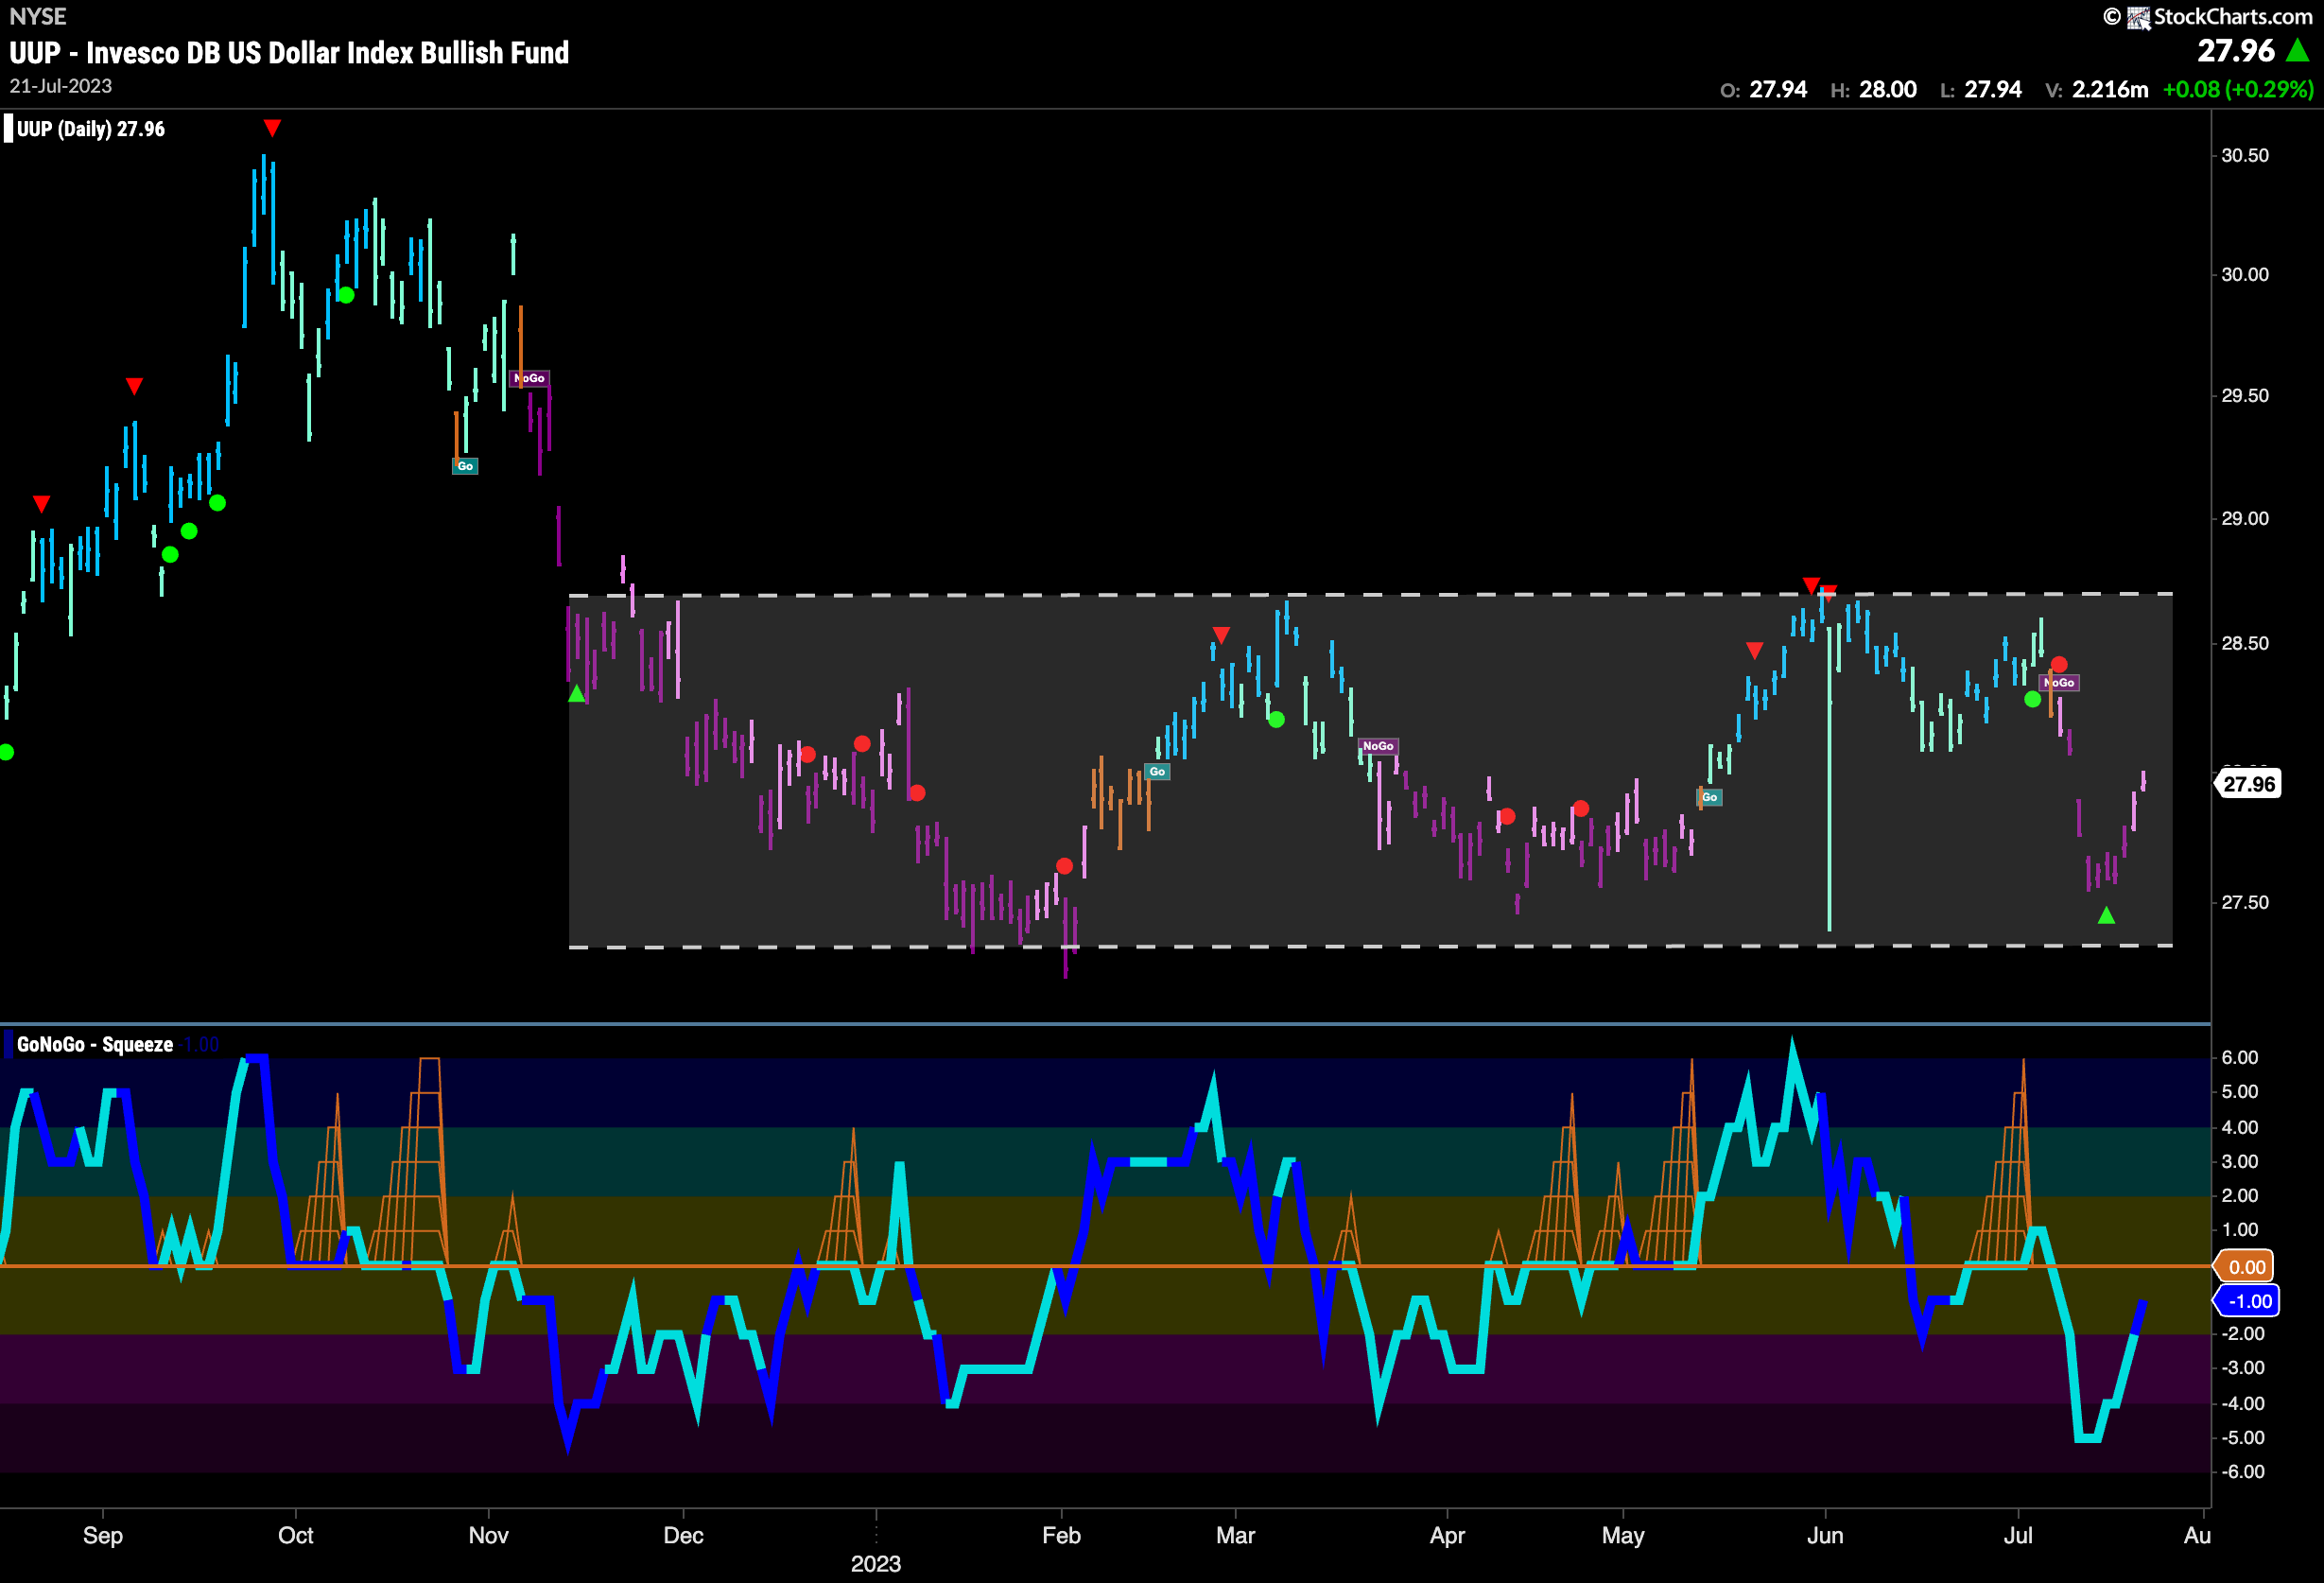
The dollar rallied this week after the disastrous drop it suffered last. Firmly in the middle of the sideways channel it will take something special for the green back to break out. GoNoGo Trend is now painting weak pink “NoGo” bars and GoNoGo Oscillator is in negative territory and rising toward the zero line on heavy volume. We will watch to see if the oscillator remains in negative territory and if it finds resistance at the zero line going forward.
Oil Continues to Flirt with Downward Sloping Resistance
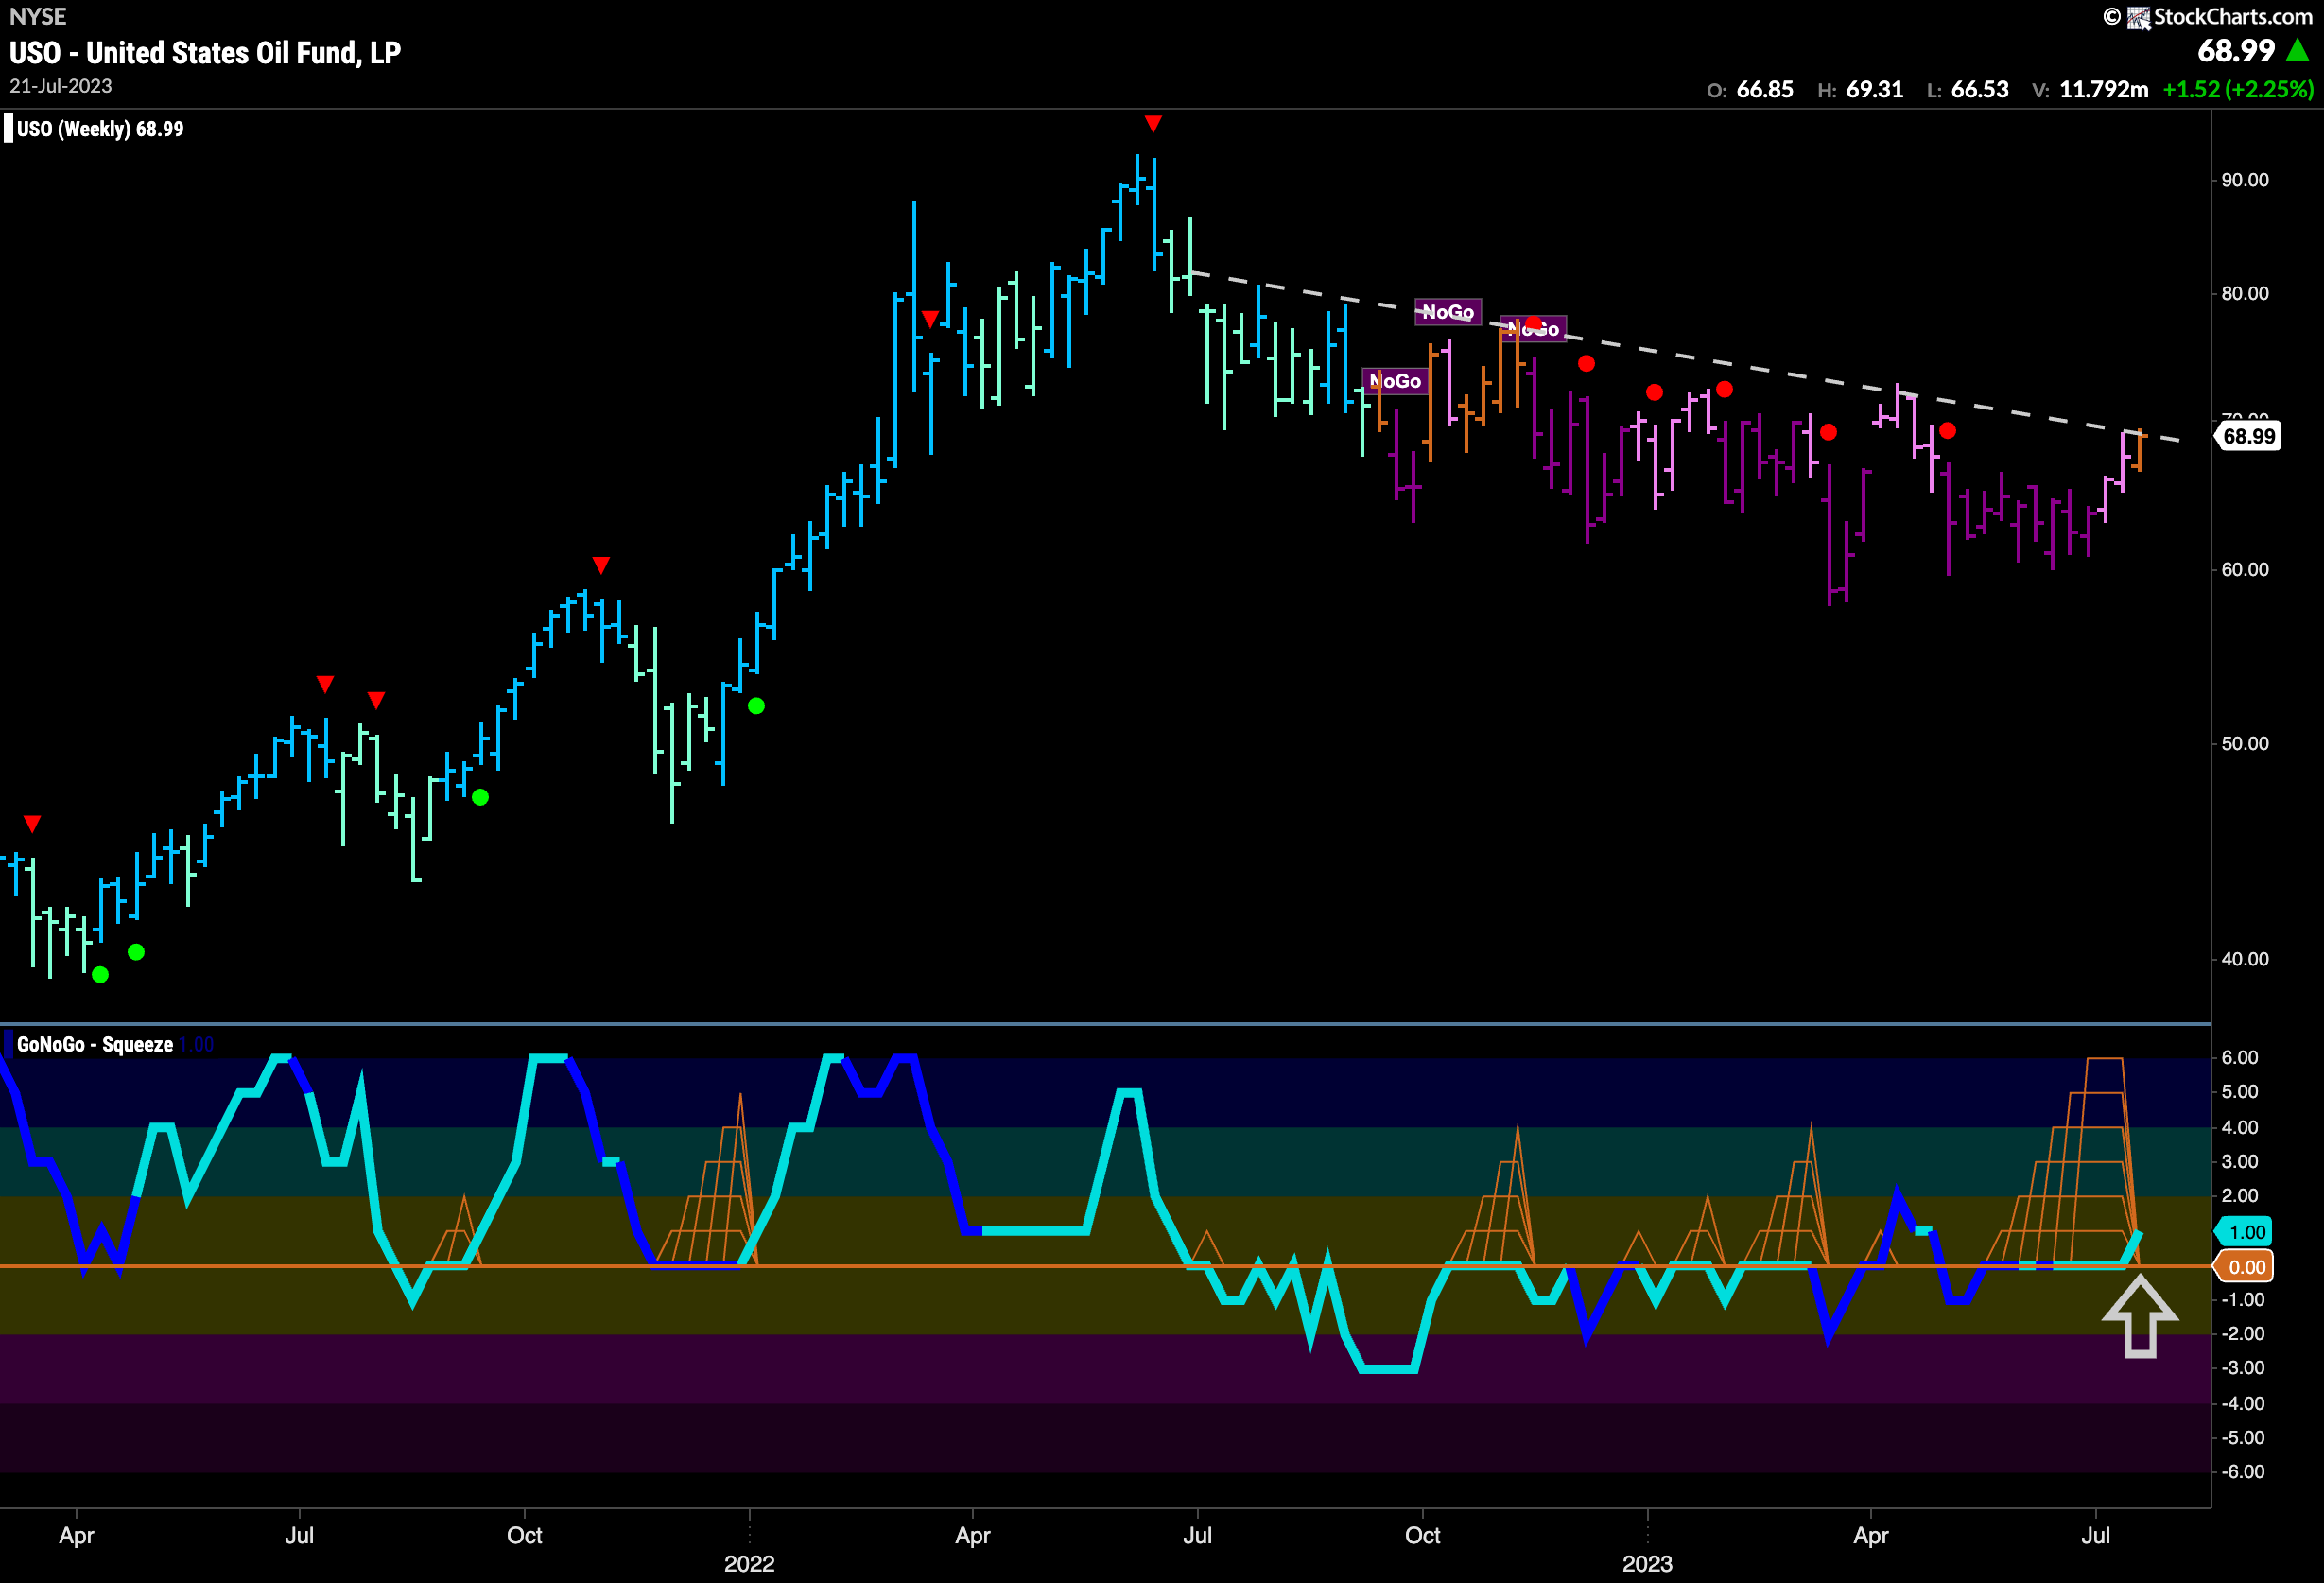
Oil continues to put pressure on the resistance from the downward sloping trend line we see on the chart below. This past week actually say an amber “Go Fish” bar painted which tell us there is some uncertainty surrounding the price action. No longer in a “NoGo’ we will look to see if price can break out higher. GoNoGo Oscillator has also broken out of a Max GoNoGo Squeeze into positive territory which suggests momentum is favoring an attempt for higher prices.
Gold Saw “Go” Trend Emerge
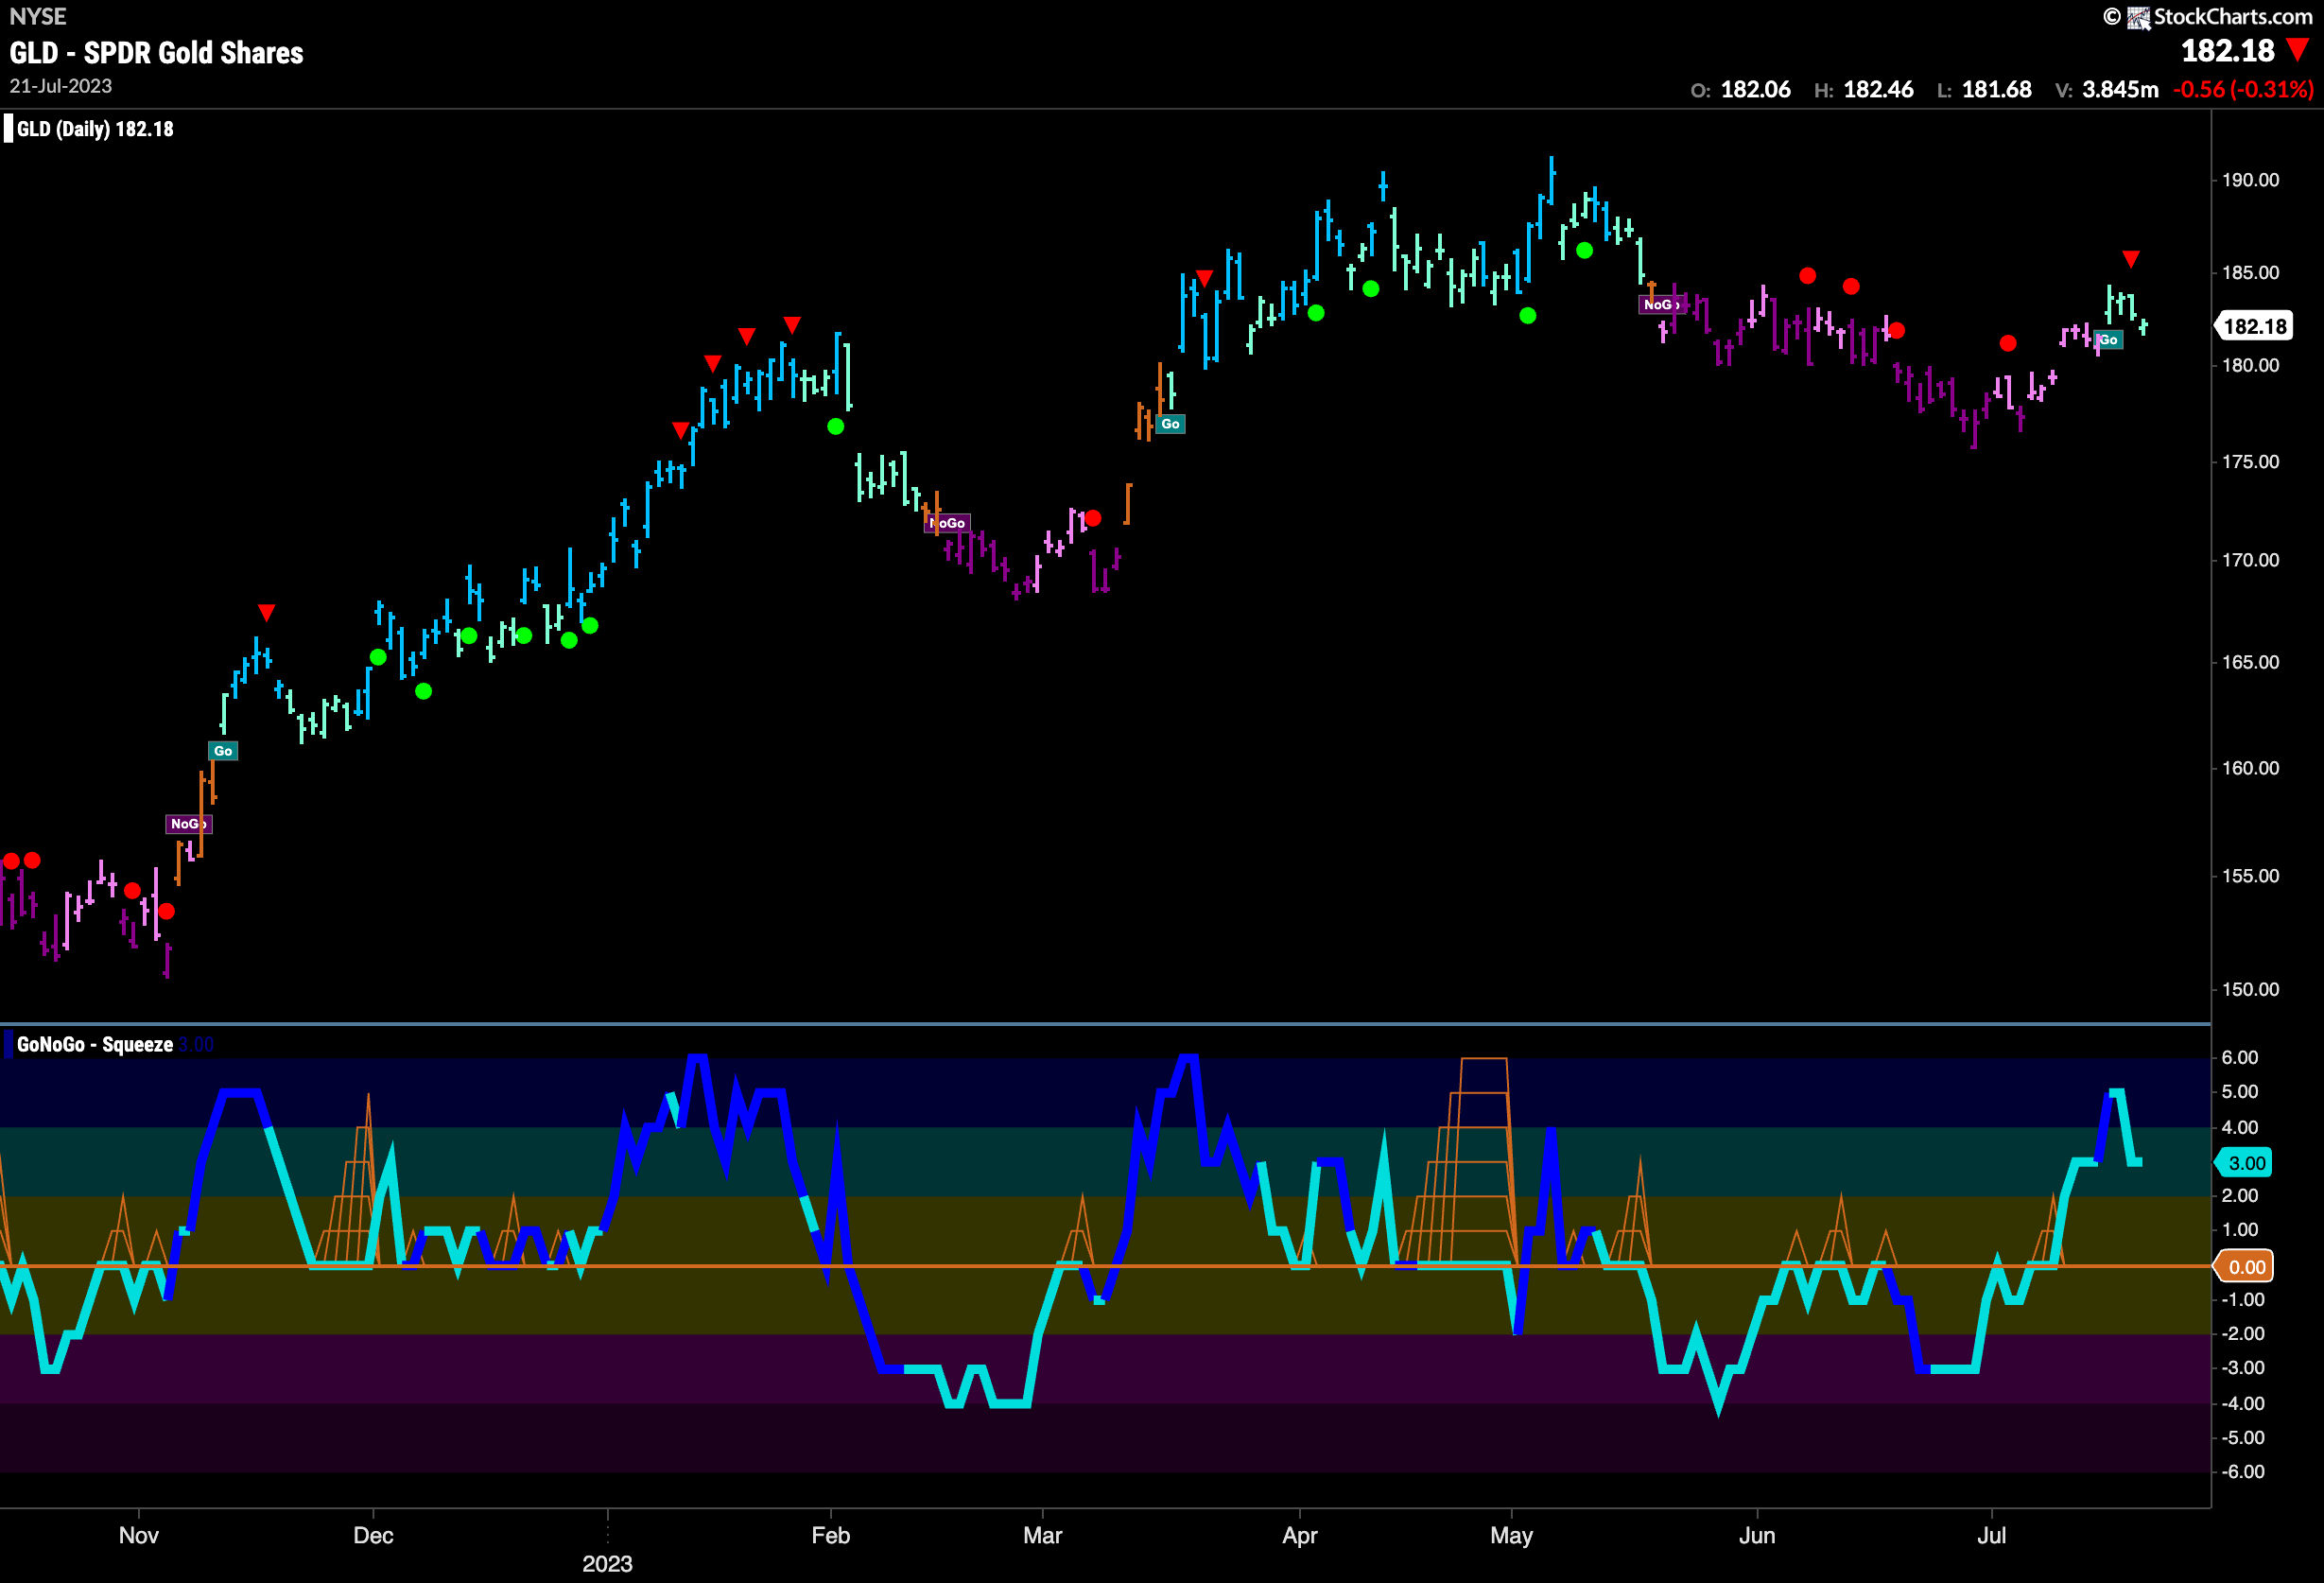
GoNoGo Trend painted aqua “Go” bars this week as price tried to hold on to its recent gains. We will be watching closely this week to see if the trend holds. GoNoGo Oscillator is in positive territory but no longer oversold and volume is weaker than it was. If momentum can stay positive we will look to see if price can set a new higher high.
Sector RelMap
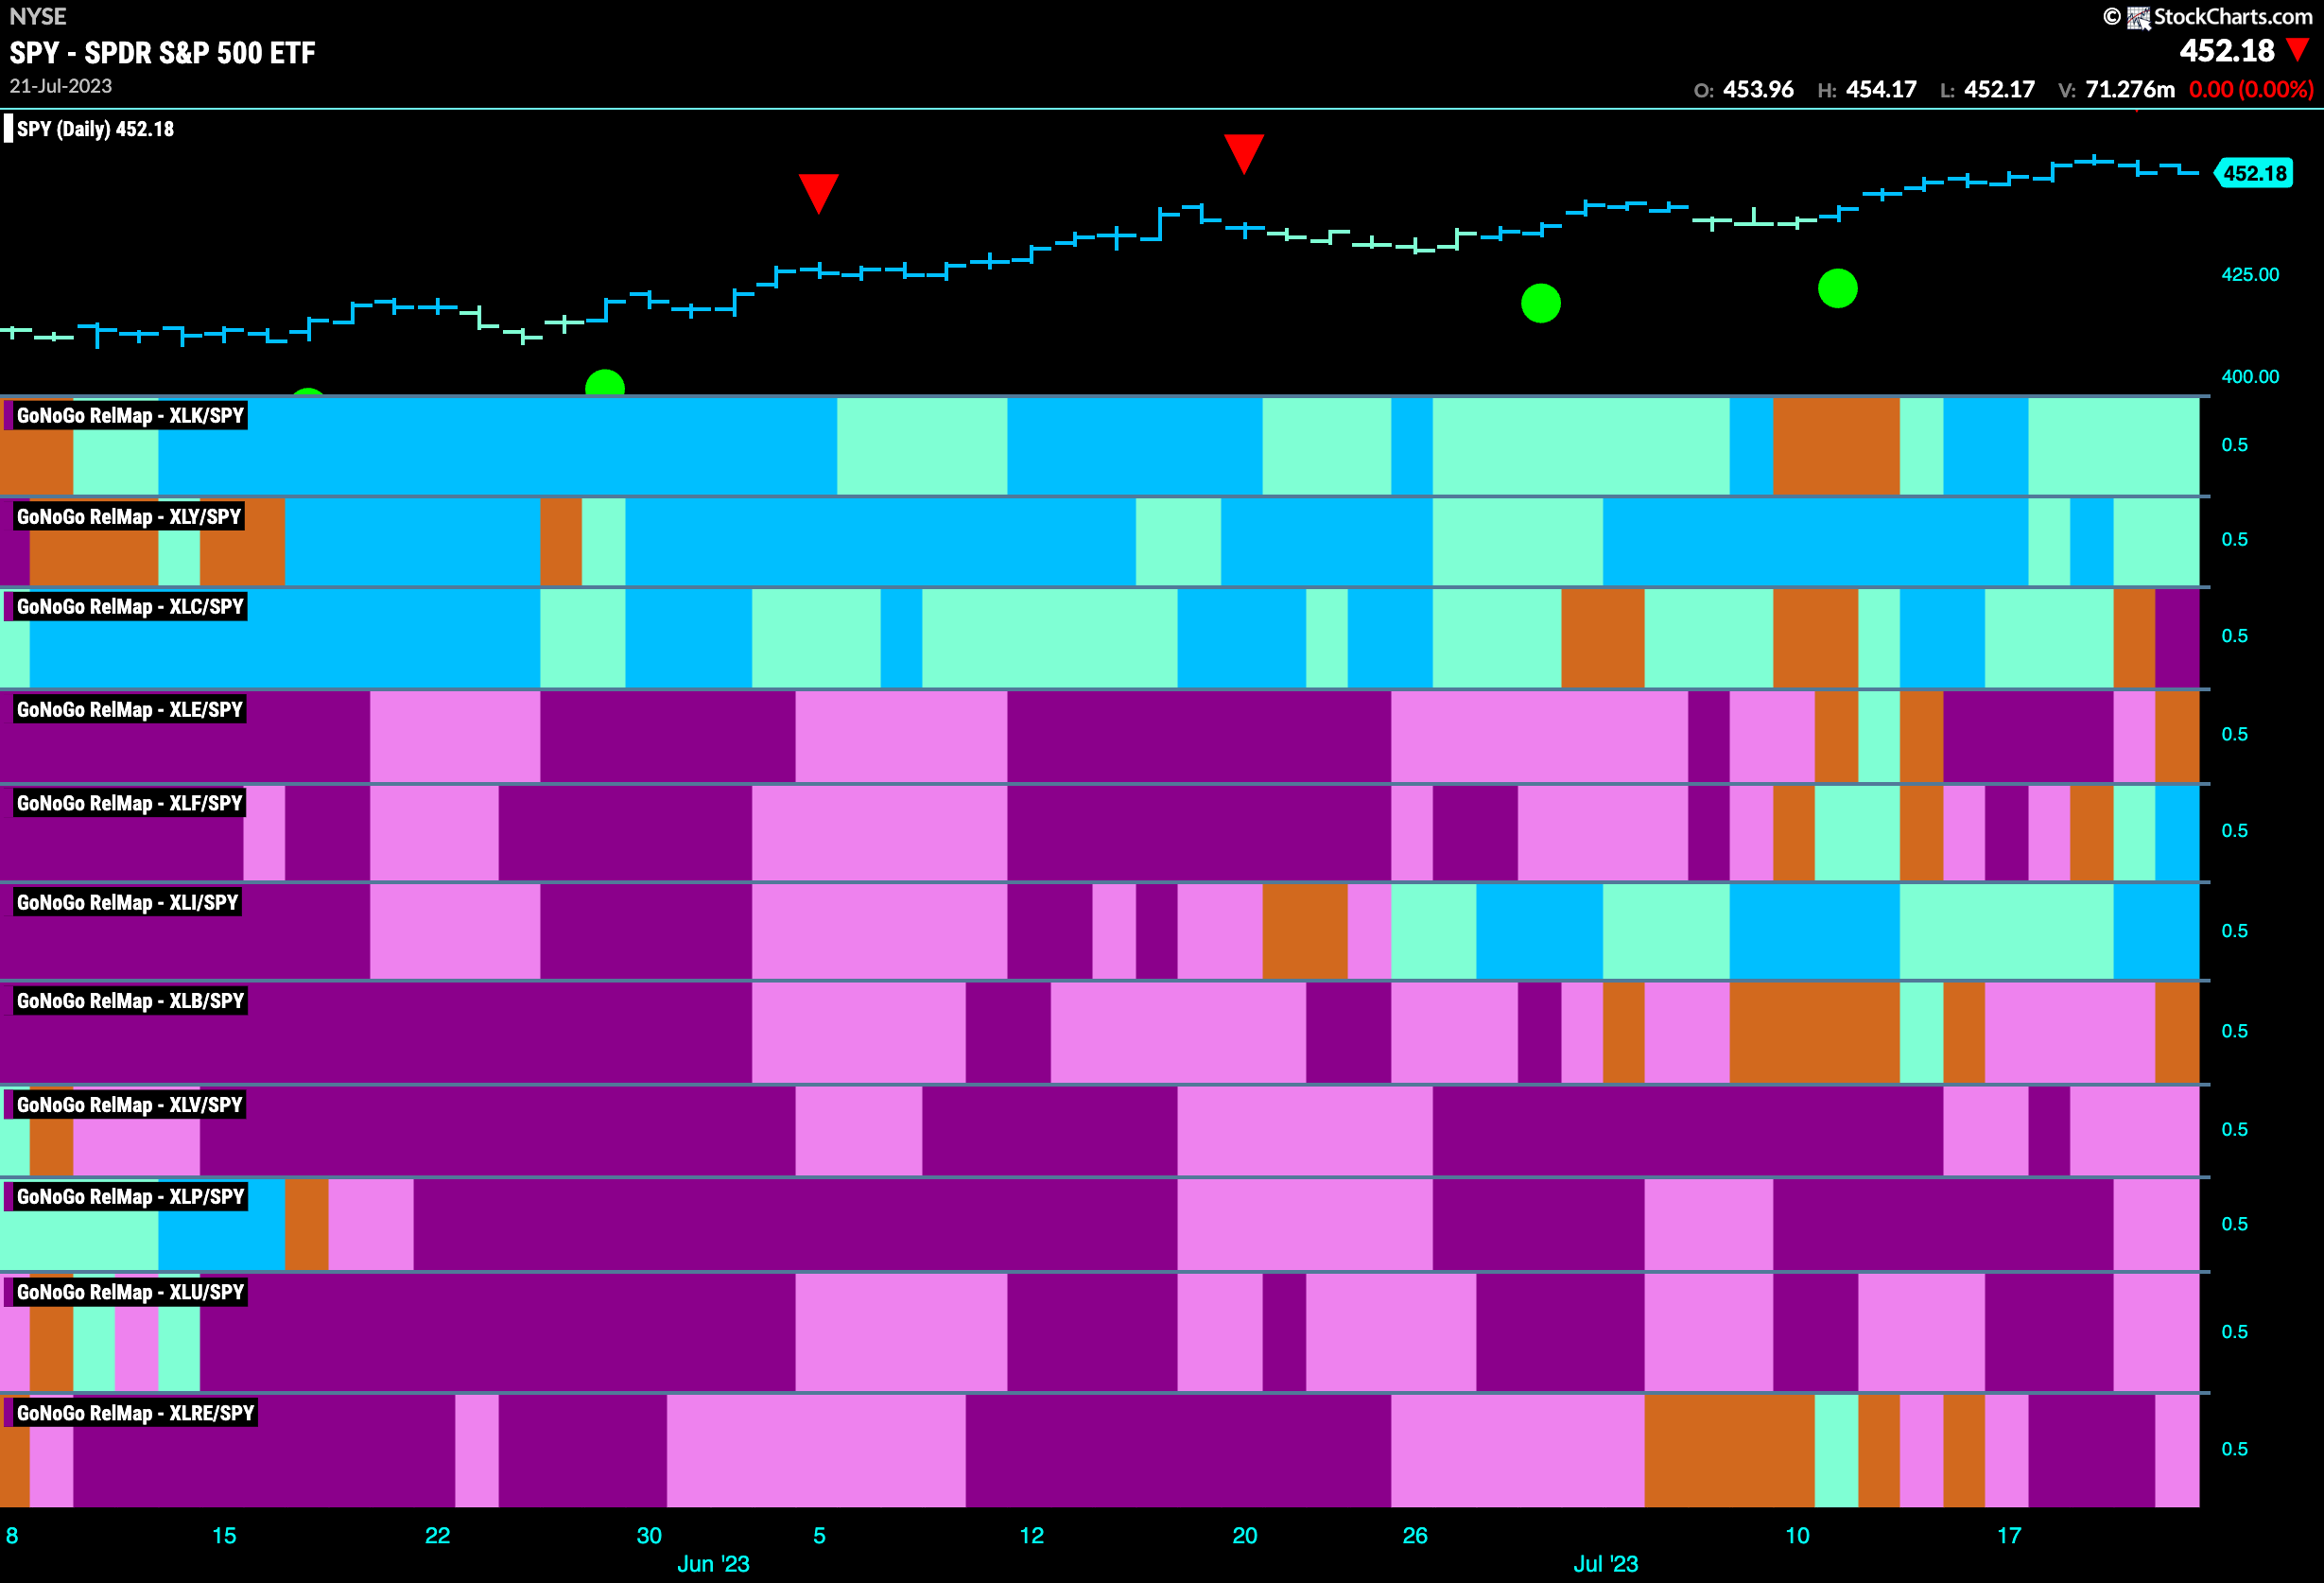
Below is the GoNoGo Sector RelMap. This GoNoGo RelMap applies the GoNoGo Trend to the relative strength ratios of the sectors to the base index. Looking at this map, we can quickly see where the relative outperformance is coming from as well as which sectors are lagging on a relative basis. 4 sectors are outperforming the base index this week. $XLK, $XLY, $XLF and $XLI are painting “Go” bars.
Can $META Continue Higher?
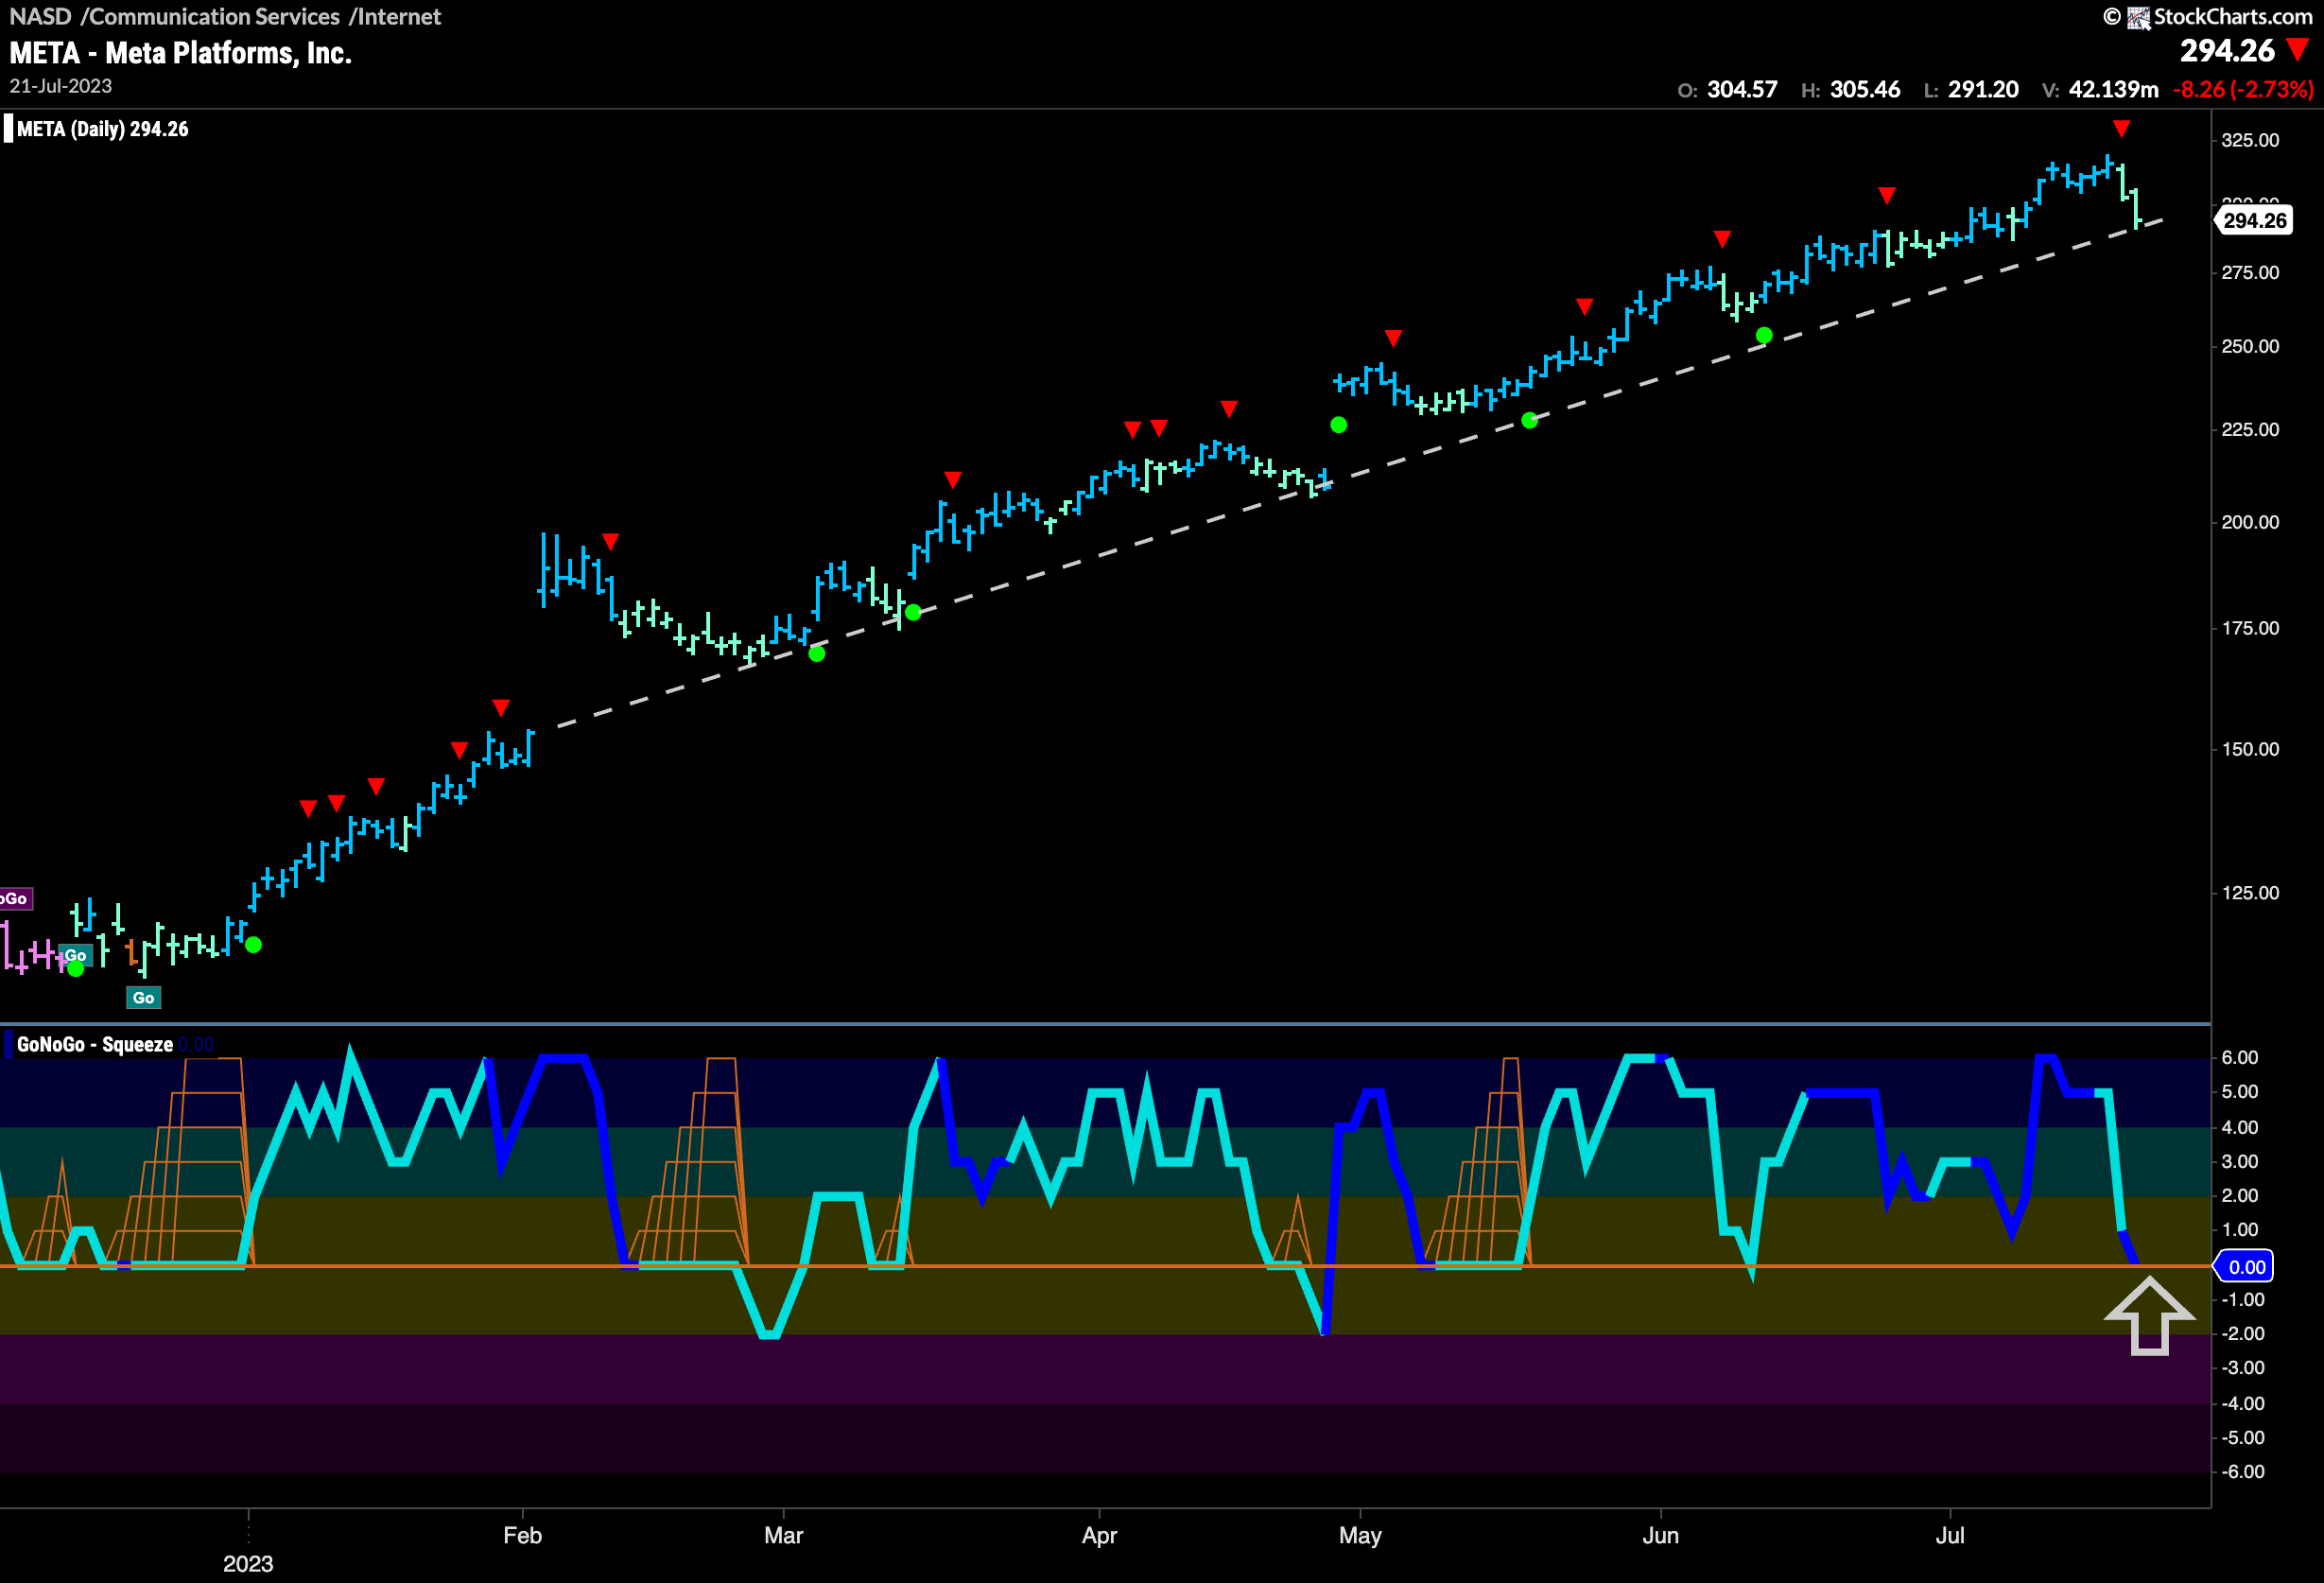
As we saw on the GoNoGo Sector RelMap above, the communications sector has fallen out of its relative “Go” trend and for the first time in some time is painting “NoGo” bars on a relative basis. What does this mean for a giant like $META which has been in an incredibly strong “GO” trend? We can see that price is currently testing support from its trend line and GoNoGo Trend is painting weaker aqua bars. We will need to see this support hold. GoNoGo Oscillator is testing the zero line from above. This is a critical piece of the puzzle. The zero line should act as support here for the oscillator if the trend in price is to remain strong.
$BAC Breaking Higher
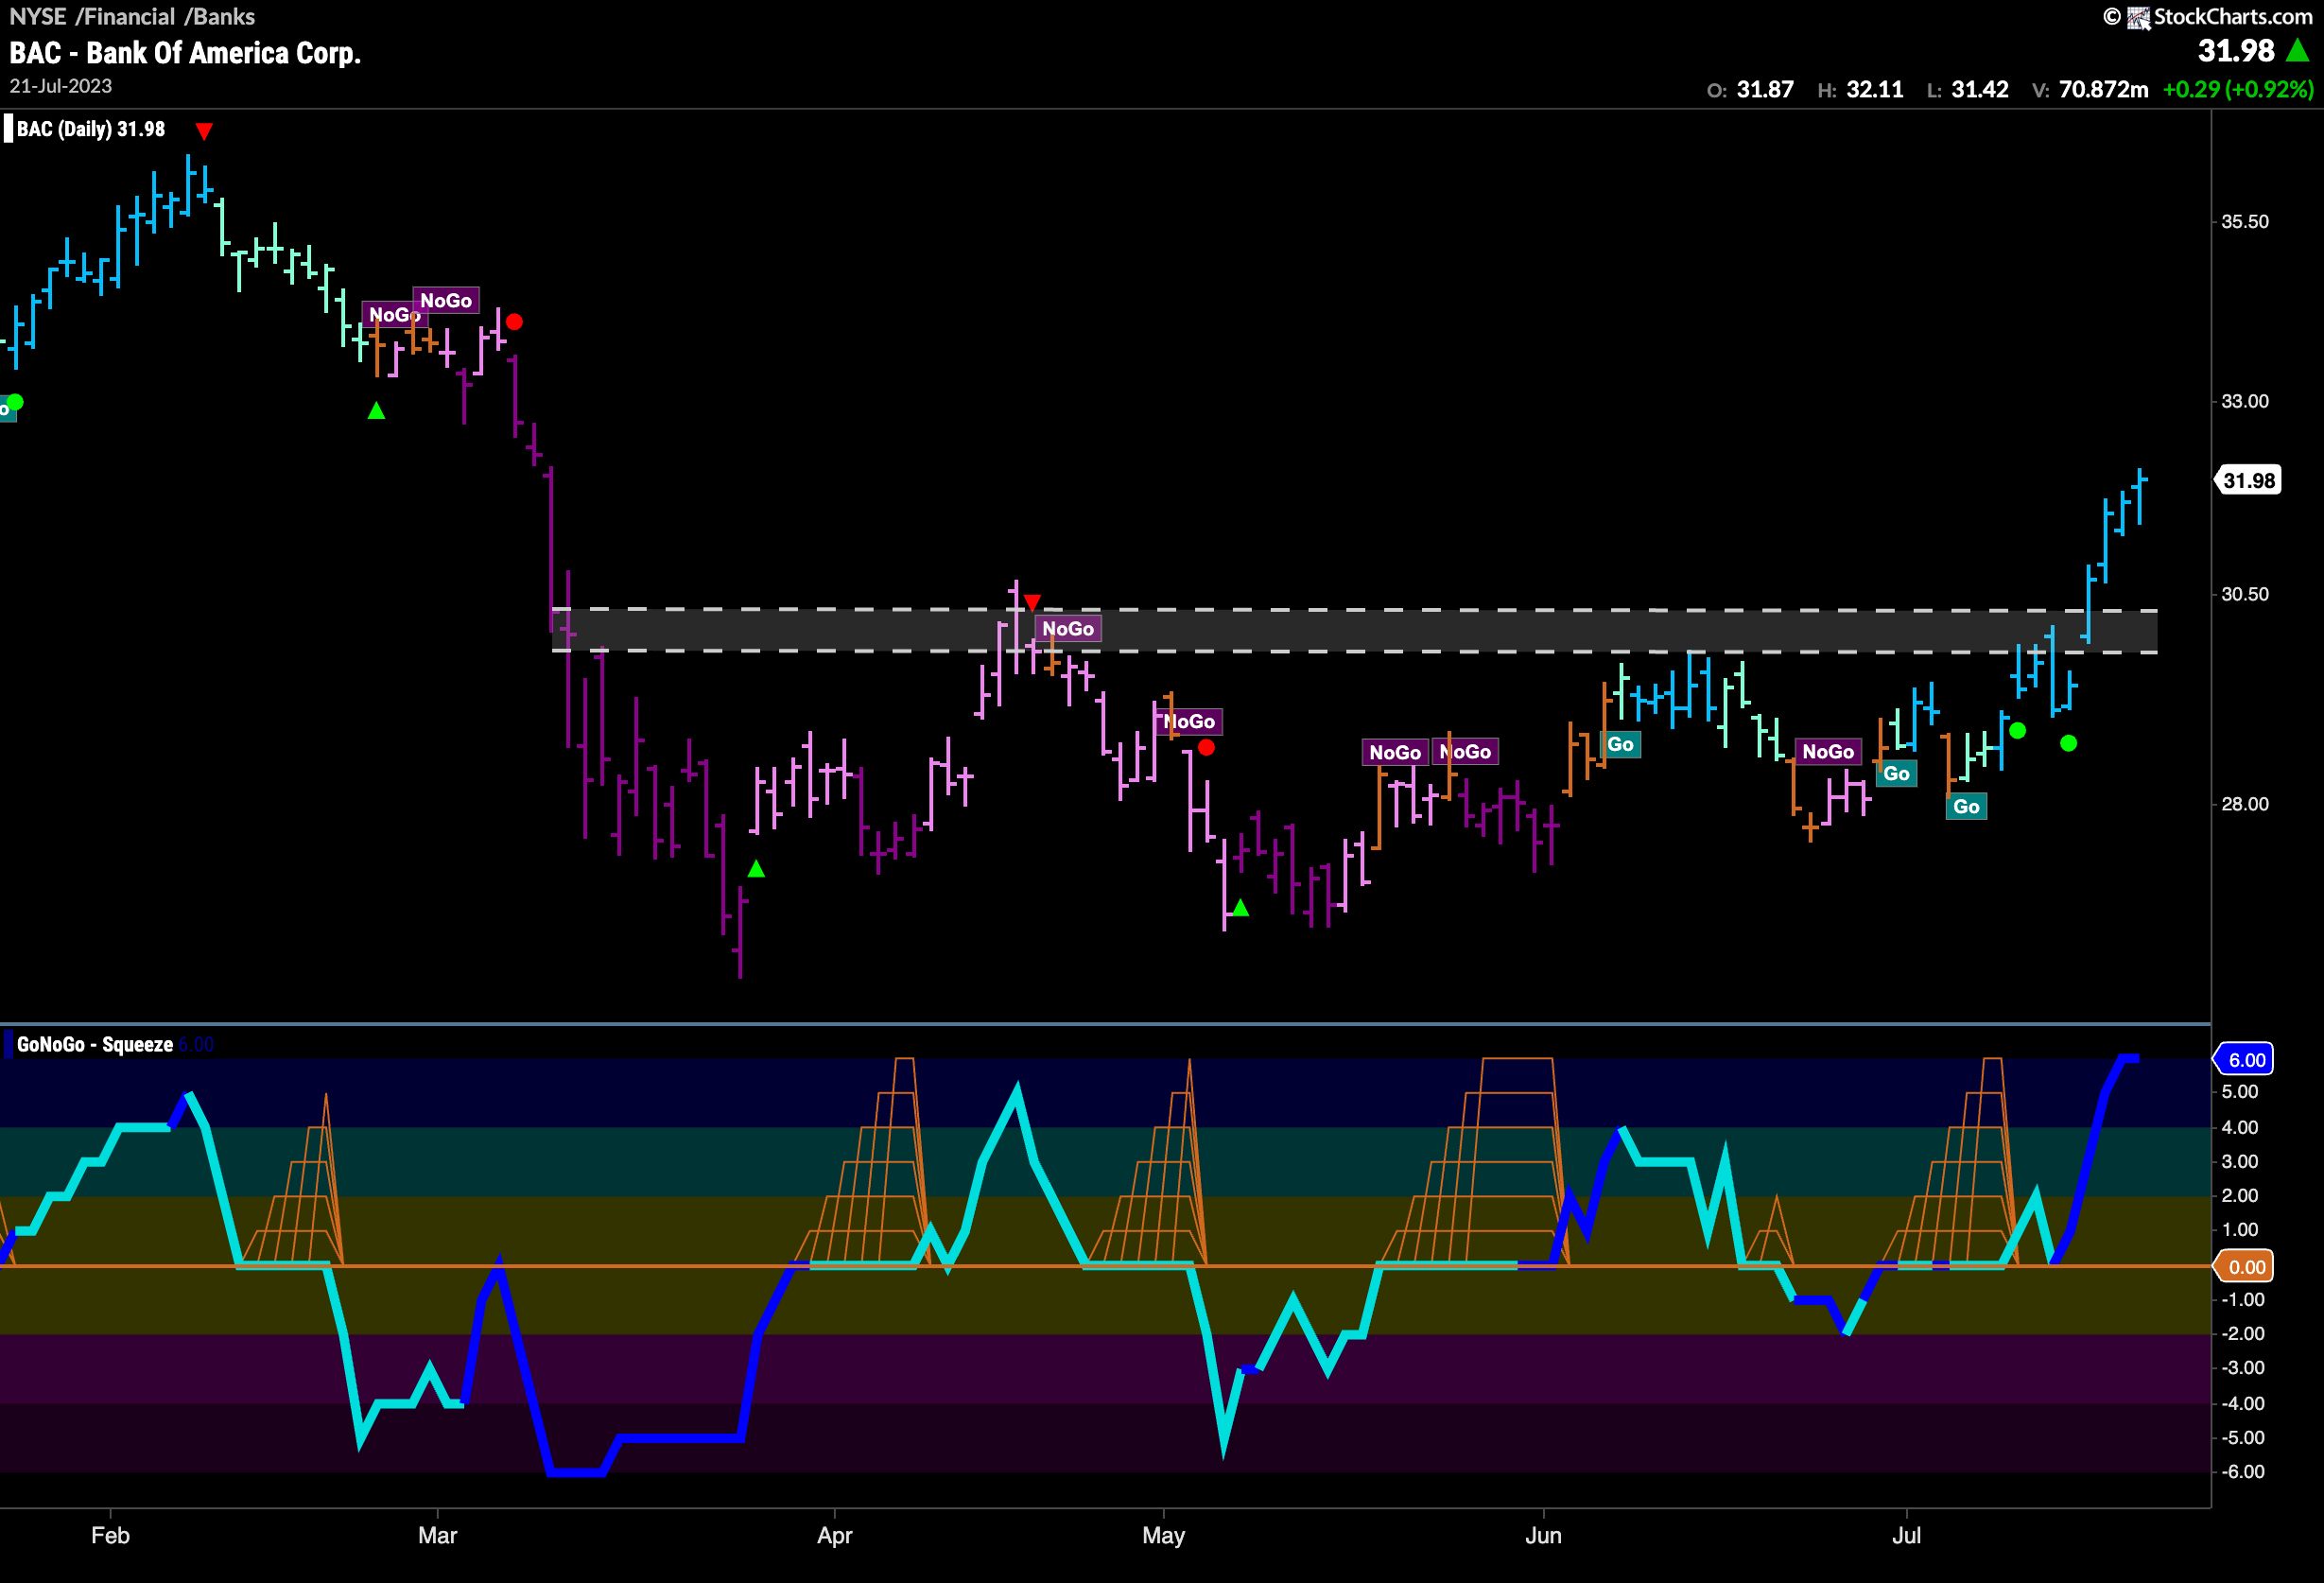
The Sector RelMap above shows that financials has joined the leadership party. On a relative basis to the $SPY, $XLF painted “Go” bars this past week and ended with a strong blue “Go” bar. Looking at $BAC below we can see that there has been a shift in the technical environment over the past several weeks. Price has emerged out of what looks to be a long basing pattern. GoNoGo Trend is painting strong blue bars now as price bursts through horizontal resistance and volume is heavy after breaking out of a Max GoNoGo Squeeze.
$JEF Sees Strong “Go” Trend Emerge
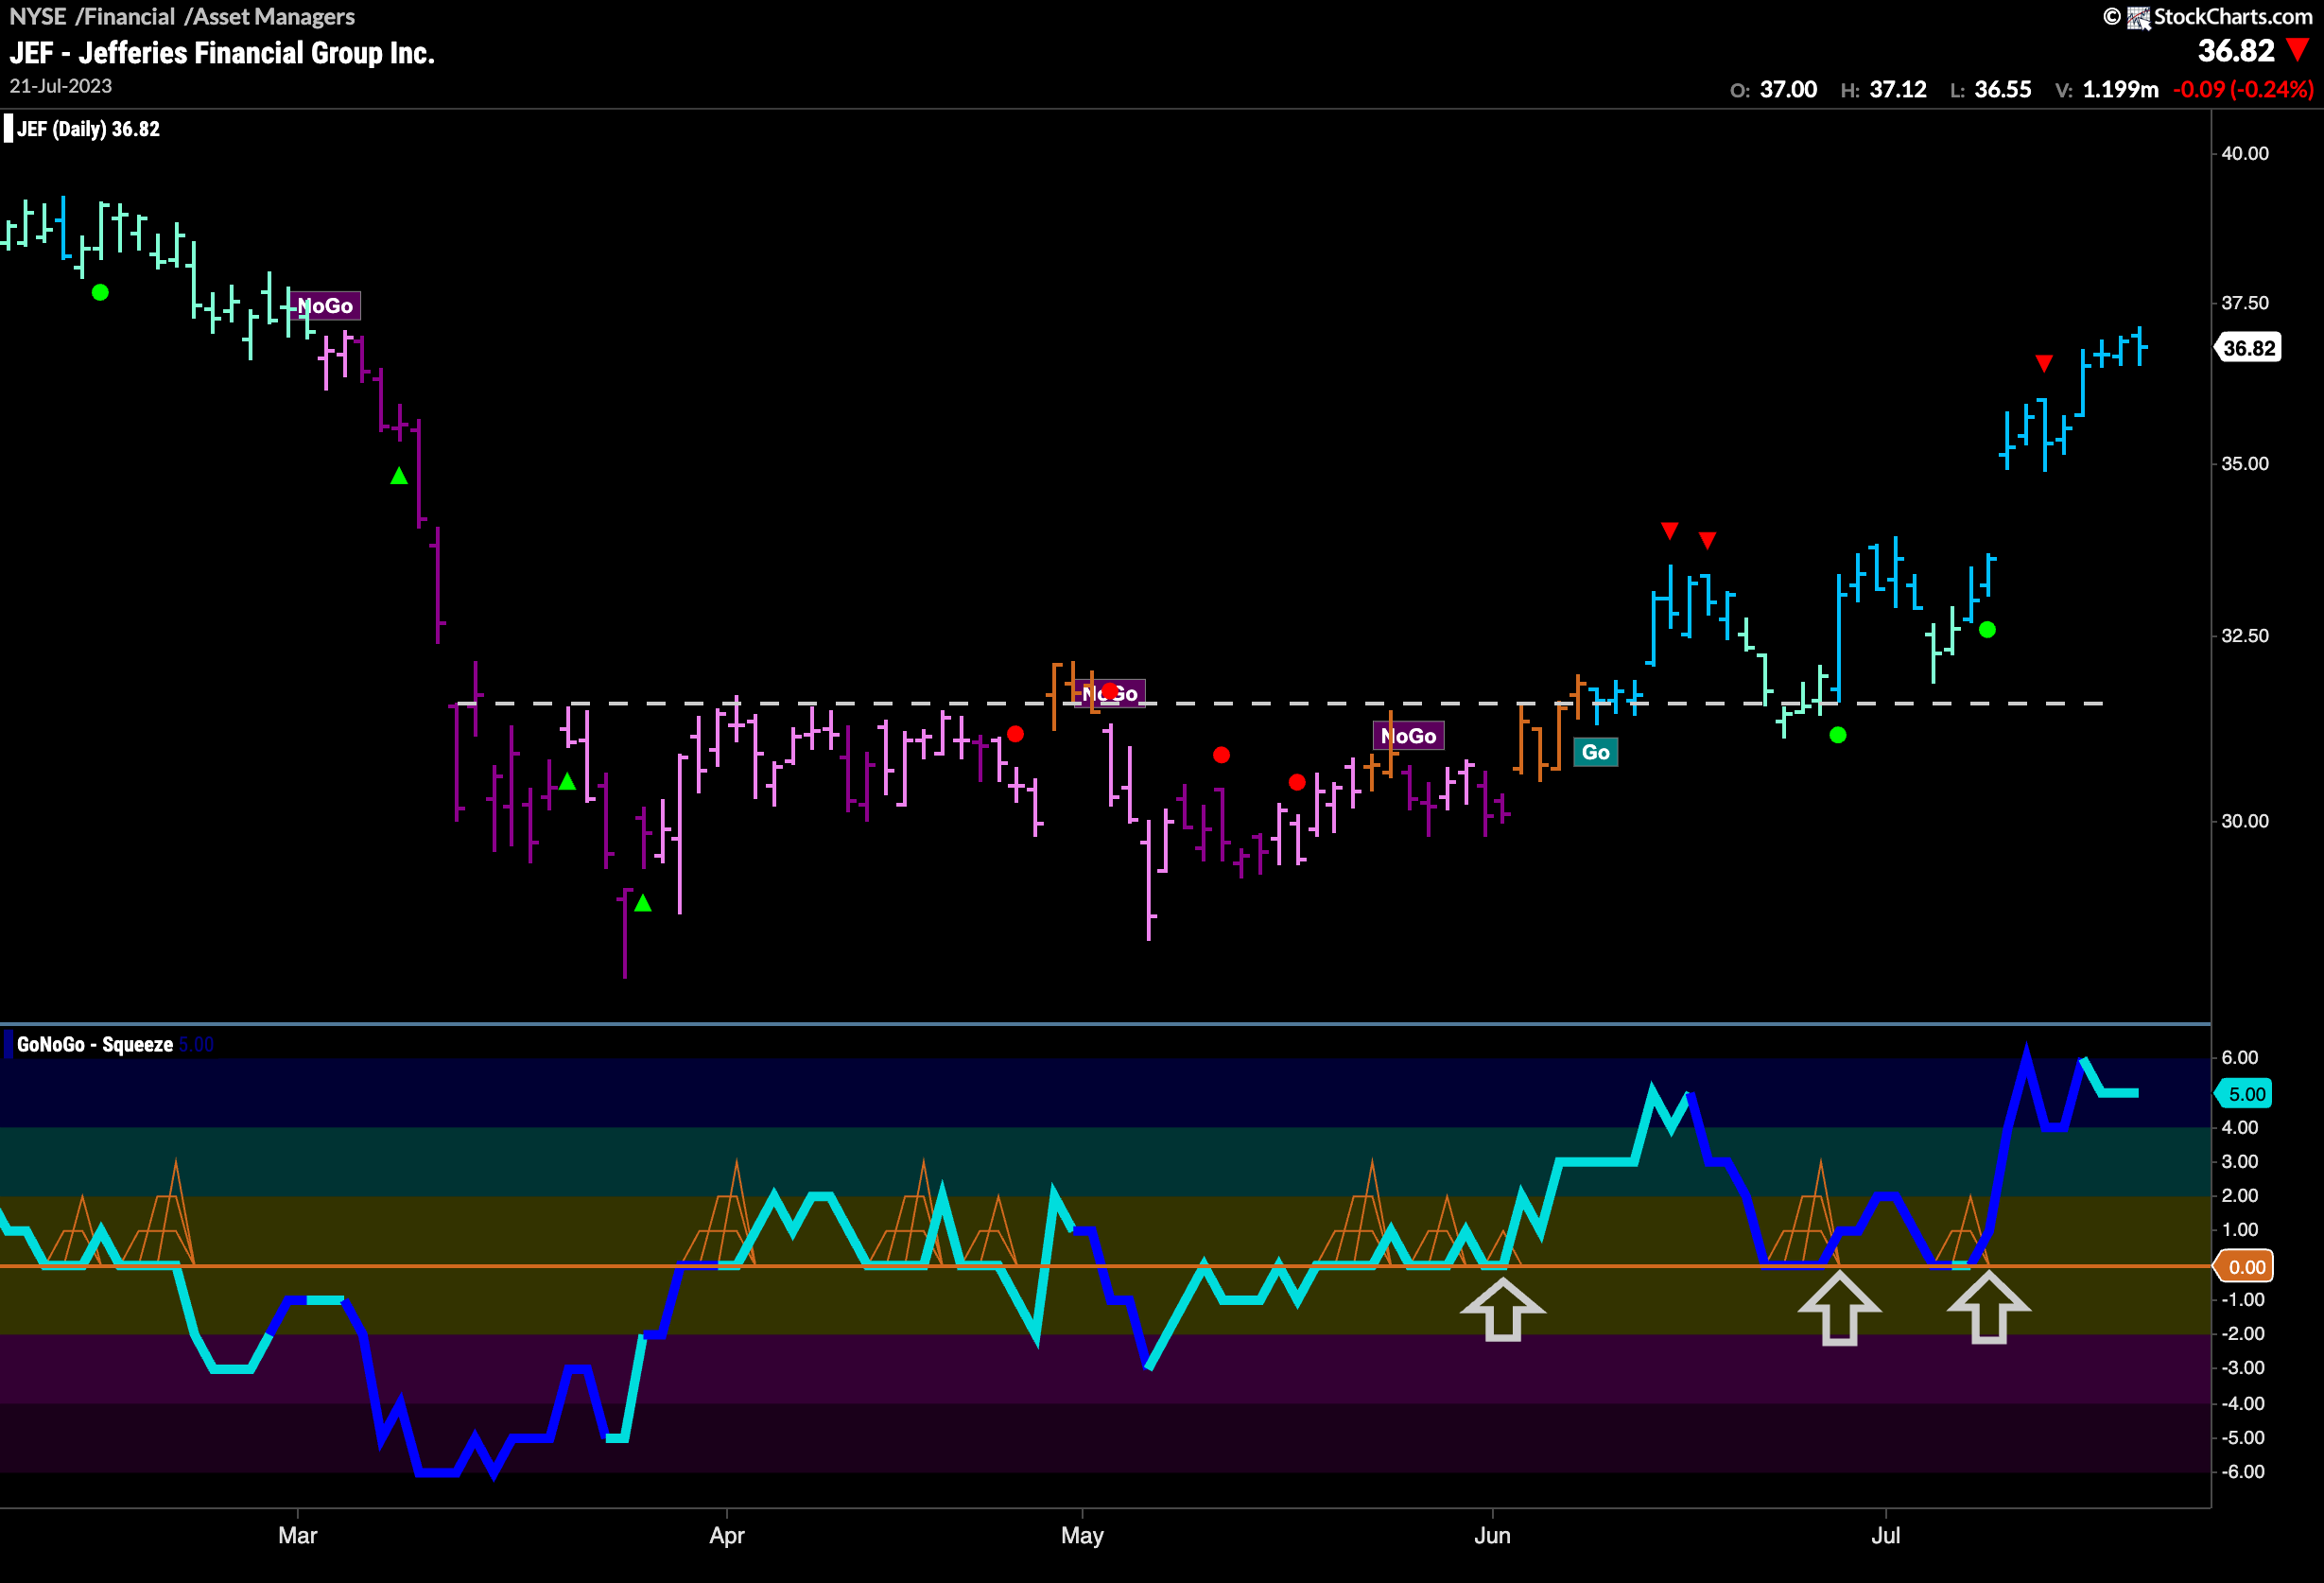
The chart below shows a clean trend reversal. After the “NoGo” trend that saw prices drop sharply we saw months of sideways basing. In June, GoNoGo Oscillator broke through the zero line and started to find support at that level as price tested overhead resistance. When the “Go” trend began it tested support several times. GoNoGo Oscillator continued to find support at zero as volume increased and finally we see higher highs as the “Go” trend goes from strength to strength.
Regional Banks, Really?
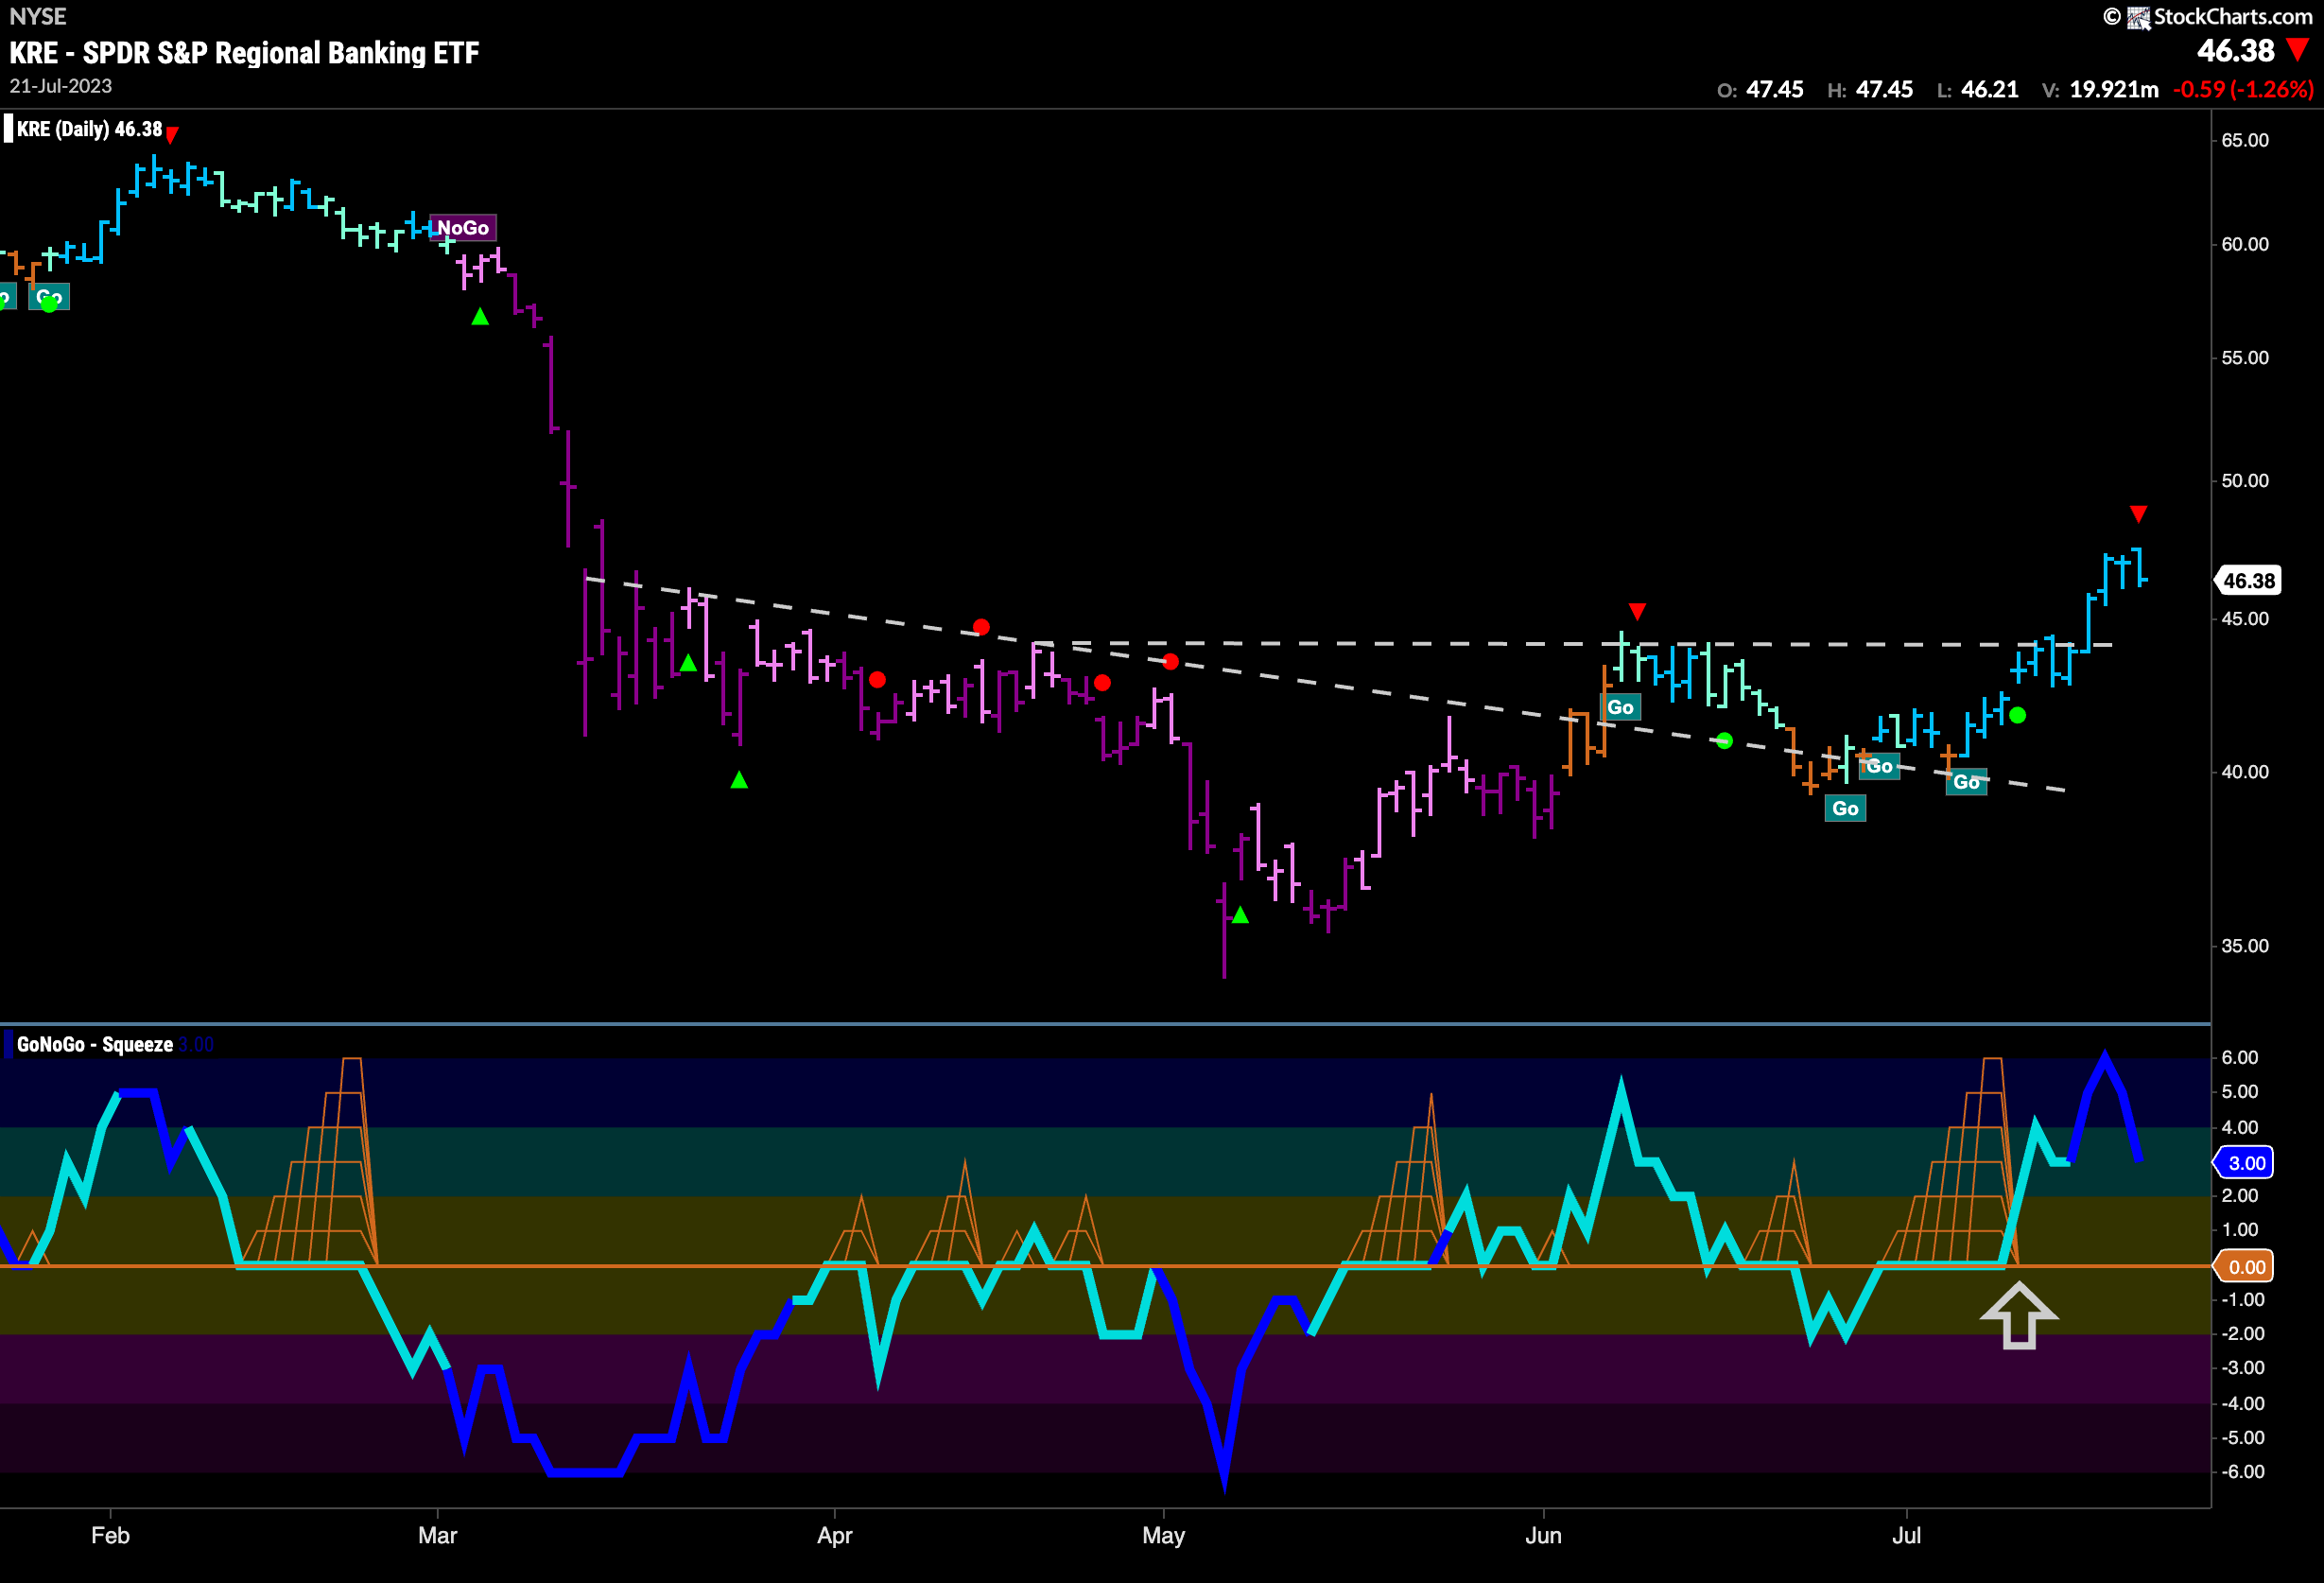
The chart below shows the price chart of $KRE, the regional banking ETF. We see a similar pattern emerge! This is a good sign for the banks. GoNoGo Oscillator broke above the zero line toward the right side of the basing pattern and we saw the “NoGo” trend lose its grip in June. The new “Go” trend struggled with the weight of recent events for a little while and many amber “Go Fish” bars were painted. Finally, after a Max GoNoGo Squeeze was broken to the upside we see price was able to make a new higher high and GoNoGo Trend is painting a string of uninterrupted blue “Go” bars.
