With lumber, copper, and other industrial commodities cooling or correcting last week, the fervor we are hearing about inflation risk and higher yields in US Treasuries may be overplayed. Markets are a leading indicator of the economy, not the other way around. There is a lag between the move and the story. It is often only in hindsight that we find out “why” something happened.
By the time investors new why Enron shares were in freefall, the shares were already worthless. Walter Deemer told me “watch their feet, not their mouths.” And, it seems the Go trends in commodities have all made an incredible run – ahead of the cascade of inflation talk, ahead of the CPI numbers last week, and ahead of the hype.
At the same time that everyone has joined the hunt for inflation, both the US Treasuries and commodities have failed to confirm. Whether it will capsize or not, perhaps this is a signal that the crowd has all shifted to the same side of the boat?
Humans are prone to herd because it is always warmer and safer in the middle
of the herd. Indeed, our brains are wired to make us social animals.
We feel the pain of social exclusion in the same parts of the brain where we
feel real physical pain. So being a contrarian is a little bit like having
your arm broken on a regular basis.    – James Montier
While it is difficult to drown out the noise of the crowd – in fact, we’ve evolved cognitive biases to make sure we stick with the herd –investing should be much more mechanical and much less emotional. This week, even though it hurts, we’ll need to consider that themes are shifting again, potentially in contradiction to what we’ve been hearing through the weekend…
The Risk Off Week, within a Risk-On Market
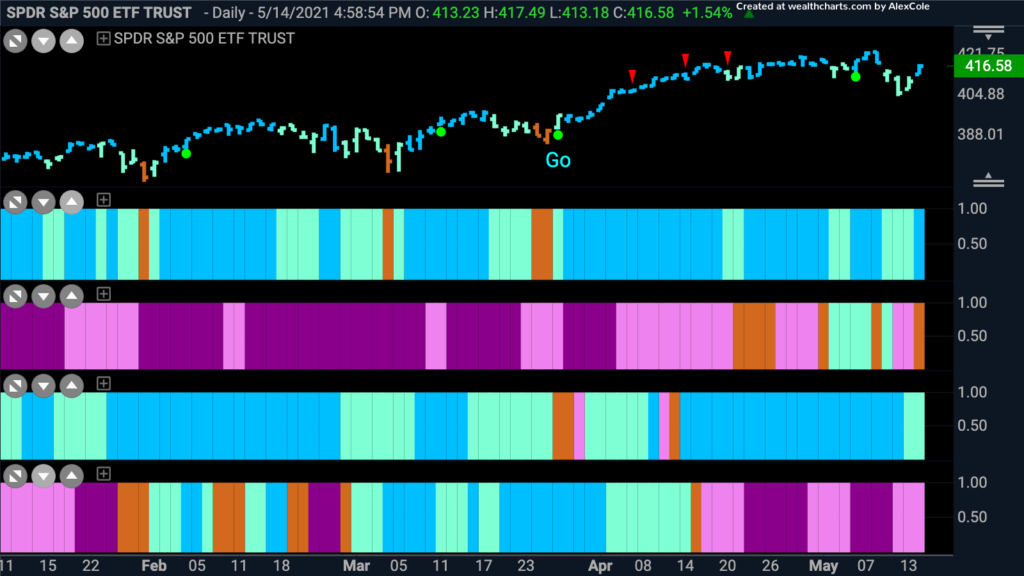
Take a look at the GoNoGo Heat Map below which offers a quick comparison of the major asset classes’ trends. You can see we’re still in a risk-on market generally speaking as equities and commodities are in Go trends while cash and bonds are generally in “NoGo” trends . However, take a look at the 2nd panel. Bond Prices (inverse to yields) popped out of their NoGo and closed last week on an amber bar. If the inflation story were true, we’d see yields soaring and bond prices dropping. That is not the picture below…
Cyclical Sectors… and even some Defensive
For months GoNoGo Research has been harping on the rotation into cyclical sectors. What may seem obvious in the charts is often difficult for many investors to accept. “My FAANG stocks delivered such great return in 2020, I can’t just abandon them?” “But I’ve put so much money in the ARKK ETF, how can it be losing so much?” Unfortunately, the market doesn’t really care what position we took last week, last month, or last year. We need to listen to where it is headed.
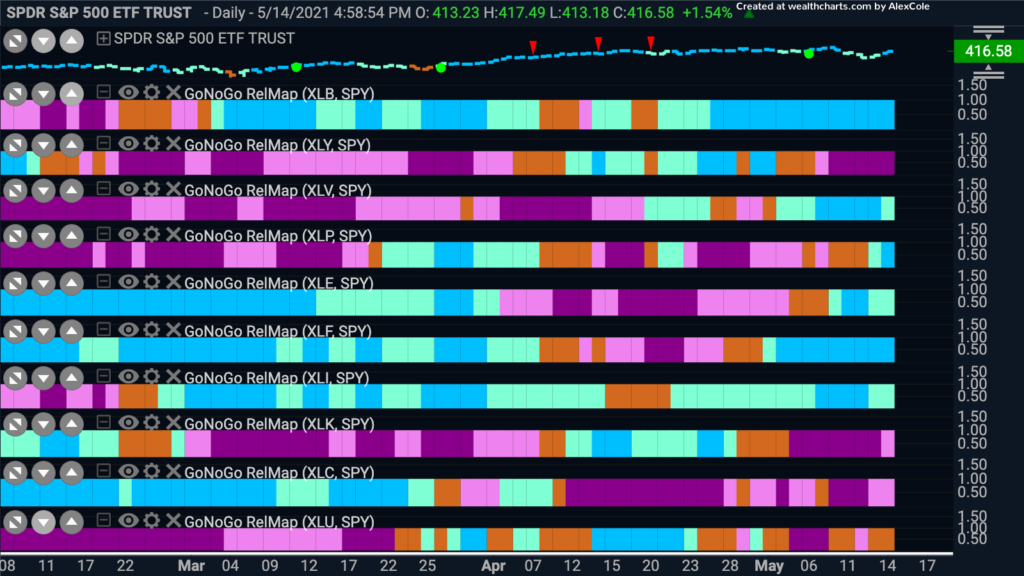
The GoNoGo RelMap below shows leaders and laggards relative to the broad S&P Index. Consistent with the thematic trends of reopening the economy and inflation defensive sectors, we continue to see leadership from $XLB materials, $XLE energy, $XLF financials, $XLI industrials, but notice how $XLV healthcare and $XLP consumer staples have joined the party. Even $XLU utilities are painting mostly neutral amber bands.
The sectors which pulled the broad index lower last week, are those in pink and purple below. Namely, the consumer discretionary $XLY, information technology $XLK, and communications $XLC. These three sectors represent the large-cap growth names that were the darlings of 2020’s rally off the March lows.
Consumer Discretionary Heads Lower
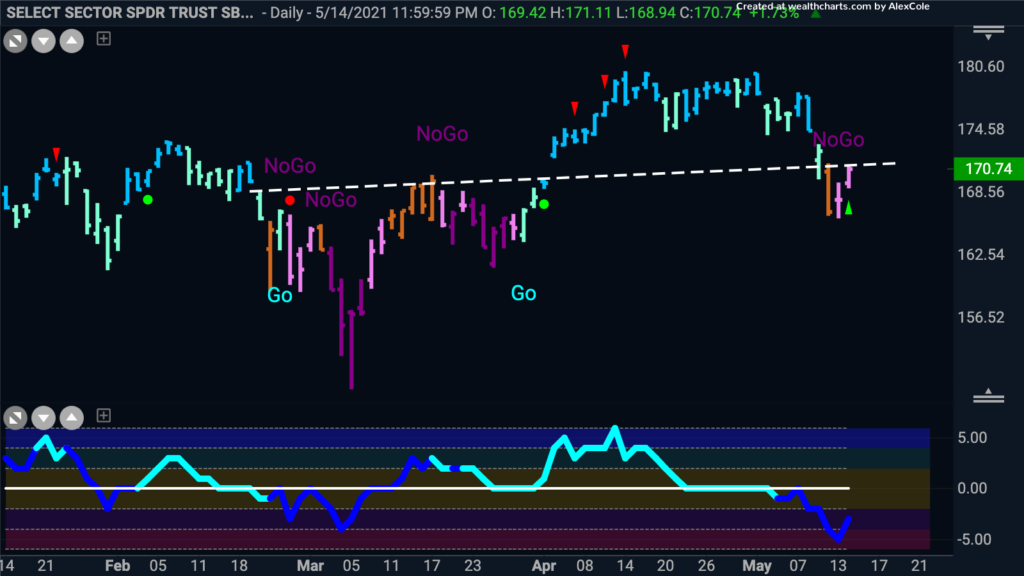
It’s summer in the Northern Hemisphere, time to get your shorts on! The chart below shows the SPDR ETF of the consumer discretionary sector, $XLY. As mentioned above this sector helped drive markets lower this week. Let’s take a look at the daily GoNoGo Chart to see the price action behind the “NoGo” trend.
- As a new “Go” trend rose out of the final days of March it broke above resistance in early April
- After peaking in mid-April, price consolidated sideways, and the GoNoGo Oscillator®
fell to and rode the zero line for some time - When the GoNoGo Oscillator fell into negative territory on heavy volume, it suggested a struggle ahead for price
- GoNoGo Trend® followed by ultimately falling out of the “Go” trend and is now a “NoGo”
- Interestingly, the color change happened as price broke back below the prior resistance level that could have acted as support. Price is now re-testing that level from below
Financials Finally Free to Fly
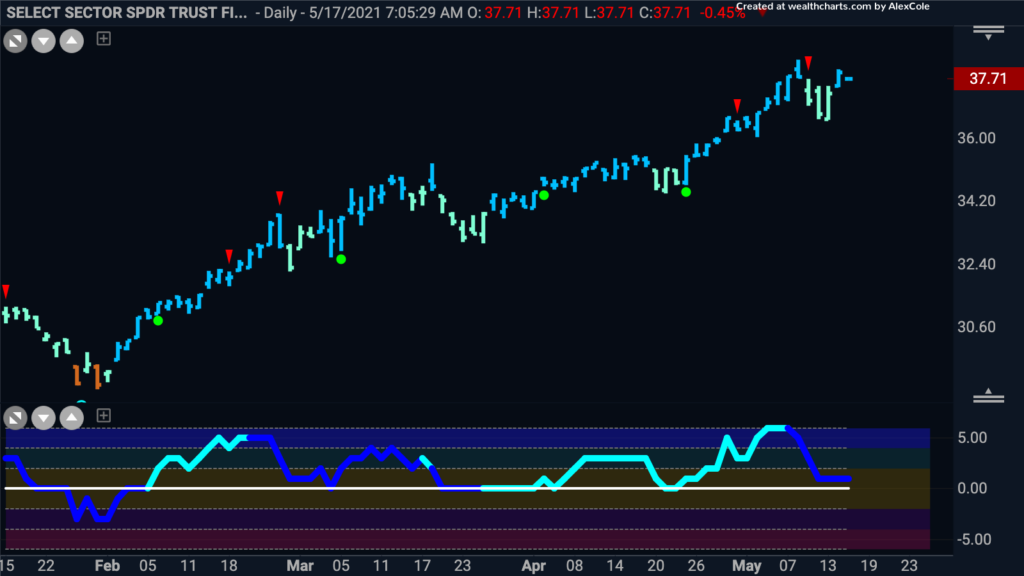
In February 2009, Bank of America shares hit an all-time low of $2.53. Investors have been anchored to the pain of loss since the great financial crisis, and the pace of recovery has been glacial. In fact, the “Go” trend pictured below is the entire picture of the $XLF trading above the 2007 highs.
Below is the daily GoNoGo Chart of $XLF showing the financials sector continuing to march higher at all-time highs without overhead supply
- The “Go” trend is in place and has been uninterrupted since the two amber “Go Fish” bars in early February
- Throughout this run above the 2007 highs, the trend has been supported with the GoNoGo Oscillator holding the zero line as price pulls back with paler aqua bars
- Most recently, price fell after a short term countertrend correction (red arrow) appeared near the recent high
- This was highlighted by aqua “Go” bars and caused the GoNoGo Oscillator to fall close to zero
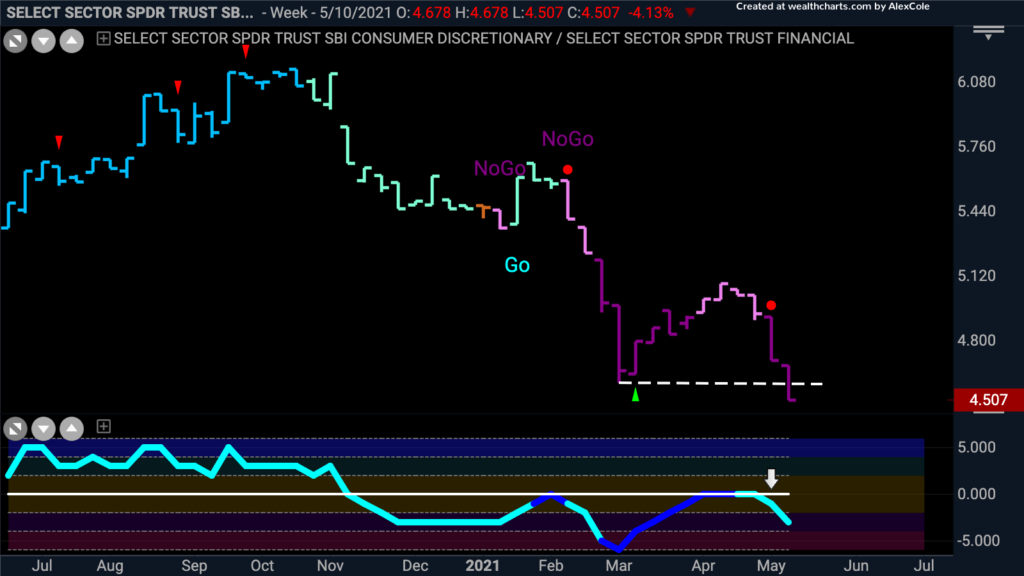
Weekly Relative Ratio $XLC/XLF
While the financial sector breakout to all-time highs is quite fresh (feb 2021) the relative strength of cyclicals to discretionary stocks is not new. The weekly ratio of consumer discretionary to financials below shows that consumer discretionary began underperforming as early as November. GoNoGo Trend and Oscillator highlight the long-term strength of this relationship of consumer discretionary underperformance relative to financials.
- The “NoGo” trend has been in place since early this year, meaning that consumer discretionary is underperforming financials
- The GoNoGo Oscillator led the trend change by breaking below zero late last year and has stayed in negative territory finding resistance at the zero line since
- On last week’s price bar, the ratio has set a new lower low, confirming the low risk “NoGo” trend re-entry signal that appeared above the price bar the week before
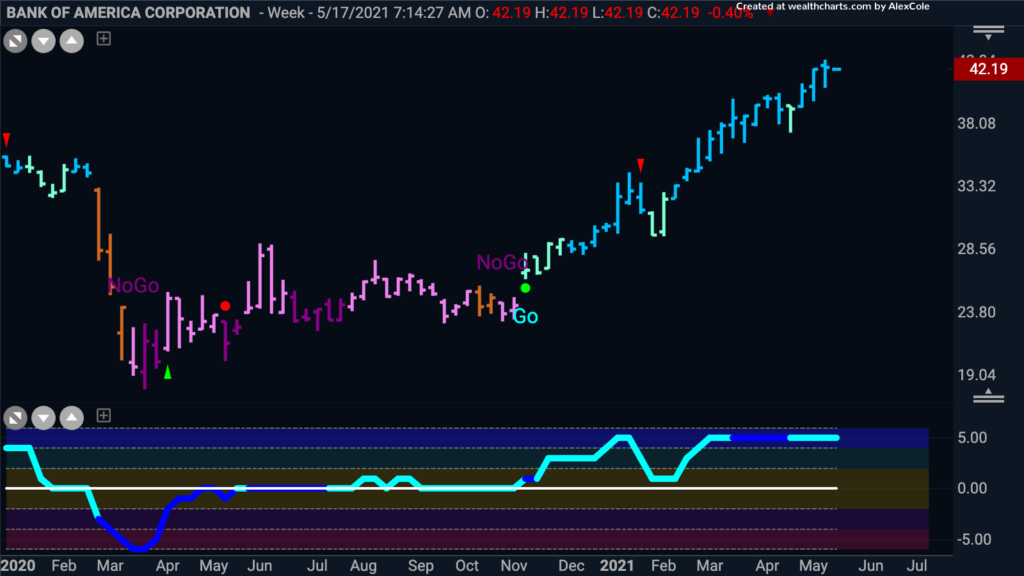
Banking on $BAC – Multiple Timeframe Approach
With the financials sector in a strong “Go” trend and outperforming the benchmark on a relative basis, let’s take a look again at Bank of America to see just how far we’ve come since the GFC.
- The weekly “Go” trend is very strong, with GoNoGo Trend painting bright blue bars
- GoNoGo Oscillator continues to be elevated and overbought, showing continued positive momentum
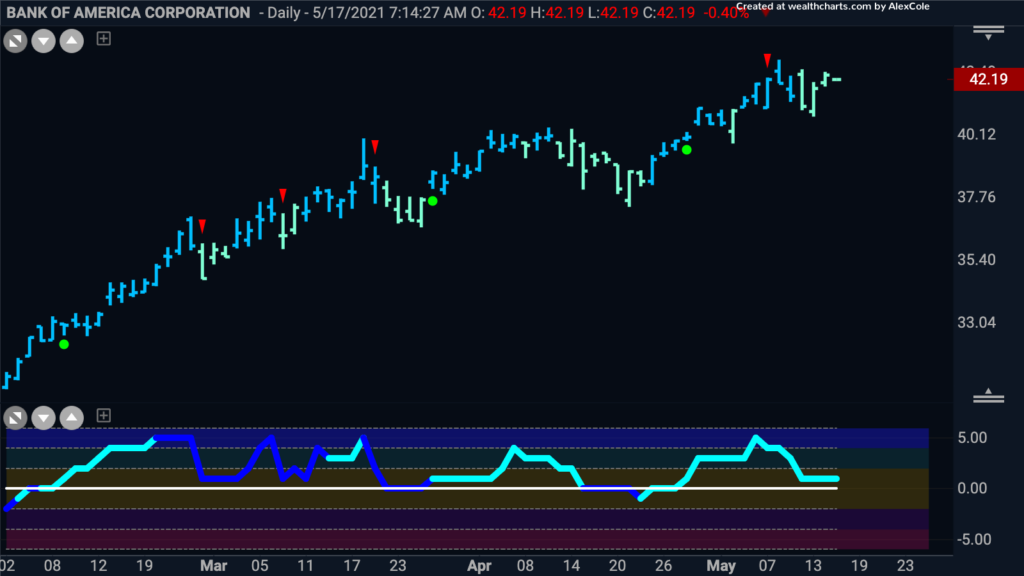
Drilling down into a daily GoNoGo Chart we see trend conditions are still favorable.
- GoNoGo “Go” trend is in place for $BAC and has been uninterrupted for months
- A short term countertrend correction red arrow indicated the likelihood of the small pullback we have seen over the past week
- This has caused the GoNoGo Oscillator to fall close to zero, and we will look to see if will rally from here
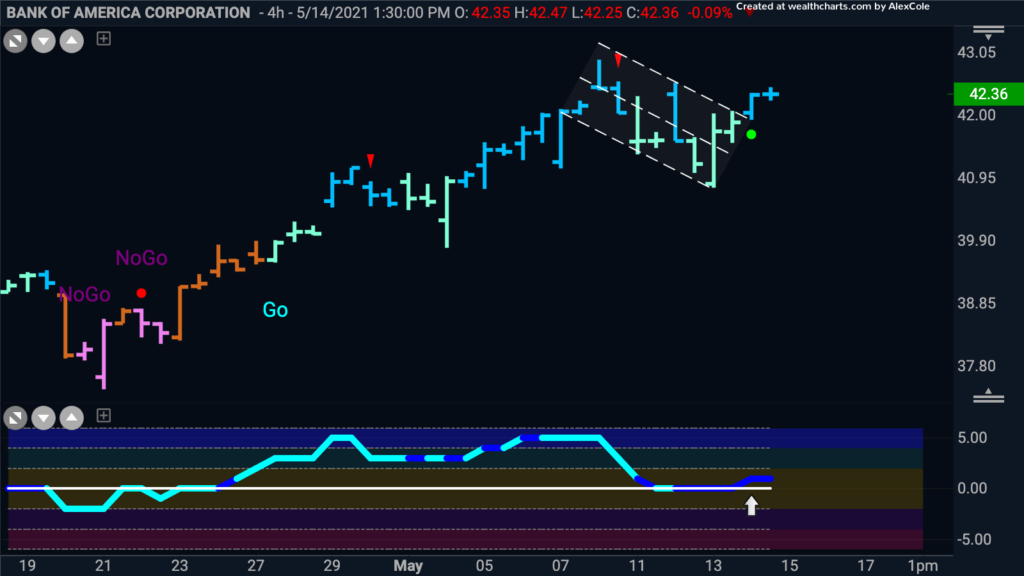
If we wanted to take a long position in Bank of America based on the longer-term trends that we see in place we can go to a lower time frame to assess potential entry. The chart below is a GoNoGo chart using 4hr prices.
- A “Go” trend is in place and after a strong rally has pulled back as highlighted by the downward sloping trend channel
- This caused GoNoGo Oscillator to fall to zero during that correction
- GoNoGo Oscillator rallied off the zero line and that triggered a low-risk trend continuation green circle to appear under the penultimate price bar
- As price breaks out we will look to see if it can surpass the prior high
Etsy in trouble
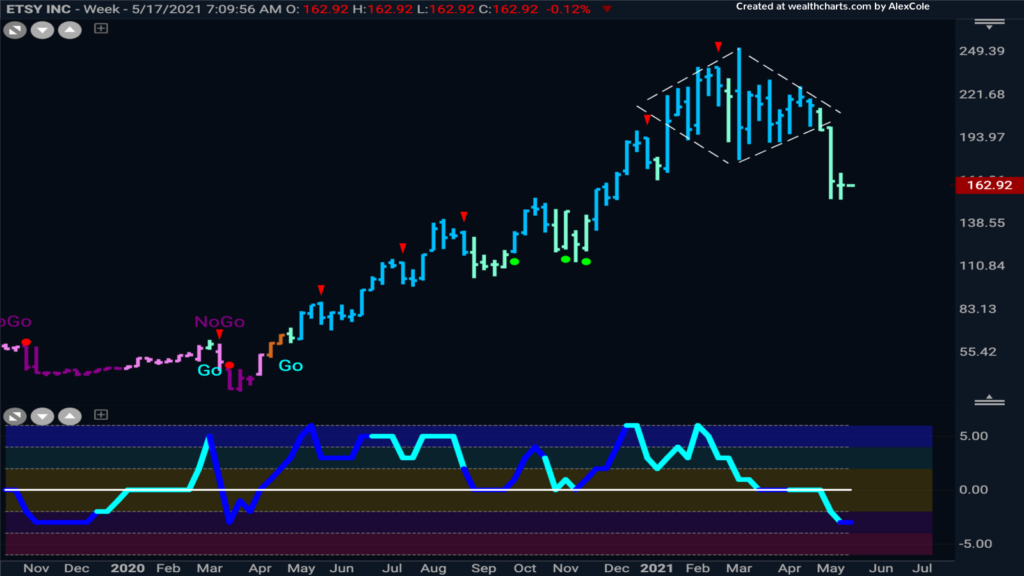
The weekly GoNoGo Chart below of $ETSY, an e-commerce company that is a fast-growing consumer discretionary stock, depicts a great run-up in price over the past year. Can this continue?
- The diamond pattern annotated on the chart is quite rare – depicting a shift in the balance of supply and demand. Traditionally, such price behavior has very bearish implications
- The GoNoGo Oscillator broke below the zero line toward the end of the pattern signaling trouble ahead
- From a measured move using the height of the pattern, a minimum target for the drop is around $131
- This target level falls in line with the congestion area from the fall of 2020 and shows there is still room for price to go down
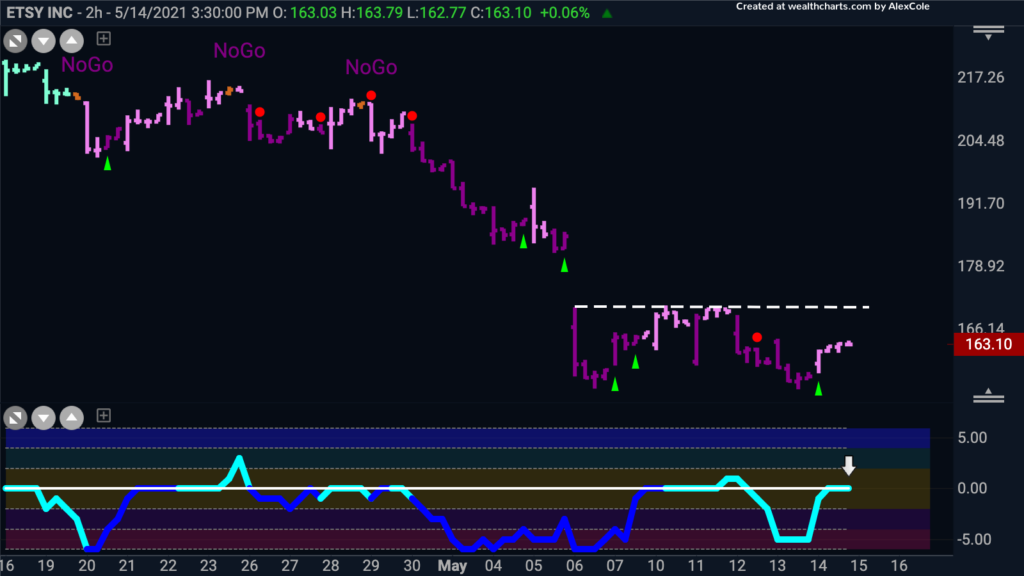
If we jump into a much smaller time frame chart, in this case a 2hr, we can get a sense of whether we can find a good entry on the shorter time frame chart.
- The 2 hr chart shows a strong “NoGo” trend with price gapping lower a week ago
- This gap level served as powerful resistance and we will look to see if price rallies up to it again whether it struggles once again
- The GoNoGo Oscillator is at the zero line, so as price continues to consolidate against the “NoGo” trend (higher) we will watch to see if the zero line acts as resistance
- If this happens, in conjunction with the resistance we see on the chart from the gap, we would see a strong re-entry point into the NoGo trend.
Defense is warming up, if not already on the field
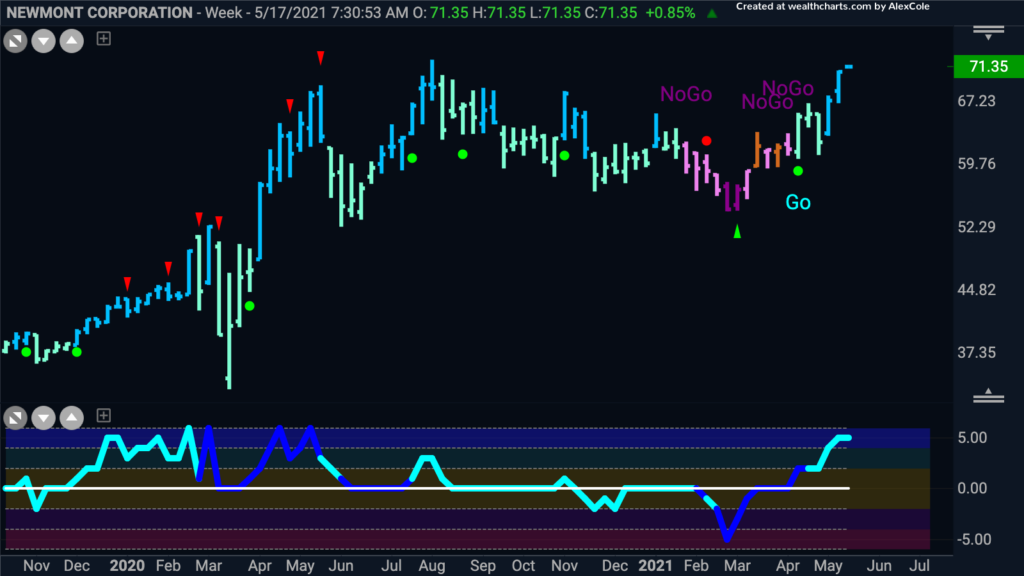
It’s been a choppy year, the S&P has ground higher despite numerous challenges. Combining the price action we have seen recently, with the emergence of defensive sectors on a relative basis, and the seasonal headwinds that historically sandbag market performance over the summer months, perhaps we can look at long opportunities in defensive areas.
Many analysts have been talking about the Gold trade as an opportunity to defend against inflation risk, or the potential move by investors toward a safe-haven store of value. Across the board, precious metals such as Gold, Silver and Platinum are entering or re-entering “Go” trends. If gold is catching a bid after months of underperformance, then gold miners are the equities to help capture that trend. See the chart below of Newmont Corporation $NEM that just posted its highest weekly close since 1987 with an extremely overbought reading on GoNoGo Oscillator. Bullish or bearish?
