
As the first month of the new year draws to a close with today’s trading session, we can see trends have shifted in many stocks, sectors, and assets. This week we will highlight several trends on longer-term charts to find perspective after a volatile first month of the year.
The top-down approach will drill all the way down to individual equities. Several blue-chip US equities emerged from Q4 reporting as leaders with “go” trends intact. From a longer view, GoNoGo Charts will show the commodities rally that has strengthened in 2022, is truly just getting started. Welcome to your weekly edition of Flight Path from GoNoGo Research.
Investors Flight to Quality
Last week’s trading included nearly 5% ranges each day as volatile intraday swings left markets slightly ahead of where they started Monday. Since the start of the year, assets have been flowing out of risk assets and into pockets of the market that provide a store of value. Look at the ratio of the Dow Jones Industrial Average to the Nasdaq 100 $DIA/QQQ which illustrates the relative outperformance of capital-intensive companies to their growth-oriented peers:

This leadership of the DJIA is counter to the longer-term relative performance. If we consider the same chart on a weekly basis, we can see the long-term bias is to the downside – meaning growth equities have largely outperformed the past two years. Notice the October period in the weekly chart below merely registered a weaker “NoGo” trend in pink bars, but showed a brief “Go” for the Dow Jones relative to Nasdaq based on daily bars. The current strength in the daily remained amber neutral from a weekly trend condition perspective through last week’s close:

There’s no more ice in the punch bowl
There is no story more overanalyzed or overplayed than that of Central Bank policy. The fact that there remained no rate hike last week is a signal itself. Markets remain in heightened anticipation about the future changes to Fed policy. The common analogy is that the Fed will “take away the punch bowl” – implying that accommodative monetary policy has fueled the market rally for more than a decade. It’s safe to say, they stopped putting ice in the bowl last year and most of the cool kids have already left this party. It’s just the really drunk folks still participating in highly speculative sectors of the market (crypto, SPACs, high multiple growth equities) drinking that warm punch while the DJ gets to some deep cuts… The point is that investors can ignore Price at their own risk. All of the indulgent areas of the market have fallen and continuing to hold them through “NoGo” trends is not responsible investing.
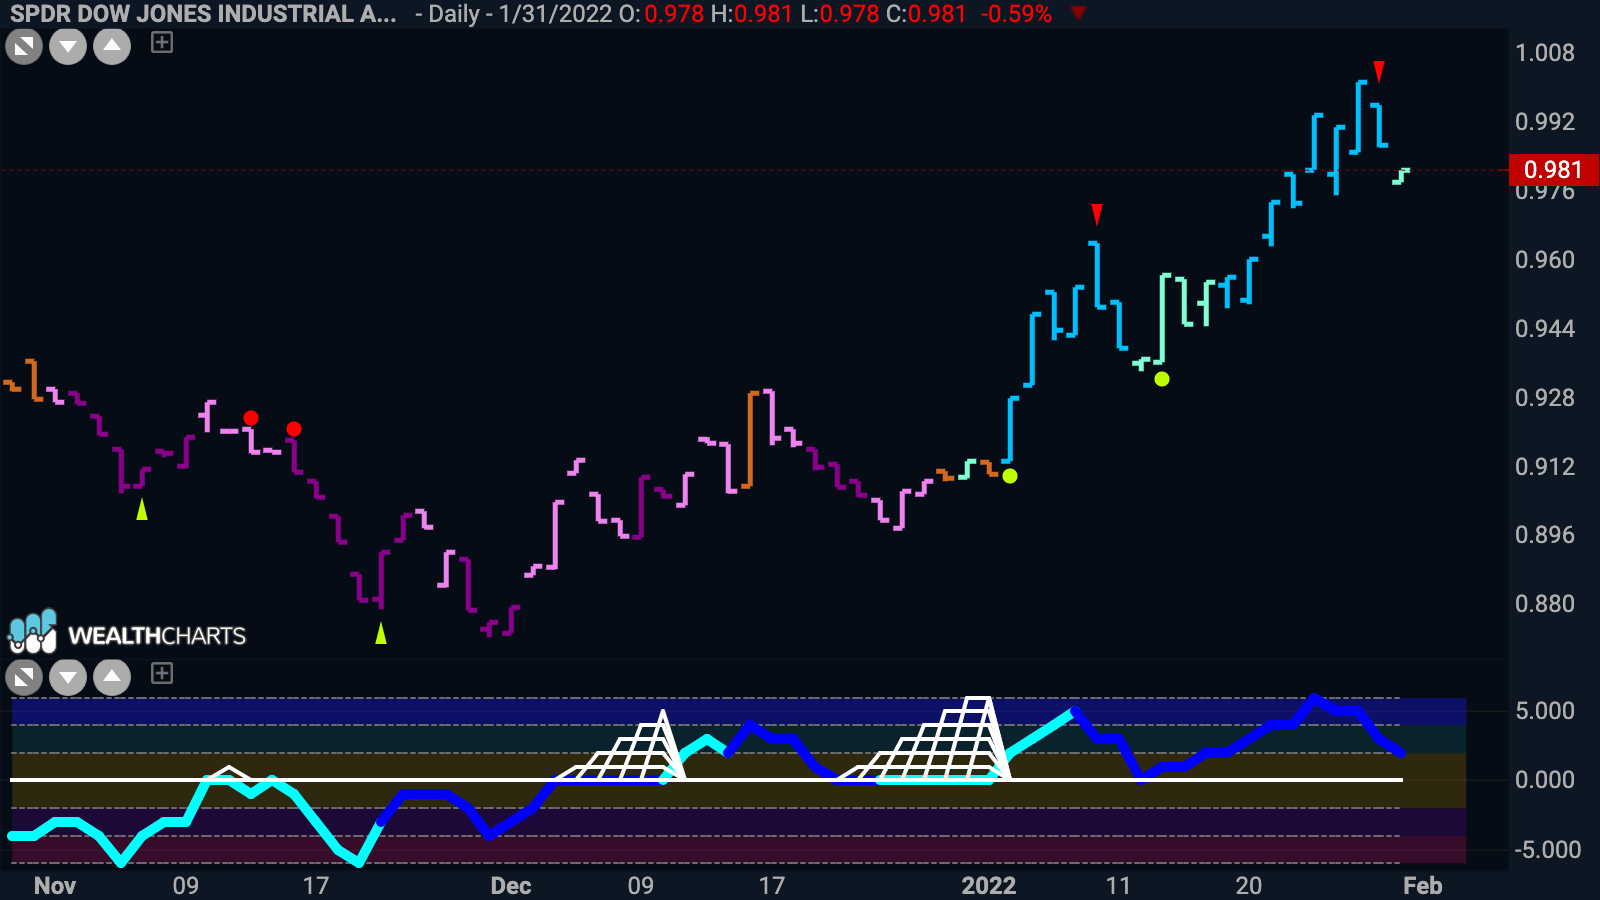
Selling Short Bonds – Rising 2yr Rates
Chairman Powell and the FOMC met Tuesday and Wednesday to discuss the strength of the US Economy and the need to respond to high inflation risks. Accordingly, the 2-yr yield rose 18 basis points to 1.17%, and the U.S. Dollar Index rose 1.7% to 97.24 in anticipation of five rate hikes beginning in March. See the sharp selloff on Wednesday in 1-3 year notes (remember, prices move inverse to rates) represented below by $SHY, a 1-3 yr Treasury Bond ETF:

Ending the week on a strong “NoGo” with extremely oversold momentum on heavy volume. That is enthusiastic selling pressure driving short rates much higher.
Dollar Strength
Corresponding to the anticipation of a hawkish fed, institutional investors were raising cash in portfolios while the rest of the globe may have renewed faith in the US Governments opposition to inflation. Check out the rally in the US Dollar index breaking above downward sloping resistance levels as it ended last week on strong “Go” trend conditions (blue bar):

Sectors to Watch
On a relative basis, six of the 11 S&P 500 sectors trended higher against the benchmark. The GoNoGo Sector Relmap below removes all of the intraday volatility in price action. The overall trend conditions – a composite blend of the most widely used and quantifiable technical indicators – are represented in 5 colors from most bearish purple through neutral amber to most bullish in blue.
- 6 sectors outperformed the broad S&P 500 Index to end this week
- $XLV, $XLP, $XLE, $XLF, $XLI, and $XLU are painting “Go” bars
- Technology, communications, and discretionary are in NoGo trends

Fueling the Rally
There is always a bull market somewhere… The energy sector stood out again last week with a 5% gain as oil futures flirted with $89 per barrel. See the GoNoGo Chart of oil futures which shows the rally into a “Go” trend at the start of the year:

When we step back to the weekly view, we can see how prices responded negatively in November to the outbreak of the omicron variant, but have rallied higher as the severity of public health lockdowns have been muted and energy consumption has remained high:

Inflation Hedge and Long-term Commodities Cycles
Commodities and real assets have been inflation-resistant over historical market cycles. Many investors expected Gold to perform well in this environment, but that has simply drifted lower for more than a year. However, there are many other ways for investors to capture gains through diversified commodities exposure without the risk of too much concentration in the energy space. see the chart below of $DBA, an ETF with diverse exposure to agricultural commodities:

GoNoGo Research has been writing about agricultural commodities since the pandemic crash in 2020, but when we step back to this multi-year view with monthly bars, we can see that the “Go” trend is just getting started. Commodities peaked in 2008 but have been steadily declining since 2011 as pension funds spent years unwinding their exposure. The chart above shows the strongest blue trend conditions and momentum has sustained extremely positive levels on heavy volume. The primary trend is extremely bullish.
Leaders (survivors) Emerge from the Volatility
As many institutional investors are measured against a benchmark rather than absolute returns, it is helpful to think about “winning by not losing.” Ned Davis Research reported on the percentage of Nasdaq stocks more than 50% down from their 52-week highs. By the end of last week, that destruction below the surface of the index had increased. The indexes are after all, not the stock market, they represent a market of stocks. When looking at breadth of the performance of the average security in the index the view becomes as dark as the last season of Ozark! So, when investors direct assets towards specific companies amid a highly volatile month, we can use that to our advantage. Below are several blue-chip companies that posted decent gains amid the heightened market volatility last week.
The chart below of American Express Company $AXP shows plenty of chop. Generally, financials have performed well in rising rate environments, but the enthusiastic buying of Amex shares upon their reporting of fourth quarter earnings is telling. Companies like Netflix and Tesla also beat earnings but fell. Hard. What the market knows about the fundamentals of American Express is not of our concern, we can simply see that major reversal Monday and Tuesday, the shift to strong “Go” conditions, GoNoGo Oscillator rallying right through the zero line into positive territory, and investors buying $AXP with heavy volume. American Express is not a perfect chart, but those stocks that emerge from the carnage in “Go” trends have a higher probability of leading through the next period. Winning, by not losing

As GoNoGo Research has shared since the start of the year, assets have been flowing out of risk assets and into pockets of the market that provide a store of value. Capital-intensive companies such as oil and gas exploration, drilling, and refinery have become attractive to investors, but so have recession-resistant sectors such as grocery, CPG, and other consumer staples which are catching the bid. See the chart of Johnson & Johnson Co below. Similar to Amex, $JNJ reported earnings and rallied sharply higher last week as GoNoGo Oscillator rallied to the zero line from below on heavy volume.

What Tech Names Do You Like? (asking for a friend)
If you must have some growth equity exposure, or you want to keep a toehold in the technology sector, there are leaders within that beaten-down space. Namely, Apple Inc. Shares of $AAPL traded higher upon Q4 earnings reporting last week and led Friday’s rally. From a trend perspective, the conditions are neutral – painting “GoFish” bars. GoNoGo Oscillator rallied to the zero line from below on heavy volume, but has not broken positive. If it does, we could see the trend for daily price action reverse the recent “NoGo.”

When trades are at this critical decision point, as is the case for $AAPL, it helps to step back and look at the primary trend. Another mega-cap tech giant that performed well last week was $MSFT, but the consistency of $AAPL in the longer-term trend makes this a better holding. Notice, that on the weekly basis, GoNoGo Trend has yet to break down from the “Go” conditions. The trend has been uninterrupted since 2020, and we currently see GoNoGo Oscillator finding support at the zero line.

Better Charts. Better Decisions.


